pathways onto (and off) disability benefits: assessing the ... · pathways onto (and off)...
TRANSCRIPT

ISBN 978-92-64-06791-2
OECD Employment Outlook 2009
Tackling the Jobs Crisis
© OECD 2009
211
Chapter 4
Pathways onto (and off)Disability Benefits: Assessing the Role of Policy and Individual Circumstances
This chapter presents new evidence on the role of personal and work-related factorsfor the entry to disability benefits and on policy developments in the area of sicknessand disability across OECD countries. Disability benefit recipiency rates haveincreased most rapidly for women, young adults and individuals with mental healthproblems. However, the longitudinal analysis for individuals in four countriessuggests that the probability to enter a disability benefit following an adversehealth shock is only marginally higher for women and young adults than for othergroups. Marked cross-country differences in the estimated results underlie to theimportance of taking a closer look at how national disability policies differ. Indeed,new OECD indicators of disability policy reveal a wide diversity in both thegenerosity aspect and the employment integration component of disability policy. Atthe same time, most countries have tightened access to benefits in the last decadewhile improving employment integration. This is a promising development becausethe chapter’s analysis reveals that a more generous disability policy is associatedwith higher numbers of beneficiaries while more comprehensive employment andrehabilitation programmes are associated with lower recipiency rates.
4. PATHWAYS ONTO (AND OFF) DISABILITY BENEFITS: ASSESSING THE ROLE OF POLICY AND INDIVIDUAL CIRCUMSTANCES
OECD EMPLOYMENT OUTLOOK 2009 – ISBN 978-92-64-06791-2 – © OECD 2009212
IntroductionToo many workers leave the labour market permanently due to health problems.
Indeed, expenditures on disability programmes in many OECD countries far exceed
expenditures on other income-replacement programmes for working-age persons (such as
unemployment benefits). In most countries, very little is known about the pathway leading
from illness or accidents to long-term disability benefits. Similarly, little is known about
the most typical routes off disability benefits (i.e. transitions back to work or on to other
benefits), although evidence suggests that very few disability benefit recipients ever return
to the labour market, even if they have a significant remaining work-capacity. In order to
devise adequate policy responses to lower disability benefit caseloads, it is important to
learn more about the factors that affect flows into, and out of, these benefits.
Explanations for the growing inflows into disability benefits have focused on how
incentive structures within the welfare system may have created moral hazard issues.
Benefit systems, through the combination of high generosity of benefits and lack of
monitoring, may have eroded the willingness to work of individuals with health problems
but with remaining work capacity (Marin et al., 2004). In the past two decades, many OECD
countries have enacted reforms addressing the incentive structure of the benefit system.
But the success of the reforms in reducing both inflows and stocks of disability
beneficiaries has been very different across countries.
There is only limited knowledge of how the characteristics of individuals who apply for
disability benefits after an adverse health shock differ from those of persons who apply for
other benefits or stay in employment. In this context, the aim of this chapter is two-fold: i) to
analyse the characteristics of disability beneficiaries, and the different pathways onto and
off benefit recipiency; and ii) to assess the responsiveness of disability benefit recipiency to
economic conditions and policy changes in OECD countries. For that purpose the chapter
uses two different types of data: i) micro-panel data, which allow for a better understanding
of the impact of health status on the probability of receiving a disability benefit and how
other personal and work-related characteristics reinforce or weaken this impact; and
ii) aggregate data on beneficiaries to capture trends over time and differences across
countries in recipiency rates. Although individual-level panel data are available for only four
countries (Australia, Germany, Switzerland and the United Kingdom), these countries are
sufficiently diverse in terms of labour market conditions and their disability benefit-systems
to provide a good overview of the complex interactions of different factors.
The chapter is organised as follows. Section 1 documents the rise in disability
recipiency in most OECD countries. Section 2 estimates the effect of individual
characteristics on the probability of receiving disability benefits and on staying in
employment after experiencing health problems. Section 3 provides a picture of the
different pathways in and out of benefits. Finally, Section 4 describes recent disability
policy changes across OECD countries and makes an attempt at assessing their effect on
disability rolls, while controlling for economic conditions and other policy factors.

4. PATHWAYS ONTO (AND OFF) DISABILITY BENEFITS: ASSESSING THE ROLE OF POLICY AND INDIVIDUAL CIRCUMSTANCES
OECD EMPLOYMENT OUTLOOK 2009 – ISBN 978-92-64-06791-2 – © OECD 2009 213
A concluding section discusses the implications of the empirical analysis for labour
market, health and social security policies and indicates the main policy challenges.
Main findings● The share of disability beneficiaries in the working-age population has increased over the past two
decades in a large number of OECD countries. Beneficiaries tend to be concentrated among certain
socio-demographic groups:
❖ Increases in beneficiary rates have been more pronounced among women, relatively
younger age-groups, the low-skilled and individuals with mental and psychological
problems.
❖ Among individuals with prior work experience, disability beneficiaries also tend to be
overrepresented among manual occupations, particularly low and semi-skilled
production jobs, and non-standard employment.
● Not surprisingly, an adverse health shock is often a key driver of the transition to disability. But
certain groups face a higher probability to enter a disability benefit spell or a lower probability to
stay in employment after experiencing health problems. The groups most prone to enter
disability schemes or exit employment differ somewhat across the four countries
analysed, pointing to possible country-specific differences in individual determinants
and also features of the disability benefit system:
❖ The effect of health problems on the probability of entering disability benefit varies by
age group and income. Women and young individuals suffer from a stronger than
average impact of health shocks in some countries only, providing only a partial
explanation for the recent rise of beneficiaries among these groups.
❖ Similarly, the chances of remaining in employment after health problems are influenced
by industry, occupation, working hours and the type of employment contract. For
example, individuals having temporary contracts and working less than full-time hours
are less likely to be employed once health shocks are taken into account.
● Pathways onto disability benefits, persistence in disability benefits and outflow routes vary
greatly across countries. Such variation points to cross-country differences in the labour
market opportunities available to individuals suffering from health problems but also to
differences in disability benefit systems, including labour market integration
programmes for recipients.
● The main trend in disability policy across OECD countries in the past two decades has been to
tighten access to benefits and to increase integration opportunities of people with disabilities
through widening employment programmes and enhancing employment protection for
workers with partial disabilities.
● However, the generosity of disability benefits and the associated employment integration
measures vary significantly across OECD countries. On average, the Nordic countries and
Switzerland offer the most generous compensation policies to persons with disabilities.
The division across countries in terms of employment integration policies is less clear-cut
and has changed more over time.
● Disability policies influence significantly the share of disability recipients. More generous
disability and sickness benefits and easier access to benefits tend to be associated with
higher disability beneficiary rates. At the same time, employment and rehabilitation
programmes reduce disability benefit rates.
4. PATHWAYS ONTO (AND OFF) DISABILITY BENEFITS: ASSESSING THE ROLE OF POLICY AND INDIVIDUAL CIRCUMSTANCES
OECD EMPLOYMENT OUTLOOK 2009 – ISBN 978-92-64-06791-2 – © OECD 2009214
1. Disability benefit trends: evolution and recipients’ characteristics
1.1. Disability trends
In the OECD countries, the share of the working-age population relying on disability
benefits1 as their main source of income has increased only moderately since 1990
(Figure 4.1). On average, about 6% of the working age population was on disability benefits
in 2007 compared with 5% in 1990. The small increase in the OECD average masks
substantial differences across countries with large increases in a number of countries but
also significant falls in a few countries. Disability recipient rates range from as high as 10%
or 12% in Norway and Hungary to below 1% in Turkey and Mexico in 2007. Nordic countries
(Denmark, Finland, Norway and Sweden) and the Netherlands together with some central
European countries (Hungary, Poland and the Czech Republic) have the highest recipiency
rates within the OECD area. Finland and the Netherlands have experienced a decrease
since 1990 while the United Kingdom, Sweden and Norway showed a marked increase.
Men are more likely to receive a disability benefit than women in a majority of
countries but the highest growth in recipiency has occurred among women. Women’s
lower rates are partially driven by insufficient contributions to benefit systems which are
contributions-based. In countries where schemes are universal such as Denmark, Norway
and Sweden as opposed to linked to previous employment-related contributions, disability
recipiency rates are much higher for women. In addition, countries having recorded large
increases in disability benefit recipiency rates show a much larger growth among women.
In Australia, the growth in female recipiency rates was more than 4 times as high as for
male recipients and in Belgium female rates have doubled while those for men have
decreased since 1990.
Similarly, while disability recipiency rates are highest among the older-age-groups, in
most countries the increase over time has been larger among the young and prime-age
groups (Figure 4.2). For instance, in Finland and Norway, people in the age group 50-64 are
more than ten times as likely to receive a disability benefit as those in the age group 20-34.
At the same time, beneficiary rates have decreased for the 50 to 64 age group in these two
countries. Large increases in the age group 20-34 have occurred since 1990, in particular in
Australia, Germany and Sweden. The Netherlands also recorded an increase among young
men, while total rates declined. The Netherlands has now become an exception in that
older individuals are less likely than the young and the prime-age group to be beneficiaries.
Mental and psychological problems represent around one-third of disability benefit
inflows on average in OECD countries (Figure 4.3). This share has shown a massive increase
in many countries for which data are available over the past decade. For instance, in
Switzerland and Denmark the share of mental problems in disability inflows has grown
from 25% to over 40%, and from 15% to 40% in Sweden. Shares of mental illness are
systematically higher for younger and prime-age individuals, but particularly for the age
group 20-34: at this age, up to 70% of inflows are for mental health reasons in Denmark,
Finland and Sweden. It is also among this age group that inflows for mental health reasons
have increased the most. Such pattern has raised questions about whether young people
suffering from psychological problems should be granted permanent benefits or whether
more efforts should be devoted to get them back into the labour market.

4. PATHWAYS ONTO (AND OFF) DISABILITY BENEFITS: ASSESSING THE ROLE OF POLICY AND INDIVIDUAL CIRCUMSTANCES
OECD EMPLOYMENT OUTLOOK 2009 – ISBN 978-92-64-06791-2 – © OECD 2009 215
Figure 4.1. Trends in disability benefit recipiency ratesa in OECD countries, 1990-2007Percentage of working-age population
a) Contributory and non-contributory pension in Panel A and contributory pension only in Panels B and C for Belgium andSpain. Ireland includes persons on illness benefit over two years and New Zealand and Sweden include persons on sicknessbenefit over two years. OECD unweighted average of countries shown except in Panels B and C for which Turkey is excluded.Differences in the number of countries covered in the three panels are explained by the non-availability of disaggregateddata for some of the countries presented in Panel A.
b) Data refer to 1990 and 2007 except: 1994 for Greece; 1995 for Germany, Korea, Poland (Social Insurance Fund Data, FUS) andSpain; 1995-2006 for the Slovak Republic; 1996 for Belgium and Canada [contributory and non-contributory pensions,Canadian Pension Plan (CPP) and Quebec Pension Plan (QPP), and provincial social assistance]; 1999 for the Netherlands;2000 for Hungary; 2000-06 for Italy; 2001 for Ireland; 2003-06 for Japan; 2005 for Luxembourg; and 2006 for Denmark, Turkeyand the United States.
c) Data refer to 1990 and 2007 except: 1992 for Germany; 1995 for New Zealand and Poland (only FUS); 1995-2006 for the SlovakRepublic; 1996 for Canada (CPP and QPP only); 1999 for the Netherlands; 1999-2005 for the United Kingdom; 2000 forHungary; 2000-06 for Italy; 2001 for Ireland; 2004 for Poland; and 2006 for Turkey.
Source: Data provided by national authorities.1 2 http://dx.doi.org/10.1787/707506451062
TUR
MEX
KOR
JPN
ITA
NZL
ESP
CAN
DEU
AUT
GRC
PRT
LUX
POL(
FUS)
CHE
AUS
USA
BEL IR
L S
VK G
BR C
ZE P
OL D
NK N
LD FIN
NOR
SWE
HUN
14
12
10
8
6
4
2
0
%
TUR
MEX
CAN
ITA
DEU B
EL E
SP N
ZL P
RT S
VK C
HE A
UT A
US IR
L D
NK
POL(
FUS)
CZE
SWE
NOR
GBR
POL
FIN
NLD
HUN
14
12
10
8
6
4
2
0
%
TUR
MEX
ESP
CAN
AUT
ITA
NZL
DEU B
EL
POL(
FUS)
AUS
PRT
CHE
POL
GBR
IRL
CZE
SVK
NLD
DNK
FIN
HUN
NOR
SWE
14
12
10
8
6
4
2
0
%
1990 2007
Panel A. Both sexesb
Panel B. Menc
Panel C. Womenc
OEC
D
OEC
D
OEC
D

4. PATHWAYS ONTO (AND OFF) DISABILITY BENEFITS: ASSESSING THE ROLE OF POLICY AND INDIVIDUAL CIRCUMSTANCES
OECD EMPLOYMENT OUTLOOK 2009 – ISBN 978-92-64-06791-2 – © OECD 2009216
1.2. Who are the disability benefit recipients?
Evidence presented in the previous section provides a good picture of trends in
disability rates, but leaves unanswered important questions related to personal
characteristics and prior work experience of beneficiaries. For a more complete picture of
benefit recipients, more should be known about their education level, their marital status
and the types of jobs they held prior to moving to disability benefits. Administrative data
on disability do not always allow analysing the role of the detailed characteristics on
benefit recipiency. For that reason, individual level data are needed as they provide rich
information on characteristics of beneficiaries and allow tracing beneficiaries’ work
history. Particular attention is paid to work characteristics as there is a belief that the
working environment may have become more challenging than before (Parent-Thirion
et al., 2007), making it more difficult for certain groups of the population, especially those
with low skills and qualifications and those with weak links to the labour market, to stay
in employment. At the same time, institutions and policies in the different countries may
be contributing to different degrees to labour market withdrawal.
The analysis is performed for a selected group of countries (Australia, Germany,
Switzerland and the United Kingdom), for which longitudinal surveys are available with
sufficient information on health, demographics, work history and benefit status (see
Annex 4.A1 for further details). The definition of disability benefits in this section is based
on self-reported information on income sources for working-age individuals. Country-
specificities in the type of disability-related benefits are taken into account in the
definition of recipient status (Box 4.2). The schemes differ across countries because some
Figure 4.2. Change in disability benefit recipiency rates by age groups in OECD countries, 1990-2007a
Percentage change
a) Figure based on 24 countries for which there are available data disaggregated by age groups. The specific yearscovered for every country are the following: 1990-2005 for Denmark; 1992-2007 for Switzerland; 1995-2006 for theSlovak Republic; 1995-2007 for Germany, New Zealand, Poland (FUS only) and Sweden; 1996-2007 for Canada (CPPand QPP only); 1999-2005 for the United Kingdom; 1999-2007 for the Netherlands; 2000-06 for Italy; 2000-07 forHungary and the United States (SSDI only for the 18-64 group); 2001-07 for Ireland; 2003-06 for Japan; 2003-07 forMexico; and 2005-07 for Spain.
Source: Data provided by national authorities.1 2 http://dx.doi.org/10.1787/707575432538
180
160
140
120
100
80
60
40
20
0
-20
-40
-60
-80
%
Portug
al
Finl
and
Pola
nd
Can
ada
Den
mark
Neth
erlan
ds
Aus
tria
Mex
ico
Unit
ed King
dom
Germ
any
Italy
Slov
ak R
epub
lic
Japa
n
Nor
way
Spa
in
Hun
gary
Swed
en
Belgium
Unit
ed Stat
es
Cze
ch R
epub
lic
Irela
nd
Aus
tralia
Switz
erlan
d
New
Zeala
nd
20-34 35-49 50-64

4. PATHWAYS ONTO (AND OFF) DISABILITY BENEFITS: ASSESSING THE ROLE OF POLICY AND INDIVIDUAL CIRCUMSTANCES
OECD EMPLOYMENT OUTLOOK 2009 – ISBN 978-92-64-06791-2 – © OECD 2009 217
have universal coverage while others have means-tested benefits or a dual system with
contribution-based benefits (earnings-related) together with non-contributory benefits.
The countries chosen differ substantially in terms of labour market conditions and their
disability benefit-systems, shedding light on how personal and work-related
characteristics interact with macroeconomic conditions and policies. While this will
provide relevant information on whether the determinants of disability differ depending
on the type of benefit systems, the restricted set of countries will have implications for the
generalisation of the results.
Figure 4.3. Disability benefit inflows due to mental health problems have increased greatly and are most common at younger ages, 1990-2007a
Share of mental health problems as a percentage of total inflows by ageb
a) 1992 for Switzerland; 1995 for Belgium, Germany and Poland; 1996 for New Zealand; 1999 for the Netherlands;2000 for Denmark and Finland; 2001-06 for Canada (CPP&QPP only); 2005 for Norway; data for the United Statesrefer to 2006 and do not account for the overlap in contributory (SSDI) and non-contributory (SSI) benefit receipt.
b) Austria, Germany and the United States (ages 18-64): no age breakdown available.
Source: Data provided by national authorities.1 2 http://dx.doi.org/10.1787/707615862243
1990 2007
% %80 80
70 70
60 60
50 50
40 40
30 30
20 20
10 10
0 0
% %80 80
70 70
60 60
50 50
40 40
30 30
20 20
10 10
0 0
Unit
ed Stat
es
Finl
and
Finl
and
Switz
erlan
d
Switz
erlan
d
Den
mark
Den
mark
Germ
any
Swed
en
Swed
en
Neth
erlan
ds
Neth
erlan
ds
Czech
Rep
ublic
Cze
ch R
epub
lic
Pola
nd
Pola
nd
Can
ada
Can
ada
Nor
way
Nor
way
New
Zeala
nd
New
Zeala
nd
Aus
tralia
Aus
tria
Belg
ium
Belg
ium
Aus
tralia
Panel A. 20-64 Panel B. 20-34
Finl
and
Finl
and
Switz
erlan
d
Switz
erlan
d
Den
mark
Den
mark
Swed
en
Swed
en
Netherl
ands
Neth
erlan
ds
Cze
ch R
epub
lic
Cze
ch R
epub
lic
Pola
nd
Pola
nd
Can
ada
Can
ada
Aus
tralia
Nor
way
Nor
way
New
Zeala
nd
New
Zeala
nd
Aus
tralia
Belg
ium
Belg
ium
Panel C. 35-49 Panel D. 50-64

4. PATHWAYS ONTO (AND OFF) DISABILITY BENEFITS: ASSESSING THE ROLE OF POLICY AND INDIVIDUAL CIRCUMSTANCES
OECD EMPLOYMENT OUTLOOK 2009 – ISBN 978-92-64-06791-2 – © OECD 2009218
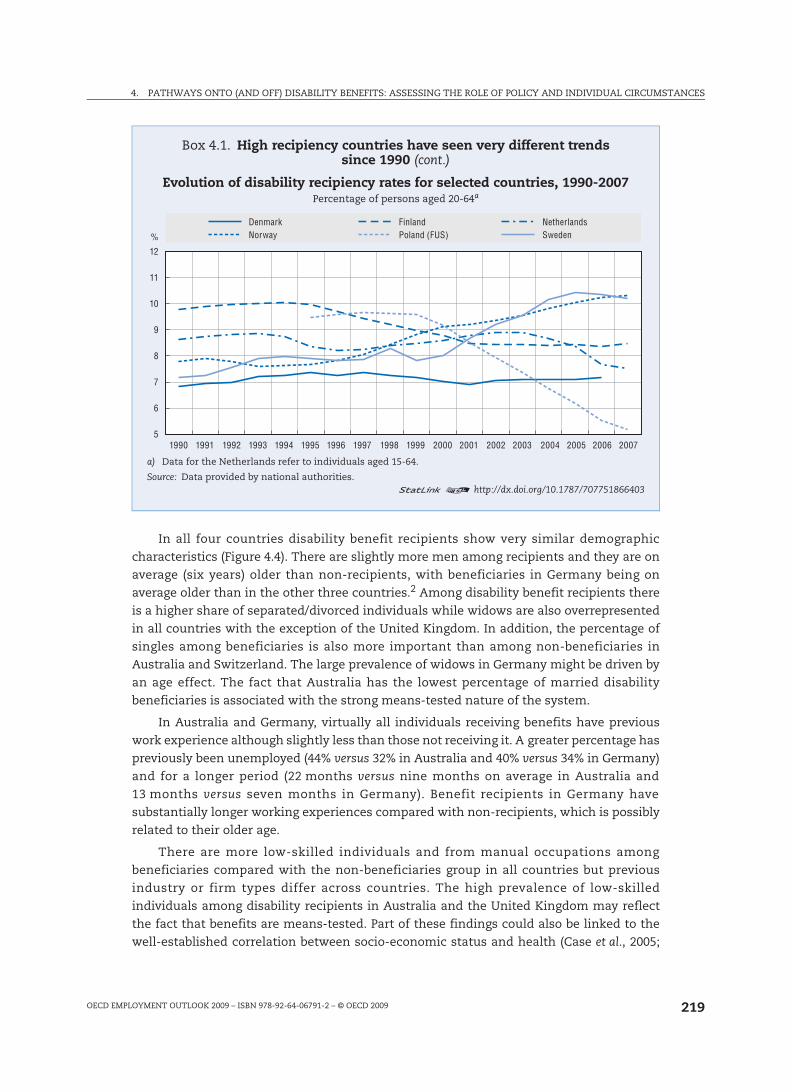
Box 4.1. High recipiency countries have seen very different trendssince 1990
This box presents details about the trends in a sample of high benefit recipiencycountries.
At the beginning of the 1990s, Norway had relatively high levels of disability recipiencyrates, at 8% of the population. It experienced a decline in rates over the 1990s. However,this trend was reversed at the end of the 1990s when growth resumed, leading to arecipiency rate close to 11% of the population in 2007.
In Sweden, the number of newly granted disability benefits per year remained stable inthe mid-1980s. It increased in 1992 and 1993 and then fell sharply during 1995-99 when thepossibility for people aged 60-64 to be granted disability benefits for combined medical andlabour market reasons was withdrawn. Between 1999 and 2004, the number of newlygranted disability benefits rose again, peaking in 2004, but it slowed down during 2005and 2006 following a fall in long-term sickness.
In the Netherlands, the number of beneficiaries grew continuously until 1993 wherechanges in definition of disability reduced the number of new awards (reassessment) by7%. However,the slowdown was reversed at the end of the 1990s and the number ondisability rolls reached the critical point of almost 1 million in 2002. Since then, theNetherlands has recorded a steady decrease in beneficiary rates as inflow rates havedecreased sharply between 2001 and 2006 after a series of major reforms. At the sametime, the Netherlands has recently witnessed a large increase in the number of benefitrecipients who acquired a disability at a young age (the Wajong). The numbers havedoubled between 2001 and 2006 and, currently, one in 20-18-year-olds eventually entersthe Wajong benefit roll.
In Finland, the share of disability beneficiaries decreased from 10% to 8.5% in thelate 1990s and remained stable since 2001. Inflows into disability benefits are related tochanges in unemployment benefits and, more recently, also to pension reform. Wide useof unemployment benefits during the recession of the early to mid 1990s reduced the needto use sickness and disability benefits, while in the late 1990s and the early 2000s higherinflows into disability reflected a tighter administration of other benefits (notably throughactivation measures for social assistance beneficiaries) and the fact that specialprogrammes were launched to help the long-term unemployed with health problemsobtain a disability benefit (Gould, 2003).
Poland experienced high rates of disability recipiency throughout the 1995-07 period.After a fairly stable period between 1995 and 1999, the share of disability beneficiariesdecreased substantially from 2000 and even more so in the period between 2004and 2006. This drop coincides with the introduction of a new disability assessmentprocedure and a more restrictive access to permanent benefits (OECD, 2006). Theevolution of disability recipiency in Poland also reflects the specific circumstances of thetransition to a marked economy when for some workers it was particularly difficult tostay in the labour market.
In Denmark, the beneficiary rate has oscillated around 7% for the past 15 years.Inflows into disability benefits have remained constant in spite of several reforms, thatdirected a growing number of people with reduced work capacity to subsidisedemployment (flex jobs). Workers in flex-jobs have increased from 13 000 in 2003to 41 500 in 2006. The number of individuals waiting for a flex-job increased from 1 400to 12 700 in the same period.
4. PATHWAYS ONTO (AND OFF) DISABILITY BENEFITS: ASSESSING THE ROLE OF POLICY AND INDIVIDUAL CIRCUMSTANCES
OECD EMPLOYMENT OUTLOOK 2009 – ISBN 978-92-64-06791-2 – © OECD 2009 219
In all four countries disability benefit recipients show very similar demographic
characteristics (Figure 4.4). There are slightly more men among recipients and they are on
average (six years) older than non-recipients, with beneficiaries in Germany being on
average older than in the other three countries.2 Among disability benefit recipients there
is a higher share of separated/divorced individuals while widows are also overrepresented
in all countries with the exception of the United Kingdom. In addition, the percentage of
singles among beneficiaries is also more important than among non-beneficiaries in
Australia and Switzerland. The large prevalence of widows in Germany might be driven by
an age effect. The fact that Australia has the lowest percentage of married disability
beneficiaries is associated with the strong means-tested nature of the system.
In Australia and Germany, virtually all individuals receiving benefits have previous
work experience although slightly less than those not receiving it. A greater percentage has
previously been unemployed (44% versus 32% in Australia and 40% versus 34% in Germany)
and for a longer period (22 months versus nine months on average in Australia and
13 months versus seven months in Germany). Benefit recipients in Germany have
substantially longer working experiences compared with non-recipients, which is possibly
related to their older age.
There are more low-skilled individuals and from manual occupations among
beneficiaries compared with the non-beneficiaries group in all countries but previous
industry or firm types differ across countries. The high prevalence of low-skilled
individuals among disability recipients in Australia and the United Kingdom may reflect
the fact that benefits are means-tested. Part of these findings could also be linked to the
well-established correlation between socio-economic status and health (Case et al., 2005;
Box 4.1. High recipiency countries have seen very different trends since 1990 (cont.)
Evolution of disability recipiency rates for selected countries, 1990-2007Percentage of persons aged 20-64a
a) Data for the Netherlands refer to individuals aged 15-64.
Source: Data provided by national authorities.1 2 http://dx.doi.org/10.1787/707751866403
%
1990 1992 1994 1996 1998 2000 2002 2004 20061991 1993 1995 1997 1999 2001 2003 2005 2007
12
11
10
9
8
7
6
5
NorwayDenmark
Poland (FUS)Finland
SwedenNetherlands

4. PATHWAYS ONTO (AND OFF) DISABILITY BENEFITS: ASSESSING THE ROLE OF POLICY AND INDIVIDUAL CIRCUMSTANCES
OECD EMPLOYMENT OUTLOOK 2009 – ISBN 978-92-64-06791-2 – © OECD 2009220
Box 4.2. Types of disability-related benefits
This box describes the types of disability-related benefits in Australia, Germany, Switzerland and theUnited Kingdom, and their conditions of access and entitlement that apply.
Australia
Sickness allowance. There is a public, flat-rate and means-tested sickness allowance for residents over age 21who have a sickness or injury preventing work, provided they have a job (or a place in education) to return to.
Disability Support Pension. Residents between age 16 and the statutory pension age are eligible for adisability benefit. If the assessed disability began before residing in Australia, the person must have tenyears of residence in the country. Individuals must be assessed as not being able to work or be retrained forwork for at least 15 hours per week within two years because of their illness, injury or disability (orpermanently blind). These payments are household means and asset-tested (unless a person is blind).Veterans who are permanently blind or permanently unable to work and meeting the criteria of permanentincapacity to work are eligible for a Service Pension.
Germany
Disability pensions. They cover all employees with a qualifying period of five years and compulsorycontributions of three years in the last five years. The self-employed have access to disability pensions ona voluntary basis. The scheme distinguishes between total and reduced incapacity pension. The first isgranted to insured persons who cannot work for at least three hours a day due to their sickness, whereasthe second is granted to those who can work between three and less than six hours a day.
Switzerland
Disability insurance. It covers all residents from age 18 onwards and those gainfully employed in thecountry, with a special benefit for those invalid from birth and before age 18 and those with less than oneyear of contributions. People not entitled to a second pillar disability benefit or only to a low one can beentitled to a means-tested, tax financed supplementary benefit.
United Kingdom
Incapacity benefits. They replaced Sickness Benefits and Invalidity Benefits from April 1995. People need tobe ordinary residents of the UK and be assessed as incapable of working because of their illness followingthe personal capability assessment. Individuals must have paid enough contributions in the last threeyears before the claim. There are three rates of Incapacity Benefit, two short-term rates (the lower rate ispaid for the first 28 weeks of sickness and the higher rate for weeks 29 to 52) and a long-term rate for peoplewho have been sick for more than a year. The higher short-term rate and the long-term rate are treated astaxable income.
Severe disablement allowance. It was available to people under 65 and incapable of work, but whoseNational Insurance contributions were not enough to claim the long-term Incapacity Benefit. FromApril 2001, there have been no new claims to SDA. From this date, claimants under the age of 20 (or 25 ifreceiving training or education) may become entitled to Incapacity Benefit.
Income support. Individuals who do not qualify for incapacity benefit because they do not meet themeans-testing or the contributions requirements may be eligible for income support and they may alsoreceive a Disability Living Allowance if they have personal care and/or mobility needs as a result of severedisability and claim before age 65. Because the public disability benefit does not cover the entirepopulation, like in Switzerland, many people with disability in the United Kingdom receive Income Supporttogether with the Disability Living Allowance and it is therefore important to include such individuals asdisability benefit recipients.
In the United Kingdom, contributory disability benefits are not means-tested, while non-contributorypayments for those who do not fulfill the contribution requirements are. From October 2008, theEmployment and Support Allowance (ESA) replaces Incapacity Benefit and Income Support for newapplicants, paid because of an illness or disability.

4. PATHWAYS ONTO (AND OFF) DISABILITY BENEFITS: ASSESSING THE ROLE OF POLICY AND INDIVIDUAL CIRCUMSTANCES
OECD EMPLOYMENT OUTLOOK 2009 – ISBN 978-92-64-06791-2 – © OECD 2009 221
Figure 4.4. Demographic and work characteristics of disability benefit recipientsRelative prevalence (1 is the population-average benchmark)a, b, c
a) Numbers presented are ratios between disability benefit recipients and non-recipients.b) Samples include persons present in at least three consecutive waves, not in full-time education, and aged 15-64 in
Australia, Switzerland and the United Kingdom; 16-64 in Germany.c) The following years are considered for each country: 2001-07 for Australia; 1984-2006 for Germany; 2002-06 for Switzerland;
and 1991-2006 for the United Kingdom.d) Work characteristics are based on the respondent’s last job. Samples are therefore different in Panels D-F, as they comprise
only individuals who had a job in the past.e) Three broad educational groupings were defined using ISCED. Occupational groupings were defined in terms of the nine
one-digit occupations of the ISCO-88. Seven broad industry groupings were defined in terms of the 17 one-digit industriesof the ISIC Rev. 3: agriculture and mining corresponds to industries A, B and C (i.e. agriculture, hunting and forestry; fishing;and mining and quarrying); good-producing sector corresponds to industries D and E (i.e. manufacturing; and electricity, gasand water supply); construction corresponds to industry F (i.e. construction); producer services corresponds to industries Jand K (i.e. financial intermediation; and real estate, renting and business activities); distributive services corresponds toindustries G and I (i.e. wholesale and retail trade; repair of motor vehicles, motorcycles and personal and household goods;and transport, storage and communications); social services corresponds to industries L, M, N and Q (i.e. publicadministration and defence; compulsory social security; education; health and social work; and extra-territorialorganisations and bodies); and personal services corresponds to industries H, O and P (i.e. hotels and restaurants; othercommunity, social and personal service activities; and private households with employed persons).
Source: OECD estimates based on the HILDA for Australia, the GSOEP for Germany, the SHP for Switzerland and the BHPS for theUnited Kingdom.
1 2 http://dx.doi.org/10.1787/707630518176
4.03.53.02.52.01.51.00.5
0
3.53.02.52.01.51.00.5
0
2.5
2.0
1.5
1.0
0.5
0
4.03.53.02.52.01.51.00.5
0
3.53.02.52.01.51.00.5
0
3.53.02.52.01.51.00.5
0
Male 15-24 25-54 55-64
Australia Germany Switzerland United Kingdom
A. Age and gender
Single Married Divorced Widowed
B. Marital status
Low Medium High
C. Educational attainment D. Occupationd, e
Pro
fessio
nal
Manag
er
Tech
nician
Cler
ks
Serv
ice w
orke
rs
Skil
led ag
ricult
ural
Craf
t
machin
e ope
rator
Plant a
nd
Elem
entar
y
E. Industryd, e F. Work characteristicsd, e
Firm
with
less
Public
secto
r
Person
al se
rvice
s
Social
servi
ces
Distrib
utive
servi
ces
Produ
cer
servi
ces
Constr
uctio
n
Goods
-prod
ucingse
ctor
Agricu
lture
and m
ining
than 2
0 emplo
yees
Firm
with
mor
e
than 1
00 emplo
yees
Tempo
rary
contr
act
Mini-jo
bs
(0-14
hour
s)
Part
-time
(15-29
hour
s)
Ove
rtime
(48+ h
ours)
Shif
ts

4. PATHWAYS ONTO (AND OFF) DISABILITY BENEFITS: ASSESSING THE ROLE OF POLICY AND INDIVIDUAL CIRCUMSTANCES
OECD EMPLOYMENT OUTLOOK 2009 – ISBN 978-92-64-06791-2 – © OECD 2009222
Smith, 1999). However, examining the sector in which beneficiaries previously worked, no
common pattern is found across countries.
Other work characteristics appear to be important. In all four countries, beneficiaries
are overrepresented in non-standard types of jobs. A majority of recipients were previously
working part-time or in mini-jobs (1-14 hours of work) in all countries (only in mini-jobs in
the United Kingdom), particularly in Australia and Switzerland. They were also more likely
to have had temporary jobs in all four countries except Germany. They are overrepresented
in shift work in the United Kingdom and Australia. The explanation for this phenomenon
could be two-fold. On the one hand, it is likely that individuals experiencing health
problems have to reduce their working hours or are found in more precarious employment
situations. On the other hand, it is possible that individuals working part-time or in
temporary jobs might be less likely to remain in employment or that their health is affected
by this type of employment (OECD, 2008a) and thus they are more likely to enter a disability
spell. Regression analysis in the next section will shed more light on this issue.
2. Individual and work characteristics determining labour market statusPersonal characteristics and prior work experience are likely to determine the
probability that an individual enters into disability benefits or continues to work after the
onset of a health problem. This section first provides an analysis of annual transition
probabilities into disability benefit. It then investigates how work and personal
characteristics affect job retention after a health onset.
2.1. What affects entry to disability benefits?
Poor health is expected to raise the disutility of work and might even reduce the
probability of returning to work, while also generating an entitlement to disability benefits.
At the same time, it is often assumed that, at the aggregate level, worsening health status
alone cannot explain the increase in the number of recipients in the countries studied
(McVicar, 2008; Bound and Burkhauser, 1999; Faggio and Nickell, 2005; Autor and Duggan,
2003). The regression analysis in this section sheds more light on the role of health for
different groups and the importance of previous activity status and work characteristics
(see Box 4.3 and Annex 4.A1 for a description of the regression methods).
Experiencing a health problem increases the probability of receiving a disability
benefit in all countries (Table 4.1, Panel A). This is true for past or present health shocks
(including initial health status, when the individual is first observed in the survey). It
should be noted, however, that health measures used in this analysis differ across
countries. The selection of the health variable for each country is mainly driven by data
availability. Health problems are defined as impediments in daily activities in Australia,
Switzerland and the United Kingdom, and as at least one night of hospital stay in Germany.
Additional estimates have been performed by instrumenting the health measure and to
ensure a better comparability across countries. The results in this case are almost
unchanged for the different socio-demographic characteristics. At the same time, the
effect of health shocks is dramatically reduced, particularly in the case of Australia and the
United Kingdom (see Table 4.A1.1 in the annex).
The results also confirm the descriptive analysis of benefit recipiency in the previous
section as the probability of receiving a disability benefit is lower for women and for the
younger age groups, controlling for other observed characteristics and unobserved

4. PATHWAYS ONTO (AND OFF) DISABILITY BENEFITS: ASSESSING THE ROLE OF POLICY AND INDIVIDUAL CIRCUMSTANCES
OECD EMPLOYMENT OUTLOOK 2009 – ISBN 978-92-64-06791-2 – © OECD 2009 223
heterogeneity.3 The effects of age are lower in the United Kingdom, showing that there is
less of a gap between younger and older individuals in their chances of disability
recipiency. On the contrary, in Germany young individuals are much less likely to be on
disability benefits as the characteristics of the disability benefit scheme are similar to
those of early retirement. The number of children in the household matter in Australia and
the United Kingdom as the total number of household members is taken into account for
eligibility of means-tested benefits. Higher household income provides a protective effect
since higher income is associated with a lower probability of disability benefit (except in
the United Kingdom), although some differences exist across countries. There is no
consistent impact across countries of previous work characteristics, occupation or sector
of work on the probability of receiving a disability benefit once other individual
characteristics and unobserved heterogeneity are taken into account.
The analysis of aggregate trends in disability recipiency rates has shown large
increases over time for many countries, particularly among some groups. It is therefore
interesting to test whether particular groups suffer more from a health problem onset by
including interaction terms in the regressions (Table 4.1, Panel B). For instance, if younger
individuals or women are more susceptible to enter a disability spell after a health shock,
a worsening of their health status in recent years could explain the growth in the number
of young and female beneficiaries. The results show that the coefficient is not significant
for gender, indicating that having a health problem does not increase the likelihood of
receiving a disability benefit for women.4 Only in Australia health shocks do have a worse
impact for women.
Box 4.3. Estimating the probability of labour market transitions
A discrete-time event history model is used to analyze transitions between different states.
Probability of entering disability benefit (Section 2.1)
Transition into disability status is estimated using a complementary log-log model. Thismodel is the discrete-time counterpart for an underlying continuous-time proportionalhazard model and the hazard rate follows the expression:
or
where the probability of a transition into receiving a disability benefit is a function ofhealth (H) and socio-demographic characteristics (X), duration dependence (D) andunobserved heterogeneity modeled using a normal distribution.
Probability of being in employment (Section 2.2)
A dynamic probit model is used for the analysis of employment. This model estimatesthe probability of being in employment as a function of previous employment status (d),health (H) and demographic characteristics as well as work characteristics (X), controllingfor initial conditions ():
Initial conditions are modelled using Wooldridge’s approach as detailed in Annex 4.A1.
)])(exp(exp[1),( ''iitit utDHXXth
iitit utDHXXth )()]),(1log[log( ''
)(),,|1Pr( '''11 iitititiititit HXdXdd

4. PATHWAYS ONTO (AND OFF) DISABILITY BENEFITS: ASSESSING THE ROLE OF POLICY AND INDIVIDUAL CIRCUMSTANCES
OECD EMPLOYMENT OUTLOOK 2009 – ISBN 978-92-64-06791-2 – © OECD 2009224
Table 4.1. Probability of receiving a disability benefit: health and demographics matter
Australia Germany Switzerland United Kingdom
Panel A. Logit disability (coefficients reported)a, b, c
Health problemsd 1.989*** 0.550*** 0.830*** 1.167***
Lagged health problemsd 1.196*** 0.575*** 1.064*** 1.174***
Health status (initial)d 0.381*** 0.489*** 0.693*** 0.198***
Number of children in household (grouped) –0.124* –0.205 –0.157 –0.090*
Household income quintile2nd quintile –0.045 –0.682*** 0.509** 0.264***3rd quintile –0.489** –0.339* 0.175 0.1724th quintile –1.536*** –0.466** 0.288 0.1595th quintile –1.260*** –0.545*** –0.779** –0.144
Gender = female –0.326** –0.198 –0.876*** –0.937***
Age15-24 –0.891*** –3.880*** –1.958*** –0.638***25-34 –0.716*** –2.883*** –1.383*** –0.485***25-44 –0.663*** –2.333*** –0.828*** –0.230**45-54 –0.365** –1.045*** –0.549*** –0.151*
Foreign-born (ethnicity for the United Kingdom) –0.057 –0.691*** 0.003 –0.743**
Marital statusSingle 0.503*** 0.617*** 1.075*** 0.426***Separated/divorced 0.385** 0.307 0.793*** 0.501***Widowed –0.728 0.256 0.387 0.097
Educational attainmentLow-skilled 0.048 0.353* 0.099 0.340***Medium-skilled 0.146 0.205 0.078 0.070
Ever unemployed 0.166 0.607*** . . 0.073
Observations 36 063 86 430 12 502 84 926
Panel B. Interactions between health shocks and personal characteristics (coefficients reported)a, b, c
Gender = female 0.639* –0.221 0.449 0.262
Age15-24 1.060 –22.101 2.318** 0.684*25-34 –0.086 0.339 0.614 1.258***35-44 –0.032 0.998* –0.415 0.612***45-54 0.006 0.807** 0.327 0.651***
Education attainmentLow-skilled –0.045 –0.303 –0.013 –1.253***Medium-skilled –0.142 –0.258 0.107 –0.421
Household income quintile2nd quintile 0.307 0.022 0.158* –0.1883rd quintile 0.301 –0.053 –0.414 0.466*4th quintile 1.148 –0.925* 0.509 1.034***5th quintile –0.817 –1.319** 0.065 1.011***
*, **, *** statistically significant at the 10%, 5%, 1% level, respectively.a) Samples include persons present in at least three consecutive waves, not in full-time education, and aged 15-64 in Australia,
Switzerland and the United Kingdom; 16-64 in Germany.b) The following years are considered for each country: 2001-07 for Australia; 1994-2006 for Germany; 2002-06 for Switzerland;
and 1991-2006 for the United Kingdom.c) All regressions include regional dummy variables (except for Germany) and the following “initial” work characteristics: industry,
occupation, type of contract, working hours, shift work, public sector and firm size. “Initial” in brackets indicates the value of thevariable in question at the time the individual enters the survey. Initial health status also refers to health status the first period theindividual is observed in the survey.
d) Health problems are defined as follows: one night of hospital stay in Germany; whether health is an impediment in daily activities inAustralia, Switzerland and the United Kingdom.
Source: OECD estimates based on the HILDA for Australia, the GSOEP for Germany, the SHP for Switzerland and the BHPS for theUnited Kingdom.
1 2 http://dx.doi.org/10.1787/707802157757

4. PATHWAYS ONTO (AND OFF) DISABILITY BENEFITS: ASSESSING THE ROLE OF POLICY AND INDIVIDUAL CIRCUMSTANCES
OECD EMPLOYMENT OUTLOOK 2009 – ISBN 978-92-64-06791-2 – © OECD 2009 225
There are however some differential effects according to age, income and education.
Surprisingly, the effect of a health shock is worse for higher incomes in the UK but in Germany
individuals in the highest income quintiles experience a protective effect of income in case of
a health problem. Low-educated individuals are less likely to enter disability benefits after a
health shock only in the case of the United Kingdom. Younger individuals suffer more from the
effect of health deterioration in Switzerland while in Germany it is prime-age individuals and
in the United Kingdom both young and prime-age individuals.
Several studies have found that unemployment has a detrimental effect on health,
particularly mental health (OECD, 2008a) and that unemployment spells could raise the
probability of receiving a disability benefit because of health-deteriorating effects. At the
same time, there is a possibility that a worsening in health conditions may lead to job loss
and further onto inactivity. According to the analysis in this section, persons who have
experienced at least one unemployment spell in their labour market history are more likely
to be on disability benefits (Table 4.1, Panel A). Additionally a regression analysis testing
the effects of lagged unemployment and other inactivity on disability status shows that
indeed unemployment does increase the probability of benefit recipiency while lagged
inactivity does matter in Australia (Figure 4.5).
2.2. Which groups are more likely to stay in employment following health problems?
In addition to estimating the probability of entering into disability benefits, it is also
interesting to understand which individual and work characteristics provide a protective effect
Figure 4.5. Previous spells of unemployment or inactivity increase the probability of disability benefit recipiency
Coefficients from a disability probability modela, b, c
*, **, *** statistically significant at the 10%, 5%, 1% level, respectively.a) Reported coefficients are estimated from a logit model. They capture the effect of lagged unemployment and
lagged inactivity on the probability of receiving a disability benefit. A positive coefficient means a higherprobability of receiving a disability benefit.
b) Samples include persons present in at least three consecutive waves, not in full-time education, and aged 15-64in Australia, Switzerland and the United Kingdom; 16-64 in Germany. Samples have been restricted to individualswho were not on disability benefit in the previous year.
c) The years considered for each country are given in note b) of Table 4.1 and the controls included in the regressionsare the same as those in Table 4.1.
Source: OECD estimates based on the HILDA for Australia, the GSOEP for Germany, the SHP for Switzerland and theBHPS for the United Kingdom.
1 2 http://dx.doi.org/10.1787/707651634017
1.4
1.2
1.0
0.8
0.6
0.4
0.2
0
***
***
*
***
**
Australia Germany Switzerland United Kingdom
Lagged unemployment Lagged inactivity
4. PATHWAYS ONTO (AND OFF) DISABILITY BENEFITS: ASSESSING THE ROLE OF POLICY AND INDIVIDUAL CIRCUMSTANCES
OECD EMPLOYMENT OUTLOOK 2009 – ISBN 978-92-64-06791-2 – © OECD 2009226
for workers in promoting their likelihood to stay in employment after experiencing health
problems. The regressions use a dynamic approach, controlling for previous employment
(Table 4.2). The results also show that household income is not associated with a higher
probability of staying in employment (with the exception of Germany). Lower education
(medium education in Australia) decreases the chances of remaining in employment in the
United Kingdom while the opposite is true in Switzerland. Other demographic characteristics
differ greatly by country in their effect on employment retention. Being in a blue-collar
occupation decreases employment probabilities in Germany and Switzerland and the same
holds for temporary contract in all countries. Part-time work and/or mini-jobs also reduce the
chances of employment in all countries except Germany. Industry does play a role in
influencing employment probabilities in Switzerland and Germany.
From a policy perspective, an interesting question is to identify which types of workers are
most affected by health shocks. This can be assessed by including interaction terms for
employment characteristics and the onset of a health condition in the baseline regressions
(Table 4.2, Panel B). Working in certain industries – mainly in personal services – appears to
have a positive effect in terms of staying in employment after a health shock in all countries
except Germany. On the other hand, blue-collar workers are less likely to remain at work after
the onset of a health condition in the United Kingdom. Workers in elementary occupations are
less likely to remain in employment after a health shock in Australia, while the reverse is true
in Germany. Part-time workers and those in mini-jobs appear to suffer more from a health
shock in Switzerland but the opposite effect is found in the UK. It does appear that in the latter,
reduced hours helps to accommodate individuals with health problems. Other employment
characteristics such as shift working, firm size and working in the public sector do not impact
the effect of health shocks on employment except in the United Kingdom where health shocks
decrease employment chances more for those working in large firms.
3. Pathways into and out of disability benefitsDo new disability benefit recipients come directly from employment or have they
experienced some unemployment spell prior to receiving the benefit? What is the effect of
health and other personal and work characteristics in the transitions from employment to
disability, unemployment and other non-employment states? How transitory or persistent is
benefit recipiency? This section aims to answer these questions based on individual data.
3.1. How does health affect transitions across different labour market states?
Immediately after the onset of a health shock, transitions out of employment increase
in all countries but exit pathways are different (Figure 4.6). Persistence in employment is
lowest in Australia and Germany5 and highest in the United Kingdom. Exit to unemployment
after a health problem is highest in Germany and lowest in the United Kingdom while
entering a disability benefit or other type of inactivity directly is more likely in Australia.
Compared to the situation where no health shock occurs, exit to unemployment is higher in
relative terms in Australia and only slightly higher in Germany and Switzerland. Transition
into early retirement is highest in Switzerland and the United Kingdom. Among those
previously unemployed, the effect of a health onset is highest in Australia. Indeed,
persistence into unemployment shows the greatest increase in Australia and transition from
unemployment into disability is also highest in that country, followed by Germany. In
Germany there are more individuals moving into other types of inactivity while transitions
into retirement from unemployment double in the United Kingdom.

4. PATHWAYS ONTO (AND OFF) DISABILITY BENEFITS: ASSESSING THE ROLE OF POLICY AND INDIVIDUAL CIRCUMSTANCES
OECD EMPLOYMENT OUTLOOK 2009 – ISBN 978-92-64-06791-2 – © OECD 2009 227
Table 4.2. Work characteristics and health matter for employment retention
Australia Germany Switzerland United Kingdom
Panel A. Dynamic Probit employment (coefficients reported)a, b, c
Lagged employment 1.191*** 1.021*** 1.888*** 2.151***
Initial employment status 0.447*** 0.083** 0.320*** 0.255***
Health problemsd –0.377*** –0.225*** –0.341*** –0.348***
Lagged health problemsd –0.428*** –0.051* –0.321*** 0.056*
Number of children in household (grouped) 0.100 0.002 0.043 0.013
Household income quintile
2nd quintile 0.047 0.138*** –0.029 –0.005
3rd quintile 0.115 0.174*** 0.018 0.056
4th quintile 0.069 0.209*** –0.093 0.075*
5th quintile 0.030 0.203*** –0.072 0.025
Gender = female 0.235*** 0.104*** 0.063 –0.084***
Age
15-24 0.014 0.254*** 0.892*** 0.590***
25-34 0.321*** 0.257*** 0.483*** 0.599***
25-44 0.311*** 0.345*** 0.285*** 0.589***
45-54 0.235*** 0.277*** 0.412*** 0.528***
Foreign-born (ethnicity for the United Kingdom) 0.218*** 0.109 0.036 0.147
Marital status
Single –0.237*** 0.080 –0.538*** –0.257***
Separated/divorced –0.069 0.005 0.101 0.149
Widowed –0.375** –0.300** –2.017** 0.046
Educational attainmente
Low-skilled –0.079 –0.027 0.965** –0.304***
Medium-skilled –0.110* –0.068 –0.021 –0.168**
Industrye
Agriculture and mining 0.003 0.112 0.263 –0.004
Construction –0.016 –0.133** –0.775** 0.086
Producer services 0.072 0.064 –0.685*** –0.031
Distributives services 0.033 0.129*** –0.590*** 0.023
Social services 0.090 0.054 –0.561*** –0.081
Personal services –0.167 0.142** 0.160 0.051
Occupatione
Blue collar workers –0.153 –0.119*** –0.313*** 0.096
Elementary occupations –0.135 0.010 –0.226 0.050
Type of contract
Temporary contract –0.213*** –0.110*** –0.323** –0.216***
Weekly hours worked
Mini-jobs: 0 to 14 hours –1.157*** –0.034 –0.391** –0.165**
Part-time: 15 to 29 hours –0.805*** 0.022 –0.391** –0.034
Overtime: more than 48 hours –0.123 0.073** 0.001 –0.035
Shift work –0.041 . . –0.025 –0.034
Public sector 0.082 0.017 –0.120 0.163**
Firm size
Firm with less than 20 employees –0.041 –0.127*** –0.082 0.054
Firm with more than 100 employees –0.056 0.072* –0.087 –0.050
Observations 30 619 82 182 9 643 82 134

4. PATHWAYS ONTO (AND OFF) DISABILITY BENEFITS: ASSESSING THE ROLE OF POLICY AND INDIVIDUAL CIRCUMSTANCES
OECD EMPLOYMENT OUTLOOK 2009 – ISBN 978-92-64-06791-2 – © OECD 2009228
Transition rates suggest different routes after a health problem and different policy
challenges across countries. Australia has a high transition rate from employment directly
into disability suggesting that particular attention should be paid to monitoring the
sickness process of employed individuals. At the same time, in both Australia and
Germany, the route to disability benefits via unemployment is also important with an
important share of employed exiting to unemployment and later switching from
unemployment to disability. In the United Kingdom instead, few individuals move into
unemployment after a health shock but the direct route from unemployment to disability
after the onset of bad health conditions appears important.
Persistence in disability increases greatly after a health problem while return to
employment decreases sharply. The United Kingdom has the highest transition rate out of
disability into employment and unemployment while Switzerland has the highest
Panel B. Interactions health shocks and worker characteristics (coefficients reported)
Industrye
Agriculture and mining 0.243 0.151 –0.558 0.214
Construction –0.012 –0.018 –0.567 0.346*
Producer services 0.295 0.021 –0.062 0.457***
Distributives services 0.323** 0.001 –0.306 0.316***
Social services 0.180 0.024 –0.154 0.370***
Personal services 0.570*** 0.083 1.246*** 0.417***
Occupatione
Blue collar workers –0.182 –0.072 0.194 –0.174*
Elementary occupations –0.221* 0.159* 0.033 0.125
Weekly hours worked
Mini-jobs: 0 to 14 hours 0.031 0.131 –0.335* 0.344***
Part-time: 15 to 29 hours 0.188 –0.001 –0.371** 0.218**
Overtime: more than 48 hours 0.160 0.135* –0.109 –0.038
Type of contract
Temporary work 0.308*** 0.091 0.023 0.485***
Shift work 0.000 . . 0.167 0.046
Public sector 0.045 –0.064 0.093 –0.021
Firm size
Firm with less than 20 employees –0.139 0.059 0.043 0.163
Firm with more than 100 employees –0.169 –0.004 0.101 –0.251**
*, **, *** statistically significant at the 10%, 5%, 1% level, respectively.a) Samples include persons present in at least three consecutive waves, not in full-time education, and aged 15-64 in Australia,
Switzerland and the United Kingdom; 16-64 in Germany.b) The years considered for each country are presented in note b) of Table 4.1.c) All regressions include regional dummy variables (except for Germany). All regressions also include the average values over the time
period an individual is observed of all time-varying variables, i.e. number of children, age groups, marital status, region (except forGermany), occupation and industry dummy variables, temporary contract, hours of work, shift work (except for Germany), publicsector employment, and employer size. Initial employment status refers to employment status the first period the individual isobserved in the survey.
d) Health problems are defined as follows: one night of hospital stay in Germany; whether health is an impediment in daily activities inAustralia, Switzerland and the United Kingdom.
e) See note e) of Figure 4.4 for definitions.Source: OECD estimates based on the HILDA for Australia, the GSOEP for Germany, the SHP for Switzerland and the BHPS for the UnitedKingdom.
1 2 http://dx.doi.org/10.1787/707837334616
Table 4.2. Work characteristics and health matter for employment retention (cont.)
Australia Germany Switzerland United Kingdom
4. PATHWAYS ONTO (AND OFF) DISABILITY BENEFITS: ASSESSING THE ROLE OF POLICY AND INDIVIDUAL CIRCUMSTANCES
OECD EMPLOYMENT OUTLOOK 2009 – ISBN 978-92-64-06791-2 – © OECD 2009 229
persistence into the benefit with or without a health shock. This is partially driven by the fact
that a share of those in sickness and disability-related benefits in the United Kingdom do not
qualify for contributions-based benefits but are instead on income support payments.
Health shocks and illnesses appear to have a temporary effect in Australia,
Switzerland and the United Kingdom, since movements out of employment two and three
years afterwards are not very different compared with the case where there is no health
shock. More people stay in employment two and three years afterwards and transitions
from unemployment or disability to employment increase sharply. In Germany, the effect
of the health shock does not really fade away with time and a substantially higher
proportion of those in employment move into other type of inactivity even three years after
the health shock. This difference may be related to the different health measures used for
Germany compared to the other three countries.
A multinomial regression (results reported in Table 4.A1.2) confirms the above finding
for the four countries and provides additional information on personal and work
characteristics that determine transitions from employment to other states. The probability
of exits into disability, retirement and other non-working statuses increases with age,
whereas low education attainment increases the likelihood of exit to all types of non-
employment spells except to unemployment in Switzerland and to other types of inactivity
in Germany. The effect of work characteristics in different pathways out of employment
varies by country. Temporary contracts influence the probability of exiting employment
mostly to inactivity (unemployment in Germany) and to disability for the United Kingdom.
Working in mini-jobs (1-14 hours/week) increase the probability of exits into all types of non-
employment in Australia and into inactivity in Germany. In Switzerland the hazard out of
employment increases for mini-jobbers for exits to disability, retirement and other inactivity,
while it decreases for exits to unemployment. Lower working hours does not influence
negatively exit from employment in the United Kingdom.
3.2. Exits from disability benefits
From a policy perspective, it is also important to understand whether disability benefit
recipiency is a transitory state in an individual’s life or whether exiting the benefits is
unlikely or takes a long time to occur. High disability recipient rates stem in part from high
persistence in benefit status and very low outflows On average, outflows from disability
benefits are very low and exit routes vary greatly across countries. Administrative data show
that in most countries outflow is below 1% annually, the United Kingdom being one
exception with rates of around 7% (OECD, 2003, 2007). Several possible explanations are
found in the structure of the benefit system. In the United Kingdom, a regulated review
procedure exists for reassessing the entitlement to benefits over time while benefits are
de facto permanent in Switzerland and the same applied to Germany until 2001. In Australia
and in the United Kingdom, the majority of disability beneficiaries move to employment
while Germany has the lowest share of beneficiaries exiting to employment and the highest
moving into retirement (Table 4.3). Excluding retirement, most disability beneficiaries in
Germany end up being inactive and very few return to employment, compared with the
other countries. This evidence for Germany is possibly associated to the higher average age
of beneficiaries compared with the other countries. In all countries, employment appears to
be less sustainable over time with more of the previous beneficiaries moving into
unemployment or other types of inactivity.

4. PATHWAYS ONTO (AND OFF) DISABILITY BENEFITS: ASSESSING THE ROLE OF POLICY AND INDIVIDUAL CIRCUMSTANCES
OECD EMPLOYMENT OUTLOOK 2009 – ISBN 978-92-64-06791-2 – © OECD 2009230
Figure 4.6. Yearly labour force transitions after health shocks
a) Samples include persons present in at least three consecutive waves, not in full-time education, and aged 15-64 inAustralia, Switzerland and the United Kingdom; 16-64 in Germany.
b) The years considered for each country are given in note b) of Table 4.1.c) Health shocks are defined as follows: health is an impediment in daily activities in Australia; at least one night of hospital
stay in Germany; having an illness since last wave in Switzerland; and whether the person has some health problems ordisabilities in the United Kingdom.
Source: OECD estimates based on the HILDA for Australia, the GSOEP for Germany, the SHP for Switzerland and the BHPS for theUnited Kingdom.
1 2 http://dx.doi.org/10.1787/707677065753
0 10 20 30 40 50 60 70 80 90 100%
0 10 20 30 40 50 60 70 80 90 100%
0 10
10
20 30 40 50 60 70 80 90 100%
0 20 30 40 50 60 70 80 90 100%
HS = with a health shock NHS = with no health shockEmployed Unemployed Disability Other inactive RetiredDestination status:
Australia
Germany
Switzerland
United Kingdom
Sour
ce s
tatu
sSo
urce
sta
tus
Sour
ce s
tatu
sSo
urce
sta
tus
Oth
erin
activ
eD
isab
ility
Une
m-
ploy
edEm
ploy
edO
ther
inac
tive
Dis
abili
tyU
nem
-pl
oyed
Empl
oyed
Oth
erin
activ
eD
isab
ility
Une
m-
ploy
edEm
ploy
edO
ther
inac
tive
Dis
abili
tyU
nem
-pl
oyed
Empl
oyed
HS
NHS
HS
NHS
HS
NHS
HS
NHS
HS
NHS
HS
NHS
HS
NHS
HS
NHS
HS
NHS
HS
NHS
HS
NHS
HS
NHS
HS
NHS
HS
NHS
HS
NHS
HS
NHS

4. PATHWAYS ONTO (AND OFF) DISABILITY BENEFITS: ASSESSING THE ROLE OF POLICY AND INDIVIDUAL CIRCUMSTANCES
OECD EMPLOYMENT OUTLOOK 2009 – ISBN 978-92-64-06791-2 – © OECD 2009 231
4. How have countries responded in the area of disability policy?The analysis from the previous sections has shown that, although there are some
common patterns in the characteristics of disability recipients and in the transitions in and
out of disability, there remain significant differences across countries. This suggests that
policy towards disability, including particular features of the disability benefit system, might
have a significant impact on pathways in an out of benefits. In addition, different labour
market conditions may also influence the take-up of disability benefits across countries. This
section explores the characteristics of the benefit-system structure and integration policy for
people with disability, together with how such factors influence disability benefit rates.
4.1. Disability policy indicators in OECD countries
This section describes changes in disability policy across a number of selected OECD
countries during the period 1990 to 2007. Two policy indicators have been constructed (OECD,
2003). The first is an indicator of policies related to the compensation generosity of the system
whereas the second captures the intensity of integration and activation measures for benefit
recipients. The compensation indicator consists of ten sub-components and incorporates
changes in the generosity of benefits, on the screening stringency which may have an impact
on the availability of benefits as well as the duration of benefits (temporary versus permanent)
among others. The integration indicator includes seven sub-components and captures the
availability and in-built incentives for the take-up of vocational rehabilitation and work
programmes (see Box 4.4 for further details). These two indicators capture a comprehensive
selection of disability-related policies and allow for cross-country and over-time comparisons.
Table 4.3. Labour force status of previous disability beneficiariesPercentagea, b, c
Panel A. Labour force status of disability beneficiaries who exit the benefit (excluding retirement)
Panel B. Labour force status of disability beneficiaries who exit the benefit
Australia Germany United Kingdom Australia Germany United Kingdom
1 year after benefit 1 year after benefit
Employed 60.7 12.8 79.6 Employed 52.9 9.3 65.0
Unemployed 10.3 3.0 9.6 Unemployed 9.0 2.2 7.9
Other inactive 29.0 84.2 10.7 Other inactive 25.5 27.0 8.8
Retired 12.7 61.5 18.4
2 years after benefit 2 years after benefit
Employed 48.8 11.1 66.1 Employed 36.5 6.9 45.3
Unemployed 6.1 3.4 13.3 Unemployed 4.6 2.1 9.1
Other inactive 45.1 85.6 20.7 Other inactive 33.8 37.9 14.2
Retired 25.1 53.2 31.4
3 years after benefit 3 years after benefit
Employed 40.7 10.4 61.2 Employed 22.4 5.5 35.0
Unemployed 5.4 3.8 11.7 Unemployed 3.0 2.1 6.7
Other inactive 53.9 85.8 27.1 Other inactive 29.6 46.6 15.5
Retired 45.1 45.8 42.9
a) Samples include persons present in at least three consecutive waves, not in full-time education, and aged 15-64 in Australia and theUnited Kingdom; 16-64 in Germany.
b) The years considered for each country are given in note c) of Figure 4.4.c) The numbers for Switzerland are not reported in the table because of the small number of observations which does not allow further
disaggregation.Source: OECD estimates based on the HILDA for Australia, the GSOEP for Germany and the BHPS for the United Kingdom.
1 2 http://dx.doi.org/10.1787/708030162037

4. PATHWAYS ONTO (AND OFF) DISABILITY BENEFITS: ASSESSING THE ROLE OF POLICY AND INDIVIDUAL CIRCUMSTANCES
OECD EMPLOYMENT OUTLOOK 2009 – ISBN 978-92-64-06791-2 – © OECD 2009232
Figure 4.7 shows that there is significant variation across countries in both compensation
and the integration indicators. Overall, the Nordic countries, together with Switzerland, rank
highest in terms of the level of compensation policy. Many Anglo-Saxon countries and Korea
are found at the other end of the compensation rank. The integration indicator shows less
dispersion across countries but countries have a very different ranking than when looking at
the compensation indicator. Some Nordic countries have high levels of integration policy, as do
Germany. Among those with the lowest levels of integration policy are a diverse group of
countries, including Ireland, New Zealand and Portugal.
The stance of policies has changed slightly between 1990 and 2007 in some
countries, with Luxembourg and the Netherlands seeing large decreases in
compensation levels (Figure 4.8). In addition, most efforts during the past two decades
were directed at strengthening the integration component of disability while weakening
its compensation aspect.
Box 4.4. Policy indicators
Two policy indicators are constructed: the first on compensation measures or benefittransfer programmes, and the second on employment or integration measures. Theseindicators were originally constructed for the Transforming Disability into Ability (OECD, 2003)for three years. They have been extended to cover the period between 1990 and 2007 andhave been slightly modified for the purpose of the regression analysis. Each of the twoindicators is composed of various sub-components. Each sub-component is measuredaccording to a predefined quantitative and/or qualitative scale, resulting in a certain numberof points, ranging from zero to five points for each sub-component. The points for eachsub-component are added to obtain the overall score for each indicator; hence, eachsub-component receives the same weight. Correlation and internal consistency tests havebeen performed and have revealed no particular problems with the chosen subcomponents.
The compensation dimension is split into the following ten sub-components: i) coverage;
ii) minimum disability level that open up benefit entitlement; iii) disability level for fullbenefit; iv) maximum benefit level (in terms of replacement rate for average earnings with acontinuous work record); v) permanence of benefits (from strictly permanent to strictlytemporary); vi) medical assessment (from exclusive responsibility of treating doctors to thatof teams of insurance doctors); vii) vocational assessment (from strict own-occupationassessment to all jobs available); viii) sickness benefit level (distinguishing short- and long-term sickness absence); ix) sickness benefit duration (including the period of continued wagepayment); and x) sickness monitoring (distinguishing from no checks on sickness absence tostrict steps for monitoring and early intervention). In each of these sub-dimensions, ahigher score means easier access, higher benefit levels, longer duration, etc.
The integration dimension refers to the whole range of employment and rehabilitationmeasures, and distinguishes between the following seven sub-dimensions: i) anti-
discrimination legislation covering employer responsibility for work retention andaccommodation; ii) supported employment programme (extent, permanence and flexibility);iii) subsidised employment; iv) sheltered employment sector (extent and transitory nature);v) vocational rehabilitation programme (obligation and extent of spending); vi) benefitsuspension regulations (from considerable duration to non-existent); and vii) additionalwork incentives (including possibilities to combine work and benefit receipt). In each of thesub-dimensions, a higher score indicates a more active approach.
The criteria for each sub-component are spelled out in detail in Annex 4.A2.

4. PATHWAYS ONTO (AND OFF) DISABILITY BENEFITS: ASSESSING THE ROLE OF POLICY AND INDIVIDUAL CIRCUMSTANCES
OECD EMPLOYMENT OUTLOOK 2009 – ISBN 978-92-64-06791-2 – © OECD 2009 233
In terms of integration policy, countries have tackled several aspects over time. Almost
all countries have strengthened employers’ obligations towards people with disability
with the introduction of anti-discrimination legislation. Exceptions to this trend include
Belgium, Denmark and Korea. In Finland, Norway and the Netherlands, employers
obligations have increased substantially but the most important obligations for employers
are found in Sweden where the Working Environment Act and the Anti-discrimination
legislation impose accommodation obligations for employers without explicit differences
between employees and new job applicants. Taking into account total financial
responsibilities of the employers, the Netherlands scores high given the high cost of
sickness benefits that have to be borne by employers but this element is also partially
captured in the sickness sub-component (see below) while employers’ responsibility
focuses more on legal protection of workers with disabilities.
Figure 4.7. Ranking of countries according to disability policy indicators, 2007
Source: Secretariat estimates based on information from national authorities as well as OECD (2006, 2007 and 2008b),Sickness, Disability and Work: Breaking the Barriers (Vol. 1-3), Paris.
1 2 http://dx.doi.org/10.1787/707688534271
40
35
30
25
20
15
10
5
0
KOR
NZL IR
L N
LD C
AN G
BR A
UT A
US E
SP L
UX U
SA B
EL P
OL D
EU D
NK P
RT C
HE FI
N N
OR S
WE
30
25
20
15
10
5
0
PRT
IRL
NZL
ESP
KOR
POL
BEL
CHE
LUX
AUS
AUT
CAN
USA
GBR
SWE
NLD FI
N N
OR D
NK D
EU
Panel A. Compensation index ranking (from less generous to most generous)
Compensation index OECD average
Panel B. Integration index ranking (from less active to most active)
Integration index OECD average

4. PATHWAYS ONTO (AND OFF) DISABILITY BENEFITS: ASSESSING THE ROLE OF POLICY AND INDIVIDUAL CIRCUMSTANCES
OECD EMPLOYMENT OUTLOOK 2009 – ISBN 978-92-64-06791-2 – © OECD 2009234
A substantial number of countries have also increased the range of employment
programmes available to people with disabilities. Many countries launched special supported
programmes and wage-subsidies during the early 1990s. Norway, Poland and Sweden have
improved the opportunities for sheltered employment substantially. Poland, for instance, has
developed a large-scale labour market with sheltered work enterprises that receive a large
subsidy and employ almost four in ten people with disability (OECD, 2006). Poland has also
expanded greatly subsidized employment similarly to Belgium and Denmark. In the later,
generous wage-subsidies are provided for people who cannot perform their work under
normal conditions (OECD, 2008b). The advantageous conditions and the lack of monitoring led
in the past to large increases in the number of people holding such jobs (the conditions have
been modified recently). Another set of countries including Finland and Austria in particular
have concentrated on improving access to supported employment. The Austrian supported
employment programme was launched on a trial basis since 1992 and became fully
operational in 1999. It includes job assistants to support the transition between the school or
the vocational education and the job, as well as counseling and coaching for career planning
and job interviews, and final support and follow-up in the company.
Other countries have focused on increasing rehabilitation options at an early stage or
promoting work incentives for people on disability benefits by making it easier for them to
work and/or earn more income while at work while combining it with benefits. The
Netherlands has dramatically expanded vocational rehabilitation, which was optional and
only for disability beneficiaries until 1997. Austria, Finland and Norway among others have
followed the same. People with disabilities in Norway have access to a wide range of
services and 85% of programmes offered to them are vocational rehabilitation measures
(OECD, 2006). Promotion of work incentives has happened primarily in the Netherlands
and the United Kingdom. The latter country has taken a more active approach towards
providing work-incentives with the Disabled Person’s Tax Credit, which started in 1999 and
was merged into the Working Tax Credit in 2002. In addition, a new temporary earnings
supplement was introduced stepwise in 2003: the Return-to-Work-Credit. Both constitute
a wage top-up for people with disability in low-paid employment and were created
Figure 4.8. Changes in disability policies
Source: Secretariat estimates based on information from national authorities as well as OECD (2006, 2007 and 2008b),Sickness, Disability and Work: Breaking the Barriers (Vol. 1-3), Paris.
1 2 http://dx.doi.org/10.1787/707743354142
AUS AUT BEL CAN CHE DEU DNK ESP FIN IRLGBR KOR LUX NLD NOR NZL POL PRT SWE USA
20
15
10
5
0
-5
-10
-15
-20
Integration policy change 1999-2007Compensation policy change 1999-2007
Integration policy change 1990-99Compensation policy change 1990-99
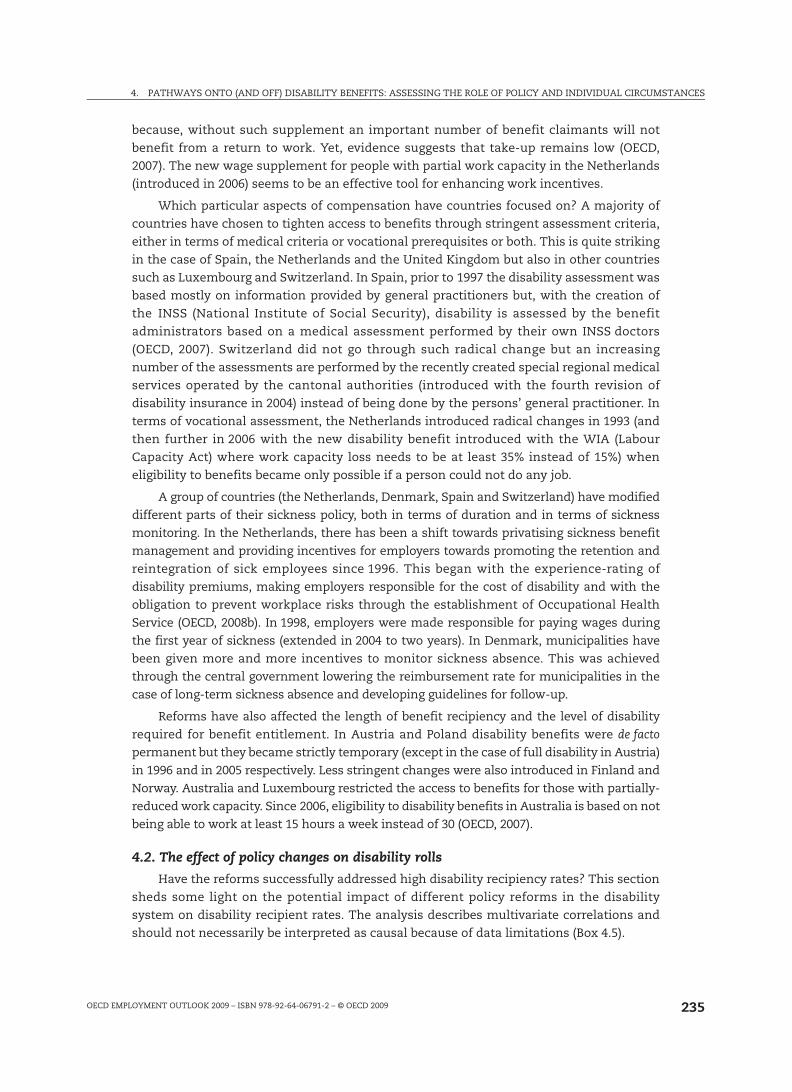
4. PATHWAYS ONTO (AND OFF) DISABILITY BENEFITS: ASSESSING THE ROLE OF POLICY AND INDIVIDUAL CIRCUMSTANCES
OECD EMPLOYMENT OUTLOOK 2009 – ISBN 978-92-64-06791-2 – © OECD 2009 235
because, without such supplement an important number of benefit claimants will not
benefit from a return to work. Yet, evidence suggests that take-up remains low (OECD,
2007). The new wage supplement for people with partial work capacity in the Netherlands
(introduced in 2006) seems to be an effective tool for enhancing work incentives.
Which particular aspects of compensation have countries focused on? A majority of
countries have chosen to tighten access to benefits through stringent assessment criteria,
either in terms of medical criteria or vocational prerequisites or both. This is quite striking
in the case of Spain, the Netherlands and the United Kingdom but also in other countries
such as Luxembourg and Switzerland. In Spain, prior to 1997 the disability assessment was
based mostly on information provided by general practitioners but, with the creation of
the INSS (National Institute of Social Security), disability is assessed by the benefit
administrators based on a medical assessment performed by their own INSS doctors
(OECD, 2007). Switzerland did not go through such radical change but an increasing
number of the assessments are performed by the recently created special regional medical
services operated by the cantonal authorities (introduced with the fourth revision of
disability insurance in 2004) instead of being done by the persons’ general practitioner. In
terms of vocational assessment, the Netherlands introduced radical changes in 1993 (and
then further in 2006 with the new disability benefit introduced with the WIA (Labour
Capacity Act) where work capacity loss needs to be at least 35% instead of 15%) when
eligibility to benefits became only possible if a person could not do any job.
A group of countries (the Netherlands, Denmark, Spain and Switzerland) have modified
different parts of their sickness policy, both in terms of duration and in terms of sickness
monitoring. In the Netherlands, there has been a shift towards privatising sickness benefit
management and providing incentives for employers towards promoting the retention and
reintegration of sick employees since 1996. This began with the experience-rating of
disability premiums, making employers responsible for the cost of disability and with the
obligation to prevent workplace risks through the establishment of Occupational Health
Service (OECD, 2008b). In 1998, employers were made responsible for paying wages during
the first year of sickness (extended in 2004 to two years). In Denmark, municipalities have
been given more and more incentives to monitor sickness absence. This was achieved
through the central government lowering the reimbursement rate for municipalities in the
case of long-term sickness absence and developing guidelines for follow-up.
Reforms have also affected the length of benefit recipiency and the level of disability
required for benefit entitlement. In Austria and Poland disability benefits were de facto
permanent but they became strictly temporary (except in the case of full disability in Austria)
in 1996 and in 2005 respectively. Less stringent changes were also introduced in Finland and
Norway. Australia and Luxembourg restricted the access to benefits for those with partially-
reduced work capacity. Since 2006, eligibility to disability benefits in Australia is based on not
being able to work at least 15 hours a week instead of 30 (OECD, 2007).
4.2. The effect of policy changes on disability rolls
Have the reforms successfully addressed high disability recipiency rates? This section
sheds some light on the potential impact of different policy reforms in the disability
system on disability recipient rates. The analysis describes multivariate correlations and
should not necessarily be interpreted as causal because of data limitations (Box 4.5).

4. PATHWAYS ONTO (AND OFF) DISABILITY BENEFITS: ASSESSING THE ROLE OF POLICY AND INDIVIDUAL CIRCUMSTANCES
OECD EMPLOYMENT OUTLOOK 2009 – ISBN 978-92-64-06791-2 – © OECD 2009236
Features of the benefit system play a major role in depressing labour force
participation by reducing the willingness to work or to engage in job search not only for
disability beneficiaries but also for current job holders with or without disability. Increased
programme availability and generosity, measured by changes in the real value of benefits
or the replacement rate, modify the relative advantage of working versus not working and
Box 4.5. Accounting for changes in disability rates
Longitudinal data for 19 OECD countries from 1990 to 2007 are used to assess thepossible link between different disability policies on the one hand and disability rates onthe other. The analysis uses a quasi-experimental set-up exploiting the different timingand nature of the reforms across countries.
The data for the annual number of disability benefit recipients is obtained fromadministrative records. Although the use of inflow into disability data (number of newannual recipients) would be more appropriate, the lack of such data for most countries inthe period studied, dictated the use of stock data on disability recipiency rates. The caveatabout stock data is that they are less responsive to labour market conditions and policychanges as they reflect, to a large extent, past inflows into disability and high persistencein disability. Additionally, the limited time coverage of the data prevents capturing thelong-term evolution of disability policies and their long-term impact on disabilityoutcomes. Besides, disability policy reforms are likely to affect the behavior of individualsonly with lags, but available data do not really allow to capture these lagged effects ondisability outcomes.
The following equation is estimated by population-weighted least squares on anunbalanced panel (standard errors are clustered at the country level):
where i and t refer to country i and time t. Disability rates (DR) are modeled as a function ofthe two policy indicators discussed above, the compensation policy indicator (CP) and theintegration policy indicator (IP), with some controls for economic conditions anddemographic trends (U). Pre-existing differences across countries are accounted forthrough the inclusion of country-fixed-effects (C). Female labour participation rates, shareof people aged 55 and above in the population and the share of employment inmanufacturing are used as controls for economic conditions and demographic trends. Inparticular the share of jobs in manufacturing is used as a proxy for structural changes inthe economy. GDP per capita is capturing a wealth effect. Gross replacement rates forunemployment are used as a crude measure of alternative benefit options (see Annex 4.A3for a description of the data sources).
Labour market factors may play an important role in explaining changes in disabilityrecipiency rates since decreases in work options or work options that are low paid arefound to be a major explanation for lower participation rates for the low-skilled and higherapplications to disability benefits (Autor and Duggan, 2003; Faggio and Nickell, 2005).Unfortunately, labour demand and alternative benefit options (e.g. early retirement) arenot controlled for in this analysis because of the lack of appropriate indicators. Usingunemployment rates could proxy for labour demand conditions, but it may also becapturing the effect of economic changes in addition to the relative attractiveness ofunemployment versus disability benefits. Concerns about using time-series data for suchanalysis exist (Disney and Webb, 1991) and would be particularly problematic given theshort time-span and the cross-country nature of the data.
itiititittit tCIPCPUDR

4. PATHWAYS ONTO (AND OFF) DISABILITY BENEFITS: ASSESSING THE ROLE OF POLICY AND INDIVIDUAL CIRCUMSTANCES
OECD EMPLOYMENT OUTLOOK 2009 – ISBN 978-92-64-06791-2 – © OECD 2009 237
reduce the labour-force attachment. The results show that the overall compensation
features of disability policy matter as they are positively related to the number of disability
beneficiaries. The effect of compensation policy holds after controlling for a range of
economic conditions, although it is significantly reduced.6 At the same time, integration
policy has a modest and non significant effect in reducing the percentage of disability
recipients. One explanation for the insignificant effect of integration is that such policies
may take longer to have an impact on disability rates, especially when the focus is on the
stock of disability benefit recipients, as in the present analysis.
Table 4.4. What explains changes in disability rates?Fixed-effect regression coefficientsa, b, c
I II III IV V
Indicators
Compensation indicator 0.117*** 0.081**
Integration indicator –0.007 –0.011
Economic conditions
GDP per capita 0.001*** 0.001*** 0.001***
Female labour force participation 0.054 0.082*** 0.023
Share of persons aged 55 and more in population 0.057 0.282*** 0.189***
Share of manufacturing –0.150** –0.145** –0.151**
Gross replacement rate –3.604*
Detailed policy indicators
Benefit accessibility/generosity 0.134** 0.184*** 0.185***
Medical and vocational assessment 0.004 –0.160*** –0.149***
Sickness indicator 0.136* 0.245*** 0.211***
Anti-discrimination legislation 0.175** 0.172** 0.131*
Vocational rehabilitation programme –0.384** –0.239* –0.216*
Sheltered/subsidised/supported –0.159*** –0.115*** –0.117***
Incentives indicator 0.010 –0.125*** –0.152***
Constant –0.102 0.684 –4.945 –10.002*** –3.806
Observations 330 330 300 300 277
R-squared 0.928 0.942 0.938 0.958 0.956
*, **, *** statistically significant at the 10%, 5%, 1% level, respectively.a) The dependent variable is annual disability rates in 19 OECD countries (Australia, Austria, Belgium, Canada,
Denmark, Finland, Germany, Ireland, Korea, Luxembourg, the Netherlands, Norway, Poland, Portugal, Spain,Sweden, Switzerland, the United Kingdom and the United States) in the period 1990-2007. The following years areincluded for every country: 1994-2007 for Austria; 1990-2007, for Australia, Belgium, Denmark, Finland, theUnited Kingdom, Ireland, the Netherlands, Norway, Portugal and Sweden; 1996-2006 for Canada; 1996-2007 forSwitzerland; 1995-2007 for Germany and Spain; 1995-2006 for Korea; 1990-2005 for Luxembourg; and1990-2006 for the United States.
b) The description of all the variables used in the regressions is provided in the Annex 4.A3. All regressions also includeyear and country dummies and are weighted by population. Differences in the sample size can be explained by thenon-availability of certain economic indicators and gross replacement rates for some of the countries.
c) The detailed policy indicators used in this table group the sub-components described in Annex 4.A2 intomeaningful sub-indicators. Benefit accessibility/generosity includes coverage, minimum disability level,disability level for full benefit, maximum benefit level and permanence of benefits. Medical and vocationalassessment includes those two components, whereas the sickness indicator includes sickness benefit level,sickness benefit duration and sickness monitoring. The choice of these sub-components is based on the lowcorrelation that exists between them and the fact that they cover a broad range of elements.
Source: OECD estimates based on OECD Economic Outlook Database, OECD Labour Force Statistics, Labour Force Surveyfor Australia and OECD STAN Database for all other countries. Disability rates are based on Secretariat estimates basedon information from national authorities as well as OECD (2006, 2007 and 2008b), Sickness, Disability and Work: Breakingthe Barriers (Vol. 1-3), Paris.
1 2 http://dx.doi.org/10.1787/708032764768

4. PATHWAYS ONTO (AND OFF) DISABILITY BENEFITS: ASSESSING THE ROLE OF POLICY AND INDIVIDUAL CIRCUMSTANCES
OECD EMPLOYMENT OUTLOOK 2009 – ISBN 978-92-64-06791-2 – © OECD 2009238
In terms of the specific characteristics of the compensation and integration policies, some
aspects have a greater impact. It appears that accessibility to disability programmes and
generosity are positively associated with disability rates. A more generous and lenient (in
terms of sickness monitoring) sickness policy also contributes to higher disability levels. The
way in which disability is assessed does not have the expected effect on the number of
beneficiaries. This might be driven by the fact that changes in the assessment process take a
long time to be implemented. Additionally, capturing the assessment process with a simplified
scale is subject to measurement problems. With respect to integration, employment
programmes and vocational rehabilitation have a substantial influence in decreasing the
number of persons receiving a disability benefit. The promotion of work incentives also
contributes to reduced levels of disability recipiency rates. On the other hand, anti-
discrimination legislation is associated with higher shares of recipients. Evidence from the
effects of anti-discrimination legislation in other studies (mainly for the United States) shows
mixed results in terms of employment outcomes of people with disability (DeLeire, 2000;
Acemoglu and Angrist, 2001; Beegle and Stock, 2003; Jolls and Prescott, 2004). One plausible
explanation is that such legislation, while protecting workers in existing employment, may
hinder the hiring of workers with health problems. Adding gross replacement rates as a crude
measure of alternative benefit options does not alter significantly the results. A more generous
unemployment benefit is associated with lower disability rates.
The analysis has shown that some elements of disability policies are associated with a
change in disability rates. However, it is difficult to fully account for disability trends since
the decision to apply for disability benefit is not only a function of disability policy but it is
also related to alternative programmes such as unemployment, early retirement and social
assistance (Bound and Burkhauser, 1999). Ideally controls should be added to capture the
alternative options open to potential disability benefit applicants. Unfortunately, an
indicator of the availability and access of such measures, covering a large set of countries
and the period studied is not available.
ConclusionsA large number of OECD countries have seen substantial increases in the share of
disability beneficiaries in the working-age population. Vulnerable groups such as women,
young individuals and the low-skilled are more affected by this trend. Explanations have
to be sought in terms of individual and work characteristics, on one hand, and the
characteristics of the benefit systems, on the other. The evidence in this chapter shows that
the effects of individual and work characteristics are diverse across countries, highlighting
the importance of disability-related policies in understanding the common trends.
Many OECD countries have taken steps to improve employment opportunities for
people with disabilities before they are considered for disability benefits and to promote
work incentives for those already on benefits. They have also improved, in parallel, the
gate-keeping aspects of the systems. At the same time, more needs to be done to support
people at work because participation in employment programmes and, in some cases
rehabilitation, remains voluntary. A few countries have moved into a direction where
disability beneficiaries are offered personalized support and work-focused interviews right
at the start of the process, but mandatory work-focused interviews are in place only in the
United Kingdom.

4. PATHWAYS ONTO (AND OFF) DISABILITY BENEFITS: ASSESSING THE ROLE OF POLICY AND INDIVIDUAL CIRCUMSTANCES
OECD EMPLOYMENT OUTLOOK 2009 – ISBN 978-92-64-06791-2 – © OECD 2009 239
Employers are also key players and labour demand conditions and employment
opportunities for individuals with health problems play a major role in influencing their
decision to enroll in disability benefits. In the past, there has been a temptation to use
disability as a form of early retirement, particularly in the context of faltering labour
demand. In addition, the difficulties countries are facing in the current economic
downturn (see Chapter 1) may push them to stop reforms in the area of disability policy.
Public employment services will face the daunting challenge of providing support to many
more unemployed and they may concentrate first on the easy-to-place cases. This might
have adverse effects on disability beneficiaries and persons with health problems whose
employment opportunities are even lower in economic downturns.
Notes
1. The population on disability benefits is based on the working-age population (generally 20 to 64)receiving disability benefits under contributory and non-contributory schemes. Where personscan receive more than one disability benefit, the overlap has been taken into account. For theUnited States, disability recipients numbers refer to the 18-64, but for the calculation of disabilityrates the population of 20-64 has been used for consistency matters across countries.
2. In Germany, Australia and Switzerland, there are no substantial age differences between men andwomen and across education groups, whereas in the UK low-skilled individuals and men are onaverage older.
3. The results are robust to sensitivity tests including different types of estimations and adding thefollowing additional controls: house ownership, spouse characteristics (age, education, labour forcestatus), parental characteristics when the respondent was a teenager and life events when available.
4. The results of separate regressions for men and women do show in addition that other variableshave a different impact in the transition to a disability benefit by gender. This is the case forinstance of marital status and the number of children which matter more for women.
5. Note that the definition of a health onset is different in Germany (previous hospitalisation insteadof a limiting condition) and this may affect the comparability of the transitions.
6. Several sensitivity tests have been performed, based on disaggregated data by gender and age andexcluding one country at a time. A first difference model produced unstable results because of thereduced sample size.
Bibliography
Acemoglu, D. and J.D. Angrist (2001), “Consequences of Employment Protection? The Case ofAmericans with Disabilities Act”, Journal of Political Economy, Vol. 19, No. 5, pp. 915-950.
Autor, D. and M.G. Duggan (2003), “The Rise in the Disability Rolls and the Decline in Unemployment”,Quarterly Journal of Economics, Vol. 118, No. 1, pp. 157-206.
Begle, K. and A. Stock (2003), “The Labour Market Effects of Disability Discrimination Laws”, Journal ofHuman Resources, Vol. 38, pp. 806-859.
Black, D., K. Daniel and S. Sanders (2002), “The Impact of Economic Conditions on Participation inDisability Programs: Evidence from the Coal Boom and Bust”, American Economic Review, Vol. 92,No. 1, pp. 27-50.
Bound, J. and R.V. Burkhauser (1999), “Economic Analysis of Transfer Programs Targeted on People withDisabilities”, in O. Ashenfelter and D. Card (eds.), Handbook of Labor Economics, Vol. 3, No. 1,Chapter 51, Elsevier, pp. 3417-3528.
Case, A., A. Fertig and C. Paxson (2005), “The Lasting Impact of Childhood Health and Circumstance”,Journal of Health Economics, Vol. 24, No. 2, pp. 365-389.
DeLeire, T. (2000), “The Wage and Employment Effects of the Americans with Disabilities Act”, Journalof Human Resources, Vol. 35, No. 4, pp. 693-715.

4. PATHWAYS ONTO (AND OFF) DISABILITY BENEFITS: ASSESSING THE ROLE OF POLICY AND INDIVIDUAL CIRCUMSTANCES
OECD EMPLOYMENT OUTLOOK 2009 – ISBN 978-92-64-06791-2 – © OECD 2009240
Disney, R. and S. Webb (1991), “Why Are There so Many Long Term Sick in Britain?”, The EconomicJournal, Vol. 101, pp. 252-262.
Faggio, G. and S. Nickell (2005), “Inactivity among Prime Age Men in the UK”, CEP Discussion PaperNo. 673.
Gould, R. (2003), “Disability Pensions in Finland”, in C. Prinz (ed.), European Disability Pension Policies,European Centre Vienna, Ashgate, pp. 165-196.
Jehoel-Gijsbers, G. (ed.) (2007), Beter aan het werk. Trendrapportage ziekteverzuim, arbeidsongeschiktheid enwerkhervatting, Sociaal en Cultureel Planbureau, The Hague.
Jolls, C. and J.J. Prescott (2004), “Disaggregating Employment Protection: The Case of DisabilityDiscrimination”, NBER Working Paper Series No. 10740, Cambridge, Mass.
Marin, B., C. Prinz and M. Queisser (2004), Transforming Disability Welfare Policies towards Work and EqualOpportunities, Ashgate Pub Ltd.
McVicar, D. (2008), “Why Have UK Disability Benefit Rolls Grown So Much?,”Journal of Economic Surveys,Blackwell Publishing, Vol. 22, No. 1, pp. 114-139.
OECD (2003), Transforming Disability into Ability, OECD Publishing, Paris.
OECD (2006), Sickness, Disability and Work (Vol. 1): Norway, Poland and Switzerland, OECD Publishing, Paris.
OECD (2007), Sickness, Disability and Work (Vol. 2): Australia, Luxembourg, Spain and the United Kingdom,OECD Publishing, Paris.
OECD (2008a), OECD Employment Outlook, OECD Publishing, Paris.
OECD (2008b), Sickness, Disability and Work (Vol. 3): Denmark, Finland, Ireland and the Netherlands, OECDPublishing, Paris.
Parent-Thirion, A., E. Fernandez Macias, J. Hurley and G. Vermeylen (2007), Fourth European WorkingConditions Survey, European Foundation for the Improvement of Living Conditions, Office forOfficial Publications of the European Communities, Luxembourg.
Rupp, K. and D.C. Stapleton (1995), “Determinants of the Growth in the Social Security Administration’sDisability Programs – An Overview”, Social Security Bulletin, Vol. 58, No. 4, pp. 43-70.
Smith, J.P. (1999), “Healthy Bodies and Thick Wallets: The Dual Relation between Health and EconomicStatus”, Journal of Economic Perspectives, American Economic Association, Vol. 3, No. 2, pp. 145-166,Spring.
Wooldridge, M. (2002), Econometric Analysis of Cross Section and Panel Data, MIT Press, Cambridge, Mass.

4. PATHWAYS ONTO (AND OFF) DISABILITY BENEFITS: ASSESSING THE ROLE OF POLICY AND INDIVIDUAL CIRCUMSTANCES
OECD EMPLOYMENT OUTLOOK 2009 – ISBN 978-92-64-06791-2 – © OECD 2009 241
ANNEX 4.A1
Analysis of the Effects of Health on Labour Force Status
Data sourcesThe following longitudinal household surveys are used for the analysis. All
longitudinal datasets cover a wide range of subjects including personality traits,
occupational and family biographies, employment, participation and professional,
mobility, earnings and health. We construct complete labour market histories of the
individuals. The labour market histories contain yearly information based on employment
status (employed or non-employed) and the type of benefit individuals are receiving.
Because the data come from surveys and not administrative sources, there might be cases
of overlapping between disability benefit recipiency and employment.
British Household Panel Survey (BHPS) – United KingdomThe British Household Panel Survey1 (BHPS) is a nationally representative household-
based yearly survey which began in 1991, interviewing every adult member of sampled
households. The wave 1 of the panel consists of some 5 500 households and 10 300 individuals.
Additional samples of 1 500 households in both Scotland and Wales were added to the
main sample in 1999, and in 2001 a sample of 2 000 households was added in Northern
Ireland. These same individuals are re-interviewed each successive year and, if they split-
off from original households to form new households, they are followed and all adult
members of these households are also interviewed.
German socio-economic Panel (GSOEP)The German Socio-economic Panel (GSOEP) is an on-going household-based yearly survey
which began in 1984. The first wave consists of 5 921 households containing a total of
12 290 individual respondents who participated in “SOEP West”, containing only West Germany.
In 1990, 2 179 households with 4 453 members were surveyed for the “SOEP East” sample.
Household, Income, Labour Dynamics in Australia (HILDA)Household, Income, Labour Dynamics in Australia (HILDA) is an ongoing household-
based panel survey funded by the Department of Families, Community Services and
Indigenous Affairs. The survey started in 2001 and contains at the moment seven waves.
The wave 1 of the panel consisted of 7 682 households and 19 914 individuals.
Swiss Household Panel (SHP)The Swiss Household Panel2 is an ongoing household panel designed to investigate
trends in social dynamics among the Swiss population. The survey started in 1999 and is
financed by the Swiss national science foundation, the Swiss federal statistical office and

4. PATHWAYS ONTO (AND OFF) DISABILITY BENEFITS: ASSESSING THE ROLE OF POLICY AND INDIVIDUAL CIRCUMSTANCES
OECD EMPLOYMENT OUTLOOK 2009 – ISBN 978-92-64-06791-2 – © OECD 2009242
the University of Neuchatel. It was designed from the start to be compatible with various
national and international surveys. A national representative sample of households was
selected containing around 5 000 households in 1999. Data are collected annually at both
the household and the individual level.
Estimation methodsA discrete-time event history model is used to analyze possible transitions to disability
benefits. Logit specifications are used to parameterize the probabilities of transitions
across the different labour market states.
The probability of entering a disability recipient state is estimated using the
complementary log-log model where the hazard rate is:
or
X refers to certain socio-demographic characteristics including:
● Standard individual characteristics: age, gender, marital status, education, foreign
nationality, or born abroad.
● Household characteristics: number of children, net household income.
● Work characteristics: controls for occupation (ISCO), controls for industry (ISIC), company
size, private/public, contract duration, working hours (e.g. time of the day, shifts).
Health variables (H) are country specific and include:
● Nights spent in hospital (Germany).
● Having a health limitation (Australia, Switzerland, the United Kingdom).
Individual heterogeneity u is controlled for and it is modelled according to a normal
distribution. Sensitivity analysis are performed by estimating the model using a Gamma
distribution.
Sensitivity analysis is performed to test the robustness of the results to the inclusion
of additional variables. Such variables include additional controls for: house ownership,
spouse characteristics (age, education and labour force status), parental characteristics
when the respondant was aged 16 and life events if available. In addition, separate
regressions were estimated by gender and age.
To deal with possible health endogeneity the individual’s health stock variable is
constructed assuming that health is defined by objective health measures:
Such health stock is not observed in the data but a self-reported health status measure
is (as a categorical variable with five states). The latent health stock, using self-assessed
health will be a function of true health stock and an error term. The latent health stock can
then be estimated as a function of objective measures of health using an ordered probit:
Multinomial logit
The model also analyses multiple destination and is also estimated for transitions
across five states as a multinomial logit instead of simple logit.
)])(exp(exp[1),( ''iitit utDHXXth
iitit utDHXXth )()]),(1log[log( ''
ititit vZ '
ititit
itititit
ZH
vZH
'*
'* ][

4. PATHWAYS ONTO (AND OFF) DISABILITY BENEFITS: ASSESSING THE ROLE OF POLICY AND INDIVIDUAL CIRCUMSTANCES
OECD EMPLOYMENT OUTLOOK 2009 – ISBN 978-92-64-06791-2 – © OECD 2009 243
The labour force states are coded: employment, receiving unemployment benefits,
receiving a disability benefit, retirement, or not working and not receiving a benefit. In each
year the individual can move between the different labour market states.
Other personal characteristics and prior labour market experience may influence,
along with health, transitions across labour market states. A multivariate analysis is
performed to test for different factors influencing pathways to non-employment. The table
below (Table 4.A1.1) provides relative risk ratio estimates from multinomial logit models of
the probability of being unemployed, receiving a disability-related benefit, being retired on
in other type of inactivity, relative to the probability of being in employment. These
regressions test the robustness of the simple transitions, while controlling for other
individual characteristics.
Dynamic modelDynamic random effects probit is used to estimated probability of employment after
experiencing a health problem.
Dynamic estimation is used because of state dependence whereby the probability of
currently being employed depends on past employment status. A dynamic panel probit is
specified, where the probability of being employed for an individual i at time t conditional
on the regressors and the individual effect is:
In estimating the dynamic model, the problem of initial conditions needs to be taken
into account: an individual’s disability status at the start of the panel is not randomly
distributed and will be influenced by unobservable individual heterogeneity. Following
Wooldridge (2002), the distribution of the individual effects is parameterised as a linear
function of the initial employment status at the first wave of the panel and of the time
means of the regressors, assuming that it has a conditional normal distribution:
Therefore the probability of being employed based on the regressors and the
individual effect becomes:
The dynamic random effects estimation relies on the assumption of strict exogeneity
of the explanatory variables conditional on i. There might be a problem of reverse
causality with current employment status affecting future health status. Because strict
exogeneity is not guaranteed in this estimation as current employment status may affect
future health problems, the model is estimated using pooled probit. Using a pooled
dynamic probit model, consistent (yet inefficient) estimates are obtained because it only
relies on contemporaneous exogeneity.
Notes
1. The BHPS was obtained through the UK data archive (www.data–archive.uk).
2. This study has been realized using the data collected in the “Living in Switzerland” project,conducted by the Swiss Household Panel (SHP), which is based at the Swiss Foundation forResearch in Social Sciences FORS, University of Lausanne. The project is financed by the SwissNational Science Foundation.
)(),,|1Pr( '''11 iitititiititit HXdXdd
iiii Xdc ''_
00
)''(),,|1Pr(_
00''
11 iiiititiititit XdcXdXdd
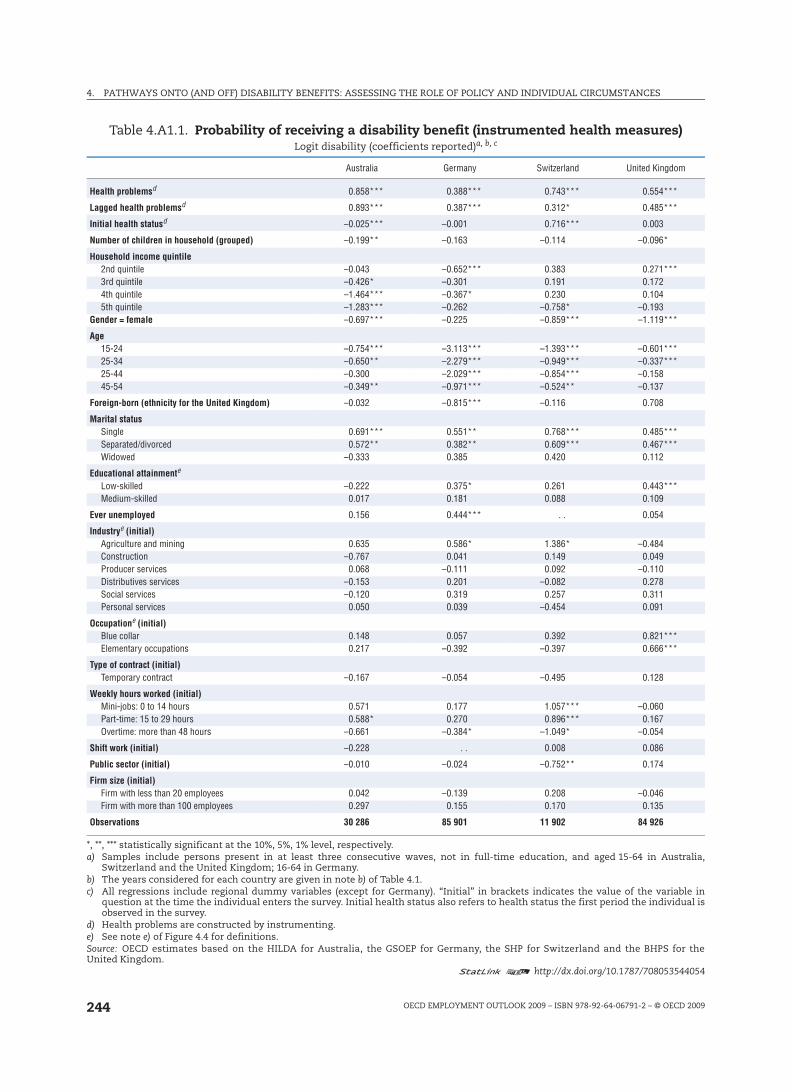
4. PATHWAYS ONTO (AND OFF) DISABILITY BENEFITS: ASSESSING THE ROLE OF POLICY AND INDIVIDUAL CIRCUMSTANCES
OECD EMPLOYMENT OUTLOOK 2009 – ISBN 978-92-64-06791-2 – © OECD 2009244
Table 4.A1.1. Probability of receiving a disability benefit (instrumented health measures)Logit disability (coefficients reported)a, b, c
Australia Germany Switzerland United Kingdom
Health problemsd 0.858*** 0.388*** 0.743*** 0.554***
Lagged health problemsd 0.893*** 0.387*** 0.312* 0.485***
Initial health statusd –0.025*** –0.001 0.716*** 0.003
Number of children in household (grouped) –0.199** –0.163 –0.114 –0.096*
Household income quintile2nd quintile –0.043 –0.652*** 0.383 0.271***3rd quintile –0.426* –0.301 0.191 0.1724th quintile –1.464*** –0.367* 0.230 0.1045th quintile –1.283*** –0.262 –0.758* –0.193
Gender = female –0.697*** –0.225 –0.859*** –1.119***
Age15-24 –0.754*** –3.113*** –1.393*** –0.601***25-34 –0.650** –2.279*** –0.949*** –0.337***25-44 –0.300 –2.029*** –0.854*** –0.15845-54 –0.349** –0.971*** –0.524** –0.137
Foreign-born (ethnicity for the United Kingdom) –0.032 –0.815*** –0.116 0.708
Marital statusSingle 0.691*** 0.551** 0.768*** 0.485***Separated/divorced 0.572** 0.382** 0.609*** 0.467***Widowed –0.333 0.385 0.420 0.112
Educational attainmente
Low-skilled –0.222 0.375* 0.261 0.443***Medium-skilled 0.017 0.181 0.088 0.109
Ever unemployed 0.156 0.444*** . . 0.054
Industrye (initial)Agriculture and mining 0.635 0.586* 1.386* –0.484Construction –0.767 0.041 0.149 0.049Producer services 0.068 –0.111 0.092 –0.110Distributives services –0.153 0.201 –0.082 0.278Social services –0.120 0.319 0.257 0.311Personal services 0.050 0.039 –0.454 0.091
Occupatione (initial)Blue collar 0.148 0.057 0.392 0.821***Elementary occupations 0.217 –0.392 –0.397 0.666***
Type of contract (initial)Temporary contract –0.167 –0.054 –0.495 0.128
Weekly hours worked (initial)Mini-jobs: 0 to 14 hours 0.571 0.177 1.057*** –0.060Part-time: 15 to 29 hours 0.588* 0.270 0.896*** 0.167Overtime: more than 48 hours –0.661 –0.384* –1.049* –0.054
Shift work (initial) –0.228 . . 0.008 0.086
Public sector (initial) –0.010 –0.024 –0.752** 0.174
Firm size (initial)Firm with less than 20 employees 0.042 –0.139 0.208 –0.046Firm with more than 100 employees 0.297 0.155 0.170 0.135
Observations 30 286 85 901 11 902 84 926
*, **, *** statistically significant at the 10%, 5%, 1% level, respectively.a) Samples include persons present in at least three consecutive waves, not in full-time education, and aged 15-64 in Australia,
Switzerland and the United Kingdom; 16-64 in Germany.b) The years considered for each country are given in note b) of Table 4.1.c) All regressions include regional dummy variables (except for Germany). “Initial” in brackets indicates the value of the variable in
question at the time the individual enters the survey. Initial health status also refers to health status the first period the individual isobserved in the survey.
d) Health problems are constructed by instrumenting.e) See note e) of Figure 4.4 for definitions.Source: OECD estimates based on the HILDA for Australia, the GSOEP for Germany, the SHP for Switzerland and the BHPS for theUnited Kingdom.
1 2 http://dx.doi.org/10.1787/708053544054
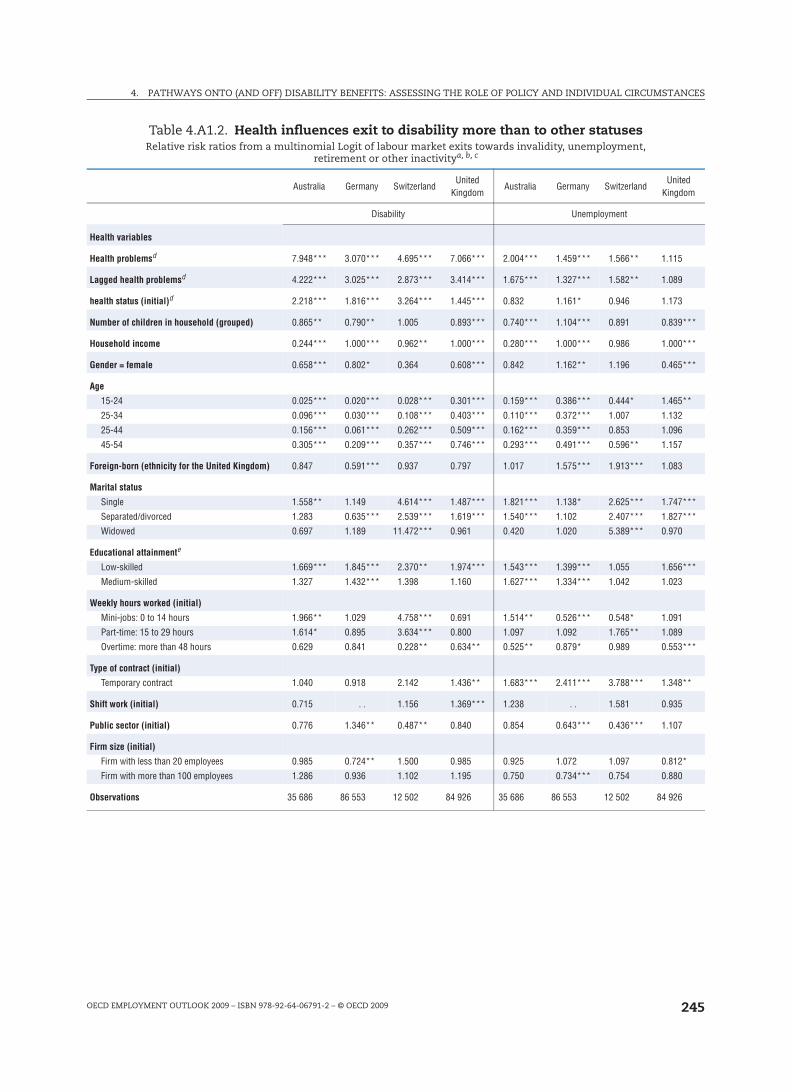
4. PATHWAYS ONTO (AND OFF) DISABILITY BENEFITS: ASSESSING THE ROLE OF POLICY AND INDIVIDUAL CIRCUMSTANCES
OECD EMPLOYMENT OUTLOOK 2009 – ISBN 978-92-64-06791-2 – © OECD 2009 245
Table 4.A1.2. Health influences exit to disability more than to other statusesRelative risk ratios from a multinomial Logit of labour market exits towards invalidity, unemployment,
retirement or other inactivitya, b, c
Australia Germany SwitzerlandUnited
KingdomAustralia Germany Switzerland
United Kingdom
Disability Unemployment
Health variables
Health problemsd 7.948*** 3.070*** 4.695*** 7.066*** 2.004*** 1.459*** 1.566** 1.115
Lagged health problemsd 4.222*** 3.025*** 2.873*** 3.414*** 1.675*** 1.327*** 1.582** 1.089
health status (initial)d 2.218*** 1.816*** 3.264*** 1.445*** 0.832 1.161* 0.946 1.173
Number of children in household (grouped) 0.865** 0.790** 1.005 0.893*** 0.740*** 1.104*** 0.891 0.839***
Household income 0.244*** 1.000*** 0.962** 1.000*** 0.280*** 1.000*** 0.986 1.000***
Gender = female 0.658*** 0.802* 0.364 0.608*** 0.842 1.162** 1.196 0.465***
Age
15-24 0.025*** 0.020*** 0.028*** 0.301*** 0.159*** 0.386*** 0.444* 1.465**
25-34 0.096*** 0.030*** 0.108*** 0.403*** 0.110*** 0.372*** 1.007 1.132
25-44 0.156*** 0.061*** 0.262*** 0.509*** 0.162*** 0.359*** 0.853 1.096
45-54 0.305*** 0.209*** 0.357*** 0.746*** 0.293*** 0.491*** 0.596** 1.157
Foreign-born (ethnicity for the United Kingdom) 0.847 0.591*** 0.937 0.797 1.017 1.575*** 1.913*** 1.083
Marital status
Single 1.558** 1.149 4.614*** 1.487*** 1.821*** 1.138* 2.625*** 1.747***
Separated/divorced 1.283 0.635*** 2.539*** 1.619*** 1.540*** 1.102 2.407*** 1.827***
Widowed 0.697 1.189 11.472*** 0.961 0.420 1.020 5.389*** 0.970
Educational attainmente
Low-skilled 1.669*** 1.845*** 2.370** 1.974*** 1.543*** 1.399*** 1.055 1.656***
Medium-skilled 1.327 1.432*** 1.398 1.160 1.627*** 1.334*** 1.042 1.023
Weekly hours worked (initial)
Mini-jobs: 0 to 14 hours 1.966** 1.029 4.758*** 0.691 1.514** 0.526*** 0.548* 1.091
Part-time: 15 to 29 hours 1.614* 0.895 3.634*** 0.800 1.097 1.092 1.765** 1.089
Overtime: more than 48 hours 0.629 0.841 0.228** 0.634** 0.525** 0.879* 0.989 0.553***
Type of contract (initial)
Temporary contract 1.040 0.918 2.142 1.436** 1.683*** 2.411*** 3.788*** 1.348**
Shift work (initial) 0.715 . . 1.156 1.369*** 1.238 . . 1.581 0.935
Public sector (initial) 0.776 1.346** 0.487** 0.840 0.854 0.643*** 0.436*** 1.107
Firm size (initial)
Firm with less than 20 employees 0.985 0.724** 1.500 0.985 0.925 1.072 1.097 0.812*
Firm with more than 100 employees 1.286 0.936 1.102 1.195 0.750 0.734*** 0.754 0.880
Observations 35 686 86 553 12 502 84 926 35 686 86 553 12 502 84 926
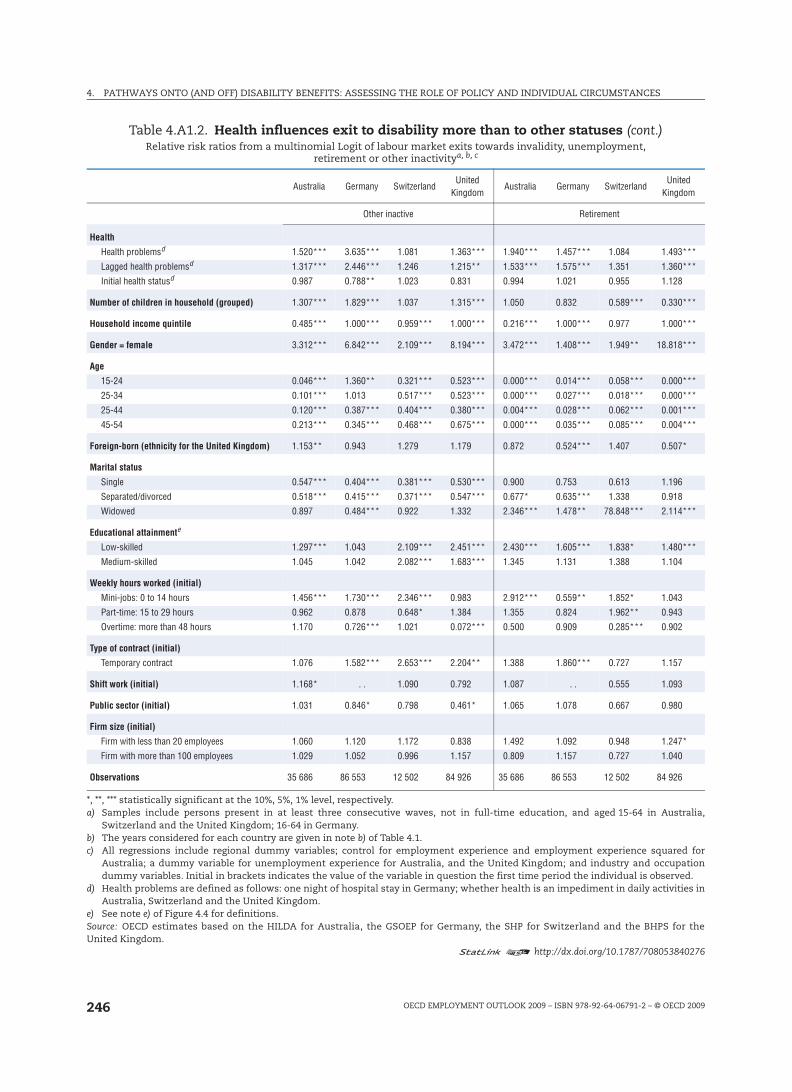
4. PATHWAYS ONTO (AND OFF) DISABILITY BENEFITS: ASSESSING THE ROLE OF POLICY AND INDIVIDUAL CIRCUMSTANCES
OECD EMPLOYMENT OUTLOOK 2009 – ISBN 978-92-64-06791-2 – © OECD 2009246
Other inactive Retirement
Health
Health problemsd 1.520*** 3.635*** 1.081 1.363*** 1.940*** 1.457*** 1.084 1.493***
Lagged health problemsd 1.317*** 2.446*** 1.246 1.215** 1.533*** 1.575*** 1.351 1.360***
Initial health statusd 0.987 0.788** 1.023 0.831 0.994 1.021 0.955 1.128
Number of children in household (grouped) 1.307*** 1.829*** 1.037 1.315*** 1.050 0.832 0.589*** 0.330***
Household income quintile 0.485*** 1.000*** 0.959*** 1.000*** 0.216*** 1.000*** 0.977 1.000***
Gender = female 3.312*** 6.842*** 2.109*** 8.194*** 3.472*** 1.408*** 1.949** 18.818***
Age
15-24 0.046*** 1.360** 0.321*** 0.523*** 0.000*** 0.014*** 0.058*** 0.000***
25-34 0.101*** 1.013 0.517*** 0.523*** 0.000*** 0.027*** 0.018*** 0.000***
25-44 0.120*** 0.387*** 0.404*** 0.380*** 0.004*** 0.028*** 0.062*** 0.001***
45-54 0.213*** 0.345*** 0.468*** 0.675*** 0.000*** 0.035*** 0.085*** 0.004***
Foreign-born (ethnicity for the United Kingdom) 1.153** 0.943 1.279 1.179 0.872 0.524*** 1.407 0.507*
Marital status
Single 0.547*** 0.404*** 0.381*** 0.530*** 0.900 0.753 0.613 1.196
Separated/divorced 0.518*** 0.415*** 0.371*** 0.547*** 0.677* 0.635*** 1.338 0.918
Widowed 0.897 0.484*** 0.922 1.332 2.346*** 1.478** 78.848*** 2.114***
Educational attainmente
Low-skilled 1.297*** 1.043 2.109*** 2.451*** 2.430*** 1.605*** 1.838* 1.480***
Medium-skilled 1.045 1.042 2.082*** 1.683*** 1.345 1.131 1.388 1.104
Weekly hours worked (initial)
Mini-jobs: 0 to 14 hours 1.456*** 1.730*** 2.346*** 0.983 2.912*** 0.559** 1.852* 1.043
Part-time: 15 to 29 hours 0.962 0.878 0.648* 1.384 1.355 0.824 1.962** 0.943
Overtime: more than 48 hours 1.170 0.726*** 1.021 0.072*** 0.500 0.909 0.285*** 0.902
Type of contract (initial)
Temporary contract 1.076 1.582*** 2.653*** 2.204** 1.388 1.860*** 0.727 1.157
Shift work (initial) 1.168* . . 1.090 0.792 1.087 . . 0.555 1.093
Public sector (initial) 1.031 0.846* 0.798 0.461* 1.065 1.078 0.667 0.980
Firm size (initial)
Firm with less than 20 employees 1.060 1.120 1.172 0.838 1.492 1.092 0.948 1.247*
Firm with more than 100 employees 1.029 1.052 0.996 1.157 0.809 1.157 0.727 1.040
Observations 35 686 86 553 12 502 84 926 35 686 86 553 12 502 84 926
*, **, *** statistically significant at the 10%, 5%, 1% level, respectively.a) Samples include persons present in at least three consecutive waves, not in full-time education, and aged 15-64 in Australia,
Switzerland and the United Kingdom; 16-64 in Germany.b) The years considered for each country are given in note b) of Table 4.1.c) All regressions include regional dummy variables; control for employment experience and employment experience squared for
Australia; a dummy variable for unemployment experience for Australia, and the United Kingdom; and industry and occupationdummy variables. Initial in brackets indicates the value of the variable in question the first time period the individual is observed.
d) Health problems are defined as follows: one night of hospital stay in Germany; whether health is an impediment in daily activities inAustralia, Switzerland and the United Kingdom.
e) See note e) of Figure 4.4 for definitions.Source: OECD estimates based on the HILDA for Australia, the GSOEP for Germany, the SHP for Switzerland and the BHPS for theUnited Kingdom.
1 2 http://dx.doi.org/10.1787/708053840276
Table 4.A1.2. Health influences exit to disability more than to other statuses (cont.)Relative risk ratios from a multinomial Logit of labour market exits towards invalidity, unemployment,
retirement or other inactivitya, b, c
Australia Germany SwitzerlandUnited
KingdomAustralia Germany Switzerland
United Kingdom

4. PATHWAYS ONTO (AND OFF) DISABILITY BENEFITS: ASSESSING THE ROLE OF POLICY AND INDIVIDUAL CIRCUMSTANCES
OECD EMPLOYMENT OUTLOOK 2009 – ISBN 978-92-64-06791-2 – © OECD 2009 247
AN
NEX
4.A
2
Dis
abili
ty P
olic
y In
dica
tor
Dim
ensi
on5
poin
ts4
poin
ts3
poin
ts2
poin
ts1
poin
t0
poin
t
X. C
ompe
nsat
ion
X1. C
over
age
Tota
l pop
ulat
ion
(res
iden
ts)
All p
opul
atio
n ex
cept
so
me
grou
psLa
bour
forc
e pl
us m
eans
-test
ed
non-
cont
rib. s
chem
eLa
bour
forc
eLa
bour
forc
e fo
r X y
ears
Labo
ur fo
rce
for X
yea
rs a
nd in
co
ntrib
utio
ns in
the
last
X y
ears
X2. M
inim
um d
isab
ility
leve
l0-
25%
26-4
0%41
-55%
56-7
0%71
-85%
86-1
00%
X3. D
isab
ility
leve
l for
full
bene
fit<
50%
50-6
1%62
-73%
74-8
5%86
-99%
100%
X4. M
axim
um b
enef
it le
vel
RR
75%
, rea
sona
ble
min
imum
RR
75%
, min
imum
not
sp
ecifi
ed75
% >
RR
50%
, rea
sona
ble
min
imum
75%
> R
R
50%
, min
imum
no
tspe
cifie
dRR
< 5
0%, r
easo
nabl
em
inim
umRR
< 5
0%, m
inim
um
nots
peci
fied
X5. P
erm
anen
ce o
f ben
efits
Stric
tly p
erm
anen
tDe
fact
o pe
rman
ent
Self-
repo
rted
revi
ew o
nly
Regu
late
d re
view
pro
cedu
reSt
rictly
tem
pora
ry, u
nles
s fu
lly
(=10
0%) d
isab
led
Stric
tly te
mpo
rary
in a
ll ca
ses
X6. M
edic
al a
sses
smen
tTr
eatin
g do
ctor
exc
lusi
vely
Trea
ting
doct
or p
redo
min
antly
Insu
ranc
e do
ctor
pre
dom
inan
tlyIn
sura
nce
doct
or e
xclu
sive
lyTe
am o
f exp
erts
in th
e in
sura
nce
Insu
ranc
e te
am a
nd tw
o-st
ep
proc
edur
eX7
. Voc
atio
nal a
sses
smen
tSt
rict o
wn
or u
sual
occ
upat
ion
asse
ssm
ent
Refe
renc
e is
mad
e to
one
’s pr
evio
us e
arni
ngs
Own-
occu
patio
n as
sess
men
t fo
rpar
tial b
enef
itsCu
rren
t lab
our m
arke
t co
nditi
ons
are
take
n in
to a
ccou
ntAl
l job
s av
aila
ble
take
n in
to
acco
unt,
leni
ently
app
lied
All j
obs
avai
labl
e ta
ken
into
ac
coun
t, st
rictly
app
lied
X8. S
ickn
ess
bene
fit le
vel
RR =
100
% a
lso
for l
ong-
term
si
ckne
ss a
bsen
ceRR
= 1
00%
(sho
rt-te
rm)
75%
(lo
ng-te
rm) s
ickn
ess
abse
nce
RR
75%
(sho
rt-te
rm)
50%
(lo
ng-te
rm) s
ickn
ess
abse
nce
75%
> R
R
50%
for a
ny ty
pe
ofsi
ckne
ss a
bsen
ceRR
5
0% (s
hort-
term
) < 5
0%
(long
-term
) sic
knes
s ab
senc
eRR
< 5
0% a
lso
for s
hort-
term
si
ckne
ss a
bsen
ceX9
. Sic
knes
s be
nefit
dur
atio
nLe
ss th
an si
xm
onth
s, si
gnifi
cant
w
age
paym
ent p
erio
dLe
ss th
an s
ixm
onth
s, s
hort
orno
wag
e pa
ymen
t per
iod
Six-
twel
ve m
onth
s, s
igni
fican
t w
age
paym
ent p
erio
dSi
x-tw
elve
mon
ths,
sho
rt
orno
wag
e pa
ymen
t per
iod
One
year
or m
ore,
sig
nific
ant
wag
e pa
ymen
t per
iod
One
year
or m
ore,
sho
rt
orno
wag
e pa
ymen
t per
iod
X10.
Sic
knes
s m
onito
ring
Leni
ent s
ickn
ess
certi
ficat
e re
quire
men
tsSi
ckne
ss c
ertif
icat
e an
d OH
S w
ith ri
sk p
reve
ntio
nFr
eque
nt s
ickn
ess
certi
ficat
esSt
rict f
ollo
w-u
p st
eps
with
ear
ly
inte
rven
tion,
risk
pro
filin
g bu
t no
sanc
tions
if n
o co
mpl
ianc
e
Stric
t con
trol
s of
sic
knes
s ce
rtific
ate
with
ow
n as
sess
men
t of
illn
ess
if ne
cess
ary
Stric
t fol
low
-up
step
s w
ith e
arly
in
terv
entio
n, ri
sk p
rofil
ing
and
sanc
tions
if n
o co
mpl
ianc
e
Y. In
tegr
atio
nY1
. Ant
i-dis
crim
inat
ion
legi
slat
ion
Maj
or o
blig
atio
ns to
war
ds
empl
oyee
s an
d ne
w a
pplic
ants
Maj
or o
blig
atio
ns to
war
ds
empl
oyee
s, le
ss fo
r app
lican
ts
Som
e ob
ligat
ions
tow
ards
em
ploy
ees
and
new
app
lican
ts
Som
e ob
ligat
ions
tow
ards
em
ploy
ees,
non
e fo
r app
lican
tsNo
obl
igat
ions
at a
ll, b
ut
dism
issa
l pro
tect
ion
No o
blig
atio
ns o
f any
kin
d
Y2. S
uppo
rted
em
ploy
men
tSt
rong
pro
gram
me,
pe
rman
ento
ptio
nSt
rong
pro
gram
me,
on
lytim
e-lim
ited
Inte
rmed
iary
, als
o pe
rman
ent
Inte
rmed
iary
, onl
y tim
e-lim
ited
Very
lim
ited
prog
ram
me
Not e
xist
ent
Y3. S
ubsi
dise
d em
ploy
men
tSt
rong
and
flex
ible
pro
gram
me,
w
ith a
per
man
ent o
ptio
nSt
rong
and
flex
ible
pro
gram
me,
bu
t tim
e-lim
ited
Inte
rmed
iary
, eith
er p
erm
anen
t or
flex
ible
Inte
rmed
iary
, nei
ther
per
man
ent
nor f
lexi
ble
Very
lim
ited
prog
ram
me
Not e
xist
ent
Y4. S
helte
red
empl
oym
ent
Stro
ng fo
cus,
with
sig
nific
ant
trans
ition
rate
sSt
rong
focu
s, b
ut la
rgel
y pe
rman
ent e
mpl
oym
ent
Inte
rmed
iary
focu
s, w
ith s
ome
“new
” at
tem
pts
Inte
rmed
iary
focu
s,
“tra
ditio
nal”
prog
ram
me
Very
lim
ited
prog
ram
me
Not e
xist
ent
Y5. V
ocat
iona
l reh
abili
tatio
nCo
mpu
lsor
y re
habi
litat
ion
with
la
rge
spen
ding
Com
puls
ory
reha
bilit
atio
n w
ith
low
spe
ndin
gIn
term
edia
ry v
iew
, rel
ativ
ely
larg
e sp
endi
ngIn
term
edia
ry v
iew
, rel
ativ
ely
low
sp
endi
ngVo
lunt
ary
reha
bilit
atio
n w
ithla
rge
spen
ding
Volu
ntar
y re
habi
litat
ion
with
low
spen
ding
Y6. B
enef
it su
spen
sion
Two
year
s or
mor
eAt
leas
t one
but
less
th
antw
oye
ars
Mor
e th
an th
ree
but l
ess
than
twel
vem
onth
sUp
to th
ree
mon
ths
Som
e, b
ut n
ot fo
r dis
abili
ty
bene
fits
None
Y7. W
ork
ince
ntiv
esPe
rman
ent i
n-w
ork
bene
fit
prov
ided
Bene
fit c
ontin
ued
fora
cons
ider
able
(tria
l) pe
riod
Inco
me
beyo
nd p
re-d
isab
ility
le
vel a
llow
edIn
com
e up
to p
re-d
isab
ility
leve
l, al
so p
artia
l ben
efit
Inco
me
up to
pre
-dis
abili
ty le
vel,
no p
artia
l ben
efit
Som
e ad
ditio
nal i
ncom
eal
low
ed

4. PATHWAYS ONTO (AND OFF) DISABILITY BENEFITS: ASSESSING THE ROLE OF POLICY AND INDIVIDUAL CIRCUMSTANCES
OECD EMPLOYMENT OUTLOOK 2009 – ISBN 978-92-64-06791-2 – © OECD 2009248
ANNEX 4.A3
The Effect of Disability Policy on Disability Rates
Variables used in the econometric macro model
GDP per capita
Source: OECD Economic Statistics.
Share of female labour force participation rates
Source: OECD Labour Force Statistics.
Share of 55+
Source: OECD Labour Force Statistics.
Share of manufacturing
Source: Labour Force Survey for Australia and OECD STAN Database for all other
countries.
Gross replacement rates
Gross replacement rates (GRR) express gross unemployment benefit levels as a
percentage of previous gross earnings. The index is the unweighted average of 18 GRRs:
three household types (single, dependent spouse and spouse in work), three time periods
(the first year, the second and third years, and the fourth and fifth years of unemployment),
and two earnings levels (average earnings and two-thirds of this level). It is calculated for
odd numbered years and has been interpolated for the remaining years.
Source: OECD Tax-Benefit Database.