patterns and trends of child and maternal nutrition
TRANSCRIPT
IFPRI Discussion Paper 00968
May 2010
Patterns and Trends of Child and Maternal Nutrition Inequalities in Nigeria
Babatunde Omilola
Development Strategy and Governance Division
brought to you by COREView metadata, citation and similar papers at core.ac.uk
provided by Research Papers in Economics

INTERNATIONAL FOOD POLICY RESEARCH INSTITUTE
The International Food Policy Research Institute (IFPRI) was established in 1975. IFPRI is one of 15 agricultural research centers that receive principal funding from governments, private foundations, and international and regional organizations, most of which are members of the Consultative Group on International Agricultural Research (CGIAR).
FINANCIAL CONTRIBUTORS AND PARTNERS IFPRI’s research, capacity strengthening, and communications work is made possible by its financial contributors and partners. IFPRI receives its principal funding from governments, private foundations, and international and regional organizations, most of which are members of the Consultative Group on International Agricultural Research (CGIAR). IFPRI gratefully acknowledges the generous unrestricted funding from Australia, Canada, China, Denmark, Finland, France, Germany, India, Ireland, Italy, Japan, the Netherlands, Norway, the Philippines, South Africa, Sweden, Switzerland, the United Kingdom, the United States, and the World Bank.
AUTHOR Babatunde Omilola, International Food Policy Research Institute Coordinator, ReSAKSS, Development Strategy and Governance Division
Notices 1 Effective January 2007, the Discussion Paper series within each division and the Director General’s Office of IFPRI were merged into one IFPRI–wide Discussion Paper series. The new series begins with number 00689, reflecting the prior publication of 688 discussion papers within the dispersed series. The earlier series are available on IFPRI’s website at http://www.ifpri.org/publications/results/taxonomy%3A468. 2 IFPRI Discussion Papers contain preliminary material and research results. They have not been subject to formal external reviews managed by IFPRI’s Publications Review Committee but have been reviewed by at least one internal and/or external reviewer. They are circulated in order to stimulate discussion and critical comment.
Copyright 2010 International Food Policy Research Institute. All rights reserved. Sections of this material may be reproduced for personal and not-for-profit use without the express written permission of but with acknowledgment to IFPRI. To reproduce the material contained herein for profit or commercial use requires express written permission. To obtain permission, contact the Communications Division at [email protected].
iii
Contents
Abstract v
Acknowledgements vi
1. Introduction 1
2. Methods 16
3. Measuring and Decomposing Inequalities in Nutritional Status of Children and Women 18
4. Data: The NDHS 17
5. Results and Discussion 16
6. Summary and Conclusions 36
References 55

iv
List of Tables
1. Inequalities in nutritional status of children by urban–rural residence, Nigeria 26 2. Inequalities in nutritional status of children, by region, Nigeria 26 3. Inequalities in nutritional status of children by regional urban–rural residence 27 4. Inequalities in nutritional status of children, by sex, Nigeria 28 5. Inequalities in nutritional status of children, by sex of household head, Nigeria 28 6. Inequalities in nutritional status of children, by education of mothers, Nigeria 29 7. Inequalities in nutritional status of children, by location, Nigeria 29 8. Inequalities in nutritional status of children, by ethnicity, Nigeria 30 A.1. Descriptive statistics of height-for-age Z-scores of selected children, by background
characteristics, Nigeria 39 A.2. Descriptive statistics of weight-for-Age Z-scores of selected children, by background
characteristics, Nigeria 40 A.3. Descriptive statistics of weight-for-height Z-scores of selected children, by background
characteristics, Nigeria 41 A.4. Descriptive statistics of body mass indexes of selected women aged 15 to 49, by background
characteristics, Nigeria 42 A.5. Inequalities in child malnutrition, by demographic and socioeconomic groups, Nigeria 43 A.6. Inequalities in nutritional status of women, by demographic and socioeconomic groups, Nigeria 45 A.7. Relationship between inequality in stunting and prevalence of stunting, Nigeria 47 A.8. Relationship between inequality in underweight and prevalence of underweight, Nigeria 48 A.9. Relationship between inequality in wasting and prevalence of wasting, Nigeria 49 A.10. Pearson correlations of indicators of child malnutrition, by background characteristics, Nigeria 50 A.11. Pearson correlations of inequalities in indicators of child malnutrition, by background
characteristics, Nigeria 51
List of Figures
1. Prevalence of child malnutrition by residence, Nigeria 16 2. Prevalence of child malnutrition by location, Nigeria 17 3. Prevalence of child malnutrition by education of mothers, Nigeria 18 4. Prevalence of child malnutrition by sex of household head, Nigeria 19 5. Prevalence of child malnutrition by sex of child, Nigeria 19 6. Prevalence of child malnutrition by ethnicity, Nigeria 20 7. Prevalence of child malnutrition by source of drinking water, Nigeria 21 8. Prevalence of child malnutrition by child’s age, Nigeria 22 9. Malnutrition prevalence of women by education, Nigeria 23 10. Malnutrition prevalence of women by age, Nigeria 23 11. Malnutrition prevalence of women by ethnicity, Nigeria 24 12. Malnutrition prevalence of women by marital duration, Nigeria 25 13. Malnutrition prevalence of women by source of drinking water, Nigeria 25 A.1. Scatter plot of inequality in stunting versus prevalence of stunting, Nigeria 52 A.2. Scatter plot of inequality in underweight versus prevalence of underweight, Nigeria 53 A.3. Scatter plot of inequality in wasting versus prevalence of wasting, Nigeria 54

v
ABSTRACT
Despite the fact that nonincome dimensions of well-being such as nutrition and health are now placed on the global development agenda, substantial gaps remain in our knowledge about patterns and trends in nutrition inequalities in many developing countries. The main objective of this paper is to document a useful starting point for understanding the determinants of inequalities in nutritional status and provide some understanding of the proximate causes of inequalities in nutritional status as well as the factors responsible for inequalities in health and nutritional status of children and women in the policy debate. Using Nigeria as a case study and using data from the Nigerian Demographic and Health Survey, this paper measures and decomposes the patterns and trends of inequalities in child and maternal nutritional status in Nigeria. In particular, the paper decomposes observed nutritional inequalities into inequalities between and within demographic and socioeconomic groups to ascertain the relative contributions of the between-groups and within-group components of inequalities. To identify the most vulnerable groups in Nigeria, the paper also explores the prevalence of child and maternal malnutrition in Nigeria. The paper finds that within-group inequalities are the sources of most inequalities in the nutritional status of children and women in Nigeria. Inequalities between demographic and socioeconomic groups are less important. Child and maternal malnutrition are concentrated among the least educated households, the rural population, the north (in particular its Hausa ethnic group), and those who drink water from public wells. Malnutrition in Nigeria is a vicious cycle in that child malnutrition can be partly traced back to low birth weight (and therefore to maternal malnutrition). To interrupt this vicious cycle, the Nigerian government should take targeted and concerted actions that focus attention on addressing within-group inequalities. Intervention in the areas of primary healthcare, home-based caring practices, access to basic services (such as safe drinking water and good sanitation), education of women, and direct nutritional interventions for malnourished children seem the most appropriate.
Keywords: nutrition, inequality, Nigeria

vi
ACKNOWLEDGEMENTS
The author would like to acknowledge, without implicating, Macro International, Inc. for providing data access to the Nigerian Demographic and Health Survey employed for this paper. The views expressed in the paper are those of the author, and any errors and omissions are entirely his own.

1
1. INTRODUCTION
The most common way to measure welfare is based on incomes or consumption levels. However, one of the several dimensions of well-being that has been relatively neglected in the past few decades is nutrition. “Adequate nutrition is instrumental in enabling people to earn a living, and to enjoy the fruits of their labors” (Deaton 1999, 1). Nutrition is one of the most critical veritable ingredients of labor productivity, and it increases human potentialities of all kinds (Perkins et al. 2001). Not only is nutrition central to well-being, but nutritional well-being is also a fundamental human right. Malnutrition currently accounts for about half of the 10 million deaths each year among under-five children in the developing world. Malnutrition is strongly associated with poverty because levels of malnutrition are higher in poor countries than in better-off countries (World Bank 2000).
Although the last three decades have witnessed a 20 percent reduction in the proportion of malnourished children in developing countries, about 160 million children under five years of age—almost one-third of the developing world’s children—are still malnourished (WHO 1999; Smith and Haddad 2000). It has been projected that under the most likely circumstances, about 135 million children under the age of five in developing countries will be malnourished by 2020 (Pinstrup-Andersen et al. 1999). Clearly, the first few years are the most crucial to the intellectual capacity and physical development of children and can promote their future productivity growth (Pinstrup-Andersen 2000; Smith and Haddad 2000). As adults, the ability of malnourished children to secure nutritional well-being for their own children may be greatly hampered, bringing about a vicious cycle of intergenerational poverty.1
To provide efficient and effective policy recommendations and interventions that advance health equity, enhance nutritional well-being of children, and promote the rights of children, it is necessary to first understand the levels of malnutrition and the disparities in nutritional status of children along socioeconomic groups (such as race or gender) or by geographical locations (such as rural or urban areas). This shows that “inequality decompositions are an effective tool in the positive analysis of inequality… that can be a first step in identifying the proximate causes of inequality” (Kanbur 2002a, 2). In essence, inequality decompositions of nutritional status of children must be taken as the starting point of identifying the areas of nutritional intervention that are highly relevant in ensuring the nutritional well-being of children (Wagstaff 2002; Booysen 2003; Wagstaff et al. 2001).
Without good nutrition, a person’s potential to escape from poverty is weakened due to lost time, lost labor, lost income, and the burden of healthcare costs. This explains why any attempt to reduce poverty, advance health equity, and improve well-being of poor people must primarily involve improved nutritional status.
In light of the above, this paper has four objectives. The principal objective of the paper is to document the patterns of inequalities in nutritional status of children and women in Nigeria between and within demographic and socioeconomic groups in the country. This analysis will provide some understanding of the proximate causes of inequalities in nutritional status as well as the factors responsible for inequalities in nutritional status of children and women in the country. The second objective is to explore the prevalence of child and maternal malnutrition in Nigeria by different demographic and socioeconomic characteristics to identify the most vulnerable groups in Nigeria. The third objective is to ascertain whether there is any discernable relationship between levels of inequalities in child and maternal malnutrition and the prevalence of child and maternal malnutrition in Nigeria. The latter is important because of the focus in international and national development goals on average rates of malnutrition. For instance, the only nutrition-focused target of the Millennium Development Goals, which is the halving of underweight among under five children by 2015, is expressed only in terms of average rates (Gwatkin 2000). It is, therefore, of some interest to establish how average rates of malnutrition and inequalities in malnutrition compare within a country. The fourth objective is to
1 For instance, women who were stunted in childhood are more prone to have low–birth weight babies.

2
ascertain the vicious/virtuous cycle of maternal and child nutritional status in Nigeria with the aim of determining whether child malnutrition is traceable to maternal malnutrition.
The focus on Nigeria is justified quite simply. Nigeria accounts for nearly one-fourth of Sub-Saharan Africa’s poor; it is a region where the number of malnourished children is forecast to increase by more than 30 percent to reach 40 to 45 million by 2020 (WHO 1997; Pinstrup-Andersen et al. 1999). Moreover, more than 50 percent of all childhood deaths have undernutrition as an underlying factor in Nigeria (NPC/UNICEF 1998). Nutritional deficiencies contribute to the high rates of morbidity, mortality, and disability in Nigeria. Like almost all other developing countries in the world, Nigeria has committed itself to providing equitable access to health and nutrition care for all socioeconomic groups of people living in different geographical locations of the country. Nigeria has also committed itself to national food and nutrition policies through the establishment of the National Committee on Food and Nutrition and several Committees on Food and Nutrition at both state and local government levels to coordinate nutrition-related actions, which emphasize the socioeconomic and spatial rights to nutrition. Despite numerous nutritional policies introduced in Nigeria, substantial gaps remain in our knowledge about inequalities in the nutritional status of children and women. The implication of the latter is that the groups that are seriously affected by nutritional deficiencies may not be properly targeted by the various Nigerian nutrition policies.
Following this Introduction, Section 2 describes the methods and indicators employed in the paper. Section 3 explains the framework of analysis used to measure and decompose inequalities in the nutritional status of children and women in Nigeria. Section 4 briefly provides details about the data used for the analysis in the paper, the Nigerian Demographic and Health Survey (NDHS) of 2003. Section 5 presents the results of analysis carried out in the paper, elaborating intermittently on the implications of the most important findings in advancing equity in nutrition. Section 6 concludes with some policy recommendations for Nigerian nutrition policymakers and target setters.
16
2. METHODS
2.1. Measuring the Nutritional Status of Children The indicators of nutritional status of children used in this paper (and available in the NDHS) are the height-for-age (H/A), weight-for-height (W/H), and weight-for-age (W/A) anthropometric indicators of nutritional status for under-five children. The anthropometric indicators are reputed to serve as a proxy to measure the quality of life for an entire population (Pradhan, Sahn, and Younger 2001). H/A is an indicator of a child’s long-term or chronic nutritional status. It reflects linear growth achieved before and after birth of children, with its deficits’ indicating long-term or chronic, cumulative effects of inadequate nutrition, health, or both, “especially protein-energy malnutrition, and sustained and recurrent illness” (Wagstaff and Watanabe 2000, 6). Low H/A, which is called “stunting,” refers to a situation in which children are shorter than expected for their age and gender group in the reference population due to past chronic nutritional deficiency (Sahn and Stifel 2002). W/A is an anthropometric indicator that measures body mass in relation to age. Low W/A, which is called “underweight,” represents a deficit in W/A, that is, a situation wherein children weigh less than expected considering their age. W/H is an anthropometric indicator that measures body mass in relation to body length and describes a recent and acute process that has produced a substantial weight loss, usually as a consequence of an acute or recent shortage of food, a recent severe disease within a short time span, or both. Low W/H, which is called “wasting,” refers to a situation wherein a child has failed to achieve adequate weight for his or her height.
The determination of H/A, W/A, and W/H anthropometric indicators of nutritional status of a particular population of children, normally expressed as Z-scores, is usually carried out through the use of a standard reference population as a point of comparison. Z-score is a statistical measure of the distance from the median expressed as a proportion of the standard deviation, that is,
Z-score = (Observed value) - (Median value of the reference value) Standard deviation of the reference population
The standard reference population, as used by the NDHS, is the U.S. National Center for Health Statistics (NCHS) standard, which is recommended for use by the World Health Organization (WHO 1983). In conformity with the international standard based on previous precedents and for the purpose of comparisons with previous work, this paper analyzes the prevalence of child malnutrition in Nigeria by considering children with Z-scores below –2 standard deviations from the median of the NCHS reference population in terms of H/A, W/A, and W/H as stunted, underweight, and wasted, respectively. For instance, a child with a Z-score for H/A of –2.66 is considered stunted, whereas a child with a Z-score for H/A of –1.88 is not classified as stunted. The reason for favoring children with Z-scores below –2 standard deviations is that those scores convey information about the depth of malnutrition rather than simply whether a child was malnourished.
Further, children with Z-scores below –3 standard deviations from the median of the NCHS reference population in terms of H/A, W/A, and W/H are considered severely stunted, severely underweight, and severely wasted, respectively.
2.2. Measuring the Nutritional Status of Women This paper uses body mass index (BMI), which is a measure of fatness/thinness, to assess the nutritional status of adult women. BMI, which is also known as Quetelet’s Index, is defined as weight in kilograms divided by the square of height in meters. Unlike the nutritional status of children, the evaluation of nutritional status of women does not require a reference table from a well-nourished population. Normally, body weight is proportional to body height, and the BMI of well-nourished adult women ranges from 18.5 to 25.0. A BMI higher than 25.0 indicates obesity or what is sometimes called overnutrition. A BMI lower than 18.5 is considered to be an indicator of energy deficiency or low food

17
intake, which can be used to assess thinness or acute malnutrition among women. As recommended by WHO (1985), the 17.0 to 18.49 BMI range indicates mild malnutrition, 16.0 to 16.9 indicates moderate malnutrition, and all values less than 16.0 indicate severe malnutrition. The preferred measure of acute malnutrition or wasting among women employed to analyze malnutrition prevalence among women in this paper is the cutoff point of 18.5 because it incorporates all three grades of mild malnutrition, moderate malnutrition, and severe malnutrition (Sahn and Stifel 2002).
It must be mentioned that the paper examines the patterns of nutritional status of women less intensively than those of children because the consequences of malnutrition for adult women are considered to be less severe than for children. Moreover, since the nutritional status of adults is likely to be determined earlier in their lives, there will be less scope for policy interventions to target eradication of malnutrition among adult women. Nevertheless, there are important reasons why it is highly desirable to analyze the nutritional status of adult women. First, the nutritional status of women can have serious consequences for their children’s birth weights and for infant mortality, especially during pregnancy and lactation. Second, some studies have shown that there are economic and health consequences to being a malnourished adult (see, for example, Marini and Gragnolati 2003). Not only has low BMI been shown to have a negative effect on labor productivity, but also, in developing countries, a BMI lower than 18.5 has been associated with increased mortality risk.
18
3. MEASURING AND DECOMPOSING INEQUALITIES IN NUTRITIONAL STATUS OF CHILDREN AND WOMEN
The paper follows the argument of Pradhan, Sahn, and Younger (2001) and Deaton (1999, 2001) that inequalities in health and nutritional status must focus on pure inequalities in health and nutritional status, not the correlations between health or nutritional status and income/expenditure. In essence, the traditional approach of Wagstaff et al. (1991), Wagstaff et al. (2001), van Doorslaer et al. (1997), and Kakwani et al. (1997) was modified in that the paper orders well-being of children and women by nutritional status, not income levels, and describes the patterns of inequalities in nutritional status across this nutritional ordering2
Nevertheless, according to Deaton (1999), inequality in health and nutrition can be better understood by starting with income inequality and examining whether the theoretical and measurement structure of the latter can be transferred to the former. Therefore, it would be expected that measures of income inequality such as the range, share ratios, mean absolute deviations, coefficients of variation, Gini coefficients, Lorenz curves, and the Generalized Entropy (GE) class of inequality measures can be applied to the measurement of inequality in nutritional status
.
3. However, unlike other measures of inequality, only the GE class of inequality measures satisfies the five standard criteria for measuring inequality, including the attractive property of being easily decomposable by subgroups.4
3.1. Decomposability and the Theil Inequality Measures
This paper makes use of a special case of the GE class of inequality measures, namely, the Theil L index, to measure and decompose indicators of nutritional status in children and women in Nigeria. The next subsection explores the Theil L index and how it can be decomposed by subgroups.
Decomposability Decomposability implies that an inequality measure can be broken down into components or constituents. To satisfy the criterion of decomposability, an inequality measure needs to be easily decomposed between subgroups of a population in the distribution of a welfare variable. This is also called “groupwise decomposition.” In essence, decomposability is a property of an inequality measure that separates the variation in overall inequality into two parts: a within-group and a between-groups measure. “Within-group inequality is a weighted sum of the inequalities calculated for each of the groups. It reflects the
2 For instance, based on Kakwani et al. (1997), Wagstaff et al. (2001) derive and use concentration indices to analyze
malnutrition inequalities in Vietnam across income groups. 3 The range is computed as the difference between the richest and poorest people in the distribution of welfare indicator,
divided by the mean to ignore the units of measurement. Share ratios are simply calculated by dividing the share of the richest by that of the poorest in a desired proportion. It measures the degree of inequality between two extremes of very poor and very rich. The share approach is a common measure of inequality that features prominently in the bourgeoning literature such as World Bank and Human Development Reports. Mean absolute deviation is calculated as the summation of the absolute values in the difference between the mean and each data point on the welfare variable scale, divided by the total variable. The coefficient of variation is calculated as the ratio of standard deviation (or the square root of the variance) and the mean variable, indicating that what matters is relative inequality. The Gini coefficient, which is the most popular and frequently used measure of inequality, incorporates the more detailed shares data starting from the base across the whole distribution to capture inequality. The Lorenz curve is a theoretical cumulative distribution curve of welfare indicator to population based on the notion that individuals in a population are ranked from the poorest to the richest. Other inequality measures include variance, variance of logarithms, logarithmic variance, and the Atkinson set of inequality measures, among others.
4 The five criteria or general rules required for inequality measurement are (1) Anonymity (names do not matter), (2) Population Principle (population share is what matters), (3) Relative Welfare Principle (welfare share is what matters, not absolute amounts of welfare), (4) Dalton Transfer Principle (transferring welfare from a richer person to a poorer person should indicate a fall of inequality and vice versa), and (5) Decomposability (summation of within-group and between-groups inequality should be equal to total inequality). (For further elaboration on the criteria for inequality measurement, see Ray 1998; Litchfield 1999; Atkinson 1970; and Cowell 1995.)

19
inequality that exists ‘over and above’ mean difference across groups” (Kanbur 2002b, 1). Within-group inequality shows how much inequality is due to variations between individuals in each group. “Between-group inequality is inequality calculated on the total population when each welfare variable in a group is replaced by the mean of the welfare variable in that group” (Kanbur 2002b, 1). Between-groups inequality indicates how much inequality is due to differences in the average welfare of each group, that is, the average differences across the groups. The addition of the two is expected to give us the estimate of total inequality of the population. If inequality rises in each of the subgroups, the overall inequality will also increase and vice versa (for further information on inequality decomposition, see, for example, Bourguignon 1979; Cowell 1980; Shorrocks 1984; Deaton 1997; Jenkins 1995; and Litchfield 1999).
The number of groups in any grouping such as race, space, and gender affects the between-groups component. The subdivision of groups into many subgroups or divisions increases the between-groups component (Kanbur 2002a). Grouping a population into, say, 12 subgroups gives rise to a much bigger between-groups component than grouping them into, say, 2 subgroups. As mentioned above, inequality measures of the GE class are all decomposable into intuitively appealingly components of within-group inequality and between-groups inequality. The general formula of members of the GE class of measures is indicated as follows:
−
∝−∝
=∝ ∑=
n
i
yin
GE1
2 111)(α
µ, (1)
where n is the number of individuals in the sample, yi is the welfare variable of individual i, (1, 2...n), and µ is the sample mean of the welfare variable in question. The value of GE ranges from 0 to ∞, with 0 representing an equal distribution or perfect equality (all welfare variables identical) and higher values indicating greater inequality. The parameter α in the GE class represents the weight given to distances between welfare variables at different parts of the distribution of the welfare variable and can take any real value. For lower values of α, GE is more sensitive to low-end inequality changes, and for higher values GE is more sensitive to upper-end inequality changes. The most common values of α used are 0, 1, and 2. The GE measures with parameter 0 will give us the Theil L measure of inequality, otherwise called the mean log deviation, as follows:
GE (0) ∑=
=n
i yin 1ln1 µ
(2)
The Theil L index is most sensitive to low-end inequality changes. Two types of decomposition are of interest: the decomposition of the level of inequality in any one year, that is, a static decomposition, and a decomposition of the change in inequality over a period of time, that is, a dynamic decomposition (Litchfield 1999). Since the paper is focused on the NDHS, the techniques for static decomposition are as follows:
Within-group Inequality For the GE class of inequality measures, within-group inequality is expressed as follows:
, (3)

20
where fj is the population share and vj is the share of the welfare variable of interest (in this case, Z-scores for the anthropometric indicators of nutritional status in children) of each partition j, j = 1, 2...k. To calculate within-group inequality using the Theil L index, equation 3 changed to the following:
Theil L: ∑=
=k
jw jOfjGEI
1)( . (4)
This means that for the Theil L, I use population shares as the weights of the groups to derive within-group inequality.
Between-group Inequality For the GE class, between-groups inequality, Ib, is measured by assigning the mean of the welfare variable of each partition j, µj, to each member of the partition and calculating as follows:
−
∝−∝
= ∑−
111
2
α
µµk
jb
jfjI. (5)
From the between-groups inequality formula of the GE class presented in equation 5, the between-groups inequality formula for the Theil L index is derived as follows:
Theil L: ∑=
=k
ijb j
nfjIµµ1 (6)
Again, to derive between-groups inequality for the Theil L, equation 6 shows that population shares as the weights of the groups are used.
3.2. Consequence of Calculating Z-Scores for the Anthropometric Indicators of Nutritional Status Using the Theil L Index An important measurement issue to mention is that there is a consequence of using the Theil L index as the preferred inequality measure adopted for measuring and decomposing inequalities in nutritional status across all children. The consequence is that a large number of the Z-scores for the anthropometric indicators of nutritional status of Nigerian children take on negative values. Since the Theil indices are usually defined over positive real values (Deaton 1997), it becomes somewhat implausible to measure and decompose inequalities in nutritional status across all children using the unadjusted values of the Z-scores. To tackle this challenge, the procedure of Pradhan, Sahn, and Younger (2003) and Sahn and Stifel (2002, 10)5 is followed by simply adding just more than the negative value of the smallest number to each Z-score.6
5 The authors encounter this problem while decomposing asset indices for African countries.
For example, adding eight to the value of the W/A Z-score for each child does not alter the rank ordering of children, producing almost the same information as the unchanged set of W/A Z-scores. More importantly, Theil L index was never really designed for nutritional measures because it contains a log transformation, which cannot cope with negative numbers. This implies that the procedure employed in the paper might actually be introducing a small bias to the results, and this represents a limitation of the study. Although this procedure lowers the level of inequality, as measured by the Theil L index, the shares of inequality attributable to within-group and between-groups inequality are slightly affected (Pradhan, Sahn, and Younger 2003).
6 Please note that this procedure is employed for the decomposition of inequality in nutritional status across all children and not for the decomposition of inequality among only malnourished children. This is because the latter, which is the most common inequality decomposition employed by analysts (for example, Wagstaff and Watanabe 2000; Sahn and Stifel 2002) by considering only children with –2 standard deviations below the median (–2 Z-score) as the cutoff point below which children are classified as malnourished, takes on only negative Z-score values for all children.

21
Inequality is a complex and multifaceted phenomenon. Since nutritional inequality is influenced by the nutritional status of individuals and households, and because nutritional status itself is affected by so many other factors, the study of determinants of inequality and their decomposition is largely descriptive. The inferences of causation that can be drawn from such decompositions are merely suggestive.

17
4. DATA: THE NDHS
The data used for the analysis in this paper were obtained from the NDHS of 2003. The Demographic and Health Survey is part of a worldwide survey program funded by the United States Agency for International Development and implemented by Macro International, Inc.7
The NDHS collected information about basic household socioeconomic characteristics, fertility, family planning, infant and child mortality, maternal mortality, and nutritional status of mothers and children. Other information collected includes household access to services (safe water, sanitation, and electricity), utilization of basic health and education services, mother’s education, and knowledge of treatment of common child illnesses. Despite the many advantages of the Demographic and Health Survey, one of its limitations is the absence of an income or expenditure variable, which is generally regarded as an important measure of welfare. Although the Demographic and Health Survey data lack income/expenditure data, the advantage of the data source is that it provides health and nutrition indicators nationally and in urban and rural areas separately. Moreover, Demographic and Health Survey data are estimated using common methodology and comparable data sources.
Since 1984, the Demographic and Health Survey program has conducted more than 100 nationally representative household surveys in more than 50 countries. The Demographic and Health Survey covers many health and nutrition issues, from fertility and family planning to nutrition and food. In Nigeria, the Demographic and Health Survey was conducted first in 1990; in 1999, on the eve of the new democratic dispensation; and then again in 2003. The NDHS, which is used for this paper, was conducted in a comparable fashion, which makes it a reliable data source, following a set of detailed and common procedures in all 36 states of the federation and the Federal Capital Territory. Both urban and rural areas were surveyed. Macro International, Inc. provided technical support in data processing and reporting.
The survey was designed to produce representative regional (domain) and rural-urban (strata) estimates. By stratifying the sample into rural and urban areas in two stages, the NDHS was structured to produce precise and reliable estimates of different variables for the rural and urban areas (strata) of Nigeria as well as for the different regions (sampling domains)of Nigeria. The census enumeration areas were the primary sampling units.
A listing of all households in each selected enumeration area was then conducted. One in every five households listed in the primary sampling stage was selected for interview at the second sampling stage. The combination of probability proportionate to size sampling at the primary sampling stage and a fixed sampling rate at the second sampling stage provided a roughly self-weighting sample design. In essence, the Demographic and Health Survey program is designed for typical self-weighted samples at both rural and urban areas.
The paper takes advantage of the anthropometric component included in the NDHS, in which under-three children and their mothers were weighed and measured. The original anthropometric data had a sample size of 6029 children. Over 4000 children under five years have complete and plausible anthropometric data. This paper focuses on 1,456 children under three years of age for whom plausible data were available for the analysis of H/A and W/A anthropometric indicators. For the analysis of the W/H anthropometric indicator, the paper focuses on 1,583 children under three years of age for whom reasonable data were gathered. This implies that older children above three years of age were not considered in the analysis. This is a meaningful focus, as there is little potential for catch-up growth after the age of three years (Pradhan, Sahn, and Younger 2003). Moreover, Pinstrup-Andersen (2000) argues that most growth faltering, resulting in underweight and stunting, occurs within a relatively short period—from before birth until about two years of age. Hence, it can be argued that the results presented in this paper using children under three are broadly representative of overall and long-run inequality in health and nutrition among children. For the analysis of the BMI of women, the sample pool of women was taken from an original sample size of 7620. The paper focuses on 2,538 women aged 15 to 49 who had a birth in the three years prior to the survey, who were not pregnant at the time of the interview, and whose children under three years of age were eligible to be measured and weighed.
7 See http://www.measuredhs.com.

16
5. RESULTS AND DISCUSSION
To identify the most vulnerable groups in Nigeria, this section starts with an analysis of the prevalence of child malnutrition by demographic and socioeconomic characteristics in Nigeria using the three commonly used anthropometric indicators: H/A (stunting), W/H (wasting), and W/A (underweight). The section continues with the analysis of the prevalence of malnutrition among women aged 15 to 49 by demographic and socioeconomic characteristics in Nigeria using BMI. The section then presents the results of the decompositions of the three anthropometric indices of nutritional status of children in the selected sample plus the BMIs of women by different demographic and socioeconomic groups. The Theil L measure of inequality is used for these decompositions. The inequality decompositions are also carried out only for malnourished children. The section then examines the relationship between the prevalence of child malnutrition and inequalities in child malnutrition in Nigeria. The section also briefly examines the relationship between the three anthropometric indicators of child malnutrition used, as well as the relationship between the inequalities of these anthropometric indicators of child malnutrition.
5.1. The Prevalence of Child Malnutrition in Nigeria Figures 1 to 8 present the prevalence of child malnutrition in Nigeria by place and region of residence of children, location of children, educational attainment of mothers of children, sex of the household head, sex of child, ethnic groups in Nigeria, source of drinking water, and child’s age. From the selected sample pool, almost half of all children under three in Nigeria are stunted, whereas a little more than one-quarter are severely stunted, indicating chronic malnutrition, food insecurity, and/or frequent illnesses. About 13 percent of children are wasted, whereas a little more than 5 percent of children are severely wasted, both indicating an acute or recent shortage of food and/or severe disease within a short time span. A total of 27.5 percent of children are underweight, whereas about 11 percent are severely underweight, representing a shortfall in W/A (a combination of acute and chronic malnutrition).
Figure 1. Prevalence of child malnutrition by residence, Nigeria
Source: Author’s calculations from the Nigerian Demographic and Health Survey.
Furthermore, malnutrition, in terms of stunting, wasting, and underweight, is more prevalent among children in rural areas than those in urban areas (Figure 1). Malnutrition, in terms of stunting, wasting, and underweight, is concentrated among the children living in the Northeast and Northwest
0
10
20
30
40
50
60
Overall Urban Rural Northeast Northwest Southeast Southwest Central
Perc
enta
ge o
f mal
nour
ishe
d ch
ildre
n
Stunted Severely stunted Underweight
Severely underweight Wasted Severely wasted
17
regions of Nigeria, whereas the Southeast region has the lowest percentage of malnourished children. For instance, only about 5 percent and 3 percent of children in the Southeast region are severely underweight and severely wasted, respectively. The corresponding figures are five times and four times as high, respectively, among children in the Northwest region of Nigeria (Figure 1). The urban–rural and regional disparities in the prevalence of child malnutrition in Nigeria are consistent with the Nigerian situation in which many of the underlying and basic determinants of nutritional status such as safe water supply, adequate sanitation, healthcare, and potential resources available in the community are much worse off in the rural areas than in the urban areas and in the Northern regions of Nigeria than in the Southern regions. In fact, the political, economic, and sociocultural factors, which translate potential resources in the community into actual resources for food security, care, and healthy environment, are more favorable in the urban areas and Southern regions of Nigeria than in the rural areas and Northern regions, respectively.
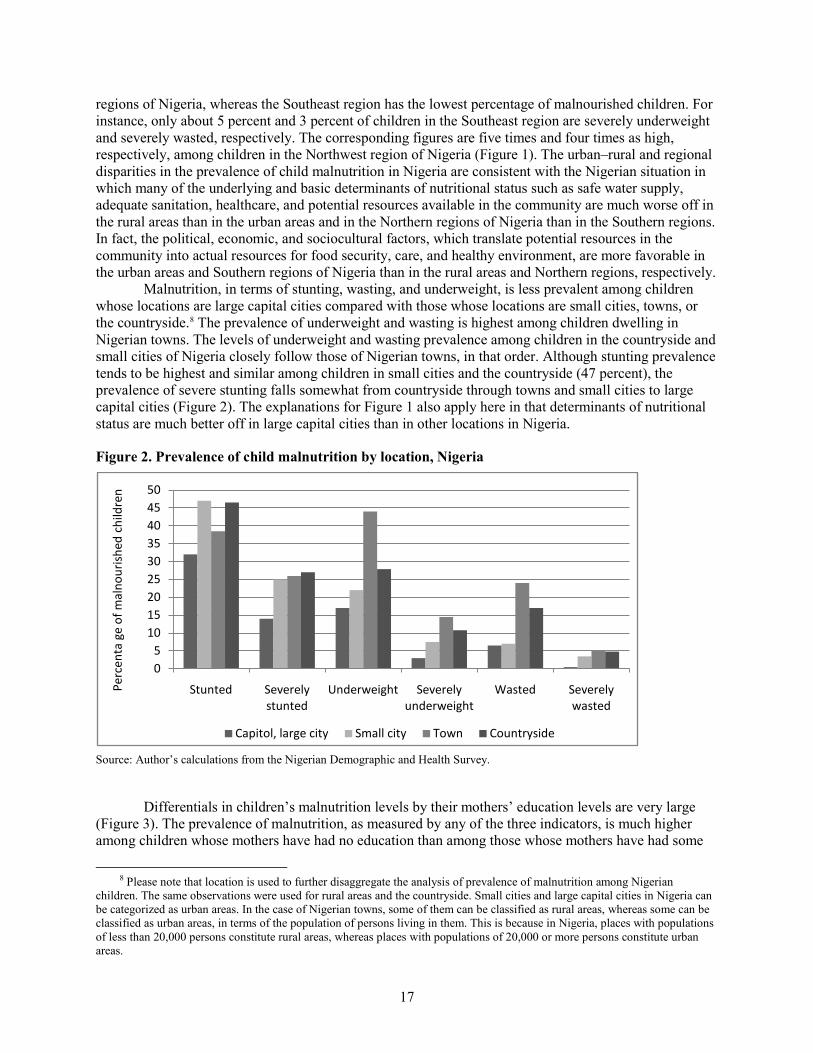
Malnutrition, in terms of stunting, wasting, and underweight, is less prevalent among children whose locations are large capital cities compared with those whose locations are small cities, towns, or the countryside.8
Figure 2. Prevalence of child malnutrition by location, Nigeria
The prevalence of underweight and wasting is highest among children dwelling in Nigerian towns. The levels of underweight and wasting prevalence among children in the countryside and small cities of Nigeria closely follow those of Nigerian towns, in that order. Although stunting prevalence tends to be highest and similar among children in small cities and the countryside (47 percent), the prevalence of severe stunting falls somewhat from countryside through towns and small cities to large capital cities (Figure 2). The explanations for Figure 1 also apply here in that determinants of nutritional status are much better off in large capital cities than in other locations in Nigeria.
. Source: Author’s calculations from the Nigerian Demographic and Health Survey.
Differentials in children’s malnutrition levels by their mothers’ education levels are very large (Figure 3). The prevalence of malnutrition, as measured by any of the three indicators, is much higher among children whose mothers have had no education than among those whose mothers have had some
8 Please note that location is used to further disaggregate the analysis of prevalence of malnutrition among Nigerian
children. The same observations were used for rural areas and the countryside. Small cities and large capital cities in Nigeria can be categorized as urban areas. In the case of Nigerian towns, some of them can be classified as rural areas, whereas some can be classified as urban areas, in terms of the population of persons living in them. This is because in Nigeria, places with populations of less than 20,000 persons constitute rural areas, whereas places with populations of 20,000 or more persons constitute urban areas.
05
101520253035404550
Stunted Severely stunted
Underweight Severely underweight
Wasted Severely wasted
Perc
enta
ge
of m
alno
uris
hed
child
ren
Capitol, large city Small city Town Countryside

18
education. Stunting, in particular, illustrates that the higher the education of mothers, the lower is the prevalence of stunting among their children. However, the prevalence of underweight and wasting is higher among children whose mothers have higher education than among those whose mothers have secondary education. Although the latter is in concordance with the findings of NDHS, it does not correlate with the nutrition literature that tends to emphasize that the higher the education of mothers, the lower is the prevalence of malnutrition, as measured by any of the three anthropometric indicators, among their children (Marini and Gragnolati 2003). The simple reason one can adduce to the findings in Figure 3 is that there are very small observations of women with higher education (65) as opposed to observations of women with other educational attainments.
Figure 3. Prevalence of child malnutrition by education of mothers, Nigeria
. Source: Author’s calculations from the Nigerian Demographic and Health Survey.
Figure 4 displays the prevalence of child malnutrition by the sex of the household head. It is clear from Figure 4 that the prevalence of child malnutrition, in terms of stunting, underweight, and wasting, is higher among children living in male-headed households than among those living in female-headed households. For instance, although the prevalence of stunting is 46 percent among children living in male-headed households, the corresponding figure is 40 percent among children living in female-headed households.
0
10
20
30
40
50
60
Stunted Severely stunted
Underweight Severely underweight
Wasted Severely wasted
Perc
enta
ge
of m
alno
uris
hed
child
ren
No education Primary Secondary Higher education

19
Figure 4. Prevalence of child malnutrition by sex of household head, Nigeria
. Source: Author’s calculations from the Nigerian Demographic and Health Survey.
Turning to Figure 5, it is evident that although the prevalence of stunting and underweight tends to be higher among male children than among female children in Nigeria, the prevalence of wasting is slightly higher among female children than among male children in Nigeria. These results run counter to the prevailing belief that female children are generally more malnourished than male children. Although it is not clear why male children in Nigeria are more likely to be stunted and underweight than female children, this finding might not be unconnected with the prevailing nutritional policy in Nigeria that focuses greater attention on female children.
Figure 5. Prevalence of child malnutrition by sex of child, Nigeria
. Source: Author’s calculations from the Nigerian Demographic and Health Survey.
Figure 6 displays the percentage of stunted, wasted, and underweight children among ethnic categories in Nigeria. If we consider the three major ethnic groups in Nigeria, Figure 6 shows that the prevalence of child malnutrition, in terms of stunting, wasting, and underweight, is highest among children of the Hausa ethnic group, followed by those of the Yoruba ethnic group, whereas children of the
0
10
20
30
40
50
Stunted Severely stunted
Underweight Severely underweight
Wasted Severely wasted
Perc
enta
ge
of
mal
nour
ishe
d ch
ildre
n
Male Female
0
10
20
30
40
50
60
Stunted Severely stunted
Underweight Severely underweight
Wasted Severely wasted
Perc
enta
ge
of
mal
nour
ishe
d ch
ildre
n
Male Female
20
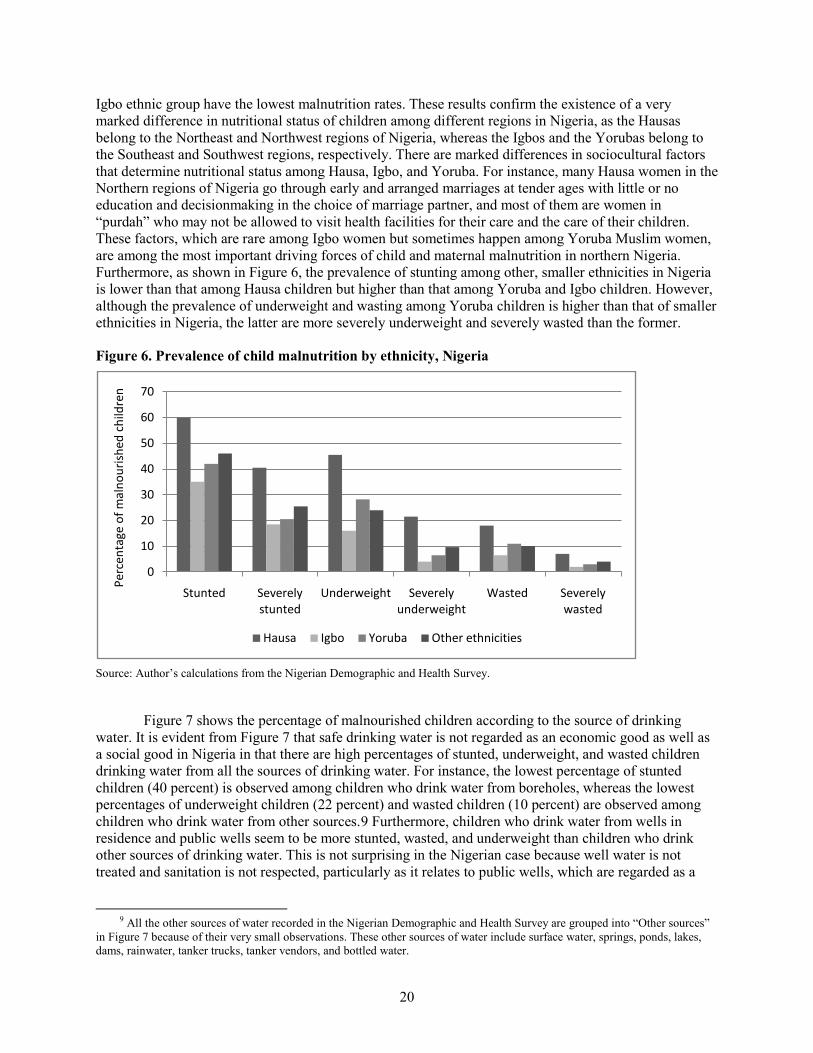
Igbo ethnic group have the lowest malnutrition rates. These results confirm the existence of a very marked difference in nutritional status of children among different regions in Nigeria, as the Hausas belong to the Northeast and Northwest regions of Nigeria, whereas the Igbos and the Yorubas belong to the Southeast and Southwest regions, respectively. There are marked differences in sociocultural factors that determine nutritional status among Hausa, Igbo, and Yoruba. For instance, many Hausa women in the Northern regions of Nigeria go through early and arranged marriages at tender ages with little or no education and decisionmaking in the choice of marriage partner, and most of them are women in “purdah” who may not be allowed to visit health facilities for their care and the care of their children. These factors, which are rare among Igbo women but sometimes happen among Yoruba Muslim women, are among the most important driving forces of child and maternal malnutrition in northern Nigeria. Furthermore, as shown in Figure 6, the prevalence of stunting among other, smaller ethnicities in Nigeria is lower than that among Hausa children but higher than that among Yoruba and Igbo children. However, although the prevalence of underweight and wasting among Yoruba children is higher than that of smaller ethnicities in Nigeria, the latter are more severely underweight and severely wasted than the former.
Figure 6. Prevalence of child malnutrition by ethnicity, Nigeria
. Source: Author’s calculations from the Nigerian Demographic and Health Survey.
Figure 7 shows the percentage of malnourished children according to the source of drinking water. It is evident from Figure 7 that safe drinking water is not regarded as an economic good as well as a social good in Nigeria in that there are high percentages of stunted, underweight, and wasted children drinking water from all the sources of drinking water. For instance, the lowest percentage of stunted children (40 percent) is observed among children who drink water from boreholes, whereas the lowest percentages of underweight children (22 percent) and wasted children (10 percent) are observed among children who drink water from other sources.9
9 All the other sources of water recorded in the Nigerian Demographic and Health Survey are grouped into “Other sources”
in Figure 7 because of their very small observations. These other sources of water include surface water, springs, ponds, lakes, dams, rainwater, tanker trucks, tanker vendors, and bottled water.
Furthermore, children who drink water from wells in residence and public wells seem to be more stunted, wasted, and underweight than children who drink other sources of drinking water. This is not surprising in the Nigerian case because well water is not treated and sanitation is not respected, particularly as it relates to public wells, which are regarded as a
0
10
20
30
40
50
60
70
Stunted Severely stunted
Underweight Severely underweight
Wasted Severely wasted
Perc
enta
ge o
f mal
nour
ishe
d ch
ildre
n
Hausa Igbo Yoruba Other ethnicities

21
common property resource for the poorer segments of the Nigerian population.10
Figure 7. Prevalence of child malnutrition by source of drinking water, Nigeria
The latter perhaps accounts for public wells’ being worse than rivers/streams in Nigeria.
. Source: Author’s calculations from the Nigerian Demographic and Health Survey.
Figure 8 presents the prevalence of child malnutrition in Nigeria by child’s age. Children aged 18 to 26 months tend to be more stunted and severely stunted, followed by children aged 27 to 35 months and those aged 9 to 17 months, respectively. Children aged 0 to 8 months have the lowest prevalence of stunting rates. However, for the underweight rates, children aged 9 to 17 months suffer more than other children, followed by children aged 27 to 35 months and 18 to 26 months, with children aged 0 to 8 months having the lowest underweight rates. Again, the prevalence of wasting is highest among children aged 9 to 17 months, followed by those aged 0 to 8 months, 18 to 26 months, and 27 to 35 months, in that order. According to the nutritional literature, malnutrition is a cumulative phenomenon, and hence malnutrition rates, as measured by the three indicators (stunting, wasting, and underweight), ought to increase with children’s ages. Although the results in Figure 8 do not fully justify the latter, the prevalence of stunting—the most popular anthropometric indicator—increases until the age of 26 months. Malnutrition is, therefore, higher when it is most harmful to the child—in other words, during the first months of life. This is because children’s brains grow most rapidly in early childhood and also because they are more vulnerable since their immune systems are not yet fully developed. The largest increase in malnutrition occurs between 6 and 24 months, while children are being weaned (WHO 1999). The weaning period, when infants make the transition from being fed exclusively with breast milk (which provides all of the nutrients and antibodies needed by the infants) to a diet of solid and liquid foods (often contaminated and of poor quality), is a critical period for babies’ nutritional status.
10 This can be likened to the tragedy of the commons.
0
10
20
30
40
50
60
Piped into house
Public tap Well in residence
Public well River, stream
Borehole Other sourcesPe
rcen
ta g
e of
mal
nour
ishe
d ch
ildre
n
Stunted Severely stuntedUnderweight Severely underweightWasted Severely wasted

22
Figure 8. Prevalence of child malnutrition by child’s age, Nigeria
. Source: Author’s calculations from the Nigerian Demographic and Health Survey.
5.2. The Prevalence of Malnutrition among Women Aged 15 to 49 Figures 9 to 13 present the results of malnutrition prevalence among women in Nigeria. Malnutrition is less prevalent among women in the urban areas than among those residing in rural areas. As with child malnutrition, malnutrition prevalence among women is concentrated among women living in the Northeast and Northwest regions of Nigeria, whereas the Southeast region has the lowest percentage of malnourished women. Although only about 5 percent of women in the Southeast region are malnourished, the corresponding figures are five times and four times as high among women in the Northeast and Northwest regions, respectively. This shows that child malnutrition can be partly traced back to low birth weight (and, therefore, to maternal malnutrition). The incidence of low birth weight not only is an important indicator of the prospects for child survival but also indirectly indicate the nutritional status of mothers. According to UNICEF/Nigeria (2001), the highest incidence of low birth weight is observed in Adamawa state, followed by Niger, Sokoto, and Bauchi states, all in the Northern region of Nigeria. Abia state in the Southeast region of Nigeria has the best birth weight record, with 96 percent of the babies being of normal weight. These disparities show that children with low birth weights are more prone to grow and develop into malnourished women.
Malnutrition is more prevalent among women whose locations are in the countryside than among those located in large capital cities in Nigeria. This implies that the synergistic interactions among the determinants of nutritional status (immediate, underlying, and basic determinants) are more favorable in large capital cities of Nigeria than in other locations.
0
10
20
30
40
50
60
Stunted Severely stunted
Underweight Severely underweight
Wasted Severely wasted
Perc
enta
ge o
f mal
nour
ishe
d ch
ildre
n
0-8 months 9-17 months 18-26 months 27-35 months

23
Figure 9. Malnutrition prevalence of women by education, Nigeria
. Source: Author’s calculations from the Nigerian Demographic and Health Survey. Note: BMI = body mass index.
Figure 9 displays malnutrition prevalence among women in Nigeria by education. The prevalence of malnutrition decreases with increasing educational attainment of mothers, from 6 percent among women who have attained higher education to 21 percent among those who have had no education. The results in Figure 9 show that educated, literate women are far more likely to take the actions necessary for their own nutritional well-being and good childcare practices for their children in Nigeria. In Nigeria, education and knowledge not only are the keys to female economic advancement but also provide women with greater levels of resources for their own care and well-being as well as those of their children. In Nigeria, the low status of women due to sociocultural factors including gender relations and women’s limited education hinders their ability to make decisions about reproductive health and nutritional matters. The reinforcing effects of these factors lead to higher malnutrition rates among less educated women in Nigeria.
Figure 10. Malnutrition prevalence of women by age, Nigeria
. Source: Author’s calculations from the Nigerian Demographic and Health Survey.
0
5
10
15
20
25
No education Primary Secondary Higher
Perc
enta
ge o
f wom
en w
hose
BM
I is
belo
w 1
8.5
Educational attainment of women
Acute malnutrition
02468
101214161820
15-19 20-24 25-29 30-34 35-39 40-44 45-49Perc
enta
ge o
f wom
en w
hose
BM
I is
belo
w 1
8.5
Age - five year groups (years)
Acute malnutrition
24
As Figure 10 shows, the prevalence of malnutrition among women tends to fall as the age of women rises (except for women aged 30 to 34). This is not surprising in the case of Nigeria as young women who marry, for instance, between the ages of 15 and 19 and start childbearing are still children themselves who would not have received enough education leading to a lack of job opportunities, with acute malnutrition’s being the end product.
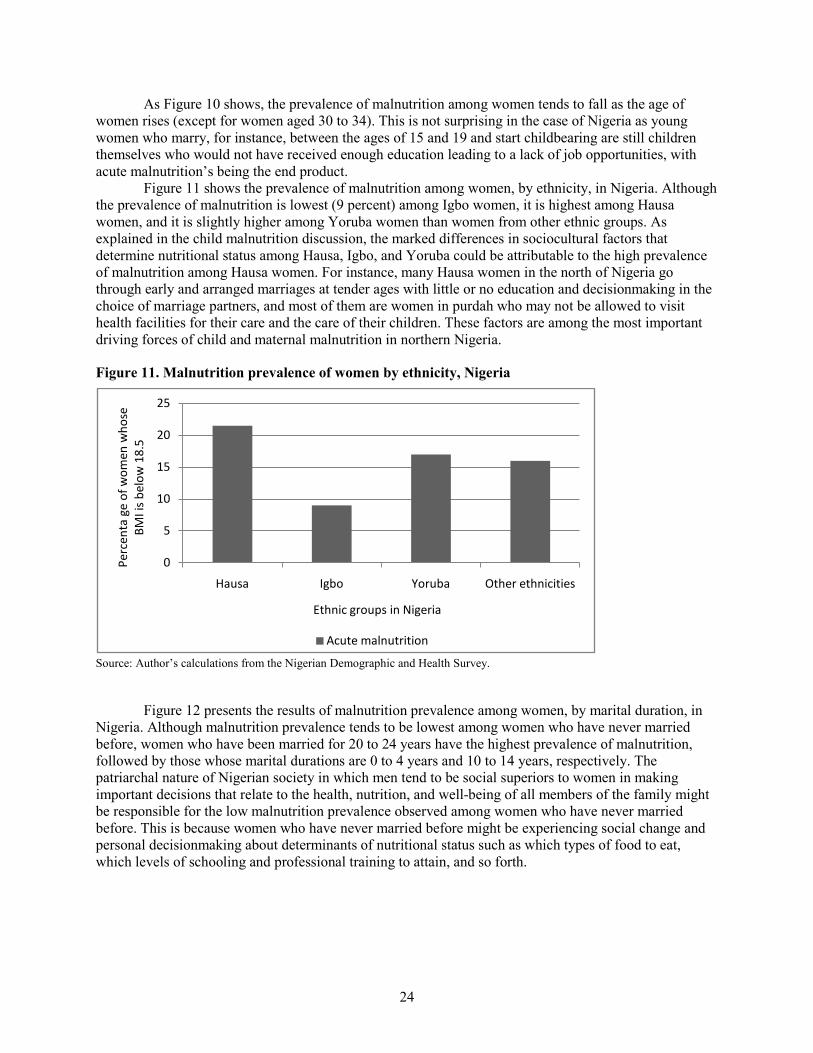
Figure 11 shows the prevalence of malnutrition among women, by ethnicity, in Nigeria. Although the prevalence of malnutrition is lowest (9 percent) among Igbo women, it is highest among Hausa women, and it is slightly higher among Yoruba women than women from other ethnic groups. As explained in the child malnutrition discussion, the marked differences in sociocultural factors that determine nutritional status among Hausa, Igbo, and Yoruba could be attributable to the high prevalence of malnutrition among Hausa women. For instance, many Hausa women in the north of Nigeria go through early and arranged marriages at tender ages with little or no education and decisionmaking in the choice of marriage partners, and most of them are women in purdah who may not be allowed to visit health facilities for their care and the care of their children. These factors are among the most important driving forces of child and maternal malnutrition in northern Nigeria.
Figure 11. Malnutrition prevalence of women by ethnicity, Nigeria
. Source: Author’s calculations from the Nigerian Demographic and Health Survey.
Figure 12 presents the results of malnutrition prevalence among women, by marital duration, in Nigeria. Although malnutrition prevalence tends to be lowest among women who have never married before, women who have been married for 20 to 24 years have the highest prevalence of malnutrition, followed by those whose marital durations are 0 to 4 years and 10 to 14 years, respectively. The patriarchal nature of Nigerian society in which men tend to be social superiors to women in making important decisions that relate to the health, nutrition, and well-being of all members of the family might be responsible for the low malnutrition prevalence observed among women who have never married before. This is because women who have never married before might be experiencing social change and personal decisionmaking about determinants of nutritional status such as which types of food to eat, which levels of schooling and professional training to attain, and so forth.
0
5
10
15
20
25
Hausa Igbo Yoruba Other ethnicities
Perc
enta
ge
of w
omen
who
se
BMI i
s be
low
18.
5
Ethnic groups in Nigeria
Acute malnutrition

25
Figure 12. Malnutrition prevalence of women by marital duration, Nigeria
. Source: Author’s calculations from the Nigerian Demographic and Health Survey.
From Figure 13, it is clear that malnutrition prevalence is highest among women whose source of drinking water is public wells. The explanation made in the child malnutrition discussion is also applicable here.
Figure 13. Malnutrition prevalence of women by source of drinking water, Nigeria
Source: Author’s calculations from Nigerian Demographic and Health Survey
5.3. Measuring and Decomposing Inequalities in Nutritional Status of Children and Women in Nigeria Turning to the results of the inequality measures and decompositions in nutritional status of children and women in Nigeria, this section first presents results of the inequality measures and decompositions of the three anthropometric indices of the nutritional status of children. Second, the results of inequality measures and decompositions of the three anthropometric indices of the nutritional status of only
0
5
10
15
20
Never married
0-4 5-9 10-14 15-19 20-24 25-29
Perc
enta
ge o
f wom
en w
hose
BM
I is
belo
w 1
8.5
Marital duration (years) of women
Acute malnutrition
0
5
10
15
20
25
30
Piped into
house
Public tap Well in residence
Public well
River, stream
Borehole Other sources
Perc
enta
ge o
f wom
en w
hose
BM
I is
belo
w 1
8.5
Source of drinking water
Acute malnutrition
26
malnourished children are presented. Third, the results of the inequality measures and decompositions of the BMIs of women are presented.
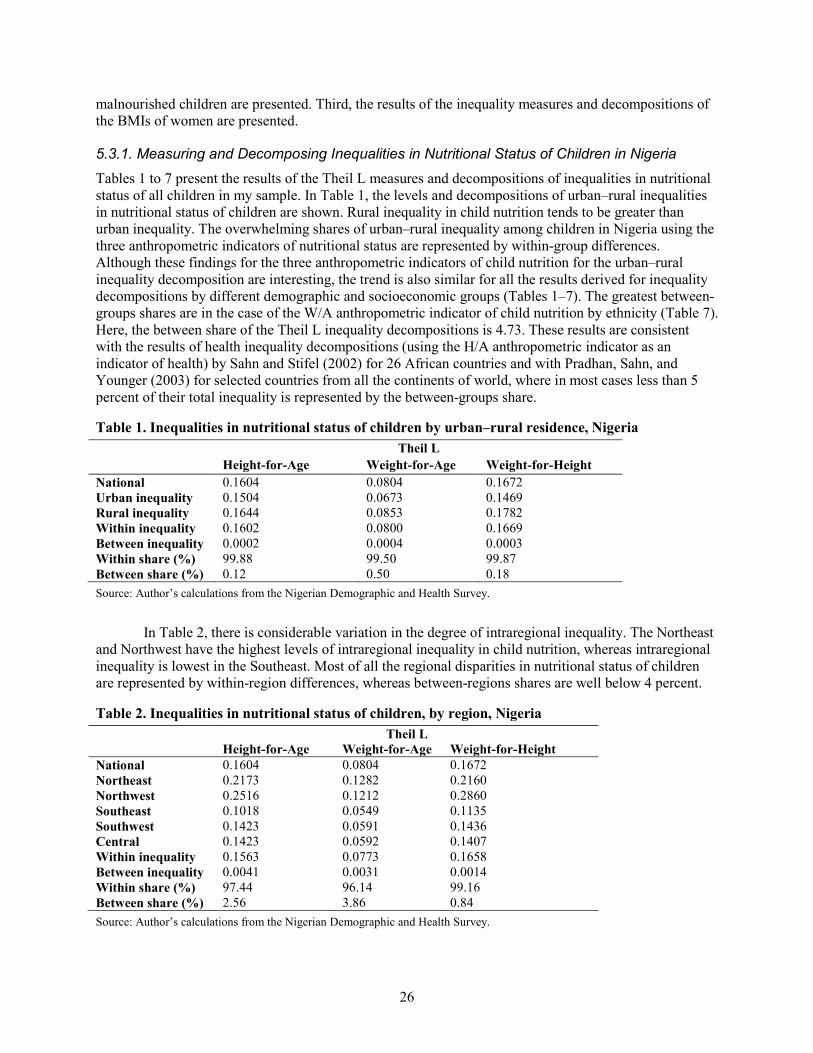
5.3.1. Measuring and Decomposing Inequalities in Nutritional Status of Children in Nigeria Tables 1 to 7 present the results of the Theil L measures and decompositions of inequalities in nutritional status of all children in my sample. In Table 1, the levels and decompositions of urban–rural inequalities in nutritional status of children are shown. Rural inequality in child nutrition tends to be greater than urban inequality. The overwhelming shares of urban–rural inequality among children in Nigeria using the three anthropometric indicators of nutritional status are represented by within-group differences. Although these findings for the three anthropometric indicators of child nutrition for the urban–rural inequality decomposition are interesting, the trend is also similar for all the results derived for inequality decompositions by different demographic and socioeconomic groups (Tables 1–7). The greatest between-groups shares are in the case of the W/A anthropometric indicator of child nutrition by ethnicity (Table 7). Here, the between share of the Theil L inequality decompositions is 4.73. These results are consistent with the results of health inequality decompositions (using the H/A anthropometric indicator as an indicator of health) by Sahn and Stifel (2002) for 26 African countries and with Pradhan, Sahn, and Younger (2003) for selected countries from all the continents of world, where in most cases less than 5 percent of their total inequality is represented by the between-groups share.
Table 1. Inequalities in nutritional status of children by urban–rural residence, Nigeria Theil L Height-for-Age Weight-for-Age Weight-for-Height National 0.1604 0.0804 0.1672 Urban inequality 0.1504 0.0673 0.1469 Rural inequality 0.1644 0.0853 0.1782 Within inequality 0.1602 0.0800 0.1669 Between inequality 0.0002 0.0004 0.0003 Within share (%) 99.88 99.50 99.87 Between share (%) 0.12 0.50 0.18 Source: Author’s calculations from the Nigerian Demographic and Health Survey.
In Table 2, there is considerable variation in the degree of intraregional inequality. The Northeast and Northwest have the highest levels of intraregional inequality in child nutrition, whereas intraregional inequality is lowest in the Southeast. Most of all the regional disparities in nutritional status of children are represented by within-region differences, whereas between-regions shares are well below 4 percent.
Table 2. Inequalities in nutritional status of children, by region, Nigeria Theil L Height-for-Age Weight-for-Age Weight-for-Height National 0.1604 0.0804 0.1672 Northeast 0.2173 0.1282 0.2160 Northwest 0.2516 0.1212 0.2860 Southeast 0.1018 0.0549 0.1135 Southwest 0.1423 0.0591 0.1436 Central 0.1423 0.0592 0.1407 Within inequality 0.1563 0.0773 0.1658 Between inequality 0.0041 0.0031 0.0014 Within share (%) 97.44 96.14 99.16 Between share (%) 2.56 3.86 0.84 Source: Author’s calculations from the Nigerian Demographic and Health Survey.
27
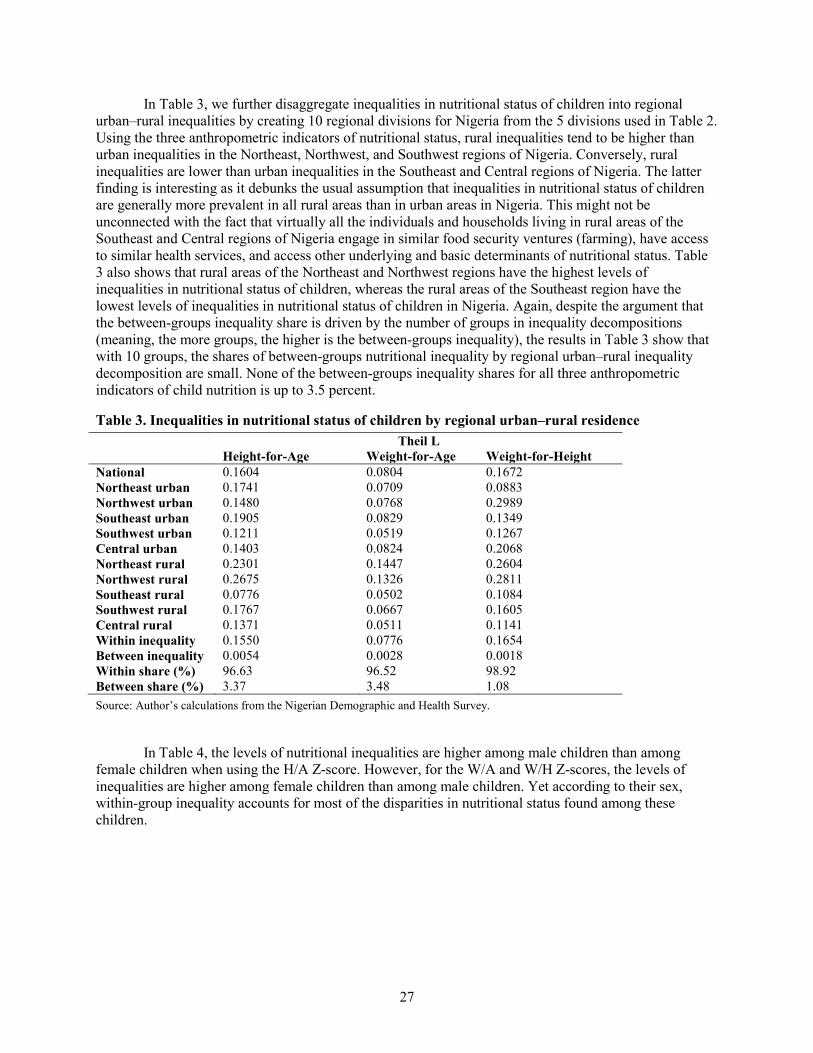
In Table 3, we further disaggregate inequalities in nutritional status of children into regional urban–rural inequalities by creating 10 regional divisions for Nigeria from the 5 divisions used in Table 2. Using the three anthropometric indicators of nutritional status, rural inequalities tend to be higher than urban inequalities in the Northeast, Northwest, and Southwest regions of Nigeria. Conversely, rural inequalities are lower than urban inequalities in the Southeast and Central regions of Nigeria. The latter finding is interesting as it debunks the usual assumption that inequalities in nutritional status of children are generally more prevalent in all rural areas than in urban areas in Nigeria. This might not be unconnected with the fact that virtually all the individuals and households living in rural areas of the Southeast and Central regions of Nigeria engage in similar food security ventures (farming), have access to similar health services, and access other underlying and basic determinants of nutritional status. Table 3 also shows that rural areas of the Northeast and Northwest regions have the highest levels of inequalities in nutritional status of children, whereas the rural areas of the Southeast region have the lowest levels of inequalities in nutritional status of children in Nigeria. Again, despite the argument that the between-groups inequality share is driven by the number of groups in inequality decompositions (meaning, the more groups, the higher is the between-groups inequality), the results in Table 3 show that with 10 groups, the shares of between-groups nutritional inequality by regional urban–rural inequality decomposition are small. None of the between-groups inequality shares for all three anthropometric indicators of child nutrition is up to 3.5 percent.
Table 3. Inequalities in nutritional status of children by regional urban–rural residence Theil L Height-for-Age Weight-for-Age Weight-for-Height National 0.1604 0.0804 0.1672 Northeast urban 0.1741 0.0709 0.0883 Northwest urban 0.1480 0.0768 0.2989 Southeast urban 0.1905 0.0829 0.1349 Southwest urban 0.1211 0.0519 0.1267 Central urban 0.1403 0.0824 0.2068 Northeast rural 0.2301 0.1447 0.2604 Northwest rural 0.2675 0.1326 0.2811 Southeast rural 0.0776 0.0502 0.1084 Southwest rural 0.1767 0.0667 0.1605 Central rural 0.1371 0.0511 0.1141 Within inequality 0.1550 0.0776 0.1654 Between inequality 0.0054 0.0028 0.0018 Within share (%) 96.63 96.52 98.92 Between share (%) 3.37 3.48 1.08 Source: Author’s calculations from the Nigerian Demographic and Health Survey.
In Table 4, the levels of nutritional inequalities are higher among male children than among female children when using the H/A Z-score. However, for the W/A and W/H Z-scores, the levels of inequalities are higher among female children than among male children. Yet according to their sex, within-group inequality accounts for most of the disparities in nutritional status found among these children.

28
Table 4. Inequalities in nutritional status of children, by sex, Nigeria Theil L Height-for-Age Weight-for-Age Weight-for-Height National 0.1604 0.0804 0.1672 Female 0.1407 0.0812 0.1702 Male 0.1777 0.0786 0.1617 Within inequality 0.1595 0.0799 0.1658 Between inequality 0.0009 0.0005 0.0014 Within share (%) 99.44 99.38 99.16 Between share (%) 0.56 0.62 0.84 Source: Author’s calculations from the Nigerian Demographic and Health Survey.
In Table 5, the levels of inequalities are higher among children living in male-headed households than among those in female-headed households using the three anthropometric indicators of nutritional status. Within-group inequality accounts for most of the disparities in nutritional status found among children by sex of the household head, whereas the shares of between-groups inequality tend to be negative even using the Theil L for H/A (–0.12 percent)
Table 5. Inequalities in nutritional status of children, by sex of household head, Nigeria Theil L Height-for-Age Weight-for-Age Weight-for-Height National 0.1604 0.0804 0.1672 Male 0.1689 0.0823 0.1711 Female 0.0844 0.0524 0.1175 Within inequality 0.1606 0.0794 0.1660 Between inequality –0.0002 0.0010 0.0012 Within share (%) 100.12 98.76 99.28 Between share (%) –0.12 1.24 0.72 Source: Author’s calculations from the Nigerian Demographic and Health Survey.
In Table 6, the levels of inequalities are highest among children whose mothers have had no education, using all three anthropometric indicators of nutrition. Levels of nutritional inequalities among children whose mothers have had primary education tend to follow those whose mothers have had no education. The levels of nutritional inequalities among children whose mothers have had higher education are surprisingly higher than those whose mothers have had only secondary education, using the H/A Z-score. As explained above, this could be due to a very small subsample of mothers with higher education in the NDHS. Nevertheless, the levels of nutritional inequalities for both groups of children are not remarkably different, using the W/A and W/H Z-scores. Again, the within-group inequality constitutes most of the shares of inequality decomposition in nutritional status of children, by educational attainments of mothers.

29
Table 6. Inequalities in nutritional status of children, by education of mothers, Nigeria Theil L Height-for-Age Weight-for-Age Weight-for-Height National 0.1604 0.0804 0.1672 No education 0.2184 0.1096 0.2074 Primary 0.1286 0.0604 0.1558 Secondary 0.1159 0.0604 0.1303 Higher 0.1288 0.0585 0.1157 Within inequality 0.1584 0.0787 0.1662 Between inequality 0.0020 0.0017 0.0010 Within share (%) 98.75 97.89 99.40 Between share (%) 1.25 2.11 0.60 Source: Author’s calculations from the Nigerian Demographic and Health Survey.
Table 7 shows that nutritional inequality is lowest among children living in large capital cities, in terms of the three indicators of nutrition. Inequality in H/A tends to be highest in small cities, whereas inequality in W/A seems to be highest in towns. The countryside seems to account for the highest inequality in W/A. The within-group inequality share accounts for almost all the disparities in the nutritional status of children.
Table 7. Inequalities in nutritional status of children, by location, Nigeria Theil L Height-for-Age Weight-for-Age Weight-for-Height National 0.1604 0.0804 0.1672 Capital, large city 0.0725 0.0372 0.0842 Small city 0.1728 0.0672 0.1488 Town 0.1687 0.0887 0.1494 Countryside 0.1637 0.0853 0.1782 Within inequality 0.1594 0.0797 0.1653 Between inequality 0.0010 0.0007 0.0019 Within share (%) 99.38 99.13 98.86 Between share (%) 0.62 0.87 1.14 Source: Author’s calculations from the Nigerian Demographic and Health Survey.
In Table 8, the Hausa ethnic group has the highest levels of inequalities in terms of all the three anthropometric indicators of nutritional status. This is not surprising as the majority of Hausa people in Nigeria live in the Northeast and Northwest regions of the country, where inequalities in nutritional status of children are the highest among all the regions of Nigeria. What is surprising, however, is that for the H/A and W/A anthropometric indicators of nutrition, the Igbo ethnic group has higher levels of inequalities than the Yoruba ethnic group. This is surprising because the Southeast, which records the lowest levels of malnutrition prevalence of children, is the regional zone of the Igbos. Nevertheless, the Igbos are scattered all over Nigeria, engaging in various activities, and hence the measurement and weighing of Igbo children could have taken place in any of the other regions of Nigeria rather than just the Southeast. Again, the within-group inequality constitutes most of the shares of inequality decomposition in child nutrition by ethnicity.

30
Table 8. Inequalities in nutritional status of children, by ethnicity, Nigeria Theil L Height-for-Age Weight-for-Age Weight-for-Height National 0.1604 0.0804 0.1672 Hausa 0.2641 0.1238 0.2291 Igbo 0.1255 0.0620 0.0997 Yoruba 0.1232 0.0504 0.1349 Others 0.1488 0.0774 0.1706 Within inequality 0.1592 0.0766 0.1648 Between inequality 0.0012 0.0038 0.0024 Within share (%) 99.25 95.27 98.56 Between share (%) 0.75 4.73 1.44 Source: Author’s calculations from the Nigerian Demographic and Health Survey.
5.3.2. Measuring and Decomposing Inequalities in Child Malnutrition in Nigeria This subsection presents the results of inequality measures and decompositions using the three anthropometric indices of nutritional status of children with Z-scores below –2 standard deviations from the median of the NCHS reference population in terms of H/A, W/A, and W/H.11
Appendix Table 5 presents the results of the calculations of the Theil L measures and decompositions of inequalities in child malnutrition in Nigeria by demographic and socioeconomic groups. As with the inequalities in the nutritional status of all children, the overwhelming shares of urban–rural inequalities in child malnutrition in Nigeria are represented by within-group differences. Although these findings for the stunting, wasting, and underweight inequalities decomposition are interesting, there is also evidence that within-group inequalities are the sources of most inequalities in child malnutrition, rather than the differences between demographic and socioeconomic groups.
These are referred to as stunting, underweight, and wasting inequalities, respectively. Measurement and decomposition of inequalities in child malnutrition are undertaken by drawing comparisons within and between different demographic and socioeconomic groups.
On region of children, it is evident that although the Northwest region tends to have the highest level of inequality in stunting, the Northeast region has the highest levels of inequalities in underweight and wasting. The lowest level of inequality in stunting is recorded in the Southeast region, whereas the Southwest has the lowest levels of inequalities in underweight and wasting. Although within-group inequalities account for most of the disparities in malnutrition among children by region, there is an appreciable increase in the share of between-groups inequalities. For instance, the share of differences in underweight between the five regions in Nigeria is 9.6 percent (Appendix Table 5). On child’s sex, the level of inequality in stunting among male children tends to be higher than that of female children. The levels of inequalities in underweight and wasting among female children seem to be higher than those present among male children. Within-group inequalities are the sources of most of the disparities in malnutrition among children by child’s sex.
On education of mothers, the levels of inequalities in stunting and underweight are highest among children whose mothers have had no education, whereas those whose mothers have primary education have the highest level of inequality in wasting. Although inequality in stunting is lowest among children whose mothers have secondary education, the levels of inequalities in underweight and wasting are lowest among children whose mothers have had higher education. These results show that within-group inequalities account for most inequalities in child malnutrition by education of mothers. On sex of the household head, the levels of inequalities in stunting and underweight are higher in male-headed households. Both male-headed and female-headed households have the identical level of inequality in
11 This is the type of inequality decomposition carried out by Wagstaff and Watanabe (2000); Sahn and Stifel (2002); and
Pradhan, Sahn, and Younger (2003) among others.

31
wasting (0.0216). Although the share of between-groups inequality in stunting by sex of household head is 5.15 percent, the corresponding figures are –2.92 and 1.88 percent for underweight and wasting, respectively.
On location of children, inequalities in stunting, underweight, and wasting are lowest among children whose locations are large capital cities. Inequality in stunting tends to be highest in small cities, whereas inequalities in underweight and wasting seem to be highest in the countryside. Within-group inequality share accounts for most of the disparities in child malnutrition by location of children, with the share of between-groups inequality in underweight being as low as 0.58 percent. On the ethnic groups in Nigeria, the Hausa ethnicity clearly has the highest levels of inequalities of stunting, underweight, and wasting. Although the Igbo ethnicity has the lowest levels of inequalities in stunting and wasting, the Yoruba ethnicity has the lowest level of inequality in underweight. Although within-group inequalities still account for most of the disparities in stunting, underweight, and wasting by ethnicity, these results show considerable shares in between-groups inequalities.
On the source of drinking water, inequality in stunting is more profound among children whose source of water is wells in residence, whereas those who drink water from public wells are more unequal in term of underweight. The level of inequality in wasting is highest among children who drink water from other sources. These other sources of water include dams, ponds, lakes, rainwater, surface water, springs, and so forth. There are also appreciable shares of between-groups inequalities by source of drinking water. On child’s age, the level of inequality in stunting is highest among children aged 27 to 35 months, whereas the level of inequality in underweight tends to be highest among children aged 9 to 17 months. The level of inequality in wasting is highest among children aged 18 to 26 months. Again, within-group inequalities are the sources of most disparities in stunting, wasting, and underweight, by child’s age.
5.3.3. Measuring and Decomposing Inequalities in Nutritional Status of Women in Nigeria This subsection presents the results of inequality measures and decompositions using the BMIs of nutritional status across women. Comparisons are drawn within and between different demographic and socioeconomic groups. Appendix Table 6 shows the results of the Theil L measures and decompositions of inequality in nutritional status of women in Nigeria by different demographic and socioeconomic groups. The trend of the results of measures and decompositions of inequality in nutritional status of women is similar to the trend observed in inequality measures and decompositions of nutritional status in children (see subsection 5.3.1.). For instance, rural inequality in nutritional status of women tends to be greater than urban inequality. Northeast and Northwest regions have the highest levels of inequalities in nutritional status of Nigerian women compared to other regions of Nigeria, and so forth. The implication of these findings is that the determinants of inequalities in nutritional status of women in Nigeria have important impacts on inequalities in nutritional status of their children. Thus, for instance, a more egalitarian society in terms of outcomes of nutritional status increases the chance of relatively equal determinants of nutritional status for both Nigerian women and their children.
The most important finding in Appendix Table 6 is that as with the decomposition of inequalities in nutritional status of children, within-group inequality constitutes most of the disparities in inequality decompositions of nutritional status of women by different demographic and socioeconomic groups. In fact, with the use of the Theil L index, the greatest between-groups share (3.98 percent) is observed when analysis of inequality decomposition of women’s nutritional status was disaggregated into 10 groups of regional urban–rural decomposition. The Theil L even recorded negative values for the between-groups shares of inequality decomposition of women’s nutritional status by some background characteristics such as age (–4.78 percent) and marital duration (–1.59 percent). Again, these results are consistent with the results of health inequality decompositions by Sahn and Stifel (2002) for 26 African countries and with the results of Pradhan, Sahn, and Younger (2003) for selected countries from all the continents of world. The question one might reasonably ask is, Does the decomposition of inequality in nutritional status give

32
similar between-groups shares and within-group shares to the income inequality decomposition? The next subsection briefly answers this question.
5.3.4. Difference between Decomposition of Inequality in Nutritional Status and Income Inequality Decomposition As evidenced in this paper, inequalities within demographic and socioeconomic groups in Nigeria are the sources of most of the disparities observed in nutritional status of children and women. Inequalities between demographic and socioeconomic groups are less important. The results of inequality decompositions using nutritional status contrasts with the more usual decompositions of income inequality. Although none of the shares of between-groups inequalities observed in nutritional inequality decompositions carried out among children and women in Nigeria is up to 10 percent, evidence from decompositions of income/expenditure inequality show that the share of between-groups inequalities is usually 10 to 15 percent of total inequality (Kanbur 2002a).
Moreover, it has been found that the share of between-groups inequalities of income/expenditure inequality decompositions can sometimes be very high. For instance, Milanovic (1999) carried out Theil decomposition on world income inequality in 1993 and 1999 and finds out that three-quarters of world income inequality is dominated by between-groups differences whereas only one-quarter of world income inequality accounts for the within-group disparities. Firebaugh (cited in Pradhan, Sahn, and Younger 2001) also reviews numerous studies that decompose income inequality into between-groups and within-group components, and his review shows that between-groups inequality contributes between 65 and 79 percent of total income inequality.12 In contrast, Pradhan, Sahn, and Younger (2003) and Sahn and Stifel (2002) carry out Theil decomposition on health inequality,13
5.4. Relationship between Inequalities in Child Malnutrition and the Prevalence of Child Malnutrition in Nigeria
and their results, which are similar to the results derived in this paper, show that in most cases less than 5 percent of their total inequality is represented by the between-groups inequality. Pradhan, Sahn, and Younger have argued that the results of income inequality decomposition differ from health inequality decomposition because the relationship between income/expenditure and health, particularly when measured by nutrition indicators such as stunting, is a strongly concave function. This difference between income/expenditure inequality and inequality in nutritional status is relevant for policy. It implies that for the purpose of addressing inequalities in nutritional status of children and women in Nigeria, and indeed in many countries, policies that focus attention on addressing within-group inequalities should be introduced and implemented.
This subsection explores whether there is any relationship between levels of inequalities in stunting, underweight and wasting and the prevalence of stunting, underweight and wasting in Nigeria. Given the focus in international and national development targets on average rates of malnutrition, it is of some interest to establish how average rates of malnutrition and inequalities in malnutrition compare by different demographic and socioeconomic groups within a country. Ideally, it would be good for policymakers and target setters to concern themselves with both dimensions.
In Appendix Tables 7, 8 and 9 the rankings of levels of inequalities in stunting, underweight and wasting versus rankings of prevalence of stunting, underweight and wasting are presented from smallest to highest values by background characteristics. The argument here is that if the inequality in child malnutrition and the prevalence of child malnutrition were similar, one would reasonably expect the rankings of both dimensions of malnutrition to be the same. But this is not the case for many of the background characteristics listed in Appendix Tables 7, 8 and 9.
12 Theil decomposition was carried out in most of the studies reviewed. However, some of the studies rely on log variance
decompositions. 13 They use height-for-age (stunting) as a proxy for health.
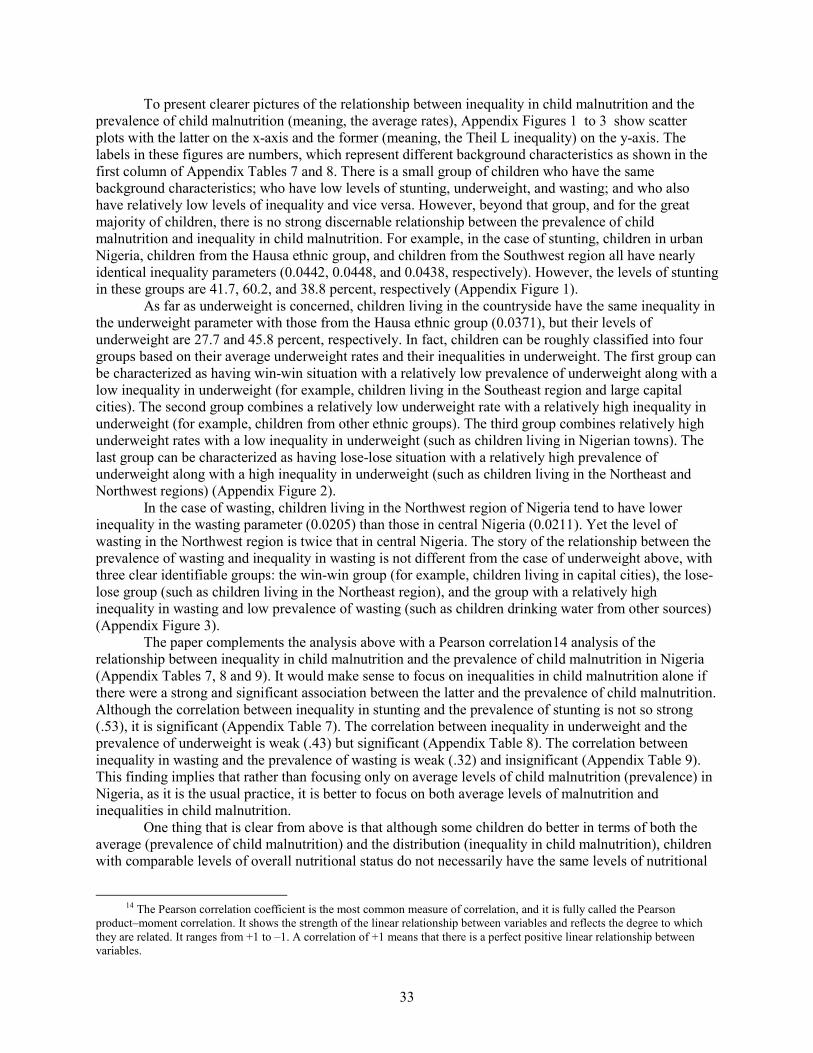
33
To present clearer pictures of the relationship between inequality in child malnutrition and the prevalence of child malnutrition (meaning, the average rates), Appendix Figures 1 to 3 show scatter plots with the latter on the x-axis and the former (meaning, the Theil L inequality) on the y-axis. The labels in these figures are numbers, which represent different background characteristics as shown in the first column of Appendix Tables 7 and 8. There is a small group of children who have the same background characteristics; who have low levels of stunting, underweight, and wasting; and who also have relatively low levels of inequality and vice versa. However, beyond that group, and for the great majority of children, there is no strong discernable relationship between the prevalence of child malnutrition and inequality in child malnutrition. For example, in the case of stunting, children in urban Nigeria, children from the Hausa ethnic group, and children from the Southwest region all have nearly identical inequality parameters (0.0442, 0.0448, and 0.0438, respectively). However, the levels of stunting in these groups are 41.7, 60.2, and 38.8 percent, respectively (Appendix Figure 1).
As far as underweight is concerned, children living in the countryside have the same inequality in the underweight parameter with those from the Hausa ethnic group (0.0371), but their levels of underweight are 27.7 and 45.8 percent, respectively. In fact, children can be roughly classified into four groups based on their average underweight rates and their inequalities in underweight. The first group can be characterized as having win-win situation with a relatively low prevalence of underweight along with a low inequality in underweight (for example, children living in the Southeast region and large capital cities). The second group combines a relatively low underweight rate with a relatively high inequality in underweight (for example, children from other ethnic groups). The third group combines relatively high underweight rates with a low inequality in underweight (such as children living in Nigerian towns). The last group can be characterized as having lose-lose situation with a relatively high prevalence of underweight along with a high inequality in underweight (such as children living in the Northeast and Northwest regions) (Appendix Figure 2).
In the case of wasting, children living in the Northwest region of Nigeria tend to have lower inequality in the wasting parameter (0.0205) than those in central Nigeria (0.0211). Yet the level of wasting in the Northwest region is twice that in central Nigeria. The story of the relationship between the prevalence of wasting and inequality in wasting is not different from the case of underweight above, with three clear identifiable groups: the win-win group (for example, children living in capital cities), the lose-lose group (such as children living in the Northeast region), and the group with a relatively high inequality in wasting and low prevalence of wasting (such as children drinking water from other sources) (Appendix Figure 3).
The paper complements the analysis above with a Pearson correlation14
One thing that is clear from above is that although some children do better in terms of both the average (prevalence of child malnutrition) and the distribution (inequality in child malnutrition), children with comparable levels of overall nutritional status do not necessarily have the same levels of nutritional
analysis of the relationship between inequality in child malnutrition and the prevalence of child malnutrition in Nigeria (Appendix Tables 7, 8 and 9). It would make sense to focus on inequalities in child malnutrition alone if there were a strong and significant association between the latter and the prevalence of child malnutrition. Although the correlation between inequality in stunting and the prevalence of stunting is not so strong (.53), it is significant (Appendix Table 7). The correlation between inequality in underweight and the prevalence of underweight is weak (.43) but significant (Appendix Table 8). The correlation between inequality in wasting and the prevalence of wasting is weak (.32) and insignificant (Appendix Table 9). This finding implies that rather than focusing only on average levels of child malnutrition (prevalence) in Nigeria, as it is the usual practice, it is better to focus on both average levels of malnutrition and inequalities in child malnutrition.
14 The Pearson correlation coefficient is the most common measure of correlation, and it is fully called the Pearson
product–moment correlation. It shows the strength of the linear relationship between variables and reflects the degree to which they are related. It ranges from +1 to –1. A correlation of +1 means that there is a perfect positive linear relationship between variables.

34
inequality and vice versa (see also Pradhan, Sahn, and Younger 2003; Wagstaff and Watanabe 2000). The scatter plots (Appendix Figures 1 to 3) tend to show the risk of setting targets and comparing characteristics solely in terms of malnutrition rates. Children from the Yoruba ethnic group, for example, have a higher underweight rate than those from other, smaller ethnic groups (about 28 percent among Yoruba children compared to 24 percent among children of other, smaller ethnic groups). Without knowledge of inequality in underweight, one would conclude that the problem of underweight is worse among Yoruba children than among children of other, smaller ethnic groups in Nigeria. But understanding that inequality in underweight among Yoruba children is much lower than underweight inequality among children of other, smaller ethnic groups makes it much harder to arrive at this conclusion.
5.5. Relationship between Indicators of Child Malnutrition in Nigeria This subsection explores the correlations between the three most commonly used indicators of child malnutrition (stunting, underweight, and wasting) in Nigeria. How related are the three dimensions of child malnutrition among Nigerian children? Will nutritional policy that focuses on one of the three dimensions of child malnutrition also target other dimensions of child malnutrition in Nigeria? Should Nigerian nutritional policy select only stunted children, only underweight children, or only wasted children? Answers to these questions are important when designing a nutrition improvement policy for Nigerian children. For instance, it would make sense for Nigerian nutritional policy to focus only on stunted children if there were a strong and significant association between stunting, underweight, and wasting in Nigeria.
Appendix Table 10 shows the Pearson correlation matrixes for the prevalence of stunting, underweight, and wasting in Nigeria. There are strong (high) and significant correlations between the prevalence of stunting and underweight (.71) and between the prevalence of underweight and wasting (.83). The association between the prevalence of stunting and wasting is rather weak (.42) even though it is significant. This finding implies that most Nigerian children who are both stunted and underweight are not likely to be wasted; that is, most Nigerian children can be stunted and underweight or be underweight and wasted, but they are not very likely to be stunted and wasted.15
5.6. Relationship between Inequalities in Indicators of Child Malnutrition in Nigeria
It then makes sense that rather than addressing all three indicators of child malnutrition, it is better for Nigerian nutritional policy, given resource constraints, to focus on the monitoring or eradication of stunting and wasting.
This subsection explores the correlations between inequalities in stunting, underweight, and wasting among under-three children in Nigeria. Are the children with a relatively high degree of inequality on one indicator of child malnutrition the same children with relatively high degrees of inequality on other indicators of child malnutrition in Nigeria? The answer to this question is important because many analysts focus only on inequality in stunting and not inequalities in underweight and wasting.16
Appendix Table 11 shows the Pearson correlation matrixes for the inequalities (Theil L) in stunting, underweight, and wasting in Nigeria by different demographic and socioeconomic characteristics. There
It would make sense to focus only on inequality in stunting if there were a strong and significant association between inequality in stunting and inequalities in underweight and wasting.
15 Please note that the results presented here articulate the interrelationship among the three dimensions of child
malnutrition and are consistent with the nutritional literature in that children who are both stunted and underweight will be most unlikely to be wasted (meaning to have a very low weight-for-height Z-score) (see, for instance, Wagstaff and Watanabe 2000).The result is not too surprising since weight-for-age (underweight) is influenced by the height and weight of a child and is thus a composite index of height-for-age (stunting) and weight-for-height (wasting). This makes its interpretation difficult since it does not differentiate between acute malnutrition (wasting) and chronic malnutrition (stunting).
16 For instance, Pradhan, Sahn, and Younger (2001) use stunting inequality as a proxy for health inequality in their decomposition of world health inequality. Sahn and Stifel (2002) also focus on stunting inequality as a proxy for health inequality in their decomposition of urban–rural health inequality in Africa.

35
are weak (low) and insignificant correlations between the Theil L inequalities in stunting and wasting (.12) and between the Theil L inequalities in underweight and wasting (.29). The strongest association is observed for the Theil L inequalities in stunting and underweight (.34). Although the latter association is significant, it is still weak. This finding implies that the fact that some children are relatively more unequal in term of one indicator of child malnutrition does not mean that the same children are consistently unequal in terms of other indicators of child malnutrition and vice versa. It then makes sense that rather than addressing only inequality in stunting in Nigeria, it is better to focus on inequalities in each indicator of child malnutrition. However, given resource constraints, inequalities in stunting and wasting seem the most appropriate to address.

36
6. SUMMARY AND CONCLUSIONS
This paper has explored the patterns and trends of inequalities in child and maternal nutritional status in Nigeria using data from the NDHS. The paper has also explored the prevalence of child and maternal malnutrition in Nigeria to identify the most vulnerable groups in Nigeria. This paper has shown that the most vulnerable groups among children and women in Nigeria in terms of malnutrition are those from the least educated households, the rural population, those from the Northern regions of Nigeria (in particular its Hausa ethnic group), and those who drink water from public wells. Moreover, children living in male-headed households are more vulnerable to malnutrition than those living in female-headed households. Male children are more likely to be malnourished than female children, contrary to the prevailing belief that female children require much more nutritional intervention than male children in Nigeria. Nigerian children are more likely to be malnourished during the first months of their life.
An important finding in this paper is that malnutrition in Nigeria is a vicious cycle in that child malnutrition can be traced back partly to low birth weight (and therefore to maternal malnutrition). The incidence of low birth weight not only is an important indicator of prospects for child survival but also indirectly indicates the nutritional status of mothers. A malnourished Nigerian girl is thus more likely to become a malnourished adolescent and later a malnourished woman. To interrupt this vicious cycle, the Nigerian government needs to take targeted and concerted action in the areas of primary healthcare, access to basic services (such as safe drinking water and good sanitation), adequate care, and direct nutritional interventions for malnourished children. These actions, which are associated with the determinants of nutritional status, should be tailored to support crucial direct nutrition interventions such as community-based programs that can improve home-based caring practices, micronutrient supplementation, correct feeding practices, and food fortification (Gillespie et al. 1996).17
Since the results presented in the paper show that malnutrition is higher among Nigerian children during the first months of life (up to the first 26 months), Nigerian nutritional policy needs to directly target preschool children, in contrast to most of the existing programs that target only children in school. This is particularly important as the brains of children grow most rapidly in early childhood and preschool children are more vulnerable since their immune systems are not yet fully developed. If Nigerian nutrition policy is to urgently select a target group of malnourished children and women, given resource constraints and knowledge of the costs of alternative interventions, children and women in rural Nigeria and northern Nigeria should be targeted since they suffer greatly from malnutrition and their current levels of achievement in reaching the desired levels of the determinants of nutritional status are rather poor.
Furthermore, Nigerian nutrition policy (which gives greater attention to female children) should be repackaged to give equal attention to both male children and female children, as analysis has shown that male children in Nigeria are more likely to be stunted and underweight than female children.
Investing in the education of women in Nigeria would give them a greater sense of self-esteem and self-confidence, as well as a greater level of resources, enabling them to assert their rights and play a greater role in decisionmaking within the family, particularly decisionmaking concerning their care and well-being as well as those of their children. An integral part of the strategies for reducing child and maternal malnutrition in Nigeria should therefore include improvement of women’s education, bolstering of women’s status, and creation of healthy environments. In addition, the Nigerian nutrition policy, which emphasizes the socioeconomic and spatial rights to nutrition for all children and women in the country, should concern itself with children living in male-headed households, not only those in female-headed households as the practice has always been. Nutritional education programs are needed at the household level. By emphasizing the importance of a more balanced diet, they could address malnutrition in both children and women.
17Analysis of different programs in other parts of the world by Gillespie et al. (1996) has shown that community-based
programs are the most cost-effective interventions for child malnutrition.

37
Turning to the measurement of inequalities in nutritional status of children and women in Nigeria, there are large inequalities in the nutritional status of children and women. As with the average rates of malnutrition, inequalities in nutritional status of children and women in rural Nigeria and northern Nigeria are higher than those observed in urban Nigeria and southern Nigeria, respectively. However, on disaggregating further, rural inequalities in the nutritional status of children are found to be lower than urban inequalities in the Southeast and Central regions of Nigeria. The latter debunks the usual assumption that inequalities in nutritional status are generally more prevalent in all rural areas than urban areas in Nigeria. Furthermore, the levels of inequalities in nutritional status are higher among children living in male-headed households than those in female-headed households. The levels of inequalities in nutritional status are higher among children whose mothers have had no education than among those whose mothers have had some education. Among the three major ethnic groups in Nigeria, the Hausa ethnic group has the highest levels of inequalities in nutritional status of children and women.
The disparities in nutritional status of children and women underscore the need to pay attention to differences in demographic and socioeconomic groupings when designing policy interventions to reduce or eliminate malnutrition in Nigeria. Policies should also be conscious of equitable distribution of basic social services (for example, water, sanitation, nutrition, adequate health, education, food security). Political economy issues of the role of power and social groupings (for example, rural versus urban groups) in the provision and financing of these services are important. Technical and economic demonstration of the superior role of these services in enhancing health and nutritional status of children and women will not in itself be sufficient to ensure their provision or guarantee that they would be provided equitably to all socioeconomic groups. The political processes of resource allocation and of policy implementation need to be understood and manipulated so as to have the above services provided at adequate levels. In any case, the issue of food security is a matter that can best be handled through political actions such as the establishment of social security systems and a free press that can report situations of malnutrition. Sen (1981), in his seminal work on famines, has demonstrated that hunger and malnutrition are not primarily due to food shortages. Rather, these health-reducing phenomena occur mainly because of poor food distribution and the lack of people’s entitlement to food, which is available through the market system. Sen has also argued that a free press is important in alerting the government and international agencies (of good will) of potential situations of severe hunger and malnutrition.
Probably the most important finding of this paper is that inequalities within demographic and socioeconomic groups in Nigeria are the sources of most of the disparities observed in the nutritional status of children and women. Inequalities between demographic and socioeconomic groups are less important. It implies that for the purpose of addressing inequalities in nutritional status of children and women in Nigeria, and indeed in many countries, policies that focus attention on addressing within-group inequalities should be introduced and implemented. Such a focus might be the focus of national nutrition policy through community-based programs (for example, generation and building of institutional capabilities for effective community ownership of nutrition security interventions) and household-level programs (for example, improvement of the living conditions of families).
With the aid of correlation matrixes and scatter plots, this paper has shown that it would be good for nutritional policymakers and target setters in Nigeria to concern themselves with both average rates of malnutrition and inequalities in malnutrition. This is because the correlations between average rates of malnutrition and inequalities in malnutrition, as measured by stunting, underweight, and wasting, are not so strong. However, there are some groups of children in Nigeria that can be categorized as having a lose-lose situation, with a relatively high prevalence of malnutrition along with high inequalities in malnutrition (such as children from the Northeast and Northwest regions). Some children can be categorized as having a win-win situation, with a relatively low prevalence of malnutrition along with low inequalities in malnutrition (for example, children from the Southeast region and those living in capital cities). This implies that Nigerian nutritional policymakers and target setters need to seriously address the malnutrition problem of children in northern Nigeria, who are chiefly from the Hausa ethnic group. Strategies for reducing average levels of malnutrition and inequalities in malnutrition among children in northern Nigeria should address all the underlying and basic determinants of nutritional status. The scale

38
and consistency of the disparities in the nutritional status of children point strongly to the need to give a clear priority to programming in northern Nigeria. Monitoring systems would also need to be put in place to track the extent of progress at state and local government levels in northern Nigeria.
Examining the relationship between the three most commonly used anthropometric indicators of child malnutrition (stunting, underweight, and wasting) as well as the relationship between the inequalities of these anthropometric indicators of child malnutrition, this paper has shown that most Nigerian children who are both stunted and underweight are not likely to be wasted. This implies that most Nigerian children can be stunted and underweight or be underweight and wasted, but they are not very likely to be stunted and wasted. This finding implies that given resource constraints, it would make sense for Nigerian nutritional policymakers to focus attention on monitoring or combating stunting and wasting. This paper has also shown that there are weak and insignificant correlations between inequalities in stunting and wasting, between inequalities in underweight and wasting, and between inequalities in stunting and underweight in Nigeria. This implies that it is better for Nigerian nutritional policymakers to focus on inequalities in each indicator of child malnutrition. However, given resource constraints, inequalities in stunting and wasting seem the most appropriate to address.
In conclusion, the decomposition procedure used in this paper represents a useful starting point for understanding the determinants of inequalities in nutritional status. However, the decomposition technique leaves much of the inequality unexplained. For example, what accounts for the large within-group inequalities in nutritional status of children and women that are typically observed? The decomposition methods employed in the paper ultimately identify correlations, which suggest but do not imply causality. The inferences of causation that can be drawn from the inequality decompositions are merely suggestive. More understanding of the factors behind patterns and trends of inequalities in nutritional status is required in the policy debate, notably of the processes behind inequalities in nutritional status. These need to be based on broader understandings of inequality and are likely to require both qualitative and quantitative research methods. Qualitative techniques seem to be more crucial in identifying the underlying processes and in understanding relationships between the different dimensions of inequalities in nutritional status. This should undoubtedly be a vital priority in future research on patterns of inequalities in nutritional status. Nevertheless, it is hoped that the findings of this paper can be a first step that assists Nigerian nutritional policymakers to understand the proximate causes of patterns and trends of inequalities in the nutritional status of children and women.

39
APPENDIX: SUPPLEMENTARY TABLES AND FIGURES
Table A.1. Descriptive statistics of height-for-age Z-scores of selected children, by background characteristics, Nigeria
Background Characteristic
Number of Children
Mean Standard Deviation
Minimum Maximum
Residence Urban N=431 -1.49 2.09 -5.77 5.27 Rural N=1025 -1.69 2.10 -5.99 5.64 Region Northeast N=302 -2.10 2.12 -5.99 3.67 Northwest N=116 -2.02 2.37 -5.95 5.48 Southeast N=366 -1.28 1.93 -5.77 5.27 Southwest N=389 -1.23 2.14 -5.91 5.60 Central N=283 -1.97 1.94 -5.84 5.64 Location Capital, large city N=96 -1.15 1.69 -5.34 3.28 Small city N=213 -1.68 2.12 -5.77 4.82 Town N=122 -1.44 2.28 -5.76 5.27 Countryside N=1025 -1.69 2.10 -5.99 5.64 Education of mother No education N=545 -2.02 2.25 -5.99 5.60 Primary N=406 -1.45 1.96 -5.84 5.27 Secondary N=440 -1.34 1.97 -5.76 5.64 Higher N=65 -1.40 1.93 -5.77 3.53 Age group of mother 15-19 N=109 -1.60 2.12 -5.78 4.14 20-24 N=310 -1.70 2.02 -5.99 5.64 25-29 N=442 -1.68 2.04 -5.94 4.96 30-34 N=322 -1.57 2.15 -5.95 5.60 35-39 N=188 -1.42 2.24 -5.37 5.27 40-44 N=56 -1.63 2.38 -5.79 3.58 45-49 N=29 -2.29 1.59 -5.02 .84 Ethnicity Hausa N=249 -2.28 2.18 -5.99 3.66 Igbo N=229 -1.01 2.23 -5.77 5.60 Yoruba N=339 -1.55 1.85 -5.79 5.17 Other ethnicities N=599 -1.67 2.09 -5.91 5.64 Sex of child Male N=739 -1.76 2.10 -5.95 5.64 Female N=717 -1.50 2.09 -5.99 5.48 Marital duration of mothers
Never married N=29 -1.39 2.22 -5.42 4.14
0-4 N=362 -1.48 1.93 -5.78 5.64 5-9 N=433 -1.62 2.07 -5.99 5.48 10-14 N=281 -1.61 2.20 -5.95 5.53 15-19 N=198 -1.74 2.30 -5.95 5.60 20-24 N=109 -1.71 2.20 -5.79 3.58 25-29 N=39 -2.55 1.47 -5.64 .75 Sex of household head Male N=1314 -1.65 2.13 -5.99 5.64 Female N=142 -1.43 1.79 -5.02 4.14 Child’s Age 0-8 months N=341 -.79 1.87 -5.76 5.60 9-17 months N=371 -1.62 2.07 -5.95 5.64 18-26 months N=371 -2.04 2.11 -5.95 5.27 27-35 months N=373 -2.00 2.09 -5.99 4.79 Source of drinking water
Piped into residence N=133 -1.59 2.04 -5.64 4.19
Public tap N=218 -1.61 2.02 -5.77 4.14 Well in residence N=202 -1.79 2.35 -5.99 5.48 Public well N=241 -1.84 2.02 -5.94 3.67 River, stream N=345 -1.62 2.09 -5.91 5.64 Borehole N=184 -1.45 1.92 -5.61 3.13 Other sources N=109 -1.25 2.19 -5.46 5.60 All Children N=1456 -1.63 2.10 -5.99 5.64 Source: Author’s calculations from the Nigerian Demographic and Health Survey.

40
Table A.2. Descriptive statistics of weight-for-Age Z-scores of selected children, by background characteristics, Nigeria Background Characteristic
Number of Children
Mean Standard Deviation
Minimum Maximum
Residence Urban 431 –.83 1.85 –5.47 5.94 Rural 1,025 –.89 1.93 –5.75 5.67
Region Northeast 302 –1.33 2.06 –5.75 5.67 Northwest 116 –1.48 2.11 –5.53 5.37 Southeast 366 –.41 1.81 –5.47 5.94 Southwest 389 –.76 1.86 –4.97 5.62 Central 283 –.89 1.66 –5.29 4.02
Location Capital, large city 96 –.74 1.42 –3.96 3.81 Small city 213 –.68 1.85 –5.47 5.04 Town 122 –1.16 2.10 –5.29 5.94 Countryside 1,025 –.89 1.93 –5.75 5.67
Education of mother No education 545 –1.22 2.05 –5.75 5.67 Primary 406 –.78 1.80 –5.65 5.94 Secondary 440 –.57 1.78 –5.47 5.17 Higher 65 –.64 1.82 –3.96 4.83
Age group of mother 15–19 109 –1.11 1.89 –5.17 3.55 20–24 310 –.96 1.84 –5.72 5.67 25–29 442 –.86 1.99 –5.65 5.64 30–34 322 –.83 1.73 –5.22 4.58 35–39 188 –.61 2.09 –5.75 5.94 40–44 56 –.81 2.15 –5.67 5.04 45–49 29 –1.41 1.49 –3.65 2.37
Ethnicity Hausa 249 –1.62 1.96 –5.75 5.37 Igbo 229 –.13 2.05 –5.47 5.94 Yoruba 339 –1.05 1.58 –4.97 5.26 Other ethnicity 599 –.76 1.89 –5.72 5.67
Sex of child Male 739 –.98 1.85 –5.65 5.94 Female 717 –.76 1.96 –5.75 5.67
Marital duration of mother
Never married 29 –.72 2.00 –5.29 3.55
0–4 362 –.80 1.75 –5.17 5.62 5–9 433 –.73 1.96 –5.72 5.67 10–14 281 –1.01 1.93 –5.65 5.94 15–19 198 –.93 1.99 –5.36 5.37 20–24 109 –.96 1.99 –5.75 5.04 25–29 39 –1.58 1.61 –4.78 2.15
Sex of household head Male 1,314 –.89 1.94 –5.75 5.94 Female 142 –.74 1.59 –5.29 4.73
Child’s age 0–8 months 341 –.22 1.96 –5.65 5.67 9–17 months 371 –1.13 1.94 –5.75 5.64 18–26 months 371 –1.09 1.76 –5.47 5.94 27–36 months 373 –1.00 1.85 –5.72 5.62
Source of drinking water
Piped into residence 133 –.76 1.97 –5.65 4.83
Public tap 218 –.77 1.92 –5.75 5.18 Well in residence 202 –1.05 2.06 –5.11 5.37 Public well 241 –1.13 1.99 –5.72 5.67 River, stream 345 –.73 1.83 –5.22 5.94 Borehole 184 –.93 1.52 –4.82 3.82 Other sources 109 –.54 2.04 –4.50 5.62
All children 1,456 –.87 1.91 –5.75 5.94 Source: Author’s calculations from the Nigerian Demographic and Health Survey.

41
Table A.3. Descriptive statistics of weight-for-height Z-scores of selected children, by background characteristics, Nigeria Background Characteristic Number of
Children Mean Standard
Deviation Minimum Maximum
Region Urban 467 .19 1.86 –4.00 5.32 Rural 1,116 .30 2.02 –3.99 5.93
Northeast 365 .10 2.03 –3.99 5.50 Northwest 159 .05 2.16 –3.98 5.68 Southeast 372 .50 1.89 –3.97 5.93 Southwest 392 .06 1.90 –3.91 5.32 Central 295 .56 1.92 –4.00 5.71
Location Capital, large city 103 .05 1.65 –2.70 5.03 Small city 221 .56 1.92 –3.98 5.32 Town 143 –.29 1.79 –4.00 3.99 Countryside 1,116 .30 2.02 –3.99 5.93
Education of mother No education 651 .22 2.07 –3.99 5.71 Primary 425 .19 1.95 –3.91 5.71 Secondary 441 .39 1.85 –4.00 5.93 Higher 66 .36 1.89 –3.08 5.36
Age group of mother 15–19 120 .05 2.20 –3.99 5.60 20–24 344 .17 1.96 –3.98 5.68 25–29 467 .27 2.03 –4.00 5.93 30–34 348 .27 1.80 –3.97 5.71 35–39 209 .49 2.00 –3.72 5.53 40–44 63 .45 1.99 –3.93 4.22 45–49 31 .11 1.85 –3.64 4.94
Ethnicity Hausa 337 –.05 2.00 –3.98 5.30 Igbo 232 .65 1.88 –3.48 5.71 Yoruba 342 –.04 1.79 –3.91 5.06 Other ethnicity 631 .47 2.03 –4.00 5.93
Sex of child Male 813 .22 1.91 –3.99 5.93 Female 770 .31 2.03 –4.00 5.71
Marital duration of mother Never married 30 .24 1.76 –3.64 3.90 0–4 383 .28 1.99 –3.99 5.60 5–9 465 .35 2.00 –4.00 5.93 10–14 305 .09 1.98 –3.97 5.53 15–19 220 .25 1.88 –3.98 5.71 20–24 128 .44 1.92 –3.72 5.30 25–29 45 .12 2.04 –3.69 3.85
Sex of household head Male 1,434 .26 1.99 –4.00 5.93 Female 149 .31 1.81 –3.64 4.85
Child’s age 0–8 months 348 .45 2.15 –3.87 5.93 9–17 months 402 .12 2.15 –3.98 5.71 18–26 months 419 .27 1.87 –4.00 5.68 27–36 months 414 .24 1.70 –3.99 5.71
Source of drinking water Piped into residence
147 .27 1.90 –3.98 5.32
Public tap 233 .33 1.97 –3.87 5.50 Well in residence 251 .25 2.16 –3.98 5.71 Public well 272 .14 2.05 –3.99 5.68 River, stream 352 .45 1.90 –3.64 5.71 Borehole 187 .05 1.78 –4.00 5.30 Other sources 117 .36 1.91 –3.97 5.93
All children 1,583 .26 1.97 –4.00 5.93 Source: Author’s Calculations from Nigerian Demographic and Health Survey.

42
Table A.4. Descriptive statistics of body mass indexes of selected women aged 15 to 49, by background characteristics, Nigeria Background Characteristic Number of
Women Mean Standard
Deviation Minimum Maximum
Region Urban 683 23.15 5.23 12.25 53.56 Rural 1,855 22.82 5.77 12.35 59.57
Northeast 599 22.10 6.23 12.35 58.64 Northwest 441 23.20 7.03 12.35 59.57 Southeast 478 23.98 4.71 15.98 46.93 Southwest 521 22.28 5.19 12.81 57.09 Central 499 23.24 4.41 12.25 53.63
Location Capital, large city 123 23.94 4.91 17.36 43.76 Small city 364 23.25 5.98 12.25 53.56 Town 196 22.48 3.61 13.27 33.97 Countryside 1,855 22.82 5.77 12.35 59.57
Education No education 1,244 22.51 5.94 12.25 59.57 Primary 629 22.82 4.83 12.81 53.63 Secondary 583 23.56 5.60 13.27 58.64 Higher 82 25.07 6.02 15.41 48.62
Age group of women 15–19 233 22.68 6.26 13.84 58.64 20–24 553 22.66 5.71 12.35 59.57 25–29 700 22.87 5.78 12.25 57.09 30–34 541 23.05 5.24 12.75 58.07 35–39 348 23.32 5.83 12.35 51.90 40–44 115 22.89 4.69 12.35 47.64 45–49 48 22.78 4.11 17.63 35.55
Ethnicity Hausa 688 22.98 6.35 12.35 59.57 Igbo 287 24.13 5.21 12.81 46.93 Yoruba 433 21.98 4.49 13.27 48.63 Other ethnicity 1,073 22.79 5.48 12.25 58.64
Sex of child Male 1,262 22.75 5.30 12.35 59.57 Female 1,276 23.06 5.94 12.25 59.57
Marital duration (years) Never married 50 23.54 5.06 16.44 47.64 0–4 578 22.69 5.49 13.27 58.64 5–9 683 23.04 5.87 12.37 59.57 10–14 526 22.86 5.56 12.25 54.12 15–19 370 22.96 5.57 12.35 58.07 20–24 233 22.79 6.02 12.35 51.90 25–29 81 23.37 4.71 13.01 42.15 30+ 17 22.90 4.46 17.63 31.11
Sex of household head Male 2,313 22.92 5.71 12.25 59.57 Female 225 22.75 4.82 12.97 47.64
Child’s age 0–8 months 632 22.96 5.55 13.01 58.64 9–17 months 658 22.75 5.84 12.25 59.57 18–26 months 564 22.72 4.82 13.06 54.12 27–36 months 521 23.40 6.33 12.35 59.57
Source of drinking water Piped into residence
253 23.55 5.55 12.97 48.62
Public tap 321 23.47 5.86 12.25 50.22 Well in residence 442 23.17 5.76 12.35 57.09 Public well 521 22.30 7.11 12.35 59.57 River, stream 540 22.80 4.56 13.22 53.63 Borehole 243 22.61 4.57 15.42 46.55 Other sources 184 22.77 4.15 14.69 34.53
All women 2,538 22.91 5.63 12.25 59.57 Source: Author’s calculations from the Nigerian Demographic and Health Survey.

43
Table A.5. Inequalities in child malnutrition, by demographic and socioeconomic groups, Nigeria Background Characteristic Height-for-Age
(Stunting) Weight-for-Age (Underweight)
Weight-for-Height (Wasting)
Residence
National 0.0447 0.0343 0.0213 Urban 0.0442 0.0267 0.0177 Rural 0.0431 0.0371 0.0217 Within inequality 0.0425 0.0341 0.0206 Between inequality 0.0022 0.0002 0.0007 Within share (%) 95.08 99.42 96.71 Between share (%) 4.92 0.58 3.29 Region
Northeast 0.0435 0.0436 0.0227 Northwest 0.0473 0.0354 0.0205 Southeast 0.0343 0.0239 0.0193 Southwest 0.0438 0.0199 0.0182 Central 0.0411 0.0291 0.0211 Within inequality 0.0416 0.0310 0.0205 Between inequality 0.0031 0.0033 0.0008 Within share (%) 93.06 90.38 96.24 Between share (%) 6.94 9.62 3.76 Sex of child Male 0.0452 0.0330 0.0202 Female 0.0395 0.0332 0.0224 Within inequality 0.0426 0.0331 0.0213 Between inequality 0.0021 0.0012 0.0000 Within share (%) 95.30 96.50 100.00 Between share (%) 4.70 3.50 0.00 Education of mother No education 0.0463 0.0375 0.0188 Primary 0.0404 0.0241 0.0231 Secondary 0.0376 0.0356 0.0221 Higher 0.0394 0.0119 0.0095 Within inequality 0.0424 0.0328 0.0203 Between inequality 0.0023 0.0015 0.0010 Within share (%) 94.85 95.63 95.31 Between share (%) 5.15 4.37 4.69 Sex of household head Male 0.0435 0.0359 0.0216 Female 0.0302 0.0272 0.0216 Within inequality 0.0424 0.0353 0.0209 Between inequality 0.0023 –0.0010 0.0004 Within share (%) 94.85 102.92 98.12 Between share (%) 5.15 –2.92 1.88 Location
Capital, large city 0.0298 0.0203 0.0062 Small city 0.0472 0.0321 0.0112 Town 0.0419 0.0244 0.0204 Countryside 0.0421 0.0371 0.0217 Within inequality 0.0423 0.0341 0.0199

44
Table A.5. Continued Background Characteristic Height-for-Age
(Stunting) Weight-for-Age (Underweight)
Weight-for-Height (Wasting)
Location Between inequality 0.0024 0.0002 0.0014 Within share (%) 94.63 99.42 93.43 Between share (%) 5.37 0.58 6.57 Ethnicity
Hausa 0.0448 0.0371 0.0239 Igbo 0.0399 0.0263 0.0159 Yoruba 0.0429 0.0197 0.0205 Other ethnicity 0.0404 0.0361 0.0181 Within inequality 0.0419 0.0315 0.0202 Between inequality 0.0028 0.0028 0.0011 Within share (%) 93.74 91.84 94.84 Between share (%) 6.26 8.16 5.16 Source of drinking water Piped into residence 0.0353 0.0400 0.0205 Public tap 0.0430 0.0330 0.0174 Well in residence 0.0524 0.0357 0.0197 Public well 0.0418 0.0409 0.0177 River, stream 0.0420 0.0221 0.0174 Borehole 0.0425 0.0248 0.0198 Other sources 0.0372 0.0172 0.0299 Within inequality 0.0428 0.0316 0.0192 Between inequality 0.0019 0.0027 0.0021 Within share (%) 95.75 92.13 90.14 Between share (%) 4.25 7.87 9.86 Age of child
0–8 months 0.0397 0.0328 0.0211 9–17 months 0.0417 0.0386 0.0194 18–26 months 0.0413 0.0321 0.0215 27–35 months 0.0438 0.0313 0.0197 Within inequality 0.0419 0.0340 0.0204 Between inequality 0.0028 0.0003 0.0009 Within share (%) 93.74 99.13 95.77 Between share (%) 6.26 0.87 4.23 Source: Author’s calculations from the Nigerian Demographic and Health Survey.
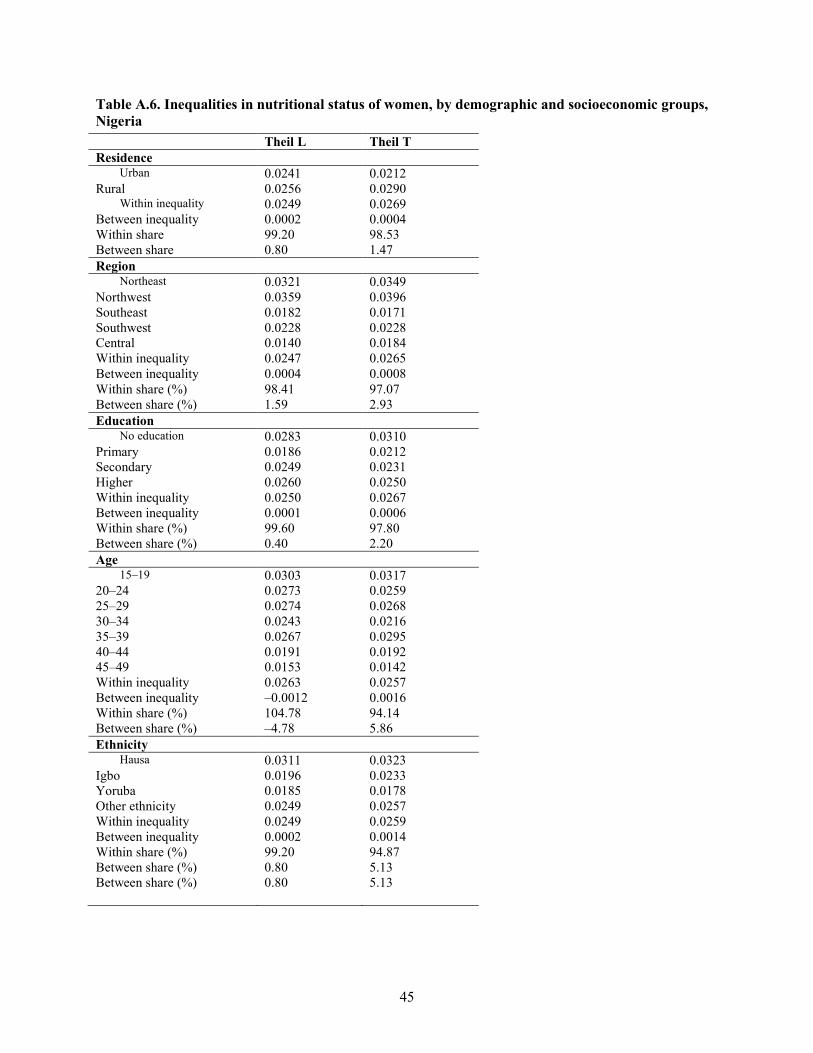
45
Table A.6. Inequalities in nutritional status of women, by demographic and socioeconomic groups, Nigeria Theil L Theil T Residence
Urban 0.0241 0.0212 Rural 0.0256 0.0290
Within inequality 0.0249 0.0269 Between inequality 0.0002 0.0004 Within share 99.20 98.53 Between share 0.80 1.47 Region
Northeast 0.0321 0.0349 Northwest 0.0359 0.0396 Southeast 0.0182 0.0171 Southwest 0.0228 0.0228 Central 0.0140 0.0184 Within inequality 0.0247 0.0265 Between inequality 0.0004 0.0008 Within share (%) 98.41 97.07 Between share (%) 1.59 2.93 Education
No education 0.0283 0.0310 Primary 0.0186 0.0212 Secondary 0.0249 0.0231 Higher 0.0260 0.0250 Within inequality 0.0250 0.0267 Between inequality 0.0001 0.0006 Within share (%) 99.60 97.80 Between share (%) 0.40 2.20 Age
15–19 0.0303 0.0317 20–24 0.0273 0.0259 25–29 0.0274 0.0268 30–34 0.0243 0.0216 35–39 0.0267 0.0295 40–44 0.0191 0.0192 45–49 0.0153 0.0142 Within inequality 0.0263 0.0257 Between inequality –0.0012 0.0016 Within share (%) 104.78 94.14 Between share (%) –4.78 5.86 Ethnicity
Hausa 0.0311 0.0323 Igbo 0.0196 0.0233 Yoruba 0.0185 0.0178 Other ethnicity 0.0249 0.0257 Within inequality 0.0249 0.0259 Between inequality 0.0002 0.0014 Within share (%) 99.20 94.87 Between share (%) 0.80 5.13 Between share (%) 0.80 5.13
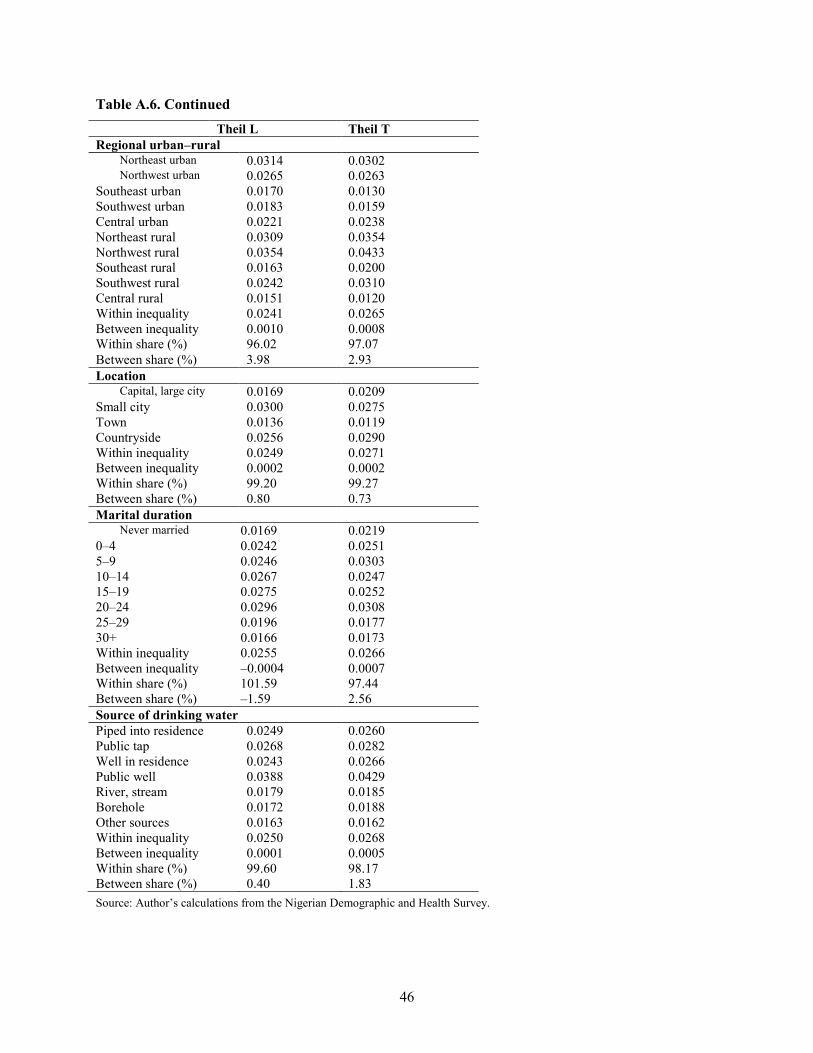
46
Table A.6. Continued Theil L Theil T Regional urban–rural
Northeast urban 0.0314 0.0302 Northwest urban 0.0265 0.0263
Southeast urban 0.0170 0.0130 Southwest urban 0.0183 0.0159 Central urban 0.0221 0.0238 Northeast rural 0.0309 0.0354 Northwest rural 0.0354 0.0433 Southeast rural 0.0163 0.0200 Southwest rural 0.0242 0.0310 Central rural 0.0151 0.0120 Within inequality 0.0241 0.0265 Between inequality 0.0010 0.0008 Within share (%) 96.02 97.07 Between share (%) 3.98 2.93 Location
Capital, large city 0.0169 0.0209 Small city 0.0300 0.0275 Town 0.0136 0.0119 Countryside 0.0256 0.0290 Within inequality 0.0249 0.0271 Between inequality 0.0002 0.0002 Within share (%) 99.20 99.27 Between share (%) 0.80 0.73 Marital duration
Never married 0.0169 0.0219 0–4 0.0242 0.0251 5–9 0.0246 0.0303 10–14 0.0267 0.0247 15–19 0.0275 0.0252 20–24 0.0296 0.0308 25–29 0.0196 0.0177 30+ 0.0166 0.0173 Within inequality 0.0255 0.0266 Between inequality –0.0004 0.0007 Within share (%) 101.59 97.44 Between share (%) –1.59 2.56 Source of drinking water Piped into residence 0.0249 0.0260 Public tap 0.0268 0.0282 Well in residence 0.0243 0.0266 Public well 0.0388 0.0429 River, stream 0.0179 0.0185 Borehole 0.0172 0.0188 Other sources 0.0163 0.0162 Within inequality 0.0250 0.0268 Between inequality 0.0001 0.0005 Within share (%) 99.60 98.17 Between share (%) 0.40 1.83 Source: Author’s calculations from the Nigerian Demographic and Health Survey.

47
Table A.7. Relationship between inequality in stunting and prevalence of stunting, Nigeria
Number Background characteristic Theil L stunting
Prevalence of stunting
(%) Rank
inequality Rank
prevalence 1 National 0.0447 45.60 29 17 2 Urban residence 0.0442 41.76 28 14 3 Rural residence 0.0431 47.22 23 22 4 Northeast region 0.0435 55.30 25 31 5 Northwest region 0.0473 56.90 34 34 6 Southeast region 0.0343 35.25 3 3 7 Southwest region 0.0438 38.82 27 6 8 Central region 0.0411 53.36 13 30 9 Capital city location 0.0298 32.29 1 2
10 Small city location 0.0472 47.42 33 24 11 Town location 0.0419 39.34 17 8 12 Countryside location 0.0421 27.22 19 22 13 No education of mothers 0.0463 56.15 32 33 14 Primary education of mothers 0.0404 39.90 12 10 15 Secondary education of mothers 0.0376 39.09 6 7 16 Higher education of mothers 0.0394 36.92 7 5 17 Male children 0.0452 48.44 31 26 18 Female children 0.0395 42.68 8 15
19 Piped source of drinking water into residence 0.0353 51.13 4 28
20 Public tap source of drinking water 0.0430 41.28 22 13
21 Well source of drinking water in residence 0.0524 50.50 35 27
22 Public well source of drinking water 0.0418 46.89 16 20
23 River stream source of drinking water 0.0420 47.25 18 23
24 Borehole source of drinking water 0.0425 39.67 20 9
25 Other sources of drinking water 0.0372 41.28 5 13 26 Household head is male 0.0435 46.19 25 19 27 Household head is female 0.0302 40.14 2 11 28 Hausa ethnicity 0.0448 60.24 30 35 29 Igbo ethnicity 0.0399 35.37 10 4 30 Yoruba ethnicity 0.0429 42.77 21 16 31 Other ethnicities 0.0404 46.08 12 18 32 0-8 months old children 0.0397 25.51 9 1 33 9-17 months old children 0.0417 47.98 15 25 34 18-26 months old children 0.0413 55.53 14 32 35 27-35 months old children 0.0438 51.74 27 29
Pearson correlation of Theil L stunting and prevalence of stunting
Theil L stunting
Prevalence of stunting
Theil L stunting
Pearson correlation 1 .529**
Sig. (2-tailed)
.001
N 35 35
Prevalence of stunting
Pearson correlation .529** 1
Sig. (2-tailed) .001 N 35 35
Source: Author’s calculations from the Nigerian Demographic and Health Survey. Note: **Correlation is significant at the 0.01 level (2-tailed).

48
Table A.8. Relationship between inequality in underweight and prevalence of underweight, Nigeria
Number Background characteristic Theil L
underweight
Prevalence of underweight
(%) Rank inequality Rank
prevalence 1 National 0.0343 27.54 22 20 2 Urban residence 0.0267 27.15 12 19 3 Rural residence 0.0371 27.71 29 22 4 Northeast region 0.0436 38.41 35 32 5 Northwest region 0.0354 45.69 23 34 6 Southeast region 0.0239 18.03 7 4 7 Southwest region 0.0199 24.94 4 14 8 Central region 0.0291 24.38 14 12 9 Capital city location 0.0203 17.71 5 3
10 Small city location 0.0321 22.07 17 8 11 Town location 0.0244 43.44 9 33 12 Countryside location 0.0371 27.71 29 22 13 No education of mothers 0.0375 36.70 31 31 14 Primary education of mothers 0.0241 24.14 8 10
15 Secondary education of mothers 0.0356 19.77 24 6
16 Higher education of mothers 0.0119 24.62 1 13 17 Male children 0.0330 29.36 20 26 18 Female children 0.0332 25.66 21 16
19 Piped source of drinking water into residence 0.0400 26.32 33 17
20 Public tap source of drinking water 0.0330 26.61 20 18
21 Well source of drinking water in residence 0.0357 35.15 25 30
22 Public well source of drinking water 0.0409 32.78 34 28
23 River stream source of drinking water 0.0221 22.90 6 9
24 Borehole source of drinking water 0.0248 25.00 10 15
25 Other sources of drinking water 0.0172 22.02 2 7
26 Household head is male 0.0359 28.46 26 25 27 Household head is female 0.0272 19.01 13 5 28 Hausa ethnicity 0.0371 45.78 29 35 29 Igbo ethnicity 0.0263 16.59 11 2 30 Yoruba ethnicity 0.0197 27.73 3 23 31 Other ethnicities 0.0361 24.21 27 11 32 0-8 months old children 0.0328 15.84 18 1 33 9-17 months old children 0.0386 34.50 32 29 34 18-26 months old children 0.0321 28.30 17 24 35 27-35 months old children 0.0313 3.56 15 27
Pearson correlation of Theil L underweight and prevalence of underweight
Theil L underweight
Prevalence of underweight
Theil L underweight
Pearson correlation 1 .432**
Sig. (2-tailed)
.01
N 35 35
Prevalence of underweight
Pearson correlation .432** 1
Sig. (2-tailed) .01
N 35 35
Source: Author’s calculations from the Nigerian Demographic and Health Survey. Note: **Correlation is significant at the 0.01 level (2-tailed).

49
Table A.9. Relationship between inequality in wasting and prevalence of wasting, Nigeria Number Background characteristic Theil L
wasting Prevalence of wasting
(%)
Rank inequality
Rank prevalence
1 National 0.0213 12.76 24 21 2 Urban residence 0.0177 11.78 8 16 3 Rural residence 0.0217 13.17 29 25 4 Northeast region 0.0227 16.44 32 30 5 Northwest region 0.0205 20.75 20 35 6 Southeast region 0.0193 8.06 12 3 7 Southwest region 0.0182 12.50 10 20 8 Central region 0.0211 10.17 23 7 9 Capital city location 0.0062 7.77 1 2
10 Small city location 0.0112 8.60 3 5 11 Town location 0.0204 19.58 18 34 12 Countryside location 0.0217 13.17 29 25 13 No education of mothers 0.0188 15.21 11 28 14 Primary education of mothers 0.0231 12.94 33 22 15 Secondary education of mothers 0.0221 9.30 30 6 16 Higher education of mothers 0.0095 10.61 2 10 17 Male children 0.0202 11.93 17 17 18 Female children 0.0224 13.64 31 26
19 Piped source of drinking water into residence 0.0205 10.88 20 14
20 Public tap source of drinking water 0.0174 10.73 6 12
21 Well source of drinking water in residence 0.0197 17.93 15 31
22 Public well source of drinking water 0.0177 15.81 8 29
23 River stream source of drinking water 0.0174 10.23 6 8
24 Borehole source of drinking water 0.0198 10.70 16 11 25 Other sources of drinking water 0.0299 10.26 35 9 26 Household head is male 0.0216 12.97 27 23 27 Household head is female 0.0216 10.74 27 13 28 Hausa ethnicity 0.0239 18.10 34 32 29 Igbo ethnicity 0.0159 8.19 4 4 30 Yoruba ethnicity 0.0205 12.28 20 18 31 Other ethnicities 0.0181 11.57 9 15 32 0-8 months old children 0.0211 13.79 23 27 33 9-17 months old children 0.0194 18.41 13 33 34 18-26 months old children 0.0215 12.41 25 19 35 27-35 months old children 0.0197 6.76 15 1
Pearson correlation of Theil L wasting and prevalence of wasting
Theil L wasting Prevalence of wasting
Theil L wasting
Pearson correlation 1 .319
Sig. (2-tailed)
.062
N 35 35
Prevalence of wasting
Pearson correlation .319 1
Sig. (2-tailed) .062 N 35 35
Source: Author’s calculations from the Nigerian Demographic and Health Survey.
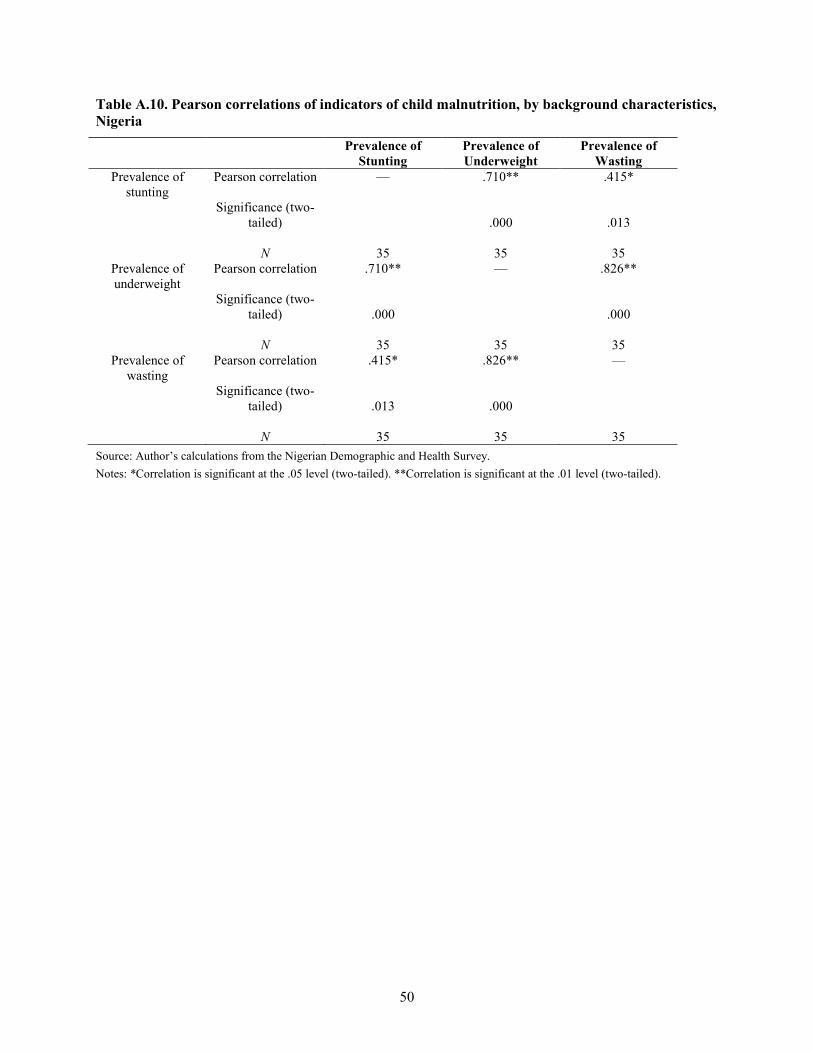
50
Table A.10. Pearson correlations of indicators of child malnutrition, by background characteristics, Nigeria
Prevalence of Stunting
Prevalence of Underweight
Prevalence of Wasting
Prevalence of stunting
Pearson correlation
Significance (two-tailed)
N
—
35
.710**
.000
35
.415*
.013
35 Prevalence of underweight
Pearson correlation
Significance (two-tailed)
N
.710**
.000
35
—
35
.826**
.000
35 Prevalence of
wasting Pearson correlation
Significance (two-
tailed)
N
.415*
.013
35
.826**
.000
35
—
35 Source: Author’s calculations from the Nigerian Demographic and Health Survey. Notes: *Correlation is significant at the .05 level (two-tailed). **Correlation is significant at the .01 level (two-tailed).
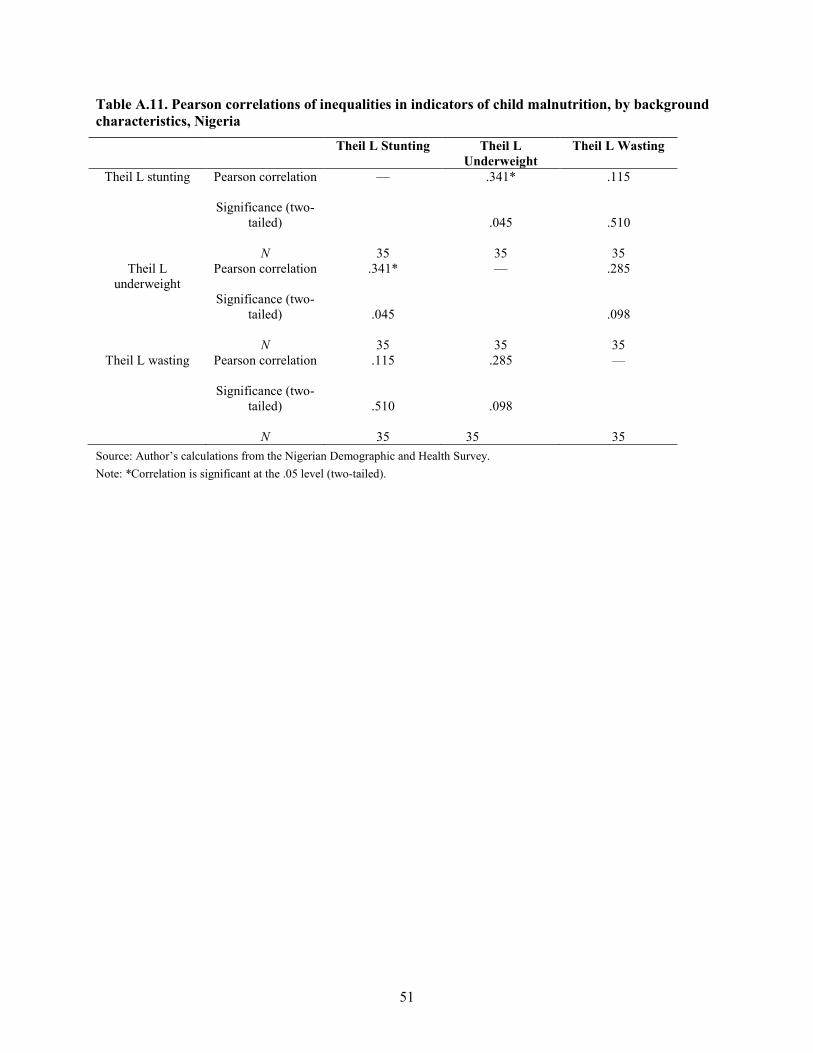
51
Table A.11. Pearson correlations of inequalities in indicators of child malnutrition, by background characteristics, Nigeria
Theil L Stunting Theil L Underweight
Theil L Wasting
Theil L stunting Pearson correlation
Significance (two-tailed)
N
—
35
.341*
.045
35
.115
.510
35 Theil L
underweight Pearson correlation
Significance (two-
tailed)
N
.341*
.045
35
—
35
.285
.098
35 Theil L wasting Pearson correlation
Significance (two-
tailed)
N
.115
.510
35
.285
.098
35
—
35 Source: Author’s calculations from the Nigerian Demographic and Health Survey. Note: *Correlation is significant at the .05 level (two-tailed).

52
Figure A.1. Scatter plot of inequality in stunting versus prevalence of stunting, Nigeria
Prevalence of Stunting (%)
706050403020
Thei
l L in
equa
lity
in S
tunt
ing
.06
.05
.04
.03
.02
35
343332 31
30
29
28
27
26
25
24 2322
21
20
19
18
17
1615
14
13
1211
10
9
8
7
6
5
432 1
Source: Author’s calculations from the Nigerian Demographic and Health Survey.

53
Figure A.2. Scatter plot of inequality in underweight versus prevalence of underweight, Nigeria
Prevalence of Underweight (%)
5040302010
Thei
l L in
equa
lity
in U
nder
wei
ght
.05
.04
.03
.02
.01
3534
33
32
31
30
29
28
27
26
25
24
23
22
21
20
19
18 17
16
15
14
1312
11
10
9
8
7
6
5
4
3
2
1
Source: Author’s calculations from the Nigerian Demographic and Health Survey.

54
Figure A.3. Scatter plot of inequality in wasting versus prevalence of wasting, Nigeria
Prevalence of Wasting (%)
2220181614121086
Thei
l L in
equa
lity
in W
astin
g.04
.03
.02
.01
0.00
3534
3332
3130
29
2827 26
25
2423 22
2120
1918
17
16
15 14
13
1211
10
9
8
76
543
2
1
Source: Author’s calculations from the Nigerian Demographic and Health Survey.

55
REFERENCES
Atkinson, A. B. 1970. On the measurement of inequality. Journal of Economic Theory 2:244–263.
Booysen, F. 2003 Urban-Rural Inequalities in Health Care Delivery in South Africa. Paper presented at WIDER conference on Inequality, Poverty and Human Well-being 30-31 May, Helsinki, Finland
Bourguignon, F. 1979. Decomposable Income Inequality Measures. Econometrica 47: 901-20.
Cowell, F. 1980. On the Structure of Additive Inequality Measures. Review of Economic Studies 47: 521-31.
Cowell, F. 1995. Measuring inequality. 2d ed. London: Harvester/Prentice Hall.
Deaton, A. 1997. The analysis of household surveys: A micro econometric approach to development policy. Baltimore, Md.: Johns Hopkins University Press.
________. 1999. Inequalities in income and inequalities in health. Princeton, N.J.: Research Program in Development Studies, Princeton University.
________. 2001. Relative deprivation, inequality, and mortality. Princeton, N.J.: Research Program in Development Studies, Princeton University.
Gillespie, S., Mason, J. and Martorell, R. 1996. How nutrition improves. State-of-the-Art Series Nutrition Policy Discussion Paper No. 15. Geneva: United Nations Administrative Committee on Coordination Sub-Committee on Nutrition.
Gwatkin, D. 2000. Health inequalities and the health of the poor: What do we know? What can we do? Bulletin of the World Health Organization 78 (1): 3–17.
Jenkins, S. 1995. Accounting for inequality trends: Decomposition analyses for the UK -1971-1986. Econometrica 62: 139-91.
Kakwani, N., A. Wagstaff and E. van Doorlsaer. 1997. Socioeconomic inequalities in health: Measurement, computation and statistical inference. Journal of Econometrics 77 (1): 87–104.
Kanbur, R. 2002a. Education, empowerment and gender inequalities. Paper presented at the Annual Bank Conference on Development Economics, April, Washington, D.C.: World Bank
________. 2002b. Notes on the policy significance of inequality decompositions. Paper based on the Cornell/LSE/WIDER Conference on Spatial Inequality and Development, June, London.
Litchfield, J. 1999. Inequality: Methods and tools. Washington, D.C.: World Bank.
Marini, A., and M. Gragnolati. 2003. Malnutrition and poverty in Guatemala. World Bank Policy Research Working Paper 2967. Washington, D.C.: World Bank.
Milanovic, B.1999. True world income distribution, 1988 and 1993: First calculation based on household surveys alone. Washington, D.C.: World Bank
NPC (National Planning Commission) and UNICEF (United Nations Children’s Fund). 1998. Child survival, protection and development in Nigeria: Key social statistics. Abuja and Lagos, Nigeria: National Planning Commission and United Nations Children’s Fund.
Perkins, D., S. Radelet, D. Snodgrass, M. Gillis, and M. Roemer. 2001. Economics of development. Fifth Edition, New York: W.W.Norton & Company, Inc.
Pinstrup-Andersen, P. 2000. Nutrition and development. Paper prepared for the Norvatis Symposium on Nutrition and Development, November 30, Basel, Switzerland.
Pinstrup-Andersen, P., R. Pandya-Lorch, and M. Rosegrant.1999. World food prospects: Critical issues for the early twenty-first century. 2020 Vision Food Policy Report. Washington, D.C.: International Food Policy Research Institute.
Pradhan, M., D. Sahn, and S. Younger. 2003. Decomposing world health inequality. Journal of Health Economics 22 (2): 271-93.

56
Ray, D. 1998. Development economics. Princeton, N.J.: Princeton University Press.
Sahn, D., and D. Stifel. 2002. Urban–rural inequality in Africa. Paper presented at the Cornell/LSE/WIDER Conference on Spatial Inequality in Africa, September, Oxford, U.K.
Sen, A. 1981. Poverty and famines: An essay on entitlements and deprivations. Oxford: Oxford University Press.
Shorrocks, A.1984. Inequality decomposition by population subgroup. Econometrica, 52: 1369-85.
Smith, L., and L. Haddad. 2000. Overcoming child malnutrition in developing countries: Past achievement and future choices. 2020 Vision Discussion Paper 30. Washington, D.C.: International Food Policy Research Institute.
UNICEF/Nigeria. 2001. Federal government of Nigeria and UNICEF master plan of operations for a country program of cooperation for Nigerian children and women—2002-2007. Lagos: United Nations Children’s Fund.
Van Doorslaer, E., A. Wagstaff, H. Bleichrodt, S. Caonge, U. Gerdtham and M. Gerfin. 1997. Income-related inequalities in health: Some international comparisons. Journal of Health Economics 16: 93-112.
Wagstaff, A. 2002. Inequalities in health in developing countries: Swimming against the tide. Policy Research Working Paper. World Bank Development Research Group, Washington, D.C.: World Bank
Wagstaff, A., P. Paci, and E, van Doorslaer. 1991. On the measurement of inequalities in health. Social Science and Medicine 33: 545–57.
Wagstaff, A., P. Paci, and H. Joshi. 2001. Inequalities in health: Who you are? Where you live? Or who your parents were? Evidence from a cohort of British 33-Year Olds. Paper presented at the “International Health Economics Association (IHEA)” Conference, July. < http://www.aes.org.pe/docs/inequalities.pdf> Accessed April 2010.
Wagstaff, A., and N. Watanabe. 2000. Socioeconomic inequalities in child malnutrition in the developing world. Policy Research Working Paper 2434. Washington, D.C.: World Bank.
WHO (World Health Organization). 1983. Measuring change in nutritional status: Guidelines for assessing the nutritional impact of supplementary feeding programmes for vulnerable groups. Geneva, Switzerland: World Health Organization.
WHO (World Health Organization). 1985. Physical Status: The Use and Interpretation of Anthropometry. Report of a WHO Expert Committee, WHO Technical Report Series 854. Geneva, Switzerland: World Health Organization.
WHO (World Health Organization). 1997. WHO Global Database on Child Growth and Malnutrition, Program of Nutrition, WHO Document No. WHO/NUT/97.4. Geneva, Switzerland: World Health Organization.
WHO (World Health Organization). 1999. Progress towards the elimination of Iodine Deficiency Disorders (IDD). Geneva, Switzerland: World Health Organization.
World Bank (2000) World Development Indicators, Washington DC: The World Bank.


RECENT IFPRI DISCUSSION PAPERS
For earlier discussion papers, please go to http://www.ifpri.org/publications/results/taxonomy%3A468. All discussion papers can be downloaded free of charge.
967. Foreign inflows and growth challenges for African countries: An intertemporal general equilibrium assessment. Xinshen Diao and Clemens Breisinger, 2010.
966. Biofuels and economic development in Tanzania. Channing Arndt, Karl Pauw, and James Thurlow, 2010.
965. Weathering the storm: Agricultural development, investment, and poverty in Africa following the recent food price crisis. Babatunde Omilola and Melissa Lambert, 2010.
964. Who has influence in multistakeholder governance systems? Using the net-map method to analyze social networking in watershed management in Northern Ghana. Eva Schiffer, Frank Hartwich, and Mario Monge, 2010.
963. How to overcome the governance challenges of implementing NREGA: Insights from Bihar using process-influence mapping. Katharina Raabe, Regina Birner, Madhushree Sekher, K.G. Gayathridevi, Amrita Shilpi, and Eva Schiffer, 2010.
962. Droughts and floods in Malawi: Assessing the economywide effects. Karl Pauw, James Thurlow, and Dirk van Seventer, 2010.
961. Climate change implications for water resources in the Limpopo River Basin. Tingju Zhu and Claudia Ringler , 2010.
960. Hydro-economic modeling of climate change impacts in Ethiopia. Gene Jiing-Yun You and Claudia Ringler, 2010.
959. Promises and realities of community-based agricultural extension. Gershon Feder, Jock R. Anderson, Regina Birner, and Klaus Deininger, 2010.
958. Rethinking the global food crisis: The role of trade shocks. Derek D. Headey, 2010.
957. Female participation in African agricultural research and higher education - New insights: Synthesis of the ASTI–award benchmarking survey on gender-disaggregated capacity indicators. Nienke M. Beintema and Federica Di Marcantonio, 2010.
956. Short- and long-term effects of the 1998 Bangladesh Flood on rural wages. Valerie Mueller and Agnes Quisumbing, 2010.
955. Impacts of the triple global crisis on growth and poverty in Yemen. Clemens Breisinger, Marie-Helen Collion, Xinshen Diao, and Pierre Rondot, 2010.
954. Agricultural growth and investment options for poverty reduction in Nigeria. Xinshen Diao, Manson Nwafor, Vida Alpuerto, Kamiljon Akramov, and Sheu Salau, 2010.
953. Micro-level practices to adapt to climate change for African small-scale farmers: A review of selected literature. Till Below, Astrid Artner, Rosemarie Siebert, and Stefan Sieber, 2010.
952. Internal migration and rural service provision in Northern Ghana. Fleur Wouterse, 2010.
951. Implications of avian flu for economic development in Kenya. James Thurlow, 2010.
950. Is SAFTA trade creating or trade diverting? A computable general equilibrium assessment with a focus on Sri Lanka. Antoine Bouët, Simon Mevel, and Marcelle Thomas, 2010.
949. Who should be interviewed in surveys of household income? Monica Fisher, Jeffrey J. Reimer, and Edward R. Carr, 2010.
948. Breaking the norm: An empirical investigation into the unraveling of good behavior. Ruth Vargas Hill, Eduardo Maruyama, and Angelino Viceisza, 2010.
947. Agricultural growth, poverty, and nutrition in Tanzania. Karl Pauw and James Thurlow, 2010.
946. Labeling genetically modified food in India: Economic consequences in four marketing channels. Sangeeta Bansal and Guillaume Gruère, 2010.
945. Toward a typology of food security in developing countries. Bingxin Yu, Liangzhi You, and Shenggen Fan, 2010.
944. Paving the way for development? The impact of transport infrastructure on agricultural production and poverty reduction in the Democratic Republic of Congo. John Ulimwengu, Jose Funes, Derek Headey, and Liangzhi You, 2009.

INTERNATIONAL FOOD POLICY RESEARCH INSTITUTE
www.ifpri.org
IFPRI HEADQUARTERS 2033 K Street, NW Washington, DC 20006-1002 USA Tel.: +1-202-862-5600 Fax: +1-202-467-4439 Email: [email protected]
IFPRI ADDIS ABABA P. O. Box 5689 Addis Ababa, Ethiopia Tel.: +251 11 6172500 Fax: +251 11 6462927 Email: [email protected]
IFPRI NEW DELHI CG Block, NASC Complex, PUSA New Delhi 110-012 India Tel.: 91 11 2584-6565 Fax: 91 11 2584-8008 / 2584-6572 Email: [email protected]