patterns of reading impairments in cases of anomia - dr christopher williams
TRANSCRIPT

i
TABLE OF CONTENTS
List of Figures .............................................................................................................. iv
List of Tables................................................................................................................. v
Acknowledgements ...................................................................................................... vii
Abstract........................................................................................................................ ix
Chapter 1. General introduction..................................................................................1:1
Cognitive models of language processing ...................................................................1:1
A simple model to explore language abilities: The ‘basic model’ ................................1:2
Two lexicons or four? ............................................................................................. 1:8
Different accounts of reading aloud ........................................................................ 1:9
The relationship between reading aloud and oral picture naming........................... 1:11
Research Aims...................................................................................................... 1:14
Chapter 2. Method ..................................................................................................... 2:17
Participants.............................................................................................................. 2:17
Recruitment of aphasic participants ...................................................................... 2:17
Recruitment of unimpaired controls ...................................................................... 2:18
Materials.................................................................................................................. 2:19
Procedures ............................................................................................................... 2:23
Scoring..................................................................................................................... 2:25
Analyses ................................................................................................................... 2:25
Chapter 3. Control group – results and discussion ................................................... 3:31
Regularity effects of unpublished tests ...................................................................... 3:31
Oral naming versus written naming.......................................................................... 3:32
Methodological issues .............................................................................................. 3:33
Chapter 4. A simple case to explain? ......................................................................... 4:37
Case description....................................................................................................... 4:37
Results...................................................................................................................... 4:37
Input processes ..................................................................................................... 4:38
Reading and repetition of words and nonwords..................................................... 4:38
The semantic system............................................................................................. 4:38
Picture naming...................................................................................................... 4:39
Discussion ................................................................................................................ 4:40

ii
Chapter 5. Three cases of phonological dyslexia ...................................................... 5:45
Case 1 – RPD........................................................................................................... 5:45
Results for RPD........................................................................................................ 5:45
Input processes..................................................................................................... 5:46
Reading and repetition of words and nonwords .................................................... 5:46
The semantic system ............................................................................................ 5:47
Picture naming ..................................................................................................... 5:48
Discussion – RPD .................................................................................................... 5:49
Case 2 – DHT .......................................................................................................... 5:53
Results for DHT ....................................................................................................... 5:53
Input processes..................................................................................................... 5:53
Reading and repetition of words and nonwords .................................................... 5:54
The semantic system ............................................................................................ 5:55
Picture naming ..................................................................................................... 5:56
Item consistency and comparisons........................................................................ 5:57
Discussion – DHT .................................................................................................... 5:58
Case 3 – DPC .......................................................................................................... 5:62
Results for DPC ....................................................................................................... 5:62
Input processes..................................................................................................... 5:63
Reading and repetition of words and nonwords .................................................... 5:63
The semantic system ............................................................................................ 5:64
Picture naming ..................................................................................................... 5:65
Discussion – DPC .................................................................................................... 5:67
Phonological dyslexia – general discussion.............................................................. 5:70
Chapter 6. Interpreting results for a bilingual aphasic ............................................ 6:73
Case description....................................................................................................... 6:73
Control M2........................................................................................................... 6:74
Results ..................................................................................................................... 6:74
Input processes..................................................................................................... 6:74
Reading and repetition of words and nonwords .................................................... 6:75
The semantic system ............................................................................................ 6:76
Picture naming ..................................................................................................... 6:77
Discussion................................................................................................................ 6:80
Chapter 7. A case of deep dyslexia ............................................................................ 7:87
Deep dyslexia........................................................................................................... 7:87
Case description....................................................................................................... 7:88
Results ..................................................................................................................... 7:89
Input processes..................................................................................................... 7:89
Reading and repetition of words and nonwords .................................................... 7:90
The semantic system ............................................................................................ 7:92
Picture naming ..................................................................................................... 7:92
Item consistency................................................................................................... 7:95
Discussion................................................................................................................ 7:96

iii
Chapter 8. Collective results for aphasic participants ............................................ 8:101
Collective results .................................................................................................... 8:101
Severity of aphasia and dissociations...................................................................... 8:105
Severity .............................................................................................................. 8:105
Dissociations and double dissociations................................................................ 8:106
Chapter 9. General discussion ................................................................................. 9:109
The basic model - conclusions ................................................................................ 9:109
Reading aloud..................................................................................................... 9:109
Semantic errors on oral naming........................................................................... 9:110
Comments on methodological issues....................................................................... 9:113
References.................................................................................................................... 117
Appendices................................................................................................................... 123
Appendix 1. Materials................................................................................................ 124
Appendix 2. Analyses................................................................................................. 132
Appendix 3. Control group results ............................................................................. 133
Appendix 4. Nonword reading ................................................................................... 135
Appendix 5. Error analysis for aphasic participants .................................................. 136

iv
List of Figures
Figure 1:1. The ‘basic model’ of language processing. ............................................... 1:3
Figure 1:2. The three reading routes of the basic model: ........................................... 1:5
Figure 1:3. The central components of any four-lexicon model. ................................ 1:8
Figure 1:4. The hypothesis described by Orpwood and Warrington (1995). .......... 1:12
Figure 2:1. Example Item from the comprehension test: ......................................... 2:21
Figure 3:1. Control group performance on repetition tasks. ................................... 3:36
Figure 4:1. The basic model, showing MWN’s proposed lesion site. ....................... 4:41
Figure 5:1. The basic model as it applies to RPD...................................................... 5:49
Figure 5:2. The basic model as it applies to DHT. .................................................... 5:59
Figure 5:3. The basic model as it applies to DPC...................................................... 5:68
Figure 6:1. Sample of written naming responses for JWS. ...................................... 6:79
Figure 6:2. Attempted alphabet by JWS................................................................... 6:80
Figure 6:3. The basic model as it applies to JWS...................................................... 6:82
Figure 7:1. The basic model as it applies to SJS. ...................................................... 7:97

v
List of Tables
Table 2:1. Descriptive data for the aphasic participants. ......................................... 2:18
Table 2:2. List and order of tests in each session. ..................................................... 2:24
Table 3:1. Summary of control results on published tests. ....................................... 3:31
Table 3:2. Summary of control group results on unpublished tests. ........................ 3:32
Table 3:3. Most frequently incorrect items on PPT for controls. ............................. 3:34
Table 4:1. MWN’s performance on tests of input processes..................................... 4:38
Table 4:2. MWN’s performance on reading and repetition tests. ............................ 4:38
Table 4:3. MWN’s performance on semantic tests. .................................................. 4:39
Table 4:4. MWN’s performance on the oral naming test. ........................................ 4:39
Table 4:5. MWN’s performance on the written naming test. ................................... 4:40
Table 5:1. RPD’s performance on tests of input processes. ...................................... 5:46
Table 5:2. RPD’s performance on reading and repetition tests................................ 5:47
Table 5:3. RPD’s performance on semantic tests...................................................... 5:47
Table 5:4. RPD’s performance on the oral naming test............................................ 5:48
Table 5:5. RPD’s performance on the written naming test. ..................................... 5:48
Table 5:6. DHT’s performance on tests of input processes....................................... 5:54
Table 5:7. DHT’s performance on reading and repetition tests. .............................. 5:54
Table 5:8. DHT’s performance on semantic tests. .................................................... 5:55
Table 5:9. DHT’s performance on the oral naming test. .......................................... 5:56
Table 5:10. DHT’s performance on the written naming test. ................................... 5:57
Table 5:11. Item consistency between tests of verbal output for DHT..................... 5:58
Table 5:12. DPC’s performance on tests of input processes. .................................... 5:63
Table 5:13. DPC’s performance on reading and repetition tests.............................. 5:64
Table 5:14. DPC’s performance on semantic tests. ................................................... 5:65
Table 5:15. DPC’s performance on the oral naming test.......................................... 5:65
Table 5:16. DPC’s performance on the written naming test..................................... 5:66
Table 5:17. Item consistency between oral naming and other tasks for DPC.......... 5:67
Table 6:1.JWS’ performance on tests of input processes.......................................... 6:75
Table 6:2. JWS’ performance on reading and repetition tests. ................................ 6:76
Table 6:3. JWS’ performance on semantic tests. ...................................................... 6:77
Table 6:4. JWS’ results on the oral naming test........................................................ 6:78
Table 6:5. JWS’ performance on the written naming test. ....................................... 6:79
Table 7:1. SJS’ performance on tests of input processes. ......................................... 7:90

vi
Table 7:2. SJS’ performance on reading and repetition tests. ................................. 7:90
Table 7:3. Reading errors for SJS. ............................................................................ 7:91
Table 7:4. SJS’ performance on semantic tests......................................................... 7:92
Table 7:5. SJS’ performance on the oral naming test............................................... 7:93
Table 7:6. Examples of oral naming errors for SJS.................................................. 7:93
Table 7:7. SJS’ performance on the written naming test. ........................................ 7:94
Table 7:8. Examples of written naming errors for SJS. ........................................... 7:95
Table 7:9. Item consistency between comprehension and naming for SJS.............. 7:95
Table 7:10. Item consistency between several tests for SJS...................................... 7:96
Table 8:1. Performance of aphasic participants on tests of input processes.......... 8:101
Table 8:2. Performance of aphasic participants on reading and repetition tests. . 8:102
Table 8:3. Performance of aphasic participants on semantic tests......................... 8:103
Table 8:4. Performance of aphasic participants on the oral naming tests. ............ 8:104
Table 8:5. Performance of aphasic participants on the written naming test ......... 8:105
Table 8:6. Comparison of the regular and exception word groups........................ 8:105

vii
Acknowledgements
First and foremost, I would like to thank all of the wonderful people who participated in
this project, without whom none of this would have been possible. For most of these
individuals, the assessment procedure involved several hours of testing, and I am eternally
grateful for the time and effort that you all devoted to the project. I must also thank two
participants, TB and FME, whose results were not included in the final report but who
gave there time nevertheless.
Second, I would like to acknowledge the professional assistance I received from various
people. In particular, my supervisors, Professor Max Coltheart and Associate Professor
Lindsey Nickels, who gave their time and effort over a period of many years, and who
never lost faith that I would eventually submit. For your time, advice, and understanding, I
cannot thank you enough. I am also grateful to the speech pathologists as St Joseph’s
Hospital and the Royal Rehabilitation Centre Sydney for their assistance in referring
patients and for being extremely accommodating in providing me with their time and other
resources. I am also indebted to many other academics and support staff of the Macquarie
Centre for Cognitive Science and the Psychology Department of Macquarie University for
their professional advice and assistance with resources.
Third, I would like to thank the many amazing people in my life who I am lucky enough to
have as family and friends. I am especially grateful to my parents, who not only provided
me with the love and support that they always have, but who also went out of their way to
help me with finding control participants. To all of my friends, including student peers,
team mates, work colleagues, flat mates, and long-term friends, I cannot express how
grateful I am for your professional support (including assistance with proof reading,
material preparation and other advice) and, more importantly, your moral support – I
would not have attained this feat without your compassion, reassurance, and
understanding.

viii

ix
Abstract
Over recent decades, research-based cognitive models of language have become
increasingly sophisticated. However, with increasing sophistication has come an equivalent
increase in complexity, to the extent that it is now more difficult than ever for clinicians to
utilise the model for testing hypotheses about patients and devise appropriate therapeutic
interventions. A series of six cases is presented to explore the capacity of the ‘basic model’
to account for various aphasic profiles, with a particular focus on hypotheses about reading
pathways. To this end, a series of experiments was designed using a single set of picture-
word items, with a focus on the balance between words with and without regular spelling-
sound correspondence. Various theoretical positions are discussed including the lexical
non-semantic route, the summation hypothesis, and the hypothesis that reading aloud and
oral naming are subserved by different phonological output lexicons (e.g. Orpwood &
Warrington, 1995).
Most of the aphasic participants presented with ‘output’ anomia, but for some this was in
the context of mild semantic deficits that may have contributed to their poor oral naming.
One of the participants was also completely unable to read nonwords, yet his reading of
real words, although impaired, did not contain semantic errors. This is an uncommon
finding and one that is incongruent with the summation hypothesis. Other participants
demonstrated intact reading of exception words despite being impaired on the oral naming
task, which further supports the inclusion of the lexical non-semantic route.
Another of the aphasic participants was considered in the context of being a late-acquired
bilingual speaker. He was compared not only to the main control group, but also to an
unimpaired, late-acquired bilingual speaker with the same language background. The basic
model was unable to account for his pattern of deficits, but it was determined that most
cognitive models, no matter how intricate, are inadequate to account for aphasic syndromes
in bilingual speakers.
The final case examines the profile of a participant with deep dyslexia. Although the basic
model is able to account for this participant’s profile, consideration is given to the right-
hemisphere hypothesis and to the notion that, due to wide ranging and as yet unknown
variables, standard cognitive models of language processing may again be inappropriate
for use with these cases.

x
It was concluded that the evidence supported the potential of the basic model and the
assumptions associated with it, including the lexical non-semantic route and the depiction
of only two lexicons, one each for spoken and written lexical entries. Additionally, several
methodological issues are discussed including poor sensitivity of several tests.

1:1
Chapter 1. General introduction
Anomia is usually characterised as general word-finding difficulties. It can exist as a
syndrome in itself or, more often, as a feature of a more general aphasic disorder (Garman,
1990). Almost every aphasic individual experiences some degree of impaired word
retrieval (e.g. Garrett, 1992; Weigel-Crump & Koenigsknecht, 1973), which is made
evident by the fact that the most common finding of aphasic research is the inability to
name pictures correctly (Goodglass, 1983). Analysis of the various causes of naming
failure, and the myriad of other lexical deficits associated with it, can reveal a great deal
about the cognitive architecture of language processing. This chapter introduces and briefly
discusses a range of issues surrounding cognitive models of language processing. In the
chapters that follow, some of these issues will be explored through a case series involving
six individuals with various anomic syndromes and degrees of impairment. In particular,
the potential for a ‘basic’ model of language processing to account for the deficits of these
individuals will be examined, and it will be argued that this relatively uncomplicated
model is sufficient to explain and understand acquired language deficits at a clinical level.
Cognitive models of language processing
In any cognitive model of lexical processing, the ability to perform normal linguistic
functions is explained by an array of processing modules linked to each other by a network
of pathways. These models do not aim to account for neural processing centres and
connections, rather, they are attempts to explain the processes involved in normal lexical
functioning, and are often constructed around hypotheses that are generated from case
studies of individuals with language impairments. Such hypotheses are generally based on
dissociations (i.e. when a certain process is impaired while another is intact) and, more
importantly, double dissociations (i.e. when two separate processes can be differentially
impaired) – for example, there are cases of impaired written naming with intact oral
naming and vice versa, indicating a double dissociation between the process involved in
each form of naming.
Whilst there are many ways in which the various models differ, by their very nature there
are many aspects that they must have in common. Specifically, all lexical models must be
able to explain the different processes involved in understanding and producing language,
at least at the level of single words. Therefore, all models must account for orthographic
processing (the way we process written words), phonological processing (spoken words),

1:2
recognition of 2- and 3-dimensional objects, and semantic processing (comprehension of
words and objects). The full range of everyday skills encompassed by a model should
include: Confrontation naming (naming of pictures and objects), both oral and written;
spontaneous speech and writing; recognition and comprehension of pictures, written words
and spoken words; reading aloud; written ‘copying’ and verbal repetition; and writing to
dictation. Also, models must account not only for our ability to process words that are
known to us, but also words that are novel or made up.
A simple model to explore language abilities: The ‘basic model’
The primary objective of this report is to show that a simple cognitive model of language is
sufficient to account for most aphasic individuals. Being able to precisely identify a
patient’s deficit within the context of a cognitive model can have significant implications
for the design of therapeutic intervention. However, due to their complex nature, the
practical application of the more sophisticated research-based models are often difficult for
clinicians to apply and interpret. Therefore, simplifying models to a degree that they can be
easily applied to the majority of cases could have significant implications for clinical
practice.
Keeping in mind the language abilities of normal speakers, in addition to the most
commonly reported and generally agreed upon aspects, the simplest model that could be
considered for clinical application is presented in Figure 1:1 (e.g. Allport, 1984; Allport &
Funnell, 1981; Jackson & Coltheart, 2001). The most peripheral, non-language features
such as initial acoustic processing and motor output are omitted, and internal processing of
modules is not defined.
At the centre of the basic model in Figure 1:1 is the semantic system, which stores and
processes conceptual information about the meanings of words and objects; it represents an
intricate network of semantic features (i.e. all the characteristics of the things that an
individual knows). To either side of the semantic system are the phonological lexicon and
orthographic lexicon, stores of all the spoken and written words (respectively) that an
individual knows.

1:3
Figure 1:1. The ‘basic model’ of language processing.
Input to the model can be auditory or visual. Auditory information first reaches the
phonological input buffer, which temporarily stores and processes phonemes (small units
of sound) before forwarding the information on to the phonological lexicon for activation
of the appropriate word forms, and to the phonological output buffer, where phonological
information is reorganised as speech. The pathway between the phonological input and
output buffers is the sublexical repetition route, and allows auditory input to be re-
processed as speech output – this is the mechanism that allows us to quickly repeat verbal
information (both real words and nonwords). Repetition of known words can also occur via
the phonological lexicon. Information from the phonological lexicon is also forwarded to
the semantic system where relevant semantic nodes are activated, enabling comprehension
of spoken words.
Visual input to the system can take two forms. Firstly, 2- and 3-dimensional objects are
identified and processed by the object recognition system, which then activates relevant
nodes in the semantic system. Naming of these objects is then made possible via the
phonological lexicon and phonological output buffer (for oral naming) or the orthographic
lexicon and orthographic output buffer (for written naming). Secondly, written input is

1:4
processed initially by a stage of letter identification, which associates the almost infinite
array of forms that each letter of the alphabet can take with the single letter that they
represent (i.e. no matter how the letter a is written – e.g. a, a, A, or A – it is usually
recognisable).
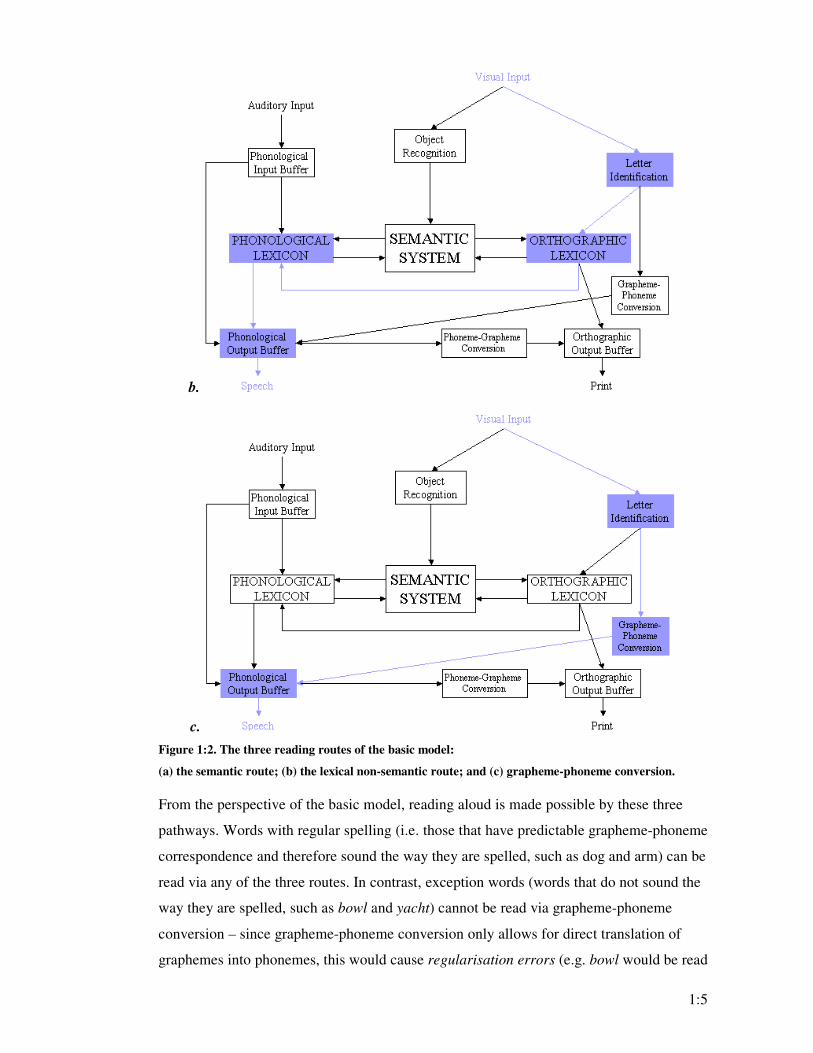
According to the basic model, reading aloud is made possible by three different routes, all
beginning at the stage of letter identification. The first, called the semantic route (Figure
1:2a), proceeds to the orthographic lexicon, through the semantic system, and on to the
phonological lexicon and phonological output buffer. The second (Figure 1:2b) is called
the lexical non-semantic route, and also proceeds to the orthographic lexicon. At this point
however, information is sent directly to the phonological lexicon, bypassing the semantic
system, before being forwarded on to the phonological output buffer. This pathway allows
for written words to be read aloud without necessarily activating semantic representations,
and is discussed in greater detail later in the chapter. The third route (Figure 1:2c) is a
direct connection from letter identification to the phonological output buffer via grapheme-
phoneme conversion. This pathway, also known as the sublexical route, allows for the
processing of strings of graphemes (a grapheme is a letter or group of letters that represent
a single phoneme) that do not have entries in the lexicons – that is, unfamiliar words,
foreign words and nonwords (i.e. plausible made-up words such as ploon and chup).
a.
1:5
b.
c.
Figure 1:2. The three reading routes of the basic model:
(a) the semantic route; (b) the lexical non-semantic route; and (c) grapheme-phoneme conversion.
From the perspective of the basic model, reading aloud is made possible by these three
pathways. Words with regular spelling (i.e. those that have predictable grapheme-phoneme
correspondence and therefore sound the way they are spelled, such as dog and arm) can be
read via any of the three routes. In contrast, exception words (words that do not sound the
way they are spelled, such as bowl and yacht) cannot be read via grapheme-phoneme
conversion – since grapheme-phoneme conversion only allows for direct translation of
graphemes into phonemes, this would cause regularisation errors (e.g. bowl would be read

1:6
as ‘bowel’ and yacht would be read as ‘yatched’ or ‘yacked’). However, exception words
can be read using either the semantic or lexical non-semantic route, since all words are
represented in the lexicons and simply need to be activated, first in the orthographic
lexicon, then in the phonological lexicon. Finally, novel words and nonwords can only be
read via grapheme-phoneme conversion, since these letter strings are not represented in the
lexicons. Damage to grapheme-phoneme conversion impairs the individual’s ability to read
nonwords, which will often (but not always) be read as lexicalisations (e.g. ploon might be
read as ‘plume’ or ‘prune,’ while chup might be read as ‘chap’).
Finally, the model needs to include components that can process novel words not only in
their written form, but also via auditory input. Repetition of novel words is achieved by the
sublexical repetition route, which connects the phonological input and output buffers.
Written dictation of novel words is achieved via phoneme-grapheme conversion, which is
responsible for converting sequences of phonemes into graphemes, thus allowing a person
to write novel strings of sounds that are heard. This process is not examined in the case
series, but is shown in the model because its existence is well supported by evidence in the
literature (e.g. Alario, Schiller, Domoto-Reilly, & Caramazza, 2003; Miceli, Capasso, &
Caramazza, 1999).
Damage to the model will result in a variety of deficits, depending on which component or
components are damaged, and the degree to which the components are still able to function
(see Allport, 1984; Allport & Funnell, 1981; Jackson & Coltheart, 2001). In broad terms,
there are two ways that lesions might affect the functioning of the core components of the
language system (i.e. the semantic system, phonological lexicon and orthographic lexicon)
– damage to the representations within the process, or reduced activation of those
representations. Generally, damage to the representations should lead to consistency of
errors. In other words, if the actual representations are damaged, then the same errors will
appear repeatedly, and for all tasks that rely on that module. On the other hand, reduced
activation, which is generally conceptualised as damage to the connections between
modules, is less likely to result in error consistency.
Damage to individual components will obviously lead to a particular set of impairments. If
the semantic system is damaged, comprehension will be impaired regardless of the method
of input (i.e. the individual will have difficulty understanding the meanings of pictures,
spoken words and written words). However, the most distinctive feature of ‘semantic

1:7
anomia’ is bimodal naming failure to all forms of input (Rothi, Raymer, Maher,
Greenwald, & Morris, 1991). That is, an impaired ability to name words both orally and in
writing, whether the stimuli are presented as pictures, written definitions or auditory
definitions. Semantic errors (meaning-related errors e.g. naming a car as a truck) should be
common because damage to particular semantic representations increases the likelihood of
lexical entries that are related by meaning being activated in the relevant lexicon (Miceli,
Amitrano, Capasso, & Caramazza, 1996).
Damage to a lexicon will lead to the inability to activate representations within that
lexicon. From the perspective of the basic model, this will lead to: a) reduced ability to
name pictures in that modality, with a range of error types including semantic and
phonological errors; b) difficulties with lexical decision (i.e. distinguishing between real
and made-up words) in that modality; and c) difficulties with comprehension of words
input from that modality. Other abilities might be partially affected. In particular, reading
aloud of exception words should lead to regularisation errors if either lexicon is damaged,
and if grapheme-phoneme conversion is intact. Likewise, writing of exception words to
dictation should be affected by damage to the phonological lexicon. However, nonword
reading, repetition and writing to dictation should all be possible, even if both lexicons are
damaged. In contrast, reduced activation of the lexicons from the semantic system should
lead to impaired picture naming of that modality, without affecting any other language
skill. Errors should be similar in nature to those seen for lexicon damage, including
semantic errors, but with less consistency predicted.
Post-lexical damage should also have similarities to lexical damage. In particular, damage
to the connection between the phonological lexicon and phonological output buffer should
impact on oral naming and reading of exception words. For naming, semantic errors would
not be expected since the lexical entry has already been selected. On the other hand,
auditory lexical decision should still be possible, as should repetition of words (via the
sublexical repetition route). Damage to the connection between the orthographic lexicon
and orthographic output buffer should mirror this pattern for writing. Finally, damage to
the input or output buffers should affect all input or output for that modality, while damage
to the object recognition process should affect all tasks that involve some aspect of
interpreting pictures or objects.

1:8
Two lexicons or four?
Perhaps the most audacious argument presented in the basic model is that only two
lexicons are defined, one each for spoken and written words. In contrast, the majority of
mainstream models describe separate lexicons for input and for output for each modality,
as depicted in Figure 1:3 below. Only the central components are shown, with peripheral
features omitted (e.g. input and output buffers, grapheme-phoneme conversion and direct
links between the lexicons), as are any hypothesised feedback mechanisms and
connections between the lexicons. This is because of the diverse range of configurations
that the various models hypothesise. On the other hand, the central features that are
pictured are common to most cognitive models of language processing (e.g. Hillis &
Caramazza, 1991; Martin & Saffran, 2002; Miceli et al., 1996; Nickels, 2000; Southwood
& Chatterjee, 2001).
Figure 1:3. The central components of any four-lexicon model.
A considerable number of debates surround this issue (refer to Howard, 1995, for an
extensive discussion on the topic; also see Martin & Saffran, 2002). However, despite the
general consensus of four lexicons, the objective of this report is to show that a simple
model is sufficient to account for the language of people with aphasia in a clinical setting.
Therefore, judgments as to whether or not aspects of particular models are fundamental
should not be restricted to peripheral components and pathways; determining the relevance
of core components, in particular the number of lexicons, is just as crucial. A
demonstration that two lexicons are sufficient would considerably decrease the complexity
of cognitive models of language. The majority of evidence that favours the position of a
distinction between input and output lexicons is not based on cases for which

1:9
representations are clearly lost in one but preserved in the other. Rather, the arguments are
based primarily on findings from intricate research methodology such as ‘dual-task
decrement’ (Shallice, McLeod, & Lewis, 1985) and research findings as they relate to
certain theoretical assumptions (see Howard & Franklin, 1988). However, at a clinical
level there is often a lack of distinction between input and output modules when
identifying deficits. Therefore, for the sake of simplicity the lexicons were not divided into
input and output processes, in accordance with previous advocates of this approach (e.g.
Allport & Funnell, 1981; Funnell, 1983; Jackson & Coltheart, 2001)
Different accounts of reading aloud
At first glance, the lexical non-semantic reading route might appear to be redundant.
Indeed, it is not entirely clear what purpose it serves for normal language, and is not
included in many models, such as the summation hypothesis (e.g. Hillis & Caramazza,
1991) and Plaut’s computational model (Plaut, McClelland, Seidenberg, & Patterson,
1996). However, omission of the lexical non-semantic route leads to certain predictions
concerning word reading for individuals with damage to the semantic reading route. First
of all, if grapheme-phoneme conversion is impaired, then reading aloud of real words
should include frequent semantic intrusions or omissions (Miceli et al., 1996). Indeed, this
is the profile observed for deep dyslexia. However, not all individuals with impaired
semantic processing and non-functional grapheme-phoneme conversion produce semantic
errors on word reading. For example, WB (Funnell, 1983) performed poorly on tests of
semantic processing and was completely unable to read nonwords, to the extent that he was
unable to generate a response for more than half of the items. Nevertheless, he performed
reading tasks with very few semantic errors or omissions.
The second prediction is that even if reading aloud is impaired (and includes semantic
errors) in addition to non-functional grapheme-phoneme conversion, as is generally the
case in deep dyslexia, then this function should be just as severely compromised as oral
naming, since the absence of grapheme-phoneme conversion should lead to a complete
reliance on the semantic reading route. However, reading aloud is consistently reported to
be superior to oral naming provided orthographic input is intact, even for individuals with
deep dyslexia. This phenomenon is “only consistent with the partial operation of (the
lexical non-semantic route)” (Howard, 1985, p403).

1:10
A third prediction is that if grapheme-phoneme conversion is intact or at least partially
active, then regularisation errors should occur on reading of exception words. In other
words, surface dyslexia should be evident (Patterson, Marshall, & Coltheart, 1985).
However, Weekes and Robinson (1997) report BP, whose performance on semantic tasks
such as word-picture and picture-picture matching was impaired. Furthermore, he was able
to name barely more than half of the picture items in the Snodgrass and Vanderwart
corpus, and nearly half of his errors were semantic errors. His nonword reading was also
impaired, though he successfully read approximately half of the items on a nonword
reading task. Nevertheless, on a set of 40 exception words, BP made only one error
(reading thumb as thump, most likely a visual error). This is considered by Weekes as
strong evidence that BP is reading via a lexical pathway that does not involve semantic
processing. This prediction also applies to post-semantic naming impairments – MRF was
considered to have an intact semantic system but was impaired on oral naming, with
partially active grapheme-phoneme conversion, yet there was no effect of regularity
observed (Orpwood & Warrington, 1995).
Although the predictions made by most cognitive models of language processing with only
two reading pathways are not supported by the literature, the summation hypothesis (e.g.
Hillis & Caramazza, 1991; Hillis, Rapp, & Caramazza, 1999; Miceli et al., 1996; Miceli,
Capasso, & Caramazza, 1994; Miceli, Giustolisi, & Caramazza, 1991), considers reading
aloud of real words to be achieved by the ‘summation’ of lexical and sublexical processes.
If the semantic reading route is only partially operational but the sublexical process is also
providing full or partial activation, reading of words, both regular and irregular, is still
possible. Partial semantic activation means that semantically appropriate representations in
the phonological output lexicon, including the target, are partially activated (e.g. the word
yacht will activate representations such as boat, mast, sail, and of course yacht). At the
same time, the sublexical process activates all phonologically appropriate representations
in the phonological lexicon (so yacht might activate representations for words such as yet,
yurt and, again, yacht). Therefore, the only node in the phonological output lexicon that
will be activated above threshold is the target word, yacht. All other representations that
are activated will fail to reach threshold.
However, an important assumption of the summation hypothesis is that a complete lack of
input from the sublexical process, in conjunction with a lesion at some stage of the
semantic reading route, should lead to frequent semantic errors in word reading (i.e. deep
1:11
dyslexia). On the other hand, partial activation from the sublexical process should all but
eliminate semantic errors (and reduce total errors), as seen in phonological dyslexia. As
mentioned, however, evidence from the phonological dyslexic WB (Funnell, 1983)
suggests that this distinction between phonological and deep dyslexia does not always hold
true. This debate is examined further in the case of DHT, who is presented in Chapter 5.
The relationship between reading aloud and oral picture naming
While there are many different interpretations of how word reading can be achieved
through lexical, sublexical and lexical non-semantic processes, language researchers agree
almost universally that the phonological process of reading words aloud overlaps with the
phonological process of oral picture naming. However, a challenge to this principle was
the suggestion that reading and oral naming have distinct phonological stores that can each
be selectively damaged. The first clear presentation of this hypothesis appeared in a 1995
article by Orpwood and Warrington. They described MRF, an individual with poor oral
naming of pictures and poor naming to definition, with frequent semantic errors. As
demonstrated by his poor nonword reading, MRF had only partial access to grapheme-
phoneme conversion. MRF was able to read real words, with no difference between regular
and exception items, and his repetition of nonwords was intact; therefore he must have had
a lesion affecting the grapheme-phoneme conversion process. Comprehension was also
intact, suggesting a lesion of the phonological output lexicon. However, from the
perspective of most serial models, this should also impair word reading.
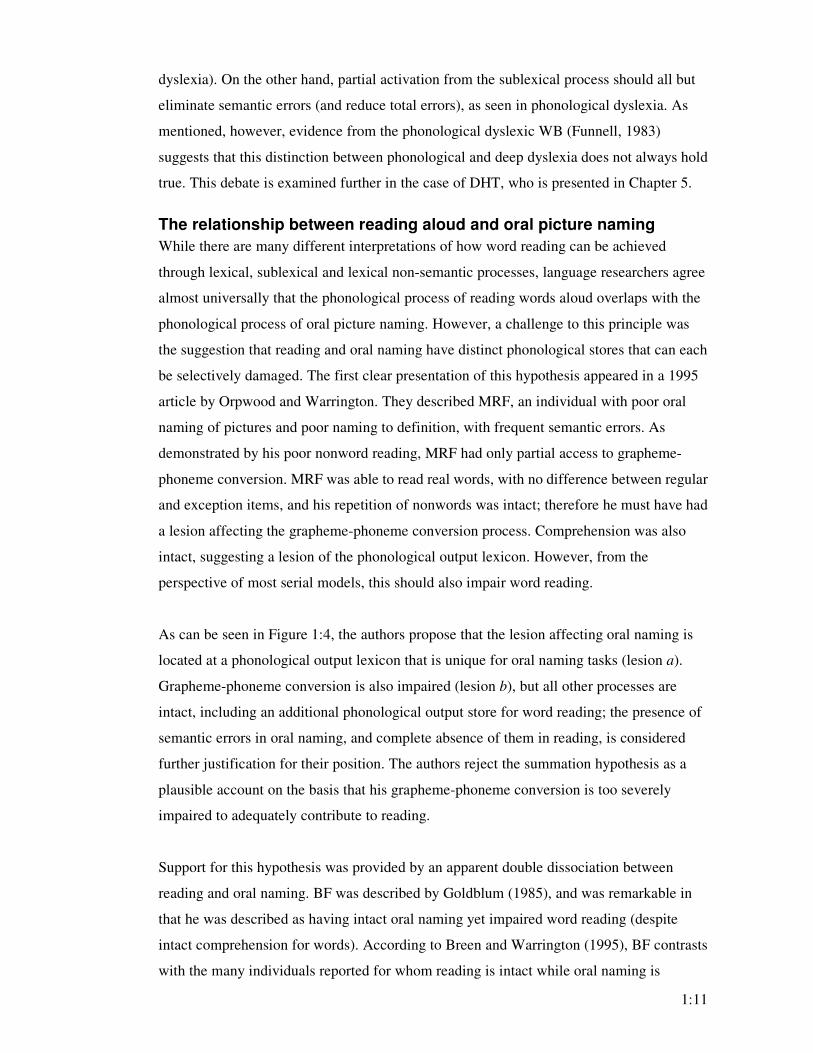
As can be seen in Figure 1:4, the authors propose that the lesion affecting oral naming is
located at a phonological output lexicon that is unique for oral naming tasks (lesion a).
Grapheme-phoneme conversion is also impaired (lesion b), but all other processes are
intact, including an additional phonological output store for word reading; the presence of
semantic errors in oral naming, and complete absence of them in reading, is considered
further justification for their position. The authors reject the summation hypothesis as a
plausible account on the basis that his grapheme-phoneme conversion is too severely
impaired to adequately contribute to reading.
Support for this hypothesis was provided by an apparent double dissociation between
reading and oral naming. BF was described by Goldblum (1985), and was remarkable in
that he was described as having intact oral naming yet impaired word reading (despite
intact comprehension for words). According to Breen and Warrington (1995), BF contrasts
with the many individuals reported for whom reading is intact while oral naming is

1:12
impaired, thus representing a double dissociation between these two abilities. In the
context of most mainstream models, there is no way to account for this phenomenon. The
solution, according to the authors, is independent stores for each task. Extending this
hypothesis, the authors conducted a series of priming experiments with participant NOR.
They found that priming by first reading the word had very little effect on NOR’s oral
naming unless the delay was extremely short. Although they concede that very little is
known about the specific effects of priming at the level of the phonological lexicon, they
consider this finding to represent a possible dissociation between the phonological
processes involved in reading aloud and oral naming.
Figure 1:4. The hypothesis described by Orpwood and Warrington (1995).
Green boxes and arrows indicate intact processing; red boxes and arrows represent the hypothesised
lesions. Only relevant processes are shown.
The most significant feature of the hypothesis of independent phonological stores is the
claim of a double dissociation between oral naming and reading aloud. However, this
position is challenged by Lambon Ralph, Cippoloti and Patterson (1999), who argue that
BF’s naming was not necessarily superior to oral reading, as purported by Goldblum
(1985). Three reason are given for this challenge: First, BF’s profile represented a complex
pattern of various dyslexic syndromes, rather than a single syndrome that could be
accounted for by an isolated lesion of output phonology; second, and most significantly,

1:13
reading and oral naming were not compared for the same set of words; finally, Goldblum
considered BF’s naming to be less impaired than reading partly because the majority of his
errors were almost always corrected – Lambon Ralph and colleagues (1999) argue that this
is far from a clear demonstration of normal functioning.
The claim that the summation hypothesis is unable to account for NOR and MRF is also
disputed by Lambon Ralph and colleagues. Rather, the presence of semantic errors in
naming but not in reading can be attributed to direct input from sublexical processes
because only minimal orthographic information is needed to block semantic errors. For
their participant MOS, who also performed poorly on oral naming and well on reading
aloud, they suggest that the phonological output lexicon itself is preserved, as is the
semantic system. Instead, it is the connection between these systems that is severed, with
reading aided by the sublexical process.
In accordance with the summation hypothesis, Lambon Ralph and colleagues (1999) go
further by suggesting that the reason why oral naming is frequently found to be impaired in
the context of intact reading is that oral naming is simply more vulnerable. There are two
factors that contribute to this vulnerability. First, there is no direct correspondence between
conceptual knowledge about an object and the phonological representation of that object’s
name, while reading is largely aided by the ‘quasi-regular’ mapping between orthography
and phonology. Second, only one source of phonological activation is available to oral
naming, while reading has at least two. In support of this claim is evidence that oral
naming in anomic participants can be improved by an additional source of phonological
activation such as phonemic cueing, making it as robust as reading aloud with its two
sources of phonological activation (Lambon Ralph, 1998; Lambon Ralph et al., 1999).
In a third article aimed at supporting the notion of multiple phonological output stores,
Crutch and Warrington (2001) present VYG, whose spontaneous speech was intact, but
whose oral naming and reading aloud were both impaired. Oral naming responses
consisted mostly of circumlocutions, with few phonological errors, while reading errors
were all phonological. Since VYG was able to comprehend words that he was unable to
read aloud, the authors concluded that the site of damage must be at the level of a
phonological output store, or perhaps access to the output store from semantics. Despite
the fact that VYG’s naming was more severely impaired than his reading, the authors
claim that damage to the ‘stronger’ reading process should affect naming in the same way
1:14
– the high number of phonological errors in reading, and almost complete absence of them
in naming, is therefore considered evidence for a double dissociation between the tasks.
However, there are several flaws in the logic of the articles discussed above. Firstly, if
reading aloud and oral naming are enabled by separate phonological stores, then the double
dissociation between them should not be restricted to differences in error patterns. There
should be individuals reported in the literature for whom reading is worse than oral naming
for the same items, a phenomenon which has not yet been described. Secondly, Crutch and
Warrington (2001) claim that VYG’s comprehension of words that he is unable to read
aloud indicates that his semantic system is unaffected. They fail to observe the principle
that receptive tasks such as word-picture matching place considerably less strain on the
semantic system than do expressive tasks (e.g. Howard, 1985; Laine, Kujala, Niemi, &
Uusipaikka, 1992; Lambon Ralph, Sage, & Roberts, 2000). If VYG does have a mild
semantic deficit, this could have a noticeable impact on oral naming, including generation
of semantic errors, with less of an impact on reading, which is assisted by partially intact
grapheme-phoneme conversion – thus leading to more phonological errors. Thirdly, many
authors argue that discrepancies of error types should actually be expected for the same
reason that reading aloud is considered to be less vulnerable to impairment than oral
naming (e.g. Newcombe & Marshall, 1980; Southwood & Chatterjee, 2000, 2001). If
additional phonological input constrains the responses, then more phonological errors, and
less semantic/circumlocutory errors should be evident.
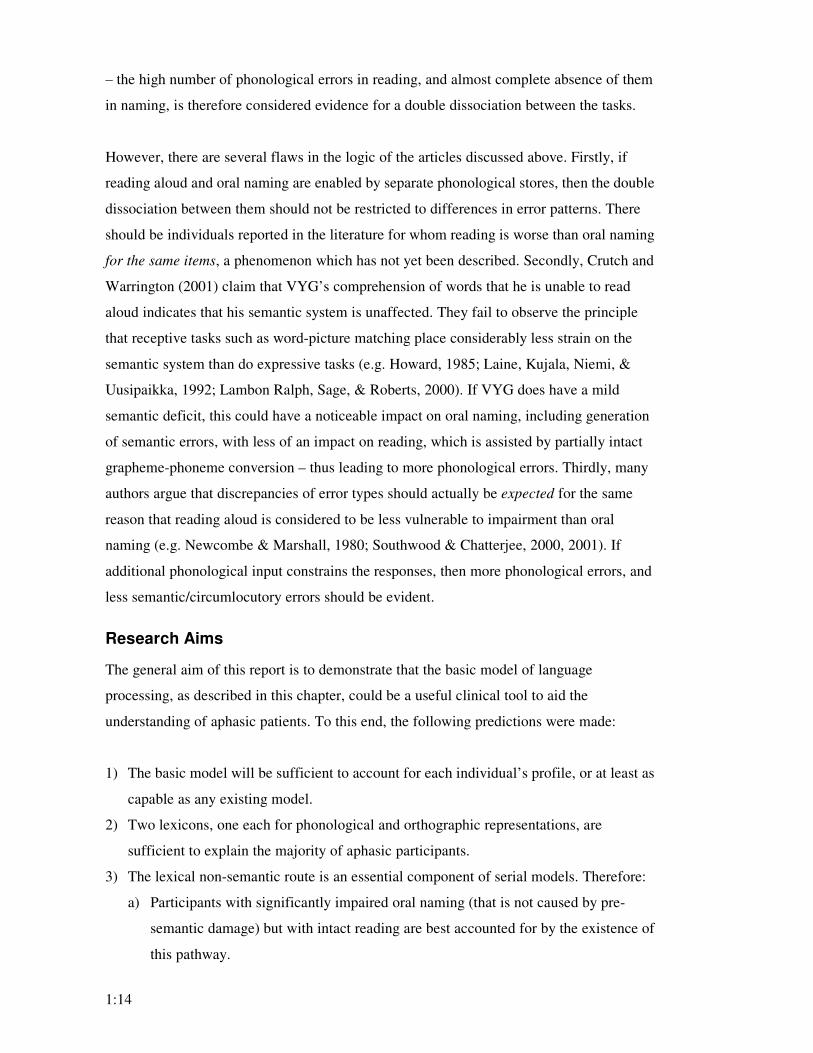
Research Aims
The general aim of this report is to demonstrate that the basic model of language
processing, as described in this chapter, could be a useful clinical tool to aid the
understanding of aphasic patients. To this end, the following predictions were made:
1) The basic model will be sufficient to account for each individual’s profile, or at least as
capable as any existing model.
2) Two lexicons, one each for phonological and orthographic representations, are
sufficient to explain the majority of aphasic participants.
3) The lexical non-semantic route is an essential component of serial models. Therefore:
a) Participants with significantly impaired oral naming (that is not caused by pre-
semantic damage) but with intact reading are best accounted for by the existence of
this pathway.

1:15
b) If grapheme-phoneme conversion is completely abolished for an individual with
damage to the semantic reading route, deep dyslexia will only result if the lexical
non-semantic route is also damaged.
c) Reading impairments exhibited by anomic participants will conform to models of
language retrieval that assume a shared phonological process for reading aloud and
for oral naming (i.e. Orpwood and Warrington’s (1995) hypothesis of distinct
phonological stores will not be supported).
The critical motivation for this study was the paucity of literature in which a single set of
stimuli is used for a variety of language tasks. By developing a range of tests with a single
set of words-picture items, aphasic participants could be assessed in such a way that intact
and defective functions could be determined with much greater confidence than if a variety
of different tests had been used, thus providing insight into what aspects of cognitive
architecture are required to account for the participants. Furthermore, by carefully
balancing the group of items so that half would have word names with regular spelling and
the other half irregular, it was expected that a great deal more might be revealed about the
process of reading aloud.
The next chapter describes the processes involved in material preparation, recruitment of
suitable participants, assessment procedures and analysis of results.

1:16

2:17
Chapter 2. Method
As was described in the previous section, one aim of this project was to assess the validity
of claims made initially by Orpwood and Warrington (1995) that reading aloud and oral
naming are subserved by distinct phonological stores. This chapter describes the
recruitment of participants and the tests used, including the development of the five
unpublished tests that were designed to investigate the Orpwood and Warrington (1995)
hypothesis. It also describes the procedures that were followed for administration, scoring
and analysis of the battery of tests. As will be made clear, the lack of evidence for or
against this hypothesis did little to diminish the value of the results.
Participants
Recruitment of aphasic participants
Aphasic participants were recruited with the assistance of Speech Pathologists at the Royal
Rehabilitation Centre Sydney and St Joseph’s Hospital, through the Macquarie University
Psychology Clinic, and researchers at the Macquarie Centre for Cognitive Science. The
criteria for recruitment were adults with aphasia sustained at least 6 months prior to the
assessment, who presented primarily with anomia, without excessive interference from
complicating factors such as impaired hearing or vision, global cognitive dysfunction or
prominent motor-speech deficits, including dysarthria or verbal dyspraxia. Individuals with
mild complicating deficits were still requested with the understanding that they would be
excluded if necessary, though none were excluded on this basis. Individuals were also
excluded if they were identified as having recent psychiatric risk factors such as suicidal
ideation, depression or heightened anxiety.
A total of 12 potential participants were recruited. Of these, 7 were considered appropriate
based on the inclusion and exclusion criteria. One was excluded due to a near-ceiling
performance on most tests, two had recovered to the point that they were speaking fluently
in conversational speech, and two individuals who showed interest were excluded on the
basis of psychiatric conditions as it was considered unethical to risk placing them into a
potentially stressful situation. One participant, FME, was described in a separate report in
relation to her diagnosis of herpes simplex encephalitis, and is not discussed any further in
this dissertation. Descriptive data for the six remaining participants appear in Table 2:1
below. Each participant is described in detail in the following chapters.

2:18
Ch
ap
ter
Part
ic-
ipan
t
Ag
e
Ed
uca
tio
n
Sex
Description of injury/illness
Months Since Injury
Acute deficits (immediately post-onset)
Relevant Medical History
Vision/ Glasses
4 MWN 76 10 F
LMCA ischaemic with minor cortical atrophy
8
Broca's aphasia; dysarthria; mild verbal dyspraxia; mild right arm weakness
AMI 1990; mitral valve repair; TIA; hypercholesterolemia
Bifocals
5 RPD 65 10 M LMCA infarct 29 Unknown
Right meningioma and debulking surgery; CABG; high cholesterol
Glasses (short and reading)
5 DPC 51 11 F LMCA haemorrhagic
56 Confusion; aphasia
Type II DM; migraines; anxiety disorder
Reading
5 DHT 62 9 M LMCA cerebral embolic infarct
35
Right hemiplegia; non-fluent aphasia, agrammatism
Infective endocarditis; CABG
Bifocals
6 JWS 69 9 M LMCA ischaemic
24 Right hemiparesis; hemisensory loss; global aphasia
Unknown Reading
7 SJS 43 10 M
LMCA haemorrhagic with bifurcation aneurism
83
Severe frontal headache; vomiting; global aphasia/dysphonia
Hypertension Glasses (short)
Table 2:1. Descriptive data for the aphasic participants.
Education = total years of formal education; LMCA = left middle cerebral artery; CABG = coronary
artery bypass graft; AMI = acute myocardial infarction; TIA = transient ischaemic attack; DM =
diabetes mellitus.
Recruitment of unimpaired controls
Unimpaired controls were recruited through personal contacts, and were seen in two
groups. The first group took part in the validation stage, and consisted of 10 age
appropriate controls (M = 59.63, SD = 4.35) with appropriate anticipated years of
education (M = 11.7, SD = 2.63). These participants were selected on the basis of expected
age and education levels of the ABI participants, who had not yet been identified. For the
second control group, 16 unimpaired participants were initially recruited, of which two had
also been involved in the validation stage. One participant, M2, emigrated from the
Netherlands at the age of 21. Because English is his second language, he was excluded
from the main control group. However, his data are presented in Chapter 6 as a comparison
for JWS, an aphasic participant with a similar background.

2:19
The remaining 15 individuals, 8 females and 7 males, were included in the main group.
Independent t-tests revealed no significant difference between the seven original aphasics
and the control group for either age (aphasics M = 61.00, SD = 12.08; controls M = 60.20,
SD = 6.35; t(19) = 0.20, p = 0.84) or years of formal education (aphasics M = 9.83, SD =
0.75; controls M = 10.07, SD = 1.16; t(19) = 0.45, p = 0.66).
Many of the control participants wore glasses, and several had mild visual impairments
(e.g. cataracts) though testing did not reveal any obvious visual difficulties (i.e. they did
not perform any worse than other controls on tests that might be sensitive to visual
impairment). Also, four members of the main control group (three males, one female)
reported mild hearing difficulties, which were not identified until nonword repetition was
attempted. The justification for including these individuals is that such mild hearing loss
and visual difficulties are clearly common in this population, and difficult to identify.
Therefore, similar difficulties cannot be eliminated as a cause of poor performance for
some of the aphasic participants; the effect of mild hearing loss on repetition tasks is
discussed in Chapter 3. Two participants emigrated from England about 25 years ago, and
the results of these individuals are also examined more closely in Chapter 3.
Materials
One of the key predictions made by the Orpwood and Warrington (1995) hypothesis is that
if oral naming is impaired, and the cause of this impairment can be localised to the
phonological output lexicon, then words with regular spelling should be less affected on a
reading task than words with irregular spelling, assuming that grapheme-phoneme
conversion is still involved. Determining the effects of regularity on reading performance
is also tantamount to hypotheses relating to the lexical non-semantic route. Therefore, the
primary objective when preparing the materials was to focus on this contrast between
regular and exception words by gathering two word lists that differed only in this respect.
That is, the word items needed to be matched on criteria such as frequency and linguistic
complexity. In order to further limit potential differences in linguistic complexity, only
monosyllabic words were chosen. Since the items also needed to be named, only words
that could be easily elicited by their pictures were appropriate, which considerably limited
the number of appropriate items. For example, a picture of a yacht will just as often be
named as a boat; pictures of a buoy and a raft proved to be difficult to identify for many
people.
2:20
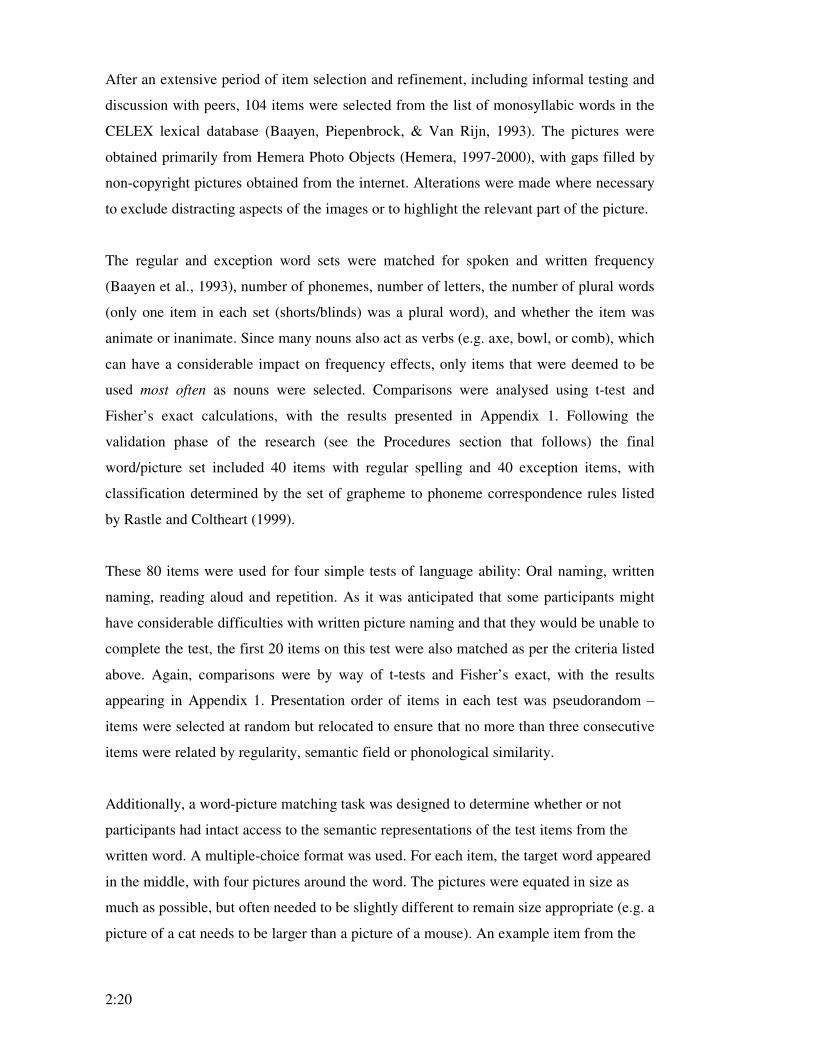
After an extensive period of item selection and refinement, including informal testing and
discussion with peers, 104 items were selected from the list of monosyllabic words in the
CELEX lexical database (Baayen, Piepenbrock, & Van Rijn, 1993). The pictures were
obtained primarily from Hemera Photo Objects (Hemera, 1997-2000), with gaps filled by
non-copyright pictures obtained from the internet. Alterations were made where necessary
to exclude distracting aspects of the images or to highlight the relevant part of the picture.
The regular and exception word sets were matched for spoken and written frequency
(Baayen et al., 1993), number of phonemes, number of letters, the number of plural words
(only one item in each set (shorts/blinds) was a plural word), and whether the item was
animate or inanimate. Since many nouns also act as verbs (e.g. axe, bowl, or comb), which
can have a considerable impact on frequency effects, only items that were deemed to be
used most often as nouns were selected. Comparisons were analysed using t-test and
Fisher’s exact calculations, with the results presented in Appendix 1. Following the
validation phase of the research (see the Procedures section that follows) the final
word/picture set included 40 items with regular spelling and 40 exception items, with
classification determined by the set of grapheme to phoneme correspondence rules listed
by Rastle and Coltheart (1999).
These 80 items were used for four simple tests of language ability: Oral naming, written
naming, reading aloud and repetition. As it was anticipated that some participants might
have considerable difficulties with written picture naming and that they would be unable to
complete the test, the first 20 items on this test were also matched as per the criteria listed
above. Again, comparisons were by way of t-tests and Fisher’s exact, with the results
appearing in Appendix 1. Presentation order of items in each test was pseudorandom –
items were selected at random but relocated to ensure that no more than three consecutive
items were related by regularity, semantic field or phonological similarity.
Additionally, a word-picture matching task was designed to determine whether or not
participants had intact access to the semantic representations of the test items from the
written word. A multiple-choice format was used. For each item, the target word appeared
in the middle, with four pictures around the word. The pictures were equated in size as
much as possible, but often needed to be slightly different to remain size appropriate (e.g. a
picture of a cat needs to be larger than a picture of a mouse). An example item from the

2:21
comprehension test appears in Figure 2:1. For each written word item, the pictures
included:
a) The target picture;
b) A semantic distractor – the regular and exception word groups were matched for
degree of semantic relatedness between the distractor and the target based on
figures sourced from Maki, McKinley and Thompson (2004) as well as the type of
semantic relationship (each pair was broadly classified as either related by
association, such as bowl and spoon, or simply being members of the same
category, such as an axe and a saw);
c) A phonological/orthographic distractor – the two groups were matched for degree
of phonological relatedness; and
d) An unrelated distractor.
bowl
Figure 2:1. Example Item from the comprehension test:
The given word item (bowl), the target picture, the semantic distractor (spoon), the phonological
distractor (bell), and the unrelated distractor (tricycle).
Most pictures appeared more than once throughout the test, though none appeared more
than three times in total (including once as the target, for many of the pictures). The full
list of items for the comprehension test appears in Appendix 1, along with relatedness
figures and classifications, and statistical calculations.
Other tests: Aphasic participants were also assessed on several published tests in order to
assess the integrity of other aspects of the lexical system. The following tests were
administered:
• Tests from the Psycholinguistic Assessment of Language Processing in Aphasia
(PALPA, Kay, Lesser, & Coltheart, 1992):

2:22
o Visual lexical decision (subtest 25) – spelling-sound regularity
(distinguishing real words (regular and exception) from nonwords
(pseudohomophones and non-homophonic nonwords)). This test was used
to assess the integrity of the orthographic lexicon and input to it. Chance is
50% on this test.
o Homophone decision (subtest 28) – judging whether or not pairs of words
(with regular and irregular spelling) or nonwords sound the same. This test
relies on the integrity of multiple components of lexical processing,
including the orthographic lexicon, phonological lexicon, grapheme-
phoneme conversion and the phonological output buffer. The error pattern
of this task, in particular the contrast between real word and nonword pairs,
is often more important than the total score. Chance is 50% for this test also.
o Nonword reading and repetition (subtest 36) – grapheme-phoneme
conversion and the sublexical repetition route can potentially play an
important role in processing of words, particularly when other abilities are
impaired. Therefore, assessment of nonword reading and repetition was
vital. To enable relevant comparisons, it was also crucial that the nonword
items be comparable to items used for the unpublished tests (i.e. the 80
regular and exception words discussed previously). Indeed, two-tailed
independent t-tests revealed no significant difference between the 80 test
items and the 24 nonwords used in PALPA for either number of letters (for
real words M = 4.30, SD = 0.79; for nonwords M = 4.50, SD = 1.14, t (102)
= 0.98, p = 0.33) or number of phonemes (for real words M = 3.30, SD =
0.80; for nonwords M = 3.42, SD = 0.72, t (102) = 0.64, p = 0.52).
o Cross-case matching (subtest 19) and, for participants who made errors on
this test, mirror reversal (subtest 18). These tests were intended to eliminate
an impairment of letter identification as the cause of a participant’s
difficulties with processing written words.
• Pyramids and Palm Trees test (PPT, Howard & Patterson, 1992) – this test requires
the participant to match the stimulus item (picture, written word or spoken word) to an
associated item from a choice of two semantically related pictures. Three versions
were utilised in order to assess the integrity of the semantic system and input to it:
o 3 pictures version – poor performance relative to the other versions might
suggest reduced input from object recognition.

2:23
o 2 pictures + 1 written word version – relatively poor performance suggests
reduced input to the semantic system from the orthographic lexicon.
o 2 pictures + 1 spoken word version – relatively poor performance suggests
reduced input to the semantic system from the phonological lexicon.
Equal difficulty with all three versions is indicative of damage to representations
within the semantic system.
• From the Birmingham Object Recognition Battery (BORB, Riddoch & Humphreys,
1993):
o Subtest A (hard). This subtest is comprised of 32 black and white drawings
of which half are real and half are made up from two different objects (e.g.
the body of a cow with the head of a horse). This tests the integrity of the
object recognition process.
Procedures
Validation phase: The original 104 pictures were shown to the validation group of controls
on the screen of a 17” laptop computer using Microsoft PowerPoint. In cases where the
target was provided in conjunction with an appropriate non-target word (e.g. ‘crow, bird’
for the desired target of crow), the target was considered to have been achieved (on testing,
aphasic participants and members of the second control group were prompted to provide
another response if they answered with an appropriate non-target word). Likewise, if the
target response was included as part of a larger, similarly appropriate response (e.g. steak
� ‘t-bone steak’; plane � ‘aeroplane’), the item was considered appropriate for inclusion,
and hence correct if produced by the aphasic participants and members of the second
control group. Items were only included if the target word was achieved by nine out of ten
controls in the validation group, and the two word groups (regular/exception words) were
matched for the number of participants who named each word correctly (mean number
correct out of 10 for the regular group was 9.85 (SD = 0.33) and for the exception word
group 9.75 (SD = 0.44), t(78) = 0.42; p = 0.68).
Experimental phase: The items for four tests were shown to all participants on a 17” laptop
screen using Microsoft PowerPoint – the items for the repetition task were read by the
examiner. For picture naming (oral and written) and reading, five seconds was allowed for
the response, with the timing controlled by the computer (a further 5 seconds was allowed
if the participant was prompted to provide a different response, as described for the
validation study). For written naming, the time limit only applied to the commencement of

2:24
writing a name to allow for any motor difficulties (i.e. extra time was allowed for slow
writing, within reason). For repetition, the 80 items were read to the participant, with 5
seconds allowed for each response. Ten seconds was allowed for each item on the
comprehension test. A five second gap (a blank screen) separated each item on all tests
except for repetition, for which one to two seconds separated each response from the
following item. Participants were permitted to move through the computerised tests faster
by pressing an appropriate key on the keyboard.
The assessments with all participants were conducted over four sessions, with each session
a week apart (or within 2 days). The tests administered in each session are listed in Table
2:2 below. The unpublished tests were spread out over the sessions to reduce the effects of
priming. The exception was the last session, during which written naming was followed
soon after by repetition; it was considered too impractical and burdensome on the
participants to extend testing beyond four sessions. Controls were assessed on all tests
except for cross-case matching, on which unimpaired individuals are assumed to be 100%
accurate.
Session 1 � Interview
� Comprehension test
� PPT (3 pictures)
Session 2
� Oral naming test
� PPT (2 pictures, 1 written word)
� Visual lexical decision – regularity (PALPA: 25)
� Object decision (BORB: Subtest A – Hard)
� Homophone decision (PALPA: 28)
� Nonword reading (PALPA: 36)
Session 3
� Reading test
� PPT (2 pictures, 1 spoken word)
� Nonword repetition (PALPA: 36)
� Cross-case matching (PALPA: 19)
Session 4 � Written naming test
� Repetition test
Table 2:2. List and order of tests in each session.
Italics indicate unpublished tests.
The structure of testing was not varied between participants; all aphasic and unimpaired
participants completed the tests in the same order. This was to ensure consistency with, and
therefore enable accurate interpretation of, practice effects and priming.

2:25
Scoring
For the unpublished tests, clarification of certain error types is needed:
• Phonological error was scored when at least half of the target phonemes were
produced in the correct position.
• Spelling error was scored for written naming if at least half of the target letters were
produced in the correct position (e.g. chef�chark).
• Mixed errors were considered unrelated unless there was an obvious connection
with the target item (e.g. bone � dag (presumably dog) in written naming was
considered a semantic error).
• Errors that were self-corrected within the time limit were considered correct without
further consideration.
• Morphological errors were primarily inflectional errors (mostly addition or deletion
of the plural –s).
• Based on the responses of controls, plural variation in picture naming was
considered acceptable for two items, blind/s, for which both variants are common, and
gate/s (which was generally named as the singular, but since the picture was of a two-
part gate this could not be considered an error). Also, the pronunciation of vase varied
(either pronounced /vaz/ or /veIs/).
• No response errors included items for which some effort was made but nothing
meaningful (i.e. only one phoneme or letter) was generated.
Finally, although errors on the comprehension test appear fairly straightforward, there is at
least two ways that the actual error types could reflect problems such as reduced visual
acuity or scanning. First, the phonological distractors more often than not had names that
were visually similar to the target (e.g. ball/bell; nose/hose) – therefore, many phonological
errors could actually be visual or orthographic errors. Second, many of the semantic
distractors were not only visually similar to the target, but in some cases were actually
more prominent (especially when the distractor picture, but not the target, had the
background removed) – therefore, some semantic errors could actually reflect failure to
adequately scan all components of the item, which might account for the rare control
errors.
Analyses
Measures of impairment: To ascertain whether or not an aphasic participant performed
significantly worse than the control group, the Bayesian methodology of Crawford and

2:26
Garthwaite (2007) was employed (using the software for simple difference, cited in the
same article). This was the primary calculation used for determining whether or not a
participant had performed significantly worse than the control group on a particular task.
Because the regular and exception groups were so well matched in terms of control
performance, Fisher’s exact test (an unstardardised method of comparing independent
groups) was used to determine differences, rather than Crawford and Garthwaite’s
standardised calculation, which was influenced by ceiling effects.
For certain participants, the discrepancy between two unpublished tests was measured with
McNemar’s Test, with the obvious caveat that the tests differ slightly in their levels of
difficulty, meaning a certain level of subjective interpretation was unavoidable. The
Crawford and Garthwaite method (2007) proved to be inappropriate for judging these
discrepancies and dissociations due to the differing influences of ceiling effects on the
different tests.
Item consistency: An important consideration for error analysis is item consistency, or the
comparison between two tasks for a particular set of items. Since language based entries
are conceptualised as representations stored within the semantic system and each of the
lexicons, damage to particular representations should lead to errors on the relevant items
regardless of the task, assuming that the same processing module is necessary for each of
the tasks being compared. For example, damage to representations in the semantic system
might lead to item consistency for oral naming, written naming and word-picture matching
for particular items, but not necessarily for repetition or reading; damage to representations
in the orthographic lexicon might lead to consistency for reading, word-picture matching
and written naming, but not repetition or oral naming. On the other hand, a lesion that
causes reduced activation of a processing module, rather than damage to the
representations in the module, would not be expected to result in such consistency.
Therefore, item consistency can, in certain conditions, provide an indication of the extent
to which two deficits might be related by a single lesion.
However, there are several aspects of item consistency that warrant caution when
interpreting the results. First of all, not all tasks have the same ‘degree of difficulty’ – even
for unimpaired individuals, written naming is usually performed less well than oral
naming, at least for English in which written naming entails not only naming the picture,
but also retrieving details about complex spelling rules and a large number of memorised

2:27
word spellings that do not abide by rules or even a consistent exception to the rule (for
example, it would not be unusual for some unimpaired individuals to be unable to spell
words such as yacht). Furthermore, impaired participants could easily have multiple lesion
sites affecting particular abilities, yet it is still relevant to investigate the possibility that
one of the lesions is at least partially responsible for two or more of the deficits. Therefore,
calculation of item consistency between different tasks should include an element of
maximum consistency or ‘maximum overlap,’ which is discussed shortly.
The second caution relating to item consistency is that a certain level of similarity is often
expected between two tasks even if the difficulties on the tasks are not the result of a single
lesion. This argument relates most prominently to the relationship between oral and written
naming, and arose from observations that certain participants with post-semantic naming
impairments would demonstrate statistical consistency between the two tasks, suggesting
to many that there could be an additional process after the semantic system but before the
lexicons (e.g. Levelt et al., 1991; Raymer et al., 1997; Raymer, Maher, Foundas, Rothi, &
Heilman, 2000). However, several authors have questioned the need for this additional
process in accounting for item consistency. For example, Miceli and colleagues (1991)
consider a certain level of consistency to simply represent deficits resulting from co-
occurring lesions affected by the same linguistic factors such as word frequency,
imageability and linguistic complexity. That is, for any particular set of words, it is likely
that the least frequent and most complex words will be the most vulnerable. This can lead
to consistency between any tasks that happen to share the same common pressures.
Furthermore, the particular common pressures are different for different pairs of tasks. For
example, for oral and written naming, word frequency and imageability are likely to play a
role, while for reading aloud and written naming, word frequency and grapheme-phoneme
regularity might lead to consistency, and the effect of imageability is perhaps less
predictable. Therefore, it is important to keep in mind that a certain level of consistency
between tasks, even beyond what would be predicted from mathematical chance, could
simply be the result of the factors that affect both tasks.
Despite these cautions about interpreting item consistency, the benefit of being able to
judge the relationship between two deficits makes this form of analysis extremely
worthwhile. There are numerous methodologies for calculating and interpreting
consistency (see Howard, 1995, for a statistical procedure that attempts to negate the
effects of some of the variables that affect word retrieval). Although it is theoretically

2:28
possible to use or devise a procedure for determining statistically significant consistency
that takes into account frequency, visual complexity, phonological and orthographic
complexity and so on, the nature of comparing the results of two different tests is so
complex that it is not reasonable to consider such a method to be entirely accurate.
Furthermore, attempting to compare five different tests with such a methodology would
mean calculating the effects of the various factors for up to ten comparisons, each with
different common factors with varying degrees of impact for each. For these reasons, a
straightforward method was used to allow qualitative judgement of item consistency
between tests.
Simply put, the actual overlap (of correct plus incorrect responses) is compared to the
maximum overlap and the chance overlap. The maximum overlap is the greatest that the
overlap between two tests can be, given the difference in test scores, and is found by
adding the number of errors of the more accurate test to the number of correct responses on
the less accurate test. For example, if the score on oral naming is 60/80 and the score on
written naming is 30/80, then the maximum overlap is 50 (20 errors on oral naming plus 30
correct on written naming). In other words, the overlap between the two tests, given the
difference in performance, cannot be higher than 50. The closer the scores are for two tests,
the higher the maximum overlap. The chance overlap, which is derived from Cohen’s
Kappa, is the overlap that would be predicted by chance alone, given the difference in
scores (assuming complete independence). This figure is found by multiplying the number
of errors on test a by the percentage of errors on test b, added to the number correct on test
a multiplied by the percentage correct on test b. Since the figure does not attempt to
incorporate item frequency or complexity, there is no illusion that the comparison can
render a statistically sound comparison. Rather, it simply allows an estimate that can be
used for all of the comparison regardless of the common pressures that would be expected.
This allows for a more honest comparison by allowing a much greater depth of
interpretation and debate, instead of relying on a statistical procedure that may or may not
encompass all of the relevant factors. Calculation of overlap is explained further in
Appendix 2.
By considering the actual overlap as it compares with the chance overlap and maximum
overlap, a qualitative judgement can be made about the relationship between two tasks: An
overlap closer to chance than to the maximum suggests little or no relationship; a score
midway between chance and the maximum suggests a possible relationship, with possible

2:29
involvement from common pressures; finally, an overlap that is close to the maximum is a
good indication of a relationship between the tasks, provided the maximum is reasonably
high (if tests differ too greatly in score, the maximum overlap can be too low to allow a
meaningful interpretation).
Nonword reading and repetition: In addition to presenting the results of the two nonword
tasks in terms of number of items correct, an additional calculation was performed to
assess the level of accuracy of the individual phonemes produced. This phoneme overlap is
a simple method of displaying a participant’s accuracy when their total score on the test is
below normal levels. For each item, the number of phonemes in the target response is
compared with the number of correct phonemes in the actual response. The lesser of the
two is then divided by the greater to achieve a figure that represents the percentage of
correct phonemes that were achieved for that item. For example, if ploon is read as ‘foon,’
two of the 4 target phonemes have been achieved, or a 50% overlap. The mean overlap for
all 24 items can then be calculated.
The number of lexicalisations is also recorded. These are items that are generated as real
words that are similar to the target (usually within a single phoneme or grapheme of the
target). A relatively high number of lexicalisations for a particular test suggests that the
lexicons are being employed to process novel grapheme or phoneme sequences, rather than
grapheme-phoneme conversion (for nonword reading) and the sublexical repetition route
(for nonword repetition). A high number of lexicalisations also reduces the relevance of
phoneme overlap; for example, DHT (Chapter 4) had an overlap of 31% on nonword
reading, but it came almost entirely from his lexicalisations suggesting that nonwords were
being read via lexical processes and not at all by grapheme-phoneme conversion. On the
other hand, a reasonable overlap with a lower number of lexicalisations would suggest at
least partial access to grapheme-phoneme conversion.
The following chapter presents and discusses the results of the 15 unimpaired participants
whose data allowed enabled effective analysis of the aphasic participants.

2:30

3:31
Chapter 3. Control group – results and discussion
Before reporting and discussing each of the aphasic participants, several issues arose from
the control group data that are worth discussing. Summary data of testing with control
participants appear in Tables 3:1 and 3:2. Full results are reported in Appendix 3.
BORB PALPA PPT
Object
decision Lexical
decision Homophone
decision Nonword reading
Nonword repetition
Mean 3P 2P1W 2P1S
n 32 60 60 24 24 52 52 52 52
Mean 25.93 58.33 55.65 22.94 21.73 50.44 50.07 50.73 50.53
StDev 2.66 2.38 3.46 1.18 3.16 1.42 1.94 1.33 1.30
Lowest 20 53 50 21 13 46.33 45 47 47
Table 3:1. Summary of control results on published tests.
Mean, standard deviation (StDev) and lowest score for each of the published tests. For PPT, Mean =
mean of all 3 versions; 3P = 3-picture version; 2P1W = 2-picture/1-written word version; 2P1S = 2-
picture/1-spoken word version.
Regularity effects of unpublished tests
Since one of the aims of the research focused on the issue of regularity effects, the first
comparison was between regular and exception words for the unpublished tests. Although
there is a slight discrepancy between word groups for each test, efforts to match the groups
were fairly successful. The only meaningful difference was for written naming,
presumably due to less predictable spelling of some words. This was a significant
discrepancy (t(14) = 2.69, p = 0.02). Since the balance of imageability between the two
groups was based only on the oral naming performance of the validation control group, it
was not surprising that differences were revealed for the written naming test, for which
regularity should, theoretically, play a much greater role. Having said that, the effect of
regularity should only be evident in spelling errors. While there mean of spelling errors
was higher for the exception words (0.93 to 0.53), so too was the mean of semantic errors
(0.67 to 0.20).
The only other significant discrepancy was for the comprehension test (t(14) = 2.26, p =
0.04), though the actual difference was minimal (summed across the 15 participants, there
were 4 errors on regular words and none on exception). Means and standard deviations for
these tests, as well as the discrepancy between means of the regular and exception word
groups, appear in Table 3:1.

3:32
Compre- hension
Oral Naming
Reading Written Naming
Repetition
n 80 80 80 80 80
Mean 79.73 79.00 79.87 77.07 79.20
Standard Deviation 0.46 1.00 0.35 2.63 1.08
Regular - exception -0.27 0.33 0.13 1.07 0.40
Table 3:2. Summary of control group results on unpublished tests.
Descriptive data for each test and for the discrepancies between regular and exception word groups on
each test (mean of total scores for each participant on regular words minus mean for exception words).
Oral naming versus written naming
It was not unexpected that some aphasic participants would have greater difficulty with
written naming than with oral. Therefore, it is important to be able to judge whether this
discrepancy is the result of differing effects of lesions, or the effects of a single lesion
affecting both output modalities, with the written naming score lower simply because this
task is more difficult. Indeed, control data suggest that written naming is significantly more
difficult, with the range of scores much lower (lowest control score 72 for written naming,
77 for oral). Therefore, a small difference between scores might simply relate to the degree
of difficulty on each task, and this needs to be taken into account when comparing
participants’ scores for each task. On the other hand, a significant difference in the
opposite direction is a strong indication that oral naming is defective, and more so than
written naming if both are impaired. Written naming was significantly more difficult than
oral naming for the control group t(14) = 3.08, p < 0.01. Strangely, however, it was not just
spelling errors that distinguished the two naming tasks (a mean of 1.47 compared with 0
phonological errors on oral naming) – the mean number of semantic errors also increased
from oral naming (0.47) to written naming (0.87). Other error types were fairly consistent
between the two tasks. In terms of item consistency across participants, one item on written
naming (scroll) was scored incorrectly by three participants, while 10 other items were
incorrect for two different participants.
Written naming was also significantly more difficult than comprehension (t(14) = 3.73, p <
0.01), reading (t(14) = 2.85, p = 0.01), and repetition (t(14) = 4.05, p < 0.01), though on
each of these tasks the mean number of errors was less than one, as can be seen in Table
3:1.

3:33
Methodological issues
Several methodological issues became apparent when the results of the control group were
analysed:
1. Written naming: One problem with the added difficulty of written naming is a reduction
of sensitivity for the test. Some people are simply ‘bad spellers,’ which lowers the mean
and range of the control scores. Unfortunately, this erodes the test’s ability to detect mild
deficits of written naming amongst aphasic participants who were premorbidly ‘good
spellers.’ If an individual who would have premorbidly scored close to 100% on written
naming then sustains an injury that reduces their performance to the level of unimpaired
‘bad spellers,’ any assertion of a deficit is much less conclusive. This problem can be
addressed to some extent with error patterns: Errors of unimpaired individuals with low
scores should be predominantly spelling mistakes, with ‘appropriate’ misspellings (e.g.
wasp�wosp). A high number of semantic errors (no control made more than 2) or very
unusual spellings (e.g. bee�eeb; kite�kert) might indicate that a lesion is affecting this
process.
2. PPT: Two members of the control group, F6 and M6, emigrated from England about 25
years ago. Despite performing at similar levels to the rest of the control group on most
tests, there was an obvious advantage for F6 and M6 on PPT, achieving 100% accuracy on
all three versions. Only one other control, F5, achieved full scores on all three version –
predictably, F5 was also educated in England. Only one Australian educated control
achieved a perfect score, and only on one version. The difference between controls
educated in England and those educated in Australia was significant (t (13) = 2.47, p =
0.03), Nevertheless, merging the scores of all 15 control participants had only a small
impact on group scores – the mean for the 12 Australian-educated controls across all three
versions was 50.06 (SD = 1.32) compared with 50.44 (SD = 1.42) when the three England-
educated participants are included.
For most of the aphasic participants, the inclusion of the England-educated controls made
little difference. Nevertheless, the apparent cultural bias in PPT suggests that there should
be concern as to the appropriateness of using English norms for a clinical population
educated in Australia. Howard and Patterson (1992) report a mean score of 98-99% (less
than one error) for the 3-picture and 3-word versions, with no participant making more
than three errors. In contrast, three of the twelve unimpaired, Australian-educated

3:34
participants made more than three errors on at least one occasion, and the mean for the 3-
picture version was considerably lower than that given by the authors of the test (95%, or
about 2 errors more on average). This finding should serve as a warning to clinicians who
use the PPT in practice that the results of the PPT, although very useful, need to be
interpreted within the context of this possible cultural bias. On the other hand, lowering the
cut-off score for PPT reduces its sensitivity, so it is important to balance these
considerations. The items that were most unreliable for the Australian educated members
of the control group are listed below. While most items were unreliable on just a few
occasions and for only two to three participants, the most noticeable difficulty was on the
acorn item, for which Australian-educated controls consistently chose the distractor.
Percent accuracy
Item number
Given item Target Distractor
14 40 acorn pig donkey
86 16 windmill tulip daffodil
89 4 thimble needle cotton
92 31 puddle cloud sun
92 32 rocket moon star
94 12 pyramid palm tree pine tree
94 14 ticket bus car
94 26 nun church house
Table 3:3. Most frequently incorrect items on PPT for controls.
Only items that were incorrect for at least two different control participants are included.
3. Object decision: Perhaps the most concerning test result was for the object recognition
task from BORB (Riddoch & Humphreys, 1993). The performance of the control group on
this task varied so greatly that it effectively had very little capacity for detecting
impairments, with the worst-performing control scoring just 20/32 (chance is 16/32). The
mean of 25.93 was also noticeably lower than that of the original normative sample (M =
27.0, SD = 2.2). Fortunately, the lack of sensitivity of this test did not matter for the
aphasic participants, for whom the lowest score was 26/32.
Although an English advantage might again be predicted, given that many of the animals
represented in the test might be unfamiliar to people raised and educated in Australia, this
was certainly not the case – three of the Australian-educated controls outperformed their
England-educated peers. However, the clearest outcome of error analysis was the obvious
response bias towards real objects (M = 95%, SD = 5%; for unreal objects, M = 67%, SD =
13%). This lack of ability for unimpaired controls to reliably identify made-up pictures
suggests possible problems with the materials. Feedback from the controls who found the
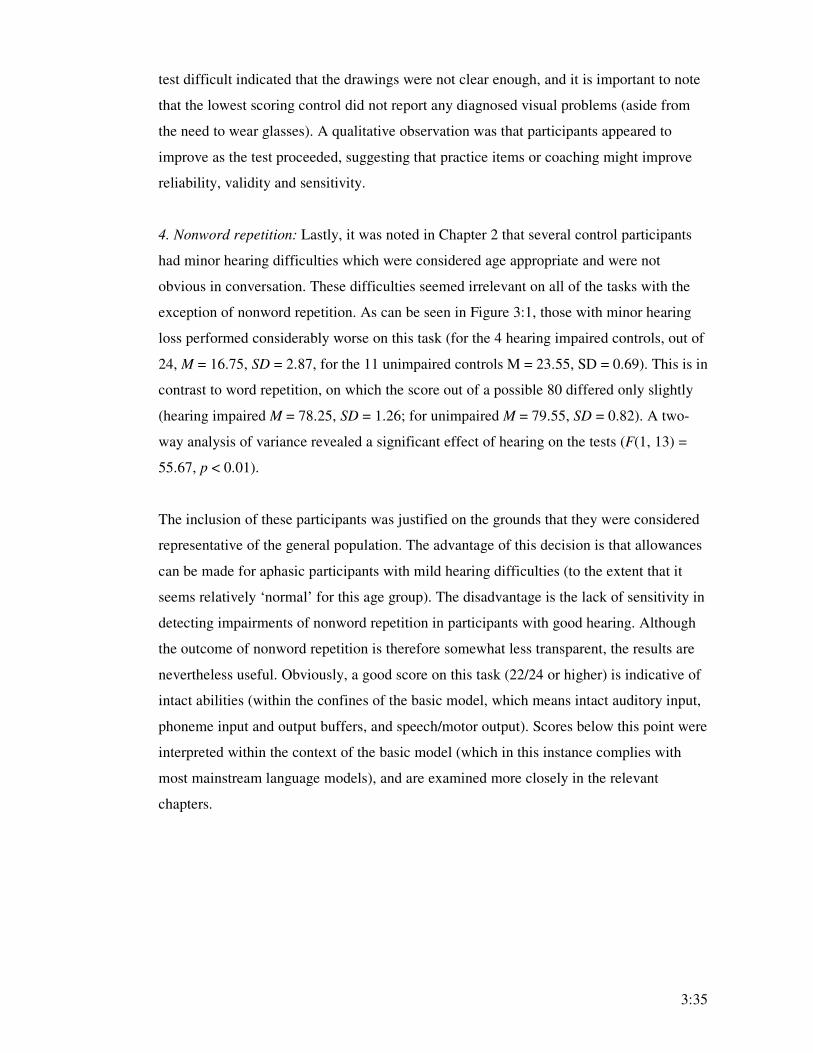
3:35
test difficult indicated that the drawings were not clear enough, and it is important to note
that the lowest scoring control did not report any diagnosed visual problems (aside from
the need to wear glasses). A qualitative observation was that participants appeared to
improve as the test proceeded, suggesting that practice items or coaching might improve
reliability, validity and sensitivity.
4. Nonword repetition: Lastly, it was noted in Chapter 2 that several control participants
had minor hearing difficulties which were considered age appropriate and were not
obvious in conversation. These difficulties seemed irrelevant on all of the tasks with the
exception of nonword repetition. As can be seen in Figure 3:1, those with minor hearing
loss performed considerably worse on this task (for the 4 hearing impaired controls, out of
24, M = 16.75, SD = 2.87, for the 11 unimpaired controls M = 23.55, SD = 0.69). This is in
contrast to word repetition, on which the score out of a possible 80 differed only slightly
(hearing impaired M = 78.25, SD = 1.26; for unimpaired M = 79.55, SD = 0.82). A two-
way analysis of variance revealed a significant effect of hearing on the tests (F(1, 13) =
55.67, p < 0.01).
The inclusion of these participants was justified on the grounds that they were considered
representative of the general population. The advantage of this decision is that allowances
can be made for aphasic participants with mild hearing difficulties (to the extent that it
seems relatively ‘normal’ for this age group). The disadvantage is the lack of sensitivity in
detecting impairments of nonword repetition in participants with good hearing. Although
the outcome of nonword repetition is therefore somewhat less transparent, the results are
nevertheless useful. Obviously, a good score on this task (22/24 or higher) is indicative of
intact abilities (within the confines of the basic model, which means intact auditory input,
phoneme input and output buffers, and speech/motor output). Scores below this point were
interpreted within the context of the basic model (which in this instance complies with
most mainstream language models), and are examined more closely in the relevant
chapters.

3:36
0
20
40
60
80
100
Words Nonwords Words Nonwords
Hearing impaired Normal hearing
Perc
ent corr
ect
Figure 3:1. Control group performance on repetition tasks.
Mean scores in percent for word and nonword repetition for the 4 members of the control group with
minor hearing loss and the 11 without.

4:37
Chapter 4. A simple case to explain?
The first aphasic participant to be presented is MWN, a woman with an apparently isolated
deficit of oral naming. The basic model can account for her straightforward profile, though
closer examination of her data reveals several issues that are not so easily resolved. The
issues raised include the lack of sensitivity of written naming and the tests of the semantic
system, and whether or not the production of semantic errors on oral naming can be
attributed to a post-semantic lesion. The significance of the lexical non-semantic route is
also discussed.
Case description
MWN was a 76-year-old woman with 10 years of formal education and five years part-
time nursing training. She worked as a nurse until she retired at age 65. Medical records
indicate that MWN was admitted to hospital in July 2006 with aphasia and right-sided
weakness. She was diagnosed as having sustained an ischaemic infarct of the left middle
cerebral artery. CT brain scan revealed minor cortical atrophy with no evidence of mass,
haemorrhage, infarction or hydrocephalus. In August 2006 she was admitted to a
rehabilitation facility, where a speech pathology assessment noted word-finding difficulties
with frequent phonemic errors, and moderate-severe verbal dyspraxia characterised by
hesitations, false starts and articulatory errors. However, her auditory comprehension was
good for complex instructions. Relevant medical history includes acute myocardial
infarction 15 years before the injury, mitral valve repair, a transient ischaemic attack, and
hypercholesterolemia.
Results
MWN was assessed approximately eight months after her admission to hospital. Her
spontaneous speech was slow and she initially appeared to lack confidence on testing.
However, she was quick to complete the tests and seemed to grow in confidence as testing
proceeded. MWN’s results are summarised in the following sections. Significance (simple
difference of her performance relative to controls) was calculated using the Bayesian
standardised difference method (Crawford & Garthwaite, 2007). Her responses to
particular tests are listed in Appendix 5:a.

4:38
Input processes
MWN scored higher than the mean score for controls on all tests of input processes,
indicating that her object recognition, letter identification and orthographic lexicon are all
intact.
Object
decision X-case
matching Lexical
decision Homophone
decision
n 32 26 60 60
MWN 26 26 60 57
Control M 25.93 58.33 55.65
2SD below M 20.62 53.57 48.72
Lowest control 20 53 50
Significance ns
\
ns ns
Table 4:1. MWN’s performance on tests of input processes.
Results of object decision, cross-case matching, visual lexical decision, and homophone decision.
Reading and repetition of words and nonwords
MWN made one error in her reading of test items (reading mast as ‘mask’). Although this
was significantly different to controls, it was within the control range and was probably the
result of mild dyspraxia, suggesting that the processes involved in reading of exception
words (most importantly the lexicons) are otherwise intact. Reading of nonwords was also
normal in comparison to controls, indicating that grapheme-phoneme conversion is intact,
and repetition of both words and nonwords was performed better than the mean of the
controls, suggesting that the phonological input and output buffers and sublexical
repetition route are intact.
Reading Repetition
Words Nonwords Words Nonwords
n 80 24 80 24
MWN 79 22 80 22
Control M 79.87 22.94 79.2 21.73
2SD below M 79.16 20.57 77.04 15.42
Lowest control 79 21 77 13
Significance 0.02 0.23 \ \
Table 4:2. MWN’s performance on reading and repetition tests.
The semantic system
MWN performed well on all tests of the semantic system. She achieved 100% on the
comprehension test, and performed well on PPT with scores from 49/52 on the 3-picture
version to 51/52 on the other versions. Therefore, there was no indication of a semantic
deficit.

4:39
Comprehension
Test PPT mean
score
n 80 52
MWN 80 50.33
Control M 79.73 50.44
2SD below M 78.82 47.60
Lowest control 79.00 46.33
Significance ns ns
Table 4:3. MWN’s performance on semantic tests.
Picture naming
Oral picture naming was the only task on which MWN had obvious difficulties. She
performed significantly worse than controls, with 6 of her 16 errors phonological
approximations (addition or substitution of a single phoneme – on 5 occasions involving
the phoneme /r/) and 4 of her errors semantic errors (flask � ‘cigarette lighter’ (which may
have been a visual error); crow � ‘currawong;’ noose � ‘rope;’ skull � ‘skeleton’).
There was a small difference between regular and exception words (31 and 33 correct
respectively), with both impaired relative to controls.
Oral picture naming
Correct Errors
n=80 Delay Phon Morph Sem Circ P/U NR
MWN 64 2 6 1 4 0 0 3
Control M 79.00
2SD below M 77.00 Most control errors
Lowest control 77 1 0 0 2 1 2 0
Significance <0.01
Table 4:4. MWN’s performance on the oral naming test.
Delay = correct after time limit; Phon = phonological error; Morph =morphological error (including
plural errors); Sem = semantic error; Circ = circumlocution; P/U = perceptual or unrelated error; NR
= no response.
MWN’s overall score on written naming was not significantly different to the control
group, and was considerably better than her oral naming score. Although her performance
on the two naming tasks did not differ significantly, (McNemar’s test, p = 0.08), the
difference in total scores, and in the opposite direction to that which would be expected
based on control scores, does suggest that her oral naming is impaired relative to her
written naming. Her 7 written naming errors consisted mostly of semantic errors and no-
response errors (3 of each). Although written naming appeared to be normal, the majority

4:40
of her errors were semantic or no-response errors with only 1 spelling mistake, suggesting
an abnormal error pattern (low scores for controls was mostly due to spelling errors –
MWN made more semantic and no-response errors than any control). There was also
evidence of item consistency between the naming tests, with an overlap (67) closer to the
maximum (71) than to chance (59.8; refer to the calculations section of Chapter 2).
Furthermore, all three of her semantic errors on written naming were amongst the four
generated for oral naming, and two of these errors were the same response. Therefore, the
status of her written naming process is not entirely clear.
Written picture naming totals
Correct Errors
n=80 Delay Spell Sem P/U NR
MWN 73 0 1 3 0 3
Control M 77.07
2SD below M 71.80 Most control errors
Lowest control 72 2 5 2 1 1
Significance ns
Table 4:5. MWN’s performance on the written naming test.
Delay = correct after time limit; Spell = spelling error; Sem =semantic error; P/U = perceptual or
unrelated error; NR = no response.
Discussion
MWN performed within normal limits on all tests except for oral naming. This single
deficit will now be discussed in relation to the basic model, which is recreated in Figure
4:1 below. However, before attempting to identify the cause of her poor oral naming,
possible lesion sites can be eliminated by considering what she does well. Firstly, the
integrity of her object recognition and semantic system is indicated by normal
performances on tests of object recognition, comprehension and written naming. Not only
is oral naming impaired while written naming is intact, but the latter was performed better
that the former – which is the opposite pattern to that of controls. Therefore, her defective
oral naming appears to be the result of damage to post-semantic processing.
Secondly, she performed well on the reading test, with only one minor error, suggesting
that her ability to read exception words is intact. According to the model, this would
indicate that the phonological lexicon, phonological output buffer and the connection
between the two must be intact (the integrity of the phonological output buffer is further
indicated by her good performance on repetition tasks). She also performed better than the

4:41
mean of the control group on the 2-picture/1-spoken word version of PPT, providing
further evidence of an intact phonological lexicon. Therefore, the assumptions of the model
stipulate that the only plausible lesion site is the connection between the semantic system
and the phonological lexicon, as indicated by lesion a, thus disrupting oral naming without
affecting reading of exception words.
Figure 4:1. The basic model, showing MWN’s proposed lesion site.
The lesion is represented by the letter ‘a.’ Green boxes and arrows represent modules and pathways
that are considered intact based on results of tests and assumptions of the model. Functioning of
phoneme-grapheme conversion is unknown.
One important outcome of MWN’s assessment is that her pattern of results cannot be
explained without referring to the lexical-nonsemantic route that is discussed in Chapter 1.
That is, for oral naming to be impaired while reading of exception words is intact, the only
explanation is one that involves a direct route between the orthographic and phonological
lexicons, allowing for exception word reading, with the lesion located at a point in the oral
naming process prior to the phonological lexicon (in this case, input to the phonological
lexicon from the semantic system). This argument holds not only for this basic, 2-lexicon
model, but for all models that propose a shared lexicon for reading and oral naming,
though of course the hypothesis of dissociable lexical stores for reading and for oral
naming (e.g. Orpwood & Warrington, 1995) could also account for the data.

4:42
Alternatively, since MWN generated more semantic errors than the controls on both
naming tasks, the error patterns might represent a very mild deficit of semantic or pre-
semantic processing that was not detected on semantic tests but became evident on the
naming tasks due to the greater sensitivity of expressive over receptive tasks (e.g. Howard,
1985; Laine et al., 1992; Lambon Ralph et al., 2000). Of course a semantic deficit should
lead to noticeably defective written naming relative to controls, yet MWN scored within
the range of the control group. However, this does not necessarily mean than written
naming is intact. It is quite possible that MWN does indeed have difficulty with written
naming but that the test lacks sensitivity due to the poor spelling of some control
participants (see Chapter 3). In this view, her one spelling error might be considered a
perfectly normal occurrence, while most of her remaining seven errors would reflect a mild
lesion. Although not exactly conclusive, this pattern does suggest a possible organic cause
for her low written naming score as well as a possible relationship between the two naming
tasks, which is further evidenced by the similarity in errors. Therefore the possibility of a
semantic impairment underlying her poor naming cannot be disregarded.
While many authors would support the notion that lesion a might be responsible for
MWN’s semantic errors (e.g. Beaton, Guest, & Ved, 1997; Laine & Martin, 1996; Lambon
Ralph et al., 2000), can it also explain the phonological approximations she produced?
There are two ways that these errors might be accounted for. First, they could be the result
of mild dyspraxia (i.e. a lesion after the phonological output buffer) that, for some reason,
does not have a noticeable effect on other verbal tasks. For example, repetition and reading
might produce stronger activation of the target phonemes in the phonological output buffer
due to multiple sources of input, reducing interference. This account would therefore imply
that the phonological approximations are independent of lesion a shown in Figure 4:1, or
that her remaining errors on oral naming and most of her errors on written naming are
caused by a single, mild semantic deficit, with phonological errors on oral naming caused
by this additional lesion. The second explanation is that on some occasions lesion a allows
the target phonological representations to be activated above threshold, but with
competition from phonologically similar representations, leading eventually to interference
in the phonological output buffer (which would perhaps be experienced by MWN as a
degree of uncertainty about the word); on tasks of reading and repetition, multiple sources
of input constrain responses in the phonological output buffer, reducing the likelihood of
errors.

4:43
In summary, although MWN’s data represent what is superficially a straightforward profile
of lexical abilities, her single obvious impairment raises several theoretical questions that
are not easily answered. Nevertheless, the basic model is able to account for MWN’s
performance without the need for any adjustments. Evidence was also found for the
existence of the lexical non-semantic route and for the possibility that semantic errors in
oral naming can result from post-semantic lesions.

5:44

5:45
Chapter 5. Three cases of phonological dyslexia
Phonological dyslexia is a pattern of results in which the individual’s ability to read
nonwords is impaired relative to his or her ability to read real words, without the semantic
errors on word reading that are observed in deep dyslexia. This chapter is devoted to three
participants who presented with phonological dyslexia. The description of phonological
dyslexia is not of great importance, given the wide range of potential causes of this
‘symptom-complex.’ However, it does serve as a reference point, and although each case is
quite unique, there are certain similarities that allow a unified discussion. Each case is
presented and interpreted individually, with a collective discussion at the end of the
chapter.
Case 1 – RPD
RPD was a 65-year-old man with 10 years of formal education. He managed a transport
company before retiring at the age of 54. In June 2004, RPD sustained an infarct of the left
middle cerebral artery. Previous medical history includes a right-sided meningioma which
required debulking surgery 17 years before current testing, a coronary artery bypass graft
11 years earlier, high cholesterol, and retinal detachment (his mild visual impairment is
corrected by reading and distance glasses).
A speech pathology report from approximately six weeks after his stroke indicates that he
demonstrated a moderate impairment of comprehension, including moderate difficulties
with auditory comprehension and following sequential commands, and inconsistent
performance on reading comprehension tasks involving increased length and complexity of
passages, despite reasonable comprehension of single words and sentences. Nevertheless,
comprehension was considered a strength in comparison to his expressive language –
verbal output was characterised by dyspraxia and phonemic errors, while written language
conveyed little or no meaning, and was characterised by letter substitutions and jargon
words.
Results for RPD
RPD was assessed 2 years, 5 months post-injury. His spontaneous speech at the time of the
assessment was non-fluent; nevertheless he tried extremely hard to express himself, and
although he produced frequent semantic and phonological errors, he was able to maintain a
conversation, albeit somewhat stilted. Although he was generally quite slow to respond to

5:46
test items, he applied himself well on testing, and seemed to be aware of his errors in most
cases. RPD’s results are outlined in the following sections. Significance (simple difference
of RPD’s performance relative to controls) was calculated using the Bayesian standardised
difference method (Crawford & Garthwaite, 2007). His responses to particular tests are
listed in Appendix 5:b.
Input processes
RPD’s object recognition ability seemed to be intact based on his excellent performance on
BORB object decision. He also completed the cross-case matching task without making
any errors indicating that letter identification is intact. However, he performed significantly
worse than controls on lexical decision (though just outside the normal range), suggesting
either a breakdown in processing within the orthographic lexicon or reduced activation of
the lexicon. All of the errors were due to RPD identifying nonwords as real words (5
pseudohomophones and 3 non-homophonic nonwords) suggesting that his likely
impairment of orthographic lexical processing is accompanied by either response bias or
additional difficulties involving grapheme-phoneme conversion. He also had difficulties on
the homophone decision task, supporting the notion that the orthographic lexicon is either
failing to receive or adequately process information.
Object
decision X-case
matching Lexical
decision Homophone
decision
n 32 26 60 60
RPD 29 26 52 41
Control M 25.93 58.33 55.65
2SD below M 20.62 53.57 48.72
Lowest control 20 53 50
Significance ns
\
0.01 <0.01
Table 5:1. RPD’s performance on tests of input processes.
Results of object decision, cross-case matching, visual lexical decision, and homophone decision.
Reading and repetition of words and nonwords
RPD made 2 phonological errors on the reading test (1 each for regular and exception
words), which was significantly worse than controls, and again just outside the normal
range. This result was not unexpected given RPD’s difficulties with visual lexical decision,
and suggests a common, mild impairment affecting the two tasks. Reading of nonwords
was much more impaired, with less than a third of the items read correctly. Since letter
identification appears to be intact, this would indicate that the processes involved in
grapheme-phoneme conversion are dysfunctional. Of his 17 errors, 12 were lexicalisations

5:47
suggesting a tendency to read nonwords via the lexical reading routes (despite a possible
impairment of the orthographic lexicon suggested by difficulties with lexical decision).
Repetition of both words and nonwords was within normal limits, indicating that the
phonological input and output buffers, and their direct connection, are intact. Although it
will be argued in later sections that a nonword repetition score this low might reflect a
deficit, there is no reason to believe this is the case for RPD, particularly given his age.
Even if nonword repetition was impaired, this would merely suggest damage to the
sublexical repetition route and have no impact on other aspects of lexical processing.
Reading Repetition
Words Nonwords Words Nonwords
n 80 24 80 24
RPD 78 7 79 17
Control M 79.87 22.94 79.2 21.73
2SD below M 79.16 20.57 77.04 15.42
Lowest control 79 21 77 13
Significance <0.01 <0.01 ns ns
Table 5:2. RPD’s performance on reading and repetition tests.
The semantic system
RPD made 3 errors on the comprehension test, all of which were because he chose the
semantic distractor (crab � lobster; clown � juggler; fork � knife). Although he
performed significantly worse than controls on the 2-picture/1-spoken word version of
PPT, he was within the range of the control group, and his scores on the other two
versions, and mean score for all three versions, were all normal. Therefore, results of
semantic tests were mixed, but might indicate a mild deficit that is perhaps only evident
under certain test conditions.
PPT
Comprehension Test Mean 3P 2P1W 2P1S
n 80 52 52 52 52
RPD 77 48.00 48 49 47
Control M 79.73 50.44 50.07 50.73 50.53
2SD below M 78.82 47.60 46.18 48.06 47.93
Lowest control 79.00 46.33 45 47 47
Significance <0.01 ns ns ns <0.01
Table 5:3. RPD’s performance on semantic tests.
Mean = mean of all 3 versions; 3P = 3-picture version; 2P1W = 2-picture/1-written word version; 2P1S
= 2-picture/1-spoken word version.

5:48
Picture naming
RPD performed significantly worse than controls on oral naming. He made a total of 17
errors of which 12 (71%) were semantic errors. Regular and exception words were close to
even (30 and 29 correct respectively).
Oral picture naming
Correct Errors
n=80 Delay Morph Sem Circ P/U
RPD 59 2 6 13 0 0
Control M 79.00
2SD below M 77.00 Most control errors
Lowest control 77 1 0 2 1 2
Significance <0.01
Table 5:4. RPD’s performance on the oral naming test.
Delay = correct after time limit; Morph = morphological error (including plural errors); Sem =
semantic error; Circ = circumlocution; P/U = perceptual or unrelated error.
RPD’s written picture naming was slightly (but not significantly) better than oral naming
(McNemar’s Test, p = 0.59) with 4 fewer errors. Again, most errors were semantic (54%)
but to a lesser degree. Regular and exception words were very similar (6 and 7 errors
respectively).
Written picture naming
Correct Errors
n=80 Delay Spell Sem P/U NR
RPD 67 0 2 7 0 4
Control M 77.07
2SD below M 71.80 Most control errors
Lowest control 72.00 2 5 2 1 1
Significance <0.01
Table 5:5. RPD’s performance on the written naming test.
Delay = correct after time limit; Spell = spelling error; Sem = semantic error; P/U = perceptual or
unrelated error; NR = no response.
In terms of consistency, the total overlap between the two versions (64) was closer to
chance (55.5) than to the maximum (76; refer to the calculations section of Chapter 3). Of
the 13 errors made on written naming, only 5 had also been produced on oral naming (from
a total of 17). Of these, 1 item was the same response (skull�skeleton) and a further 2
were the same type of error (semantic error) but different responses
(bee�wasp/‘mosquito’; chalk�blackboard/ ‘crayon’). Of the three errors produced on the

5:49
comprehension task, 2 appeared again on oral naming, while none were repeated on
written naming. Although there is a degree of similarity, a relationship between the naming
tasks seems unlikely. Instead, the low-moderate overlap is probably best explained as
being due to the common pressures of imageability, linguistic complexity and so forth.
Discussion – RPD
RPD had difficulties on several tests, revealing likely impairments of reading (of both
words and nonwords), visual lexical decision and picture naming in both modalities, with
mixed results on tests of the semantic system. He produced a high number of semantic
errors on both oral and written picture naming, though a comparison between errors on
each version suggests limited consistency between the two. These impairments and errors
patterns will now be discussed in relation to the basic model, which is recreated in Figure
5:1 below.
Figure 5:1. The basic model as it applies to RPD.
Proposed lesions are labeled and indicated by red boxes and arrows. Green boxes and arrows
represent modules and pathways that are considered intact based on results of tests and assumptions
of the model. Black boxes and arrows represent features for which functioning is unclear.
In terms of intact functioning, RPD’s normal performance on tests of word and nonword
repetition suggests that the phonological input and output buffers are all intact. He
produced an error-free performance on cross-case matching, indicating that his letter

5:50
identification process is intact. He also performed well on the test of object recognition,
indicating that this function is intact.
At least one of the difficulties that RPD had on testing was also quite easy to reconcile
with the basic model. His performance on nonword reading was extremely poor. Since
letter identification and the phonological output buffer are both intact, the likely
explanation is a lesion at some point during the grapheme-phoneme conversion process, as
indicated by lesion a. The high number of lexicalisations suggests that RPD has a tendency
to rely on lexical processes when he reads nonwords.
The integrity of RPD’s semantic system is not at all clear. On the one hand, his
performance on PPT suggests that his semantic system is intact. However, his score on the
comprehension test is, by itself, indicative of mildly impaired processing. One explanation,
given his difficulties with visual lexical decision, is that he has trouble processing the
words in the comprehension test. However, this would lead to a prediction of poor
performance on the 2-picture/1-written word version of PPT relative to the other versions.
On the contrary, this was RPD’s best PPT result.
Another explanation for the contrast between the comprehension test and PPT is the test
conditions: PPT is untimed and has only two possible choices for each item, while the
comprehension test is time-limited and has four choices for each item. The hypothesised
explanation for RPD’s results is that the semantic representations themselves are
reasonably intact (explaining PPT) but access to them (or perhaps between them) is
inefficient and slow, a deficiency that is revealed when he is put under the pressure of
timed tests. Alternatively, this might be labelled by Crutch and Warrington (e.g. 2001;
2003; 2005) as a disorder of refractory access. In their view, it is not the time allowed for
each item that is the problem, but the time between items. Each time a semantic
representation is activated, activity within the semantic system becomes restricted, either
by inhibitory processes or impaired activation.
Unfortunately, the time between items was not considered to be a relevant variable during
preparation of the materials so was not controlled for. Therefore, there is no way to
determine exactly how timing conditions might have impacted on RPD’s results. However,
it certainly seems plausible to ascribe his low score on the comprehension test to the

5:51
influence of the time limitation. Lesion b represents this mild impairment of semantic
processing.
If it is the time restriction that causes a problem for RPD, then other timed tasks that
involve semantic processing should also be negatively impacted by time constraints.
Indeed, both naming tests, which are the only other tasks that depend on the semantic
system, are certainly impaired. Although this might lead to a prediction of item consistency
between the tasks, this assumption would only apply if the representations are damaged,
which does not seem to the case.
Another issue raised by RPD’s results concerns orthographic processing. Judging from his
poor results on the lexical decision task and supported by his difficulties with the
homophone decision and reading tests, it seems likely that orthographic processing (or its
input) is mildly impaired. Although the comprehension test result is compatible with this
claim, RPD’s best PPT result was on the 2-picture/1-written word version. Although there
is not a convincing explanation for this apparent contradiction, it should be noted that tasks
involving the orthographic lexicon were all performed very close to control levels, so any
deficit would have to be extremely mild – and perhaps simply overcome by RPD’s good
reasoning, and the small degree of variation across PPT results. Therefore, a mild lesion of
the orthographic lexicon (lesion c) is suggested to explain these results, though the
integrity of the lexicon is not certain. Although these results alone could also be explained
by reduced access to the lexicon (from letter identification), a lesion of the lexicon itself is
also able to explain his poor written naming, while a lesion of the input pathway cannot.
Therefore, written naming is hypothesised to be reduced due to a combination of two mild
impairments – inefficient semantic processing which affects performance on timed tests,
and mild damage to the orthographic lexicon.
The only remaining impairment to explain is RPD’s poor oral naming. Although his
impaired semantic processing would have had an impact, the severity of his oral naming
deficit suggests an additional, post-semantic lesion. Since the phonological output buffer
appears to be intact, then the breakdown must be either in the phonological lexicon, output
from the lexicon to the phonological output buffer, or input to the lexicon from semantics,
with the latter the most likely site for a lesion (lesion d in the model). The most convincing
evidence for this conclusion is that reading of exception words was very close to normal
despite his mild impairment of orthographic lexical processing. Presumably, an additional

5:52
lesion of the phonological lexicon or its output would leave reading much more obviously
impaired. The locus of lesion d, on the other hand, allows for his almost perfect reading of
exception words to be achieved by the lexical non-semantic route. Also, the observation
that he produced more semantic errors on oral naming than on written suggests that not all
of his semantic errors on oral naming were caused by a semantic impairment. Therefore,
this discrepancy in error type also provides moderate support for the assertion that
semantic errors can occur secondary to post-semantic lesions, though with the obvious
caution that a semantic deficit might be expressed differently by each naming task.
Although the results of testing with RPD are not the easiest to reconcile, adding features
that are common to other models does not make his profile any easier to explain. That is,
none of the major models could better account for the discrepancy between the
comprehension test and PPT, or explain why reading and the 2-picture/1-written word
version of PPT was performed so well despite difficulties with lexical decision. Therefore,
although further explanation was required on certain issues, the basic model was as capable
of accounting for these as any other model. Furthermore, additional, tentative evidence was
found for the lexical non-semantic route, as well as for the hypothesis that semantic errors
can result from post-semantic lesions. Finally, a new principle was hypothesised: That
time-limited comprehension tasks can be more sensitive to semantic deficits than
intuitively more difficult but untimed taks.
The next section discusses DHT, whose performance resembled RPD’s is at least one
important way: He too performed considerably worse on the comprehension test than
would be predicted from his PPT scores.

5:53
Case 2 – DHT
DHT was a 62-year-old retired man with nine years of formal education, who had worked
as a typesetter. In June 2004, DHT sustained an embolic infarct of the left middle cerebral
artery secondary to infective endocarditis. According to medical records, he presented with
right-sided hemiplegia and a ‘significant communication impairment.’ DHT was attending
group and individual speech therapy sessions and meetings at the local spasticity centre,
and receiving regular botulinum toxin injections in his right arm. He wore bifocal glasses
but was otherwise not visually impaired. As recently as 3 months before current testing,
DHT was reported by Speech Pathologists as demonstrating severe non-fluent agrammatic
aphasia. He was previously a keen reader, though he reported finding it difficult now to
maintain attention for long enough to read books, despite having reasonable
comprehension when reading in short bursts. However, he continues to enjoy using his
computer and the internet.
Results for DHT
DHT was assessed approximately 2 years and 11 months after his cerebral infarct.
Although his comprehension for conversation seemed intact, his ability to express himself
was severely impaired, often relying on his wife to communicate his ideas. DHT’s results
are outlined in the following sections. Significance (simple difference of his performance
relative to controls) was calculated using the Bayesian standardised difference method
(Crawford & Garthwaite, 2007). His responses to particular tests are listed in Appendix
5:c.
Input processes
DHT scored better than the mean of the control group on all tests of input processes apart
from homophone decision, indicating that object recognition, letter identification and the
orthographic lexicon are all intact. It is not clear why he had difficulty with homophone
decision, though it may have reflected a problem with his ability to compare and judge
how two words should sound, a skill that is subserved primarily by the phonological output
buffer.

5:54
Object
decision X-case
matching Lexical
decision Homophone
decision
n 32 26 60 60
DHT 27 26 59 44
Control M 25.93 58.33 55.65
2SD below M 20.62 53.57 48.72
Lowest control 20 53 50
Significance ns
\
ns <0.01
Table 5:6. DHT’s performance on tests of input processes.
Results of object decision, cross-case matching, visual lexical decision, and homophone decision.
Reading and repetition of words and nonwords
DHT performed significantly worse than controls on all reading and repetition tasks.
Reading and repetition of real words was impaired. Reading errors were either
phonological in nature (13/19 errors) or failures to respond (7/19 errors). A few of the
‘phonological’ errors were possibly visual errors (e.g. drum � grum) but most either
differed quite significantly from the target response (e.g. chalk � core; blinds � blounds)
and were often accompanied by an indication that he knew he was incorrect (e.g. bib �
“big, no…”). There was no regularity effect (10 errors for each word type) and no
regularisations. Repetition errors were mostly phonological in nature (10/12 errors), with
most involving substitution of 1 to 2 phonemes. There was a reasonably high rate of item
consistency between the two tasks, with a total overlap of 66, which was midway between
chance (54.3) and the maximum (76). Of the 9 overlapping errors, 7 were the same type of
error (phonological), suggesting a possible common source of impairment for reading and
repetition.
Reading Repetition
Words Nonwords Words Nonwords
n 80 24 80 24
DHT 60 0 66 15
Control M 79.87 22.94 79.2 21.73
2SD below M 79.16 20.57 77.04 15.42
Lowest control 79 21 77 13
Significance <0.01 <0.01 <0.01 0.03
Table 5:7. DHT’s performance on reading and repetition tests.
DHT found reading of nonwords so difficult that he was unable to correctly read any of the
24 stimuli. He managed just 31% overlap (i.e. phonemes correct) between the target
stimuli and his responses, which came almost entirely from the 10 lexicalisations he
produced – of his remaining 12 responses, 10 did not even share a single phoneme with the

5:55
target. This indicates that his grapheme-phoneme conversion process is severely impaired,
to the extent that it is practically non-functional.
Finally, his nonword repetition was significantly worse than controls. Since he was within
the range of the control group it could be argued that his low score reflects poor hearing
comparable to the controls with mild hearing difficulties. However, if this were the case
and his low nonword repetition score was entirely due to poor hearing, his repetition score
for real words should have been much higher than it was – even controls who struggled
with nonword repetition due to mild hearing deficits were able to repeat real words
reasonably well (at least 77/80). Therefore, DHT’s low scores on both word and nonword
repetition suggest a lesion that has impacted on both abilities at a point after auditory input.
If his hearing is intact, then comparing his nonword repetition score with the remaining 11
control participants (range 22-24, mean = 23.55, standard deviation = 0.69) leads to the
conclusion that his nonword repetition ability is significantly worse than controls (p<0.01)
and well outside the control range.
The semantic system
PPT
Comprehension Test Mean 3P 2P1W 2P1S
n 80 52 52 52 52
DHT 77 51.00 52 51 50
Control M 79.73 50.44 50.07 50.73 50.53
2SD below M 78.82 47.60 46.18 48.06 47.93
Lowest control 79.00 46.33 45 47 47
Significance <0.01 ns ns ns ns
Table 5:8. DHT’s performance on semantic tests.
Mean = mean of all 3 versions; 3P = 3-picture version; 2P1W = 2-picture/1-written word version; 2P1S
= 2-picture/1-spoken word version.
Tests of the semantic system were performed with mixed results, akin to RPD. He
performed better than the mean of the control group on PPT (with individual scores of 50-
52, also providing further evidence that object recognition, the orthographic lexicon, and
the phonological lexicon are all intact). However, his 3 errors on the comprehension test
resulted in a score significantly worse than that of the controls. All 3 of his errors were
because he chose the semantic distractor and all were regular words (i.e. the deficit cannot
be attributed to a problem with reading of exception words). The contrast between the
comprehension test and PPT is similar to RPD’s performance on these tests, and again it is

5:56
argued that the participant’s semantic system contains intact semantic representations but
that inefficient semantic processing becomes evident on timed tasks.
Picture naming
DHT’s oral picture naming was significantly worse than controls, naming barely more than
half of the pictures correct. Errors were mostly no-response, phonological errors (in most
cases due to substitution of a single phoneme), and semantic errors, listed below. Of his 4
morphological errors, one was an irregular pluralisation (tooth � ‘teeth’) and the
remainder were addition or deletion of the plural -s. There was a relatively large difference
between regular (24 correct) and exception words (19 correct) on oral naming, though this
discrepancy was not significant (Fisher’s exact, p = 0.19) and due mostly to semantic
errors (4 more on exception words).
Oral picture naming
Correct Errors
n=80 Delay Phon Morph Sem Circ P/U NR
DHT 43 3 10 4 8 0 0 12
Control M 79.00
2SD below M 77.00 Most control errors
Lowest control 77 1 0 0 2 1 2 0
Significance <0.01
Table 5:9. DHT’s performance on the oral naming test.
Delay = correct after time limit; Phon = phonological error; Morph = morphological error (including
plural errors); Sem = semantic error; Circ = circumlocution; P/U = perceptual or unrelated error; NR
= no response.
DHT’s semantic errors on oral naming were:
• crow � ‘bird’ (when asked what type his response was ‘evil’)
• cork � ‘bottle opener’
• flask � ‘whiskey’
• book � ‘bible’
• pear � ‘apple’
• wasp � ‘bee’
• ice � ‘water’
• vase � ‘bowl’

5:57
These errors suggest that some features of the target semantic representations were
activated, but competing nodes with overlapping semantic features were selected in their
stead.
Written naming was intact and significantly better than oral naming (McNemar’s test, p <
0.01), the opposite direction to the controls. His extremely poor oral naming and intact
written naming is strongly indicative of a post-semantic impairment affecting phonological
output processes. If the semantic system is impaired, it appears to have only a minimal
effect on picture naming. Of his five errors on written naming, 2 were semantic in nature (1
of which was book � ‘bible,’ overlapping with oral naming) and the remaining 3 were no-
response errors; the high number of no-response errors and complete absence of spelling
errors makes the pattern somewhat unusual in comparison to the control group, whose
worst performing member made a single no-response error. However, his low number of
total errors makes a deficit seem unlikely.
Written picture naming
Correct Errors
n=80 Delay Spell Sem P/U NR
DHT 75 0 0 2 0 3
Control M 77.07
2SD below M 71.80 Most control errors
Lowest control 72.00 2 5 2 1 1
Significance ns
Table 5:10. DHT’s performance on the written naming test.
Delay = correct after time limit; Spell = spelling error; Sem = semantic error; P/U = perceptual or
unrelated error; NR = no response.
Item consistency and comparisons
DHT was moderately consistent on tasks of verbal output, with overlaps on all
comparisons midway between chance and maximum. Since the only locus of a common
lesion would be the phonological output buffer, consistency should not be expected to be
any higher as the word form has already been selected by this stage; the consistency seen is
more likely to represent the influence of factors common to all verbal tasks, such as spoken
word frequency and phonemic complexity.

5:58
Chance overlap
Actual overlap
Max overlap
Oral naming vs reading
41.65 50 61
Oral naming vs repetition
41.95 51 57
Repetition vs reading
54.3 66 76
Table 5:11. Item consistency between tests of verbal output for DHT.
In addition to written naming being preserved relative to oral naming, it was also
significantly better than both reading (McNemar’s test, p < 0.01) and repetition
(McNemar’s test, p < 0.05), his other impaired processes.
Discussion – DHT
DHT performed poorly on several tests, especially those involving spoken output.
Although the source of his difficulties is not clear, many aspects of his performance are
indicative of intact processes within the language network. He performed well on all three
versions of PPT, indicating the integrity of: The phonological input buffer and
phonological lexicon (and the connection between the two); letter identification and the
orthographic lexicon (supported by written naming and lexical decision – his poor
homophone decision is likely influenced by other factors, which will be considered
shortly); and object recognition (supported by the object decision test and written naming).
As with RPD, his semantic processing is considered to be reasonably intact when given
sufficient time, but perhaps unable to cope with the time constraints of the comprehension
test. Finally, since written naming is intact, all orthographic output processes appear to be
intact. His intact performance on written naming does not necessarily contradict the
assertion of a very mild semantic deficit. Again, this could be a case of a ‘good speller’
with a mild impairment being compared to controls that include some ‘bad spellers’
without acquired deficits, as with MWN. His complete lack of spelling errors and
relatively high number of no-response errors seems to support this conclusion. Another
possibility is that the five seconds allowed for each item on written naming is less
restrictive than the ten seconds for items on the comprehension test, which are visually
much more complex. Alternatively, Crutch and Warrington (e.g. 2005) might argue that his
intact written naming reflects more time between the items than for the comprehension and
oral naming tests, since sufficient time for completing responses was always permitted on
written naming but was generally not an issue for other tests. Since this factor was not
controlled for, there is no way to be sure.

5:59
DHT’s most notable difficulties on testing were for oral naming, reading and repetition (of
words and nonwords), and homophone decision. In other words, based on the current
testing, DHT appears to be impaired on all tasks involving phonological output, while
orthographic input and output and phonological input are all intact. DHT’s profile, as it
relates to the basic model, is depicted in Figure 5:2, with his semantic impairment
represented by lesion a.
Figure 5:2. The basic model as it applies to DHT.
Proposed lesion sites are marked in red and labeled. Green boxes and arrows represent modules and
pathways that are considered intact based on results of tests and assumptions of the model. Black
boxes and arrows represent features for which functioning is unclear.
Only one lesion (lesion b) is needed to explain DHT’s difficulties on all verbal tasks,
though additional lesions are likely to be involved. This single lesion is able to capture
DHT’s language deficits by asserting that all tasks that require processing at the level of
the phonological output buffer will be impaired to some extent. Having said that, his ability
to convert letters into sounds appears to be so completely inaccessible that an additional
lesion affecting grapheme-phoneme conversion is highly likely, thus lesion c. Also, lesion
b is unable to account for his eight semantic errors on oral naming, since by this stage the
phonological representation has already been selected. Therefore, only phonological
approximations, delayed responses and no-responses should be evident (the latter two

5:60
when internal monitoring successfully blocks illegitimate responses). There are three
plausible explanations for his semantic errors. First, they could be the result of his mild
semantic impairment. However, a similar number of semantic errors would then be
expected on written naming, which was not the case. Second, they could be due to an
additional, relatively minor lesion between semantics and the phonological lexicon, as per
MWN and as indicated by lesion d in Figure 5:2. This explanation is further justified since
DHT generated more than twice the number of errors on oral naming than on reading or
repetition, and produced no semantic errors for the latter two tests. The discrepancy in
semantic errors between the two versions of naming provides some support for the concept
that semantic errors can result from post-semantic lesions, as previously argued by many
other authors (e.g. Beaton et al., 1997; Laine & Martin, 1996; Lambon Ralph, 1998;
Lambon Ralph et al., 2000).
Although this is the simplest explanation, a third possibility is worth mentioning: Active
production of semantically related words as a coping strategy. The proposition is that
semantic errors arise, on some occasions and for particular individuals, when the individual
has rejected responses that are phonologically inaccurate; the high number of no-response
errors suggests that he is indeed able to reject many of his incorrect responses. The
semantic errors, therefore, could be a conscious attempt to produce a response that conveys
a certain level of semantic information about the target, when he has recognised that the
response he was trying to generate is clearly wrong.
If this is a coping strategy, how effective would it be at conveying the desired information?
One significant point is that phonological approximations, even when they differ by only a
single phoneme, generally convey no relevant information at all, or are simply confusing
(e.g. ‘grum,’ ‘bled’) unless they are in context (which in itself is difficult for a severely
agrammatic aphasic, such as DHT). On the other hand, semantically related substitutes will
at least convey some aspects of what the participant is trying to generate (e.g. book �
‘bible;’ wasp � ‘bee;’ pear � ‘apple’ are all examples of DHT’s semantic errors) and
could often be sufficient, as in these examples, to relate their message to the listener. One
problem with this hypothesis is that semantic errors should also be evident on reading and
repetition of real words. However, both of these tasks were performed much more
accurately, and both involve multiple sources of information helping to constrain responses
generated by the phonological output buffer, which may act to reduce the need for
semantically related responses.

5:61
In sum, DHT demonstrates mildly inefficient semantic processing with damage to his
phonological output buffer, affecting all verbal tasks, with additional lesions affecting
particular verbal tasks more than others. Also, the high number of semantic errors on oral
naming relative to his intact written naming provides support for the argument that
semantic errors can result from post-semantic lesions, though his mild semantic deficit
makes this conclusion less certain.
One notable feature of DHT’s results is the remarkable preservation of written naming in
contrast to severely impaired oral naming (32 more errors), reading (15 more errors) and
word repetition (9 more errors), along with completely non-functional nonword reading
and possible semantic impairment.
DHT is also one of the rare cases of phonological dyslexia for which nonword reading is
almost completely impossible (at least one case, WB (Funnell, 1983), has been described
previously). This finding counters the assertion that the abolition of grapheme-phoneme
conversion in conjunction with damage to or reduced activation of the phonological
lexicon should lead to semantic errors on word reading, as occurs in deep dyslexia (e.g.
Newcombe & Marshall, 1980). On the other hand, advocates of the summation hypothesis
would perhaps argue that DHT’s semantic impairment is considerably less severe than
what would be seen in deep dyslexia, particularly given his excellent scores on PPT, and
indeed, DHT’s results are much less conclusive than they would be if he had a more
profound semantic impairment. Nevertheless, his results do seem to favour a model that
includes the lexical non-semantic route.
The next section describes DPC, a third case of phonological dyslexia with similarities to
both RPD and DHT.

5:62
Case 3 – DPC
DPC was a 51-year-old woman with 11 years of formal education who had worked mostly
as a claims inspector for an insurance company. She was admitted to hospital in March
2002 following sudden onset of confusion, speech difficulties and rapid atrial fibrillation.
A brain CT scan revealed a haemorrhagic infarct of the left middle cerebral artery.
Relevant medical history included type II non-insulin dependent diabetes, anxiety disorder,
migraines and non-Hodgkins lymphoma.
A speech pathology report approximately three months after her stroke indicated non-
functional expressive communication, with some use of gestures. She was also noted to
have severe, global semantic deficits. A further investigation nine months later indicated
dramatic improvements in this area: She was noted to have mild-moderate difficulties with
auditory comprehension, with 100% accuracy in responding to yes/no questions and mild
difficulties with following sequential commands of more than two instructions. Reading
comprehension was comparable to auditory comprehension. Expressive communication
was more severely impaired, however: She demonstrated moderate to severe difficulties
with verbal expression, including spontaneous speech that was hesitant, non-fluent and
limited to single words and basic phrases. Confrontation naming was extremely poor, even
with cues, and repetition was poor for anything but single, high frequency words. Reading
aloud and written expression were both similar in nature to spontaneous verbal output. A
neuropsychological report two months later, which focused on her capacity to return to
driving, concluded that DPC demonstrated “inefficient visual scanning, reduced spatial
attention span, reduced attention to visual detail, weak complex attention skills, and
questionable visual acuity,” as well as left-right disorientation and difficulty following
sequential commands with three stages or more.
Results for DPC
DPC was assessed 4 years and 8 months after her admission to hospital. Her spontaneous
speech was comparable to the description by speech pathologists a year after her stroke.
She was extremely slow and unsure on most tests, even those for which she achieved high
scores. DPC’s results are outlined in the following sections. Significance (simple
difference of DPC’s performance relative to controls) was calculated using the Bayesian
standardised difference method (Crawford & Garthwaite, 2007). Her responses to
particular tests are listed in Appendix 5:d.

5:63
Input processes
DPC performed better than the mean of the control group on the object decision task and
achieved 100% on cross case matching, indicating that her object recognition and letter
identification processes are intact. Her score on lexical decision was normal in comparison
to controls, suggesting that her orthographic lexicon is also intact. However, the
homophone decision task proved extremely difficult, with DPC achieving less than chance.
She performed significantly worse than controls and at chance levels on all three types of
word pairs (regular words = 12/20; exception words = 7/20; nonwords = 9/20; p<0.01 for
each) suggesting a major disruption in the processes involved in judging the sounds of both
real words and nonwords.
Object
decision X-case
matching Lexical
decision Homophone
decision
n 32 26 60 60
DPC 26 26 55 28
Control M 25.93 58.33 55.65
2SD below M 20.62 53.57 48.72
Lowest control 20 53 50
Significance ns
\
ns <0.01
Table 5:12. DPC’s performance on tests of input processes.
Results of object decision, cross-case matching, visual lexical decision, and homophone decision.
Reading and repetition of words and nonwords
DPC had difficulties with both reading tasks. She made 3 phonological errors on word
reading, 2 of which were real words differing by a single phoneme (e.g. mast � ‘mask’) or
letter (e.g. noose � ‘nose’). Two of her errors were for regular words, three for exception
words (with no regularisations). The third was a neologism that shared only the initial and
final phonemes. Her remaining 2 errors were failures to respond. For nonwords, reading
was extremely disordered with 9 of her 19 errors lexicalisations, suggesting severe
disruption to grapheme-phoneme conversion, with many of the nonwords being produced
via the lexical reading routes. However, she managed to produce at least one correct
phoneme for all but one item, with an overlap of 59%. In addition to producing 5 words
correctly, this observation suggests that she has retained a limited (though inconsistent)
capacity to convert letters into sounds.

5:64
Reading Repetition
Words Nonwords Words Nonwords
n 80 24 80 24
DPC 75 5 66 14
Control M 79.87 22.94 79.2 21.73
2SD below M 79.16 20.57 77.04 15.42
Lowest control 79 21 77 13
Significance <0.01 <0.01 <0.01 0.02
Table 5:13. DPC’s performance on reading and repetition tests.
Word repetition was also impaired, with 11 phonological errors (mostly substitution of a
single phoneme), an inflectional error, and 2 failures to respond. However, her score on
nonword repetition was within the range of controls, similar to DHT. Again, it is argued
that DPC is probably impaired on both repetition tasks. Although the state of her hearing is
unknown, her young age makes it much less likely that she has impaired hearing, excepting
a neurological cause. More importantly, the sublexical repetition route, if intact, should
enable word repetition. Therefore, DPC’s difficulties with repeating both words and
nonwords most likely indicates intact hearing, with a single lesion that is responsible for
both deficits. Comparing her nonword repetition score with the 11 controls with intact
hearing (range 22-24, mean = 23.55, standard deviation = 0.69) leads to the conclusion that
her score is significantly worse (p<0.01) and well outside the control range.
A comparison between the reading and repetition tests suggests little consistency, with the
actual overlap (66) closer to chance (62.75) than to the maximum (71). However, since the
locus of a single lesion affecting both tasks would have to be at the phonological output
buffer or later, item consistency should not be expected, and the low-moderate level of
consistency is likely the result of common pressures such as word frequency and linguistic
complexity.
The semantic system
As with the two other cases reported in this chapter, DPC’s results on tests of the semantic
system were mixed. On the comprehension test she made 5 errors (1 regular word, 4
exception) which was significantly worse than controls. Error types were mixed, with 2
semantic (wolf � dog; chalk � duster) and 1 phonological distractor (glass � grass,
perhaps an orthographic or visual error) chosen, and 2 items not responded to. For PPT she
performed well on the 3-picture version in comparison to controls. For the other two
versions her scores were borderline. Despite her mixed performances on PPT, she was
extremely slow on all versions. Together with the comprehension test, it seems likely that

5:65
DPC has a mild semantic deficit, reflecting either damage or reduced activation to the
semantic system, or perhaps a difficulty in processing that has lead to slow and inefficient
processing of semantic information, as was argued for RPD and DHT. The latter of these
seems more likely, even if her PPT performance is considered to reflect a semantic
impairment; her score on the comprehension test is much worse than would be expected
from her borderline PPT performance.
PPT
Comprehension Test Mean 3P 2P1W 2P1S
n 80 52 52 52 52
DPC 75 47.00 48 47 46
Control M 79.73 50.44 50.07 50.73 50.53
2SD below M 78.82 47.60 46.18 48.06 47.93
Lowest control 79.00 46.33 45 47 47
Significance <0.01 0.02 0.16 <0.01 <0.01
Table 5:14. DPC’s performance on semantic tests.
Mean = mean of all 3 versions; 3P = 3-picture version; 2P1W = 2-picture/1-written word version; 2P1S
= 2-picture/1-spoken word version.
Picture naming
DPC performed significantly worse than controls on both picture naming tasks. For oral
naming there was minimal difference between regular (25 correct) and exception words
(23 correct). She produced only 2 semantic errors, which is normal compared to controls.
The majority of her errors were no-response, phonological and delayed, with a range of
other error types and several mixed errors. She occasionally struggled to produce the
desired response, resorting to spelling out some ‘phonological’ errors (incorrectly on all
occasions, e.g. dice � ‘L.I.C.E.’) or producing some sounds but giving up and producing a
semantic error (e.g. crow � ‘cr…cr…bird’).
Oral picture naming
Correct Errors
n=80 Delay Phon Morph Sem Circ P/U NR
DPC 48 7 8 3 2 2 1 9
Control M 79.00
2SD below M 77.00 Most control errors
Lowest control 77 1 0 0 2 1 2 0
Significance <0.01
Table 5:15. DPC’s performance on the oral naming test.
Delay = correct after time limit; Phon = phonological error and spelled out responses; Morph =
morphological error (including plural errors); Sem = semantic error; Circ = circumlocution; P/U =
perceptual or unrelated error; NR = no response.

5:66
DPC found written picture naming so difficult that the test was discontinued to avoid
distress after the initial 20 words. She was extremely slow and unsure of herself. Her
mistakes were mostly classified as spelling errors, though in most cases the words were
only half correct and most could not be considered reasonable spellings of the words (e.g.
chalk � calb; shorts � shorh; witch � wick). In total, 75% of her responses contained at
least partial orthographic similarity to the target word, indicating some access to
orthographic output.
Written picture naming
Correct Errors
n=80 Delay Spell Sem P/U NR
DPC 3 0 9 0 2 6
Control M 19.00
2SD below M 16.28 Most control errors
Lowest control 16 1 3 1 1 1
Significance <0.01
Table 5:16. DPC’s performance on the written naming test.
Delay = correct after time limit; Spell = spelling error; Sem = semantic error; P/U = perceptual or
unrelated error; NR = no response.
Item consistency calculations for DPC, apart from the comparison between oral naming
and repetition, should be interpreted cautiously, since the maximum in most cases is barely
above chance. Comparisons between oral naming and other tasks are presented in Table
5:17. There was a relatively high degree of consistency between oral naming and the
comprehension test, and the overlap between oral naming and the reading test was at the
maximum. A comparison between written naming and the same 20 items on oral naming
suggests a high degree of consistency between the two versions of naming as well.
However, the small number of items requires additional caution when interpreting this
finding, especially given how high chance was. In contrast, the overlap between oral
naming and repetition was not far above chance, suggesting limited overlap between these
tasks. Comparisons between written naming and other tasks produce figures too low to be
interpreted, with maximum overlaps between 4 and 6.

5:67
Overlap between oral naming and other tests
Chance overlap Actual overlap Maximum overlap Degree of overalap
Comprehension 47.00 51 53 Moderate/high
Reading 47.00 53 53 Maximum
Written naming 8.75 13 *13 Maximum
Repetition 45.20 48 62 Low
Table 5:17. Item consistency between oral naming and other tasks for DPC.
*From a reduced set of items (20).
Discussion – DPC
The results of testing with DPC suggest a wide range of impairments with multiple
potential lesion sites. Nevertheless, she performed well on several tests, indicating that she
has not sustained ‘global’ loss of lexical-semantic processing. Her performance on the
object decision and visual lexical decision tests indicate that her object recognition process
and orthographic lexicon are both intact, as are letter identification (also supported by
cross-case matching) and visual input. On the other hand, she had difficulties with reading
and repetition of words and nonwords and both naming tasks, with mixed results on tests
of the semantic system. Her multiple areas of difficulty and mixed results on semantic tests
make it somewhat difficult to localise the lesion sites.
As with RPD and DHT, the question of greatest importance is whether or not semantics is
impaired. Although her performance on PPT is not a conclusive demonstration of an intact
semantic system, her performance was at worst mildly impaired, and not to the extent that
would predict her relatively low score on the comprehension test, an intuitively simpler
task. Again it is argued that DPC has sustained damage to her semantic system in a manner
such that the representations themselves are generally preserved, but her ability to process
semantic information is slow and inefficient, having a greater impact on tests with time
constraints. This deficit is indicated by lesion a in Figure 5:3. On the other hand, of the
three cases presented in this chapter, DPC seems to be the most likely to have sustained
damage to the actual representations in her semantic system. Her visual difficulties, as
reported following a neuropsychological assessment shortly after her stroke, could also
have contributed to her low scores.

5:68
Figure 5:3. The basic model as it applies to DPC.
Proposed lesion sites are indicated in red and labeled. Green boxes and arrows represent modules and
pathways that are considered intact based on results of tests and assumptions of the model. Black
boxes and arrows represent features for which functioning is unclear.
Again, both naming tasks are also impaired, and quite severely. Compared to RPD, whose
performance on semantic tasks was only marginally better, DPC’s naming was
considerably worse, suggesting that any semantic impairment is merely one factor involved
in her poor naming. Reading and repetition are also impaired, for both words and
nonwords. Therefore, the simplest and most effective explanation is a lesion of the
phonological output buffer (lesion b). Additionally, comparisons between verbal tasks and
error analysis of each task – specifically the high rate of phonological errors and scarcity of
semantic errors – are congruent with damage to output phonological processing. Thus,
lesions a and b are able to account for DPC’s poor oral naming, while lesion b alone is
responsible for her impaired reading and repetition, as well as her poor performance on the
homophone decision task. Given that nonword reading was performed considerably worse
than the other tasks, an extra lesion of grapheme-phoneme conversion is possible.
However, it is also plausible that nonword reading is simply more sensitive to a lesion of
the phonological output buffer, since only once source of activation is provided. Therefore,
since grapheme-phoneme conversion appeared to be at least partially active, an additional
lesion within this process does not seem necessary, as it was with DHT.

5:69
Written naming appeared to be more severely affected than oral naming for DPC. On the
limited sample of words that she was asked to name, she was extremely slow and appeared
to become increasingly frustrated as the test proceeded. Although she only managed to
correctly name three of the 20 pictures that were presented, for most of the items she did
demonstrate at least partial access to orthographic information. However, it is clear that
DPC’s difficulties with written naming are beyond what can be explained by mildly
inefficient or impaired semantic processing. Since her letters are well formed, her difficulty
does not seem to relate to impaired motor functioning. Since the orthographic lexicon is
intact (based on lexical decision), the lesion would have to be either in the connection
between semantics and the orthographic lexicon, or at a point after the orthographic
lexicon. The lack of semantic errors and her ability to consistently access partial
orthographic information suggests the latter; it seems that she is able to accurately select
the orthographic word form but is unable to assemble it correctly. This deficit is indicated
by lesion c; without data from a dictation task, it is not clear whether this would be the
output buffer or access to it from the orthographic lexicon.
In sum, the basic model is able to account for DPC’s profile, with similar conclusions and
assumptions as those already discussed in relation to RPD and DHT.

5:70
Phonological dyslexia – general discussion
There seems to be little evidence in the literature to support any notion that phonological
dyslexia represents a genuine clinical symptom-complex, let alone a distinct syndrome,
and the interpretation of results from RPD, DHT and DPC does not challenge this view.
The only criteria for a ‘diagnosis’ of phonological dyslexia are that 1) nonword reading is
more severely impaired than real word reading, and 2) reading of real words does not
include semantic errors. The second criterion is necessary to distinguish phonological
dyslexia from deep dyslexia. The first criterion, however, is somewhat flawed. With
multiple routes to achieve reading of real words, it is reasonable to assert that this ability is
more resilient to brain injury, since a single lesion of grapheme-phoneme conversion is
enough to disrupt nonword reading, while multiple lesions are often needed to account for
defective reading of real words.
Even if a single lesion disrupts both processes it should impact word reading less because
there are multiple sources of activation providing input to enable the correct phonological
assembly. If so, then there are many ways that the first criterion can be met, at least from
the perspective of cognitive models. Lesions could be localised to: The grapheme-phoneme
conversion processes, as proposed for RPD; the phonological output buffer, as per DPC; a
wide range of combinations of different lesions affecting reading of both words and
nonwords, but with the latter more severely disrupted, such as the explanation for DHT’s
profile; or quite possibly a mild impairment of letter identification, which theoretically
should have less of an impact on activation of existing lexical entries than on accurate
conversion of novel letter strings. With such a variety of causes, the degree of impairment
relative to word reading seems quite irrelevant; rather, it is simply any degree of
impairment to nonword reading with a complete absence of semantic errors on word
reading, regardless of the extent of reading impairment, and including individuals for
whom word reading is intact.
Having said that, the label ‘phonological dyslexia’ is still useful provided it is only applied
as a clinical description, and not as a diagnosis. It is an efficient method of describing the
many individuals for whom nonword reading is impaired but without the characteristics of
deep dyslexia, and grouping participants in this way still enables certain predictions to be
explored even if, as is apparent here, the outcome suggests that have little in common.

5:71
The most striking similarity for the cases presented in this chapter is the contradiction in
results for the semantic tests. PPT performance ranged from borderline to excellent, yet
their scores on the comprehension test suggest that they have all sustained damage of some
nature that has impacted on their semantic processing. The account given in this chapter,
which also applies to JWS (Chapter 6), is that the semantic system can be damaged in such
a way that specific nodes remain intact, but the transmission of information within the
system, or perhaps the information entering the system, is now slower and/or less efficient.
It is not suggested that they have not experienced significant loss of semantic functioning –
ten seconds should be ample time to match a word with the correct picture – rather, the
suggestion is that for all of these individuals the damage is not to the semantic
representations themselves but to their ability to interact with each other. On this account,
the high number of semantic errors reflects running out of time and choosing the first
plausible picture, while the less common phonological/visual errors might indicate poor
working memory, reduced concentration and attention, confusion, or simply failing to look
closely at the printed word due to the pressure of time constraints. Once again, it is worth
noting that the concept of refractory access disorders (Crutch & Warrington, 2005) is
another suitable explanation for these participants. It is also possible that the answer lies in
the actual items used for each test, or more specifically differences in associations between
the various components of each item.
Of course, the concept that the semantic system can be rendered inefficient without
necessitating the assumption that the semantic representations themselves are degraded
requires an understanding of the internal structure of the semantic system, a theoretical
argument that is beyond the scope of this paper. However, it is an argument that needs to
be explored if the semantic system and cases like those presented in this chapter are to be
fully understood. Presumably the answer to this question could be resolved with
investigation of the semantic system that involves a variety of tests under timed and
untimed conditions.
In summary, this chapter has explored the language profiles of three aphasic individuals,
each of whom might be described as having phonological dyslexia. For all participants, the
central issue was the discrepancy between timed and untimed tests of the semantic system.
Other issues include the lack of sensitivity to neurological impairments for some tests, in
particular nonword repetition and written naming. However, the basic model was able to
account for the profiles of all of these participants. Furthermore, evidence was found for

5:72
the concept that semantic errors can relate to post-semantic lesions and to support the
existence of the lexical non-semantic route over the summation hypothesis.
A fourth case of phonological dyslexia, JWS, is discussed in the following chapter (with
the added complication that English is his second language). Interestingly, the
contradiction between semantic tests was again apparent, along with other patterns that are
much more difficult to explain than those discussed in this chapter.

6:73
Chapter 6. Interpreting results for a bilingual aphasic
Are cognitive models of language appropriate for use with aphasic individuals who
acquired English at a late age? There are observable neurological differences between first
and second languages, and these differences appear to vary according to age of acquisition.
In distinguishing between early and late acquisition of a second language, the ‘critical
period’ appears to be puberty, not only for functional ability but also hemispheric
lateralization and other neuroanatomical variations (Birdsong, 1999; Hull & Vaid, 2007;
Lenneberg, 1967; Marian, 2000; Marian, Spivey, & Hirsch, 2003). Furthermore, these
functional and neural distinctions between first and second languages appear to vary
according to the language task being performed (e.g. Weber-Fox & Neville, 1999).
Since an individual’s second language is theoretically stored and processed differently to
their first language, disruption of a second language is potentially more difficult for a
lexical model to explain. As a further complication, it seems reasonable to assume that
some (but not all) lexical tasks would be more difficult for a bilingual participant even
before an injury is sustained. Therefore, when an aphasic participant for whom English is
the second language is compared to normative data it must be in the context of what is
expected of a second-language speaker; this is achieved, in this case, by comparing the
participant’s data not only to the control group but also to an unimpaired speaker of the
same first language.
Case description
JWS was a 69-year-old man who moved to Australia from the Netherlands when he was
13. His wife reported that he had a slight Dutch accent premorbidly, which was not
exaggerated following the injury. He had a total of 9 years education (mostly in the
Netherlands), and had worked as a plumber and bobcat driver before retiring at age 55.
In October 2004, JWS presented to hospital with right-sided hemiparesis, hemisensory loss
and global aphasia. He was diagnosed as having sustained an ischaemic stroke of the left
middle cerebral artery. He reported no history of hypertension, hypercholesterolemia or
diabetes, though he did smoke until about 10 years prior to his stroke. Investigations one
year post-stroke revealed bilateral proptosis (bulging of the eyes) and Bell’s palsy, though
he had normal extra-ocular movements and full visual fields. There was no evidence of
verbal dyspraxia; dysarthria was not reported. In May 2006 he was reported to have

6:74
ongoing right-sided motor deficits including hemiparesis and evidence of upper motor
neuron spasticity in his hand.
Control M2
Control M2 was excluded from the main control group due to his mild difficulties with
English (compared to the rest of the group). He migrated from the Netherlands at age 21.
He received 9 years of education (in the Netherlands) and was employed on farms, at a
chemist shop and in an iron foundry. He reported mild hearing loss (which was not obvious
in conversation) and early macular degeneration in one eye, but is still able to read
newspaper font with the aid of glasses. Therefore, in terms of education, employment
history and perceptual abilities, M2 is a reasonably good match for JWS, particularly since
they both acquired English after puberty. Tests on which JWS scored significantly worse
than the control group were only considered indicative of an impairment if the score was
also significantly worse than M2’s result.
Results
JWS’ spontaneous speech was non-fluent and he relied heavily on his wife in conversation.
He also often failed to fully comprehend relatively lengthy or complex questions and
statements. A similar difficulty was observed on testing, when he often needed the
instructions repeated and occasionally proceeded without a clear understanding of the task
requirements (e.g. despite being told to mark all the correct letters on the mirror reversal
task, he marked all of the reversed letters instead). He was unable to use his right hand for
any task that required fine motor control. He was slow on all tasks, often failing to respond
quickly enough to items that were timed. Results for JWS are outlined in the following
sections. Significance (simple difference of performance relative to controls, for both JWS
and M2) was calculated using the Bayesian standardised difference method (Crawford &
Garthwaite, 2007). His responses to particular tests are listed in Appendix 5:e.
Input processes
On the object decision task, JWS outperformed the mean of the controls, indicating that
object recognition processes are intact. He made one error on cross-case matching, pairing
the capital ‘D’ with the lower case ‘b’ (unimpaired individuals are expected to perform this
task error free). He also made one error (from 36 items) on the mirror reversal task,
suggesting a possible minor impairment of letter recognition.

6:75
Object
decision X-case
matching Lexical
decision Homophone
decision
n 32 26 60 60
JWS 29 25 35 36
M2 25 56 43
Control M 25.93 58.33 55.65
2SD below M 20.62 53.57 48.72
Lowest control 20 53 50
Significance ns
\
<0.01 <0.01
Table 6:1.JWS’ performance on tests of input processes.
Results of object decision, cross-case matching, visual lexical decision, and homophone decision.
On the other hand, he performed extremely poorly (and barely above chance) on lexical
decision, suggesting severely impaired processing of, or access to, the orthographic lexicon
(in contrast, M2’s performance was comparable to the native English speakers). The main
reason for JWS’ low score was his tendency to identify nonwords as words, though this
might have been due to response bias. He also struggled with the homophone decision task,
which again was not much better than chance. M2 also performed poorly on this task (and
significantly worse than the native English speaking controls: p < 0.01). Furthermore, JWS
and M2 did not differ significantly (McNemar Test, p = 0.23) suggesting a possible
influence from their language background.
Reading and repetition of words and nonwords
On the word-reading test, JWS made 3 errors. He made one regularisation error (bear �
‘beer,’ which was not due to dialect difference since M2 read this word to rhyme with
‘pear,’ while JWS did not). He made 1 other exception word error (mask � ‘mast,’ a fairly
common phonological error made by several aphasic participants, on several different
tests), and 1 regular word error (noose � ‘nose,’ which is perhaps better described as a
visual error). Although significantly worse than controls, this result is comparable to M2,
who made 2 errors on exception words, both of which were regularisations (he enunciated
the silent letters in comb and sword). Therefore, reading might be intact for JWS in the
context of his language background. Alternatively, his errors on the reading test might
relate to the mild difficulties he encountered on the tasks of letter identification, since his 3
erroneous responses are visually quite similar to the relevant targets. Either way, his
reading of real words, in particular exception words, was considerably better than would be
predicted from his extremely impaired lexical decision performance.

6:76
Reading Repetition
Words Nonwords Words Nonwords
n 80 24 80 24
JWS 77 13 71 13
M2 78 21 67 9
Control M 79.87 22.94 79.2 21.73
2SD below M 79.16 20.57 77.04 15.42
Lowest control 79 21 77 13
Significance <0.01 <0.01 <0.01 <0.01
Table 6:2. JWS’ performance on reading and repetition tests.
In contrast, nonword reading was extremely poor for JWS, with an overlap between
response and target phonemes of 83.13%, compared with 96.39% overlap for M2, whose
total score was equal to the lowest scoring of the native English-speaking controls. His
score was significantly lower than M2’s (McNemar’s test, p = 0.02). Although his ability
to convert letters to sounds is impaired, his phoneme overlap indicates that he is still
reasonably capable of processing novel letter strings, though with reduced accuracy.
On word repetition, JWS made a total of 9 errors of which 7 were phonological (1 error
was morphological and 1 unrelated). However, this was a better result than that achieved
by M2. For repetition of nonwords, his score of 13 (with 5 lexicalisations and 86.04%
overlap) was not only better than the score achieved by M2 (with 8 lexicalisations and
76.53% overlap), but was also within the range of the control group. Although M2 reported
mild hearing difficulties, which might have affected his nonword repetition performance,
this should not have had such an impact on repetition of real words, which seems to be less
sensitive to hearing impairments. Therefore, there does appear to be an element of
disadvantage for bilingual speakers on repetition tests, for which JWS appeared to be intact
relative to M2. Therefore, his phonological input and output buffers and sublexical
repetition route must be intact. Additionally, if his phonological output buffer is intact,
then his difficulties with nonword reading must be due to either his mild impairment of
letter identification, or to the grapheme-phoneme conversion process itself.
The semantic system
JWS made a total of 8 errors on the comprehension test, which was well outside the range
of the control group, though not significantly worse than M2 (McNemar’s test, p = 0.23).
Two errors seemed to be visual in nature: glass, was probably misread as the phonological
distractor (grass), and bread he misread (aloud) as ‘breed,’ and did not respond. For the
remaining 6 errors JWS chose the semantic distractor. Since M2 was also significantly

6:77
below the level of the native English speaking controls (p < 0.01) with 3 semantic errors,
the result of this test is difficult to interpret. However, although some of his errors on the
comprehension test could perhaps be attributed to his bilingual background, there are
indications that JWS is either experiencing impaired semantic processing or receiving
reduced input to the semantic system.
PPT
Comprehension Test Mean 3P 2P1W 2P1S
n 80 52 52 52 52
JWS 72 46.33 46 45 48
M2 77 48.00 49 48 47
Control M 79.73 50.44 50.07 50.73 50.53
2SD below M 78.82 47.60 46.18 48.06 47.93
Lowest control 79.00 46.33 45 47 47
Significance <0.01 <0.01 0.03 <0.01 0.04
Table 6:3. JWS’ performance on semantic tests.
Mean = mean of all 3 versions; 3P = 3-picture version; 2P1W = 2-picture/1-written word version; 2P1S
= 2-picture/1-spoken word version.
On PPT, JWS’ scores were reasonably consistent and similar to the lowest scores of the
native English-speaking controls. His scores across the three versions was not significantly
different to M2 (t(51) = 1.40, p = 0.17). It would be difficult to justify a semantic deficit
from these results alone, particularly since he performed within the range of controls on
two versions. Also, his relatively low score on the 2-picture/1-written word version appears
to be consistent with his difficulties on other tasks that involve orthographic processing.
On the other hand, his score on the 2-picture/1-spoken word version suggests that his
phonological lexicon at least is probably intact. Overall, however, the integrity of his
semantic system is not clear, with a pattern similar to the cases presented in Chapter 5, and
is therefore best considered another example of intact semantic representations with
inefficient processing on time-constrained tasks.
Picture naming
Oral picture naming was severely impaired for JWS. M2 also had difficulty with this task,
with a score significantly below that of the native English-speaking controls (p < 0.01).
However, M2 only made three errors more than other controls, in contrast to JWS who was
only able to correctly name approximately half of the pictures, and was significantly worse
than M2 (McNemar’s test, p < 0.01). While many of his errors were correct but out of time
(supporting the hypothesis of inefficient processing rather than complete loss of semantic
representations) semantic errors were the most common type. There was a significant

6:78
discrepancy between regular and exception words (16 and 25 correct respectively; Fisher
exact, p = 0.04), in the opposite direction to that which can be readily explained by most
cognitive models.
Oral picture naming
Correct Errors
n=80 Delay Phon Morph Sem Circ P/U NR
JWS 41 13 2 0 17 3 0 4
M2 74 0 1 1 3 0 0 1
Control M 79.00
2SD below M 77.00 Most control errors
Lowest control 77 1 0 0 2 1 2 0
Significance <0.01
Table 6:4. JWS’ results on the oral naming test.
Delay = correct after time limit; Phon = phonological error; Morph = morphological error (including
plural errors); Sem = semantic error; Circ = circumlocution; P/U = perceptual or unrelated error; NR
= no response.
Written naming was also extremely impaired, and was discontinued after the initial 20
items. Using his non-dominant left hand, his responses were extremely slow and effortful.
He generated just 3 correct regular words and 1 correct exception word. Many of his letters
were malformed suggesting a considerable influence from damage to the late stages of
orthographic output (e.g. apraxia). However, other factors also seem to have been
involved. Of his 6 spelling errors, 3 were omission of a single letter (e.g. watch � wath,
and the regularisation error sword � sord), while the remainder were only barely related to
the target (drum � dump; kite � kert; axe � ars). Many of his errors were mixed
(including both of his semantic errors) and others bore little, if any, resemblance to the
target word. Some were only interpretable because he was asked to verbalise these
responses after writing them. These errors appear to reflect severely disrupted orthographic
processes, far beyond what can be explained by a motor deficit alone. In contrast, M2
performed significantly better (McNemar’s test, p < 0.01) and was not significantly worse
than the native English-speaking controls (p = 0.09).

6:79
Written picture naming
Correct Errors
n=20 Delay Spell Morph Sem P/U NR
JWS 4 0 6 1 2 3 4
M2 17 0 2 0 0 0 1
Control M 19.00
2SD below M 16.28 Most control errors
Lowest control 16 1 3 0 1 1 1
Significance <0.01
Table 6:5. JWS’ performance on the written naming test.
Delay = correct after time limit; Spell = spelling error; Morph = morphological error (including plural
errors); Sem = semantic error; P/U = perceptual or unrelated error; NR = no response.
A sample of JWS’ responses on written naming appear in Figure 6:1 below, with the target
response to the right of each and, where relevant, the semantic relative he attempted to
produce in brackets.
Response Target (and intended response)
Figure 6:1. Sample of written naming responses for JWS.
When asked to print the alphabet (see Figure 6:2 below), he was quite slow and messy. He
missed 4 letters (L, N, Q, V) and some of his letters were malformed (e.g. ‘W’ was upside
down, ‘F’ was missing a line). His performance supports the hypothesis of a defect late in
the processing of letters (i.e. orthographic output buffer or later), or perhaps
miscommunication between orthographic output and the right-sided motor areas
responsible for writing with his left hand.
chef (cook)
road
shorts (pant)
kite
glove
dog
axe
drum

6:80
Figure 6:2. Attempted alphabet by JWS.
By reducing oral naming to the 20 items tested on written naming, these two tasks can be
compared. JWS made 6 errors on the reduced set of oral naming items, all of which
overlapped with the 16 errors on written naming – that is, the overlap is as high as it could
possibly be, suggesting a possible relationship between the two deficits, even though the
data set is too small to be convincing.
Since the locus of a single deficit for both versions of naming would have to be the
semantic system (or access to it from object recognition), an overlap between the
comprehension test and each version of naming might also be expected. Reducing the
comprehension test to the 20 items completed on written naming yields an overlap of just
8, which is below chance (8.8). The overlap between comprehension and oral naming is
also less than chance (actual overlap of 39, compared with chance of 40.8 – the maximum
is 49). This suggests that if there is a common lesion responsible for all three impairments,
its effect might be similar to the inefficient semantic processing described in Chapter 5,
and the consistency between the naming tasks simply a coincidence.
Discussion
Results for JWS are presented graphically in Figure 6:3, in the context of the basic model.
Tests on which JWS performed well relative to either the controls or to M2 have been
considered intact in the context of his bilingual background. With this consideration in
mind, several processes seem to be intact: The integrity of object recognition was well
supported by an excellent score on the object decision task; repetition of both words and
nonwords was performed well enough to suggest that his phonological input and output
buffers, and the sublexical repetition route that links them, are all intact; letter
identification seems to be reasonable, though perhaps slightly defective; and finally, his
reasonable score on the 2-picture/1-spoken word version of PPT suggests that processes
linking his phonological input buffer and semantic system, including his phonological
lexicon, are probably intact. Since the phonological output buffer is intact and letter
identification reasonable, his poor nonword reading can only be accounted for by a lesion
of grapheme-phoneme conversion (lesion a in the model). Once again, however, it is not

6:81
clear what impact his probable impairment of letter identification might have had on later
processing. As was discussed in the previous chapter, it is theoretically possible that
damage to the letter identification process would have a greater impact on nonword
reading than on word reading.
Before discussing other potential lesion sites, JWS’ pattern of results raised several issues
that need to be clarified. As with the cases presented in Chapter 5, scores for JWS on tests
of the semantic system were mixed, with a borderline performance on PPT contrasting
with a score on the comprehension test that was indicative of a fairly obvious semantic
impairment. Again, it is suggested that the differing results are due to the contrast in test
conditions, and that JWS has a mild impairment of the semantic system (lesion c in the
model) that becomes evident on timed tests due to inefficient processing of semantic
information despite the representations within the system remaining intact.
The most striking observation concerns the orthographic lexicon. JWS made three errors
on the reading test, one more than M2 and two more than the worst performing member of
the control group. Although this result might reflect the impact of a lesion, the impairment
is, at worst, very mild. In contrast, JWS’ ability to distinguish between real words and
nonwords on a visual lexical decision task was severely impaired, and this deficit is
accounted for by lesion b in the model. Since M2 performed within the range of the control
group on this task, language background does not seem to have influenced the result.
Astonishingly, this impairment represents defective processing of a component that is
crucial to the reading of exception words, the orthographic lexicon (or perhaps input to it
from letter identification). Although it is possible that JWS was reading regular words via
the slightly impaired grapheme-phoneme conversion process, regularisation errors should
have been common in his reading of exception words if the orthographic lexicon is as
defective as it appears to be.

6:82
Figure 6:3. The basic model as it applies to JWS.
Questions marks indicate areas where the model is unable to account for his results. Proposed lesions
are labeled and indicated by red boxes and arrows. Green boxes and arrows represent modules and
pathways that are considered intact based on results of tests and assumptions of the model. Black
boxes and arrows represent features for which functioning is unclear.
Do other tests provide any evidence for or against the integrity of the orthographic lexicon?
Some support for a lesion of the orthographic lexicon appears in JWS’ results on tests of
the semantic system. The only version of PPT on which JWS performed worse than the
control group was the 2-picture/1-written word version, which does suggest a difficulty
with orthographic input to the semantic system, particularly since he also performed very
poorly on the comprehension test. However, once again the extent of damage suggested by
his poor lexical decision is far beyond what was observed for the comprehension test and
PPT. Other tests that involve the orthographic lexicon are inconclusive. Homophone
decisions were just as difficult for JWS as was the lexical decision task, though M2 also
struggled on this test. Although written naming could be argued to stem from damage to
the orthographic lexicon from his lexical decision results alone, there is, once again, the
question of why written naming, like lexical decision, is so much more impaired than
reading.
All mainstream models conceptualise normal reading as being accomplished via a pathway
that involves a process that is also responsible for lexical decision (initially the
orthographic lexicon or orthographic input lexicon), with regular word reading also

6:83
possible via grapheme-phoneme conversion. So how is reading possible with near-normal
accuracy (with no discrepancy between regular and exception words) when lexical
decision and nonword reading are both severely impaired? One possibility is that his
reading is improved by the process of grapheme-phoneme conversion. Even though his
nonword reading is well below normal in terms of total correct, the high overlap between
his responses and the targets makes this a reasonable proposition. However, this should
lead to a discrepancy between regular and exception words. It is possible that the common,
monosyllabic exception words used for this research are simply not irregular enough (i.e.
do not conflict enough with the rules of grapheme-phoneme conversion) to cause a
discrepancy between the two word groups. Supporting this interpretation is the observation
that no participant performed significantly worse on exception word reading than on
regular word reading (the biggest discrepancy was two errors more on exception words
from a total of 42 errors).
A more concise explanation might be the summation hypothesis (Hillis & Caramazza,
1991), which would argue that partial activation of the phonological output lexicon by both
grapheme-phoneme conversion and the lexical non-semantic route combine to activate the
target word above threshold. For both of these explanations, however, the most obvious
criticism is that if lexical decision is only performed at the level of chance, then the
orthographic lexicon must be practically non-functional. Even with input from grapheme-
phoneme conversion (which is only partially operational), reading should be extremely
difficult and, furthermore, a pattern of surface dyslexia should be evident.
Could this dilemma be resolved by modifying the model? Separate lexicons for input and
output would certainly not help to resolve this problem. One feasible solution would be to
suggest that the orthographic lexicon is constructed in such a way that the highly
imageable words on the reading test are better preserved than the less imageable words of
lexical decision, or perhaps that feedback from the semantic system somehow boosts high
imageability words more so than less imageable words.
Alternatively, JWS’ language background could be the answer. If first and second
languages are stored differently in the mind, then it is possible that separate processes are
able to interact for some tasks but not others. The complex nature of multiple interacting
neurological and premorbid linguistic factors mean that cognitive models of language
might be insufficient to fully understand bilingual aphasics, particularly those such as JWS,

6:84
who acquired his second language at a relatively late age. To further elaborate on the
complex interplay between first and second languages, Marian and colleagues (2003)
discuss the ‘parallel access position,’ which stipulates that the two languages can operate in
parallel, even if language input is only for one of the languages. Although the degree of
interaction varies according to factors such as age of acquisition and proficiency, they
report that sublexical processing, for example, is language independent on initial
presentation of spoken language. Neurologically, this initial phonological processing
activates simultaneous, overlapping areas; however, activation of lexical representations is
less clear, and appears to activate larger (though still overlapping) areas of the brain. This
concurs with the observation that the functional patterns established during acquisition of a
first language will underlie the learning of the second (Hull & Vaid, 2007).
According to Hull and Vaid (2007), the cognitive neuropsychological approach to
bilingualism assumes a functional distinction between first and second languages, either
for the lexicons or the entire language network. Marian and colleagues (2003) observe that
the question of bilingual distinctions no longer concerns whether or not the two languages
are shared, but what is the nature of the overlap and interaction between the languages, and
what are the factors that influence this relationship. Therefore, it is not surprising that
cognitive neuropsychology is criticised in its approach to understanding bilingual aphasics.
According to Hull and Vaid (2007), language profiles of bilingual aphasics should not be
considered in terms of damage to a processing module (or even to a neural structure) that is
devoted to the defective language, whether that be the first or the second language. The
authors instead support a functional approach, by trying to determine patterns of
fluctuating damage to the individual’s inhibitory or activation processes. The authors site
the work of Paradis (2000), who observed that some bilingual aphasics are able to speak
capably in one of their languages but not the other on a particular day, but might
demonstrate the opposite the next day.
Therefore, there are myriad ways in which first and second language processes (and,
perhaps, left and right hemisphere processes) might interact to allow exception word
reading for a person with impaired lexical processing. Alternatively, his pattern might
simply reflect fluctuating abilities from one day to the next. Either way, it seems unlikely
that any standardised cognitive model of language processing could account for the diverse
range of bilingual aphasics given the widely varying influences of age of acquisition,
proficiency, hemispheric lateralisation and other differences in neural processing,

6:85
fluctuations between abilities in the languages, overlapping and interacting processes at
both the neural and functional levels, and a wide array of possible individual differences
such as personality, intelligence and learning strategies.
Nevertheless, other aspects of JWS’ profile are less complex, and can be understood in
terms of the basic model. Oral and written naming are both severely impaired. As
discussed above, this could relate to inefficient semantic processing. Alternatively, given
the severity of his naming impairments, any semantic deficit underlying both oral and
written naming are probably exacerbated by additional, post-semantic lesions. For oral
naming, there are two candidates for the location of such a lesion. The first is the
connection between the semantic system and the phonological lexicon, with reading of real
words achieved primarily by the lexical non-semantic route. The second is the connection
between the phonological lexicon and the phonological output buffer, with repetition of
real words achieved by the sublexical repetition route. Precedents established by the
literature would suggest that the error patterns in his oral naming, in particular the high
number of semantic errors, are more consistent with the former, which is indicated by
lesion d.
Written naming, however, appears to be more severely impaired than oral and beyond what
would be predicted from his semantic impairment. The low number of semantic errors
complies with this assertion, and furthermore suggests that any additional lesion is
probably located at the orthographic lexicon, which has already been identified as a lesion
site. However, closer inspection of his written naming performance suggests other lesions
could also be involved. Many of his letters were malformed (in written naming and when
asked to write the alphabet) suggesting a considerable influence from damage to the late
stages of written output (e.g. poor motor coordination). However, the high number of
spelling errors (35% of total responses, including mixed errors), suggests JWS is also
experiencing difficulty assembling the words correctly, suggesting a possible lesion of the
orthographic output buffer (lesion c)or input to it from the orthographic lexicon. Needless
to say, JWS’ written naming appears to reflect a complex interplay of different lesions
(semantic, orthographic lexicon or output buffer, and motor coordination) with a
contribution from his language background.
Finally, there was a significant discrepancy between regular and exception words on oral
naming, in a direction that does not correspond with any standard explanation (even one

6:86
that takes into account the relationship between first and second languages). If the
discrepancy was for written naming, the explanation could perhaps involve the suggestion
that exception word items can be less vulnerable because they rely more on memory of
word spellings learnt by rote and less on normal spelling rules – rules that can be impaired,
leaving regular words more vulnerable. However, even if this explanation could be
justified it is difficult to see how it could relate to oral naming. Once again it is difficult to
rule out the complex interaction between his two languages as making representations of
exception words in the phonological lexicon somehow less vulnerable than regular words.
In conclusion, the basic model might be able to explain some bilingual aphasic
participants, but it was not able to account for the pattern of results observed for JWS.
However, the one contradiction that could not be accounted for is probably inexplicable for
any model that fails to account for the interaction between his first and second languages.
As suggested by Hull and Vaid (2007), it could simply be the case that cognitive models of
language are unsuitable for bilingual aphasics, and that a more appropriate perspective is a
functional approach that takes into consideration the complexities of failed inhibition and
activation of various processes from the two languages.
The following chapter is devoted to SJS, an individual whose results fit the profile of deep
dyslexia.

7:87
Chapter 7. A case of deep dyslexia
Deep dyslexia
As its name suggests, deep dyslexia is a profound form of acquired dyslexia. It is generally
associated with extensive left-hemisphere damage, usually resulting in aphasia and right-
sided hemiparesis. The hallmark of deep dyslexia is the production of semantically related
errors when reading aloud, such as horse being read as ‘cow.’ In addition to semantic
errors, visual errors (eg. dice � ‘ice’) and morphological errors can be produced during
reading aloud. Abstract words are more susceptible than concrete words, function words
are difficult to read, and nonwords are practically impossible to read. Writing, if possible at
all, will reflect all of these symptoms (see Coltheart, 1987 for a comprehensive review).
The first comprehensive attempt to explain the various impairments associated with deep
dyslexia posited damage to six separate components of the lexical-semantic system
(Morton & Patterson, 1987). However, the strikingly obvious drawback of this account is
that if six isolated areas of the brain must be damaged to produce the syndrome of deep
dyslexia, then there should be cases demonstrating a myriad of combinations of the six
deficits (e.g. the first five symptoms, the first two and last two symptoms and so on). An
alternate hypothesis that appeared at the same time proposed that deep dyslexia was not the
result of a damaged left hemisphere reading system, it was instead the outcome of normal
reading processes in the right hemisphere, which become dominant when the left
hemisphere reading system has become non-functional (Coltheart, 1987; Saffran, Bogyo,
Schwartz, & Marin, 1987). Indeed, radiological investigations have provided evidence that
severe damage to Broca’s area can lead to greater activation of homologous areas of the
right hemisphere, as well as peripheral language areas of the left hemisphere during
language tasks (e.g. Calvert et al., 2000).
There is now a growing volume of neurological evidence to support the right hemisphere
hypothesis (e.g. Schweiger, Zaidel, Field, & Dobkin, 1989; Weekes, Coltheart, & Gordon,
1997). Although measuring hemispheric lateralization would seem to be a relatively
straightforward matter for radiological investigation, the issue is somewhat more
complicated than that (see Coltheart, 2000; Laine, Salmelin, Helenius, & Marttila, 2000;
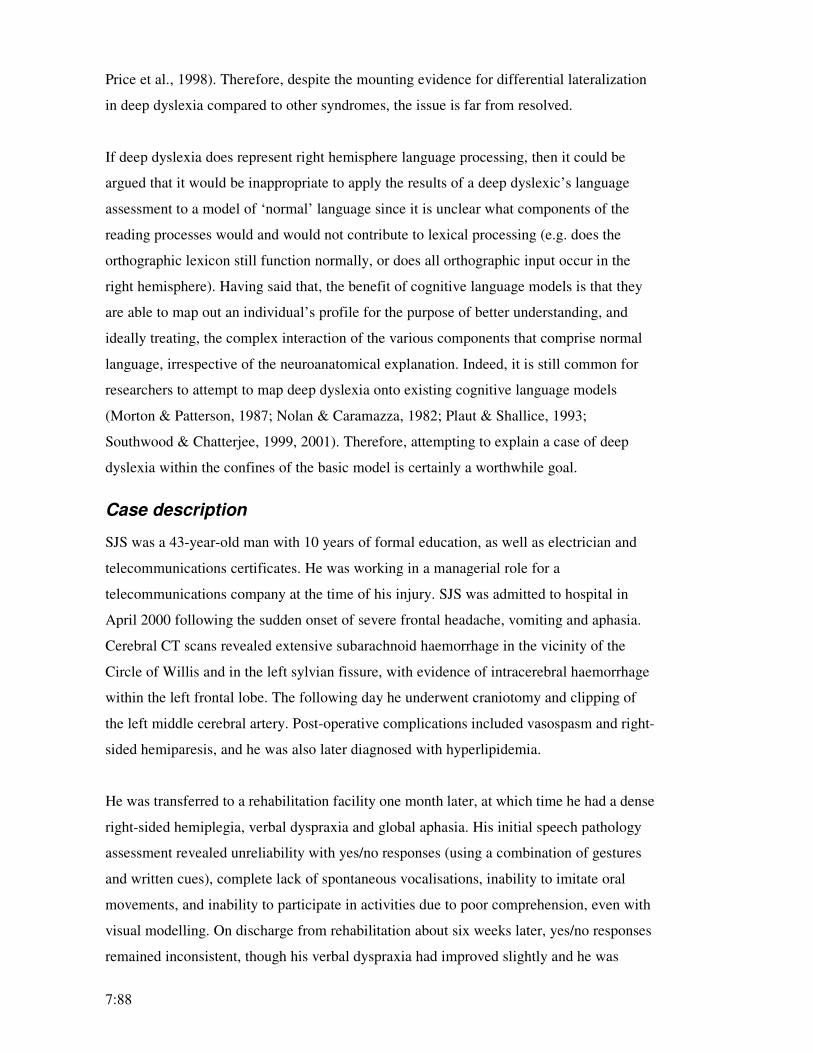
7:88
Price et al., 1998). Therefore, despite the mounting evidence for differential lateralization
in deep dyslexia compared to other syndromes, the issue is far from resolved.
If deep dyslexia does represent right hemisphere language processing, then it could be
argued that it would be inappropriate to apply the results of a deep dyslexic’s language
assessment to a model of ‘normal’ language since it is unclear what components of the
reading processes would and would not contribute to lexical processing (e.g. does the
orthographic lexicon still function normally, or does all orthographic input occur in the
right hemisphere). Having said that, the benefit of cognitive language models is that they
are able to map out an individual’s profile for the purpose of better understanding, and
ideally treating, the complex interaction of the various components that comprise normal
language, irrespective of the neuroanatomical explanation. Indeed, it is still common for
researchers to attempt to map deep dyslexia onto existing cognitive language models
(Morton & Patterson, 1987; Nolan & Caramazza, 1982; Plaut & Shallice, 1993;
Southwood & Chatterjee, 1999, 2001). Therefore, attempting to explain a case of deep
dyslexia within the confines of the basic model is certainly a worthwhile goal.
Case description
SJS was a 43-year-old man with 10 years of formal education, as well as electrician and
telecommunications certificates. He was working in a managerial role for a
telecommunications company at the time of his injury. SJS was admitted to hospital in
April 2000 following the sudden onset of severe frontal headache, vomiting and aphasia.
Cerebral CT scans revealed extensive subarachnoid haemorrhage in the vicinity of the
Circle of Willis and in the left sylvian fissure, with evidence of intracerebral haemorrhage
within the left frontal lobe. The following day he underwent craniotomy and clipping of
the left middle cerebral artery. Post-operative complications included vasospasm and right-
sided hemiparesis, and he was also later diagnosed with hyperlipidemia.
He was transferred to a rehabilitation facility one month later, at which time he had a dense
right-sided hemiplegia, verbal dyspraxia and global aphasia. His initial speech pathology
assessment revealed unreliability with yes/no responses (using a combination of gestures
and written cues), complete lack of spontaneous vocalisations, inability to imitate oral
movements, and inability to participate in activities due to poor comprehension, even with
visual modelling. On discharge from rehabilitation about six weeks later, yes/no responses
remained inconsistent, though his verbal dyspraxia had improved slightly and he was

7:89
occasionally able to produce an appropriate word orally – written output was completely
non-functional. He had difficulties with gesture and communication boards, and he
demonstrated impairments of both conceptual and lexical semantics, with degraded access
from both phonological and orthographic input lexicons.
In February 2003, almost three years post-injury, a neuropsychological assessment
revealed a general reduction in cognitive abilities, including slowed speed of information
processing, difficulties with higher level planning and problem solving, and reduced
memory for complex visual information. This was in addition to his profound expressive
and receptive language deficits and a number of behavioural concerns.
An orthoptic report in June 2001 reported an earlier finding of right homonymous
hemianopia with macular sparring, though there was no evidence of this at the time of the
orthoptic assessment, nor were there any signs of neglect, ocular motor nerve palsy or gaze
palsy. His shortsightedness is corrected by glasses, and he was considered to be within
medical guidelines for driving.
Results
Spontaneous language for SJS was as expected based on speech pathology reports. He was
extremely non-fluent, with mostly single word utterances. The words that he did produce
were often generic, high frequency words that were semantically related to the concepts
that he was trying to express. He used a communication book at times, but conveying
information around the images was extremely effortful for him, and often ended without
success. He often initiated conversation, though he seemed to be limited to just a few
topics that he could convey (i.e. he often mentioned his cat, daughter, computer or work,
all words that he was able to produce reliably).
SJS’ results are outlined in the following sections. Significance (simple difference of his
performance relative to controls) was calculated using the Bayesian standardised difference
method (Crawford & Garthwaite, 2007). His responses to particular tests are listed in
Appendix 5:f.
Input processes
SJS performed better than the mean of the control group on the object decision task,
indicating that his object recognition abilities are intact. He did not make any errors on
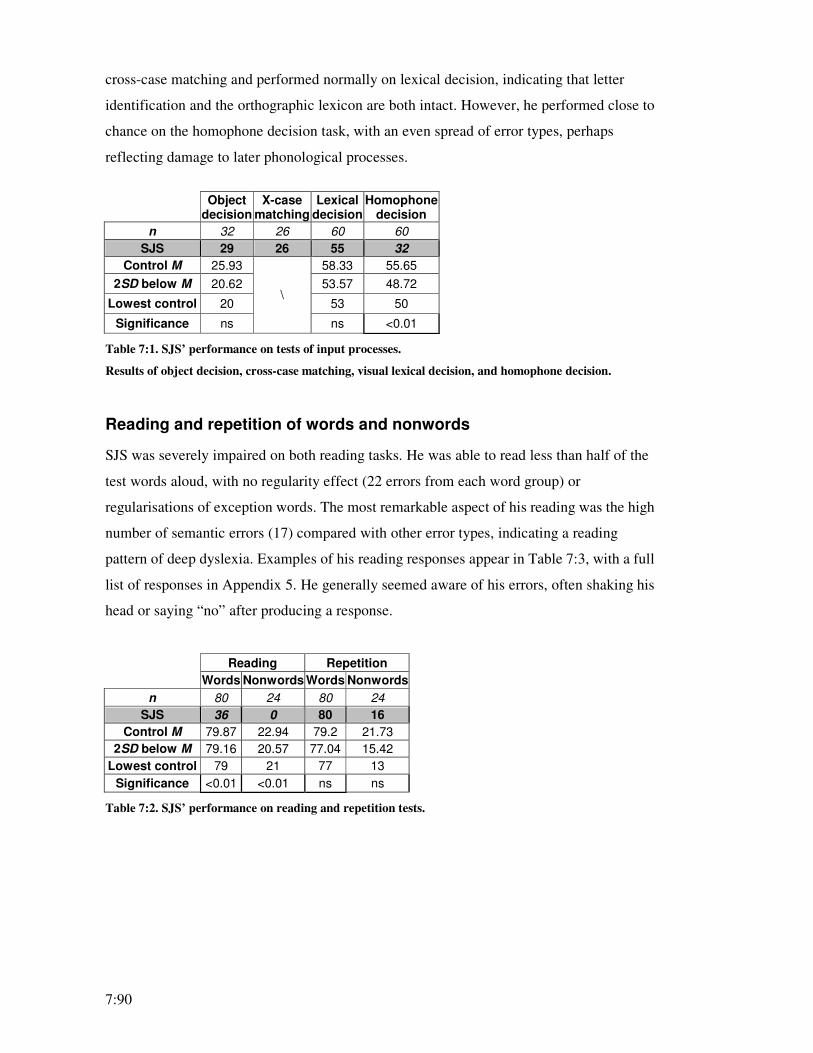
7:90
cross-case matching and performed normally on lexical decision, indicating that letter
identification and the orthographic lexicon are both intact. However, he performed close to
chance on the homophone decision task, with an even spread of error types, perhaps
reflecting damage to later phonological processes.
Object
decision X-case
matching Lexical
decision Homophone
decision
n 32 26 60 60
SJS 29 26 55 32
Control M 25.93 58.33 55.65
2SD below M 20.62 53.57 48.72
Lowest control 20 53 50
Significance ns
\
ns <0.01
Table 7:1. SJS’ performance on tests of input processes.
Results of object decision, cross-case matching, visual lexical decision, and homophone decision.
Reading and repetition of words and nonwords
SJS was severely impaired on both reading tasks. He was able to read less than half of the
test words aloud, with no regularity effect (22 errors from each word group) or
regularisations of exception words. The most remarkable aspect of his reading was the high
number of semantic errors (17) compared with other error types, indicating a reading
pattern of deep dyslexia. Examples of his reading responses appear in Table 7:3, with a full
list of responses in Appendix 5. He generally seemed aware of his errors, often shaking his
head or saying “no” after producing a response.
Reading Repetition
Words Nonwords Words Nonwords
n 80 24 80 24
SJS 36 0 80 16
Control M 79.87 22.94 79.2 21.73
2SD below M 79.16 20.57 77.04 15.42
Lowest control 79 21 77 13
Significance <0.01 <0.01 ns ns
Table 7:2. SJS’ performance on reading and repetition tests.

7:91
Error type Error
number (n=45)
Target Response
ice dice Phonological/visual 2
nose hose
Inflectional 3 shoe shoes
bowl soup
brick book, no, wood
cloud rain
clown easter show
goat bull
salt pepper
Semantic 17
tent camp
gate lock, up there (g) Circumlocution 4
pear fridge (g)
crow flowers
fork wine
noose duck Unrelated/mixed 8
shield lawn
No response 11
Table 7:3. Reading errors for SJS.
Bracketed (g) indicates he gestured or pointed as part of his response.
Nonword reading was almost impossible for SJS. He was unable to read any of the words
accurately, though he did manage to produce some of the appropriate sounds in the stimuli
(there was an overlap of 19.65% between his responses and the targets, which was almost
entirely from lexicalisations). Although he responded to 22 of the 24 items with real words,
only 5 of these were actually lexicalisations (e.g. ked � ‘bed’). The remainder of his
responses bore little, if any, resemblance to the stimuli (e.g. nar � ‘washing;’ grest �
‘flowers’). As with other tests, many responses appeared more than once (e.g. ‘flowers’
was produced in response to 3 different items, none of which bore any resemblance to this
word). A full list of his nonword reading errors appears in Appendix 5.
Repetition of real words was flawless, indicating that the phonological input and output
buffers are both intact. It is also unlikely, based on this result, that his hearing is impaired.
Therefore, his relatively poor result in nonword repetition suggests that the sublexical
repetition route is not completely functional, which would suggest that the phonological
lexicon is probably intact since word repetition is so good. If this is the case, then similar
results should be evident in the control data. Indeed, for the controls that performed word
repetition without error, the average score on nonword repetition was 23.22 (standard
deviation 1.64), suggesting that a flawless performance on word repetition along with a
relatively low score on nonword repetition is a good indication that the latter is probably

7:92
impaired (allowing for 1 error on repetition makes no difference to this conclusion –
controls who performed poorly on nonword repetition all made 2-3 errors on word
repetition). Therefore, a discrepancy as large as that demonstrated by SJS strongly suggests
an impairment specific to nonword repetition. He produced a high number of
lexicalisations on nonword repetition (6), though this was not unusual in comparison to
some controls (up to 9 lexicalisations).
The semantic system
SJS performed poorly on all tests of the semantic system. He made 9 errors on the
comprehension test (6 semantic, 3 phonological), which is high even in comparison to the
other aphasic participants. The distinct lack of ‘unrelated’ errors despite the high number
of total errors (relative to both controls and to other participants) suggests that, rather than
a complete lack of understanding of the stimulus words (and guessing of the answers),
certain aspects of the items were being processed, but inaccurately. Also, they did not
appear to be perceptual errors since the words representing the phonemic distractors were
perceptually quite dissimilar to the targets (e.g. flask�mask; glass�glove) and most of
the semantic errors were not in any way perceptually similar (e.g. key�lock; dice�cards;
witch�broom). SJS also performed significantly worse than controls on all versions of
PPT, with scores falling 2-3 below the range of controls, and consistent across the three
versions. Results of these tests suggest that SJS is experiencing impaired semantic
processing.
PPT
Comprehension Test Mean 3P 2P1W 2P1S
n 80 52 52 52 52
SJS 71 44.00 43 45 44
Control M 79.73 50.44 50.07 50.73 50.53
2SD below M 78.82 47.60 46.18 48.06 47.93
Lowest control 79.00 46.33 45 47 47
Significance <0.01 <0.01 <0.01 <0.01 <0.01
Table 7:4. SJS’ performance on semantic tests.
Mean = mean of all 3 versions; 3P = 3-picture version; 2P1W = 2-picture/1-written word version; 2P1S
= 2-picture/1-spoken word version.
Picture naming
SJS performed poorly on both naming tasks, though he generally indicated that he was
aware of his errors in a similar fashion to word reading. For oral naming, the majority of
his errors were semantic errors and circumlocutions, and in many cases it was quite

7:93
difficult to distinguish between these two error types due to his non-fluent output. He used
a lot of gestures, often in conjunction with generic words including ‘immature’ descriptive
words (e.g. yuck, yummy), and often described the target word by giving 2-3 semantically
related words, or a single word accompanied by a gesture (these were considered ‘single-
word circumlocutions’).
Oral picture naming
Correct Errors
n=80 Delay Phon Morph Sem Circ P/U NR
SJS 32 0 2 2 18 15 4 7
Control M 79.00
2SD below M 77.00 Most control errors
Lowest control 77 1 0 0 2 1 2 0
Significance <0.01
Table 7:5. SJS’ performance on the oral naming test.
Delay = correct after time limit; Phon = phonological error; Morph = morphological error (including
plural errors); Sem = semantic error; Circ = circumlocution; P/U = perceptual or unrelated error; NR
= no response.
Examples of his errors appear in table 7:6 below, with a full list in Appendix 5. Of his 48
errors, 21 were for regular words and 27 for exception words. Although a relatively large
discrepancy, it was not significant (Fisher exact, p = 0.13). The main reason for the
discrepancy was the difference in semantic errors and circumlocutions (19 for exception
words, 14 for regular words).
Error type Subtotal (n=48)
Target Response
ball bowl Phonological/visual 2
key chee
tooth teeth Morphological 2
worm worms
bee fly
beer glass
bread toast
chalk pencil
dog cat
Semantic 18
nose eye
blinds open/doors (g)
hose grass (g) Circumlocutions 15
scroll old, long time
bear yuck
brick foot Unrelated/mixed 4
cake nice
Table 7:6. Examples of oral naming errors for SJS.

7:94
Written naming was extremely difficult for SJS, achieving just over 10% accuracy. Despite
his low number of semantic errors and complete absence of morphological errors, this
pattern is not necessarily in conflict with previous accounts of deep dyslexia. Rather, many
of the unrelated errors could simply be of mixed error types, making the actual responses
indecipherable. A total of 21 errors were spelled correctly, including semantic and
unrelated errors, though as many as 18 of these might have been perseverations (they had
appeared previously as responses, either correct or incorrect, earlier in the test). As many
as 5 of his responses on oral naming might have been perseverations. He made more errors
on regular words (38) than he did on exception words (33), though the difference was not
significant (Fisher exact, p = 0.08).
Written picture naming
Correct Errors
n=80 Delay Spell Sem P/U NR
SJS 9 0 8 5 45 13
Control M 77.07
2SD below M 71.80 Most control errors
Lowest control 72.00 2 5 2 1 1
Significance <0.01
Table 7:7. SJS’ performance on the written naming test.
Delay = correct after time limit; Spell = spelling error; Sem = semantic error; P/U = perceptual or
unrelated error; NR = no response.
Only 1 of his spelling errors was spelled with normal orthographic-phonological rules
(plane � plain). The remaining 8 spelling errors were all rather atypical (i.e. they were not
the type of spelling errors that an unimpaired ‘bad speller’ or someone with a mild
orthographic deficit might occasionally make) and many contained only half of the correct
phonemes or letters, the minimum required to be included as a spelling error. His spelling
errors included inappropriate vowel substitutions (e.g. tent � tant; book � bouk),
incorrect letter order (e.g. bee � eeb) and letter additions and deletions (e.g. watch �
switch; cloud � cud). These errors suggest that he was able to access some aspects of
orthography but in an extremely haphazard manner. Examples of other errors appear
below, with the full list displayed in Appendix 5.

7:95
Error type Subtotal (n=48)
Target Response
bone dag (dog)
crab claw Semantic 5
tongue eye
ball cab
chef chark
dice rarrd
gate bickle
road door
skull stuke
soup cad
Unrelated/mixed
45
wolf clart
Table 7:8. Examples of written naming errors for SJS.
Item consistency
The overlap between the two versions of naming was quite low, as was the overlap
between comprehension and each version of naming. Furthermore, there was a large (and
in one case significant) discrepancy between regular and exception words in opposite
directions for each test. This suggests that either there are separate lesions impacting on
each of these tests, there is a common lesion that is affecting his abilities in an
unpredictable fashion (e.g. impaired access to the semantic system), or, if there is a
common lesion, its effects are minimal in comparison to additional lesions affecting each
naming modality independently.
Chance overlap
Actual overlap
Max overlap
Oral naming vs written naming
46.31 49 57
Comprehension vs oral naming
34.69 34 41
Comprehension vs written naming
15.98 16 18
Table 7:9. Item consistency between comprehension and naming for SJS.
There was moderate consistency between reading and each version of naming, though in
each case the overlap was only midway between chance and the maximum overlap and
could reflect common pressures such as frequency. The overlap between reading and
comprehension was below chance, suggesting no relationship between his impairments on
these tasks.

7:96
Chance overlap
Actual overlap
Max overlap
Reading vs oral naming
40.80 50 76
Reading vs written naming
43.10 49 53
Comprehension vs reading
36.90 36 45
Table 7:10. Item consistency between several tests for SJS.
Discussion
SJS performed well on several tests of early lexical processing. In particular, his object
recognition, letter identification and orthographic lexicon all appear to be intact. His
perfect score on word repetition further indicates that his auditory input and phonological
input and output buffers are intact; his relatively poor score on nonword repetition suggests
a mild deficit of the sublexical repetition route (lesion a in Figure 7:1), and further suggests
that his phonological lexicon is probably intact. Since his letter identification process and
phonological output buffer both appear to be intact, his failure to accurately read any
nonwords indicates that the grapheme-phoneme conversion process is almost completely
non-functional (lesion b in the model). Finally, his difficulties on tests of the semantic
system, and relatively consistent scores across the different versions of PPT, suggest
damage to the semantic system. A lesion of the actual semantic module is the favoured
position, which is justified shortly.
The remaining deficits identified for SJS – reading of real words, and oral and written
picture naming – require further analysis. For reading, the semantic route and lexical non-
semantic route must both be severely damaged. Both of these routes include the
orthographic lexicon and the phonological output buffer, both of which seem to be intact.
The deficit could also be explained by a single lesion of the phonological lexicon or its
connection to the phonological output buffer. However, the latter can be discounted on the
basis of the high number of semantic errors on word reading (and oral naming), which
suggests that the representations in the phonological lexicon are consistently failing to be
activated by the semantic system.
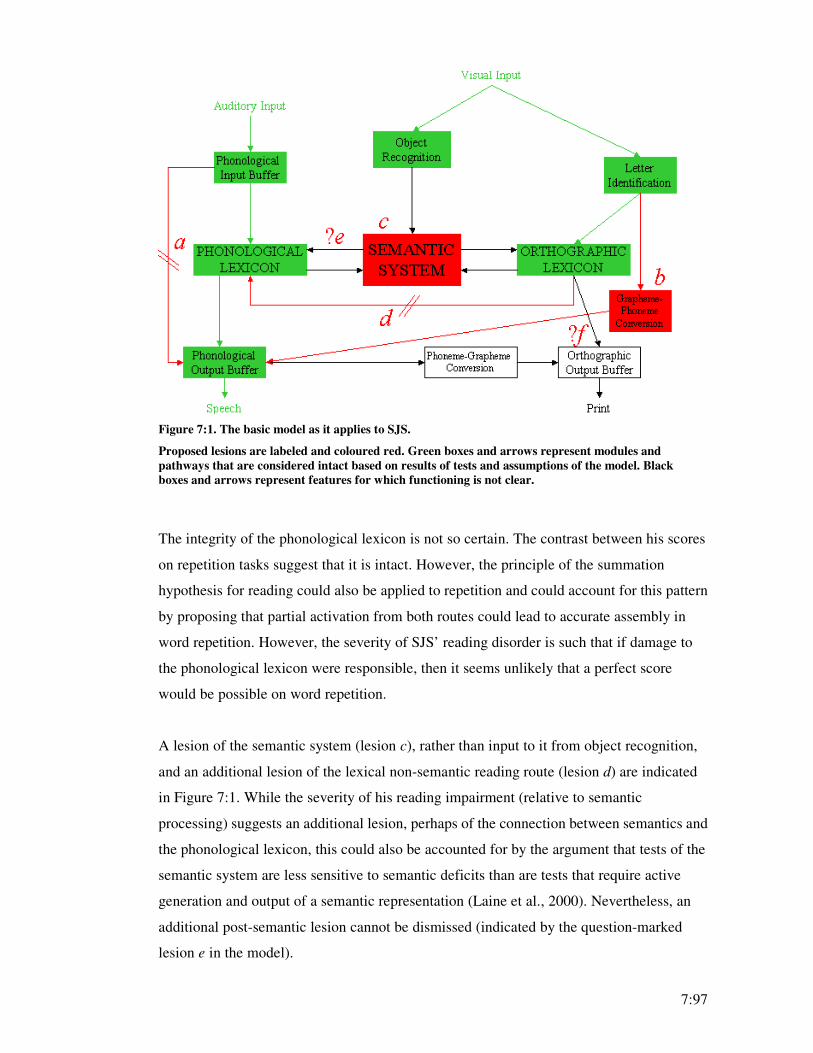
7:97
Figure 7:1. The basic model as it applies to SJS.
Proposed lesions are labeled and coloured red. Green boxes and arrows represent modules and
pathways that are considered intact based on results of tests and assumptions of the model. Black
boxes and arrows represent features for which functioning is not clear.
The integrity of the phonological lexicon is not so certain. The contrast between his scores
on repetition tasks suggest that it is intact. However, the principle of the summation
hypothesis for reading could also be applied to repetition and could account for this pattern
by proposing that partial activation from both routes could lead to accurate assembly in
word repetition. However, the severity of SJS’ reading disorder is such that if damage to
the phonological lexicon were responsible, then it seems unlikely that a perfect score
would be possible on word repetition.
A lesion of the semantic system (lesion c), rather than input to it from object recognition,
and an additional lesion of the lexical non-semantic reading route (lesion d) are indicated
in Figure 7:1. While the severity of his reading impairment (relative to semantic
processing) suggests an additional lesion, perhaps of the connection between semantics and
the phonological lexicon, this could also be accounted for by the argument that tests of the
semantic system are less sensitive to semantic deficits than are tests that require active
generation and output of a semantic representation (Laine et al., 2000). Nevertheless, an
additional post-semantic lesion cannot be dismissed (indicated by the question-marked
lesion e in the model).

7:98
It would be plausible to argue that his compromised semantic system is also responsible for
his difficulties on both naming tests. However, the low overlap between oral and written
naming, and between each of these and the comprehension test, as well as the large
discrepancy in total scores between the naming tests, suggests possible additional lesions.
An additional lesion has already been suggested for oral naming. However, the locus for an
additional lesion impacting on written naming is more obscure due to the severity of the
impairment and the extremely high number of unrelated and indecipherable errors. The
few semantic errors probably reflect his semantic impairment, while his spelling errors
suggest a post-lexical impairment (since the lexical entry seems to have been accurately
selected – rather than an orthographic relative – but cannot activate the appropriate
orthographic coding in the output buffer), as indicated by lesion f in the model. However,
the source of his 45 unrelated errors is not clear. Many of them are probably the combined
result of lesions c and f. However, it seems unlikely that all of these errors are simply
misspelt semantic errors, and some do not even obey the normal rules of English spelling
(e.g. rarrd; dekeey; edde; cuk). Therefore, from the perspective of the basic model, the
extremely high number of indecipherable responses and perseverations in written naming
suggests a complex interaction of at least two lesions, and perhaps more.
In conclusion, SJS presents with a pattern best described as deep dyslexia, including
extremely poor word and nonword reading, with semantic errors on word reading,
impaired semantic processing, and impaired oral and written picture naming. It has been
demonstrated in this chapter that the basic model can account for the variety of lexical
impairments associated with deep dyslexia. On the other hand, it is pertinent to again note
that if deep dyslexia is caused by the combined effect of all of these lesions, then cases
should exist that demonstrate some but not all of the relevant symptoms. Since no such
case has been reported, the preferred explanation remains that of Coltheart (1987) and
Saffran and colleagues (1987): That deep dyslexia is the result of a single, destructive
lesion of the left hemisphere language area, with some or all aspects of processing
compensated for by equivalent areas of the right hemisphere. Therefore, it could be argued
that any cognitive model of language, even those that can account for cases of deep
dyslexia, are perhaps inadequate simply because they are unable to explain why all deep
dyslexics have exactly the same array of impairments.
7:99
Since the interactive functioning of right and left hemisphere language areas is unclear, it
might also be impossible at this stage to fully understand the syndrome from the
perspective of hemispheric lateralization, which could explain some of the variability in
radiological results (e.g. Coltheart, 2000; Laine et al., 2000). It is possible that there are
simply too many variables influencing the specific outcomes of deep dyslexia. For
example, individuals might differ in hemispheric lateralization, the degree of lesion
damage, the specific location of the lesion, and the differences in orthography between the
various languages studied (Laine et al., 2000). Another approach to understanding deep
dyslexia is to consider the symptoms in terms of defective inhibitory mechanism and
interference from competing lexical entries (e.g. Colangelo & Buchanan, 2005, 2006;
Colangelo, Buchanan, & Westbury, 2004; Colangelo, Stephenson, Westbury, & Buchanan,
2003; Katz & Lanzoni, 1997).
The following chapter collates and compares the data presented for the six aphasic
participants.

8:100

8:101
Chapter 8. Collective results for aphasic participants
This chapter collates some of the data collected from the aphasic participants in an attempt
to uncover any common patterns in the results, as well as to compare group results (for the
aphasic participants) to the normal data obtained from the control group. Issues
surrounding some of these patterns are then considered in greater detail in the final chapter.
Collective results
As can be seen in Table 8:1, the aphasic participants all performed better than the mean of
the control group on the object decision task. The significance of this result is that visual
processing is intact for all of the aphasic participants, and therefore difficulties on other
tasks cannot be attributed to a disturbance of visual processing.
Object
decision X-case
matching Lexical
decision Homophone
decision
n 32 26 60 60
MWN 26 26 60 57
RPD 29 26 52 41
DHT 27 26 59 44
DPC 26 26 55 28
JWS 29 25 35 36
SJS 29 26 55 32
Mean of Ps 27.67 25.83 52.67 39.67
Control M 25.93 58.33 55.65
2SD below M 20.62 53.57 48.72
Lowest control 20 53 50
Significance ns
\
0.04 <0.01
Table 8:1. Performance of aphasic participants on tests of input processes.
While most aphasic participants performed reasonably well on lexical decision,
homophone decision proved to be much more challenging, with only MWN performing at
a normal level. Three of the four aphasic participants who were intact for lexical decision
were significantly impaired on homophone decision (DHT, DPC and SJS). This might
reflect the multifaceted nature of homophone decision, which relies on the functioning of
multiple language processes to be performed well and might therefore be more vulnerable
to damage.
One of the most notable findings is the high accuracy of word reading (Table 8:2) relative
to oral naming (Table 8:4). On average, aphasic participants were able to correctly read
almost 20 more items than they could name. Given their good results on the object decision

8:102
task, this indicates that, as expected, oral naming is indeed more vulnerable to damage than
is spoken word reading. This is despite the fact that many of the participants struggled with
nonword reading. Although there is an obvious relationship between reading of words and
nonwords in these results (with a correlation for the aphasic participants of 0.68), even
those participants for whom nonword reading was impossible still managed to achieve
higher scores on word reading than on oral naming (17 higher for DHT and 4 higher for
SJS).
Reading Repetition
Words Nonwords Words Nonwords
n 80 24 80 24
MWN 79 22 80 22
RPD 78 7 79 17
DHT 60 0 66 15
DPC 75 5 66 14
JWS 77 13 71 13
SJS 36 0 80 16
Mean of Ps 67.50 7.83 73.67 16.17
Control M 79.87 22.94 79.2 21.73
2SD below M 79.16 20.57 77.04 15.42
Lowest control 79 21 77 13
Significance <0.01 <0.01 <0.01 ns
Table 8:2. Performance of aphasic participants on reading and repetition tests.
The generally high levels of accuracy in the word-reading task suggest that the task might
not have been challenging enough, and might therefore be masking minor reading
impairments. Furthermore, the low number of errors for most participants made it difficult
to detect any possible regularity effects (see Table 8:6 and Chapter 9 for further discussion
of this topic).
On repetition tasks, three participants, MWN, RPD and SJS, all performed well (1 error or
less) on word repetition. On the other hand, results for nonword repetition were much
worse, with only MWN achieving a high score. In particular, JWS and DPC achieved less
than 60% accuracy on nonword reading, while RPD, SJS and DHT all achieved 63-71%.
However, considering the wide range of performances by controls (54-100%), it is very
difficult to argue that this constitutes a deficit for these participants. It would seem that the
most likely explanation for this is that nonword repetition is extremely sensitive to mild
hearing loss, which is relative common in this age group. In contrast to word repetition, in
which items activate whole entries in the lexicon (and in this case, items that have already
been presented to the participants on four previous occasions, and are probably still primed

8:103
from the written naming task just minutes earlier), the ability to perform nonword
repetition relies on an individual being able to detect variations between different
phonemes, which may differ by a characteristic as subtle as voicing.
For semantic tests, it was necessary for the purpose of this project to make the assumption
that a normal performance on both the comprehension test and on PPT was indicative of an
intact semantic system, though it is possible that the sensitivity of these tests is not high
enough to detect a relatively minor impairment that may nevertheless impact on other tests,
particularly picture naming. The only participant for which this could have been an issue
was MWN, who made no errors on the comprehension test and very few on PPT. All other
participants made 3 or more errors on the comprehension test (compared to a maximum of
1 error from controls) suggesting, at the least, a mild semantic deficit.
Comprehension
Test PPT mean score
n 80 52
MWN 80 50.33
RPD 77 48.00
DHT 77 51.00
DPC 75 47.00
JWS 72 46.33
SJS 71 44.00
Mean of Ps 75.33 47.78
Control M 79.73 50.44
2SD below M 78.82 47.60
Lowest control 79.00 46.33
Significance <0.01 <0.05
Table 8:3. Performance of aphasic participants on semantic tests.
An unusual pattern emerged in the comparison between the comprehension test and PPT.
Many of the aphasic participants achieved good scores on the latter (relative to the control
group) yet made several errors on the former. Collectively, the mean of the participants
was well within the range of the controls on PPT, but well outside the range on the
comprehension test. Despite the intuitive ease of the comprehension test, these results
suggest that it might actually be more sensitive to semantic impairments than the PPT. The
contrast between the comprehension test and PPT is discussed in greater detail in the final
chapter.
In oral naming, the most common error type was semantic errors, with a fairly even spread
of other error types. Semantic errors were also common on written naming, though the

8:104
error means on this test were distorted by the extremely high number of unrelated errors
produced by SJS.
Oral picture naming
Correct Errors
n=80 Delay Phon Morph Sem Circ P/U NR
MWN 64 2 6 1 4 0 0 3
RPD 59 2 0 6 13 0 0 0
DHT 43 3 10 4 8 0 0 12
DPC 48 7 8 3 2 2 1 9
JWS 41 13 2 0 17 3 0 4
SJS 32 0 2 2 18 15 4 7
Mean of Ps 47.83 4.50 4.67 2.67 10.33 3.33 0.83 5.83
Control M 79.00 0.13 0.00 0.00 0.40 0.13 0.33 0.00
2SD below M 77.00 Most control errors
Lowest control 77 1 0 0 2 1 2 0
Significance <0.01
Table 8:4. Performance of aphasic participants on the oral naming tests.
Another notable contrast is that, while the best performance on oral naming was MWN
with 16 errors, two participants, MWN and DHT, actually scored within the range of the
control group on written naming, while a third, RPD, also made less errors on the written
format. Since written naming should be more difficult than oral naming (on average,
controls made approximately 2 errors more on written naming than on oral), these results
suggest that post-semantic damage is largely responsible for the oral naming deficit
demonstrated by at least three of the aphasic participants. This dissociation between the
tasks is most apparent for DHT, who made just 5 errors on written naming but 37 on oral
naming, as well as 20 errors and 14 errors on the reading and repetition tasks respectively.
This was the only case for which a single output function was well preserved despite
considerable deficits on the other three output tasks.
As per the discussion for MWN, the written naming test, by its very nature, lacks
sensitivity. As was evident in the scores for the control group, spelling of some words is
simply a difficult task. The low scores of some control participants therefore meant that
some possible deficits were not clearly identified. Nevertheless, consideration of errors in
these cases did aid interpretation of the results.

8:105
Written picture naming
Correct Errors
n=80 Delay Spell Morph Sem Circ P/U NR
MWN 73 0 1 0 3 0 0 3
RPD 67 0 2 0 7 0 0 4
DHT 75 0 0 0 2 0 0 3
SJS 9 0 8 0 5 0 45 13
Mean of Ps 56.00 0.00 2.75 0.00 4.25 0.00 11.25 5.75
Control M 77.07 0.07 0.53 0.00 0.33 0.00 0.00 0.07
2SD below M 71.80 Most control errors
Lowest control 72.00 2 5 0 2 0 1 1
Significance <0.01
Table 8:5. Performance of aphasic participants on the written naming test (for the four who completed
the test).
In regard to regularity effects, the aphasic participants did not, as a group, differ greatly on
accuracy between the regular words and the exception words for any task. The only task on
which the groups differed by more than an error was the repetition test, which was mostly
due to the results of JWS. For oral naming, SJS and DHT made considerably more errors
on exception words (a difference of 6 and 5 respectively), though this was countered by the
reverse pattern for JWS, with 9 more errors for regular words.
Reading Repetition Comprehension Oral naming Written naming
Reg Ex Reg Ex Reg Ex Reg Ex Reg Ex
n 40 40 40 40 40 40 40 40 40 40
MWN 40 39 40 40 40 40 31 33 36 37
RPD 39 39 39 40 37 40 30 29 34 33
DHT 30 30 34 32 37 40 24 19 39 36
DPC 38 37 34 32 39 36 25 23
JWS 39 38 38 33 37 35 16 25
SJS 18 17 40 40 36 35 19 13 2 7
Mean 34.00 33.33 37.50 36.17 37.67 37.67 24.17 23.67 27.75 28.25
Reg - Ex 0.67 1.33 0.00 0.50 -0.50
Controls 0.13 0.40 -0.27 0.33 1.07
Table 8:6. Comparison of the regular and exception word groups for aphasic participants.
Severity of aphasia and dissociations
Severity
Along with a variety of contrasting patterns of performance, the participants also
demonstrated varying degrees of overall severity, with some obvious examples. MWN was
clearly the least impaired – her performance was normal on all tests except for oral naming

8:106
(and on many tests better than the mean of the control group). Even her score on oral
naming was higher than any other aphasic participant.
Qualitatively, SJS and DPC were much more disabled than the other participants. While
both had reasonably intact comprehension (at the conversational level) both were
extremely impaired in their production of spontaneous speech, and SJS was almost
completely reliant on his communication book to express himself. For DPC, this general
language dysfunction was quite apparent on testing, with scores generally lower than most
other aphasics. While this was generally true of SJS as well, he was one of only two
aphasic participants to perform without error on the word repetition task, a remarkably
preserved function in the context of a wide range of significant language deficits.
The remaining three participants, RPD, DHT and JWS, appeared to be functionally in
between these two extremes. They were still socially active and able to converse, though
quite restricted by the quality of their verbal output. Once again, this functional ability was
reflected in their scores, with all participants demonstrating strengths and weaknesses and
all performing reasonably well on a few tasks.
Dissociations and double dissociations
The importance of double dissociations in cognitive neuropsychological research supports
the need to identify these when they appear. While there were many dissociations revealed
by the results, double dissociations were not so common.
The most apparent dissociations were evident in comparisons between DHT and his fellow
participants. For example, DHT (along with MWN) does well on written naming but
poorly on oral naming. This contrasts best with SJS who, whilst severely impaired on oral
naming, is much more impaired on written naming (this is not a double dissociation since
he was impaired on both and written naming is a more difficult task). Since the participants
were all recruited based on their anomia, a true double dissociation was never possible
between oral and written naming (within this project).
Another dissociation for DHT is between his intact written naming and his poor reading.
Once again, however, there is no clear double dissociation since only MWN performed
within normal limits on reading. The same was true of the comprehension test. Similarly,

8:107
SJS performed the repetition task perfectly, with a poor performance on reading and oral
naming, but a double dissociation does not exist due to the lack of intact results for the
latter two tasks.
Since double dissociations cannot be considered for the comprehension and reading tests,
because only MWN did well on these, nor for the oral naming test since no aphasic
participant did well, then the only remaining comparison (for the unpublished tests) is
between written naming and repetition. Indeed, a double dissociation does exist in these
results, between DHT (intact and impaired, respectively) and SJS (the reverse). This is the
only certain double dissociation in the results of the unpublished tests and, unfortunately,
the least relevant since there is no suggestion that the two processes are in any way related.
However, another comparison between SJS and DHT is much more significant. Both
participants were completely unable to read nonwords, a hallmark of deep dyslexia. While
SJS did indeed present with the characteristics of deep dyslexia, DHT, like Funnell’s case
WB (1983), presented with phonological dyslexia – although his reading of real words was
severely impaired, he did not make any semantic errors. Therefore, DHT provides direct
evidence against one of the crucial predictions of the summation hypothesis, that non-
functional grapheme-phoneme conversion should lead to semantic errors on word reading.
Rather, DHT’s data help to justify the lexical non-semantic route, which is further
supported by the results of MWN and RPD, for whom reading of exception words, despite
impaired oral naming, is best explained by the presence of this route. The pattern of results
for SJS are also compatible with this assertion.

8:108

9:109
Chapter 9. General discussion
The basic model - conclusions
The primary objective of this case series was to assess the practical application of a simple,
easy-to-understand cognitive model of language, the ‘basic model.’ With the exception of
JWS, a late-acquired bilingual, the results of testing do support the usefulness of the basic
model. The basic model was sufficient to account for the data of the remaining
participants, without needing to expand the model by dividing the lexicons into input and
output lexicons. Furthermore, the results of the six participants could not have been
interpreted more clearly within the context of any other model.
For the purpose of research, and in striving towards a more complete understanding of
language processes, cognitive models have become increasingly sophisticated, and will
continue to do so. However, with increased sophistication comes an equivalent increase in
complexity, and many of these models can be quite difficult to apply in clinical settings,
particularly in view of limited time and resources. A simpler model, such as the basic
model applied to this case series, could better enable clinicians to generate and test
hypotheses, and design more appropriate therapeutic intervention, with a smaller battery of
tests selected on the basis of individualised hypotheses.
The following sections elaborate on some of the issues that were raised by the case series,
including the process of reading aloud, the production of semantic naming errors, and
several methodological issues.
Reading aloud
The evidence from this case series supports the inclusion of the lexical non-semantic route
over other accounts of reading, including the summation hypothesis, other dual route
models, and the hypothesis proposed by Orpwood and Warrington (1995). This was best
demonstrated by the results for DHT, whose grapheme-phoneme conversion was
completely non-functional and who showed signs of a semantic deficit, yet read words
aloud without making a single semantic error, a pattern which cannot be explained by the
summation hypothesis, or any other dual route model. While DHT’s results could also be
accounted for by Orpwood and Warrington, the patterns of results for MWN and RPD are
best explained by the lexical non-semantic route.

9:110
However, the results did not reveal any definitive evidence to either support or refute the
hypothesis proposed initially by Orpwood and Warrington (1995). The reason for this lack
of evidence is twofold. Firstly, reading performances for most of the aphasic participants
was too close to ceiling. Secondly, for the aphasic participants that were assessed, the
evidence that was found could easily be argued to support either position. In fact, it seems
a rare event for convincing evidence to surface that can distinguish any one cognitive
model of language from another. The conclusive argument for or against most models is
based largely on the anticipation of identifying an ideal aphasic participant that has exactly
the right pattern of deficits and intact components.
For the Orpwood and Warrington hypothesis, clear support would be in the form of a
participant for whom word reading is more severely impaired than oral naming for the
same set of items (with intact lexical decision to confirm that orthographic input is intact).
Alternatively, a participant would need to be identified as having intact reading yet
sustained damage to the lexical representations for oral naming. To demonstrate that
representations in the phonological (output) lexicon were impaired, repeat administration
of the oral naming test plus complex calculations for item consistency would need to
demonstrate that the representations are consistently unavailable and that the consistency
demonstrated cannot be ascribed to the effects of linguistic complexity, word frequency or
imageability. Intact exception word reading would then support the hypothesis, though if
grapheme-phoneme conversion was at least partly functional, the summation hypothesis
would also be adequate. On the other hand, impaired reading of exception words with
consistency of oral naming errors, and consistency between reading of exception words
and oral naming of the pictures representing these words, would strongly refute the
hypothesis.
Semantic errors on oral naming
For three participants, MWN, RPD and DHT, evidence was found for the concept that
semantic errors in naming can result from damage to post-semantic processing. This
contrasts with some models of processing, such as discrete models (e.g. Levelt et al.,
1991), which assume that the information flow in the lexical-semantic system is serial (i.e.
there is no feedback) and discrete (i.e. at the semantic stage of processing there is only
semantic activity; during phonological encoding there is only phonological activity).
Therefore, the model does not have the capacity to explain semantic errors (beyond
chance) that are caused by post-semantic lesions. However, there is a substantial number of
authors who have claimed that their participants provide clear evidence against this

9:111
position (e.g. Antonucci, 2006; Beaton et al., 1997; Caramazza & Hillis, 1990; Gainotti,
Silveri, Villa, & Miceli, 1986; Laine & Martin, 1996; Laine, Niemi, Niemi, & Koivuselka-
Sallinen, 1990; Lambon Ralph, 1998; Lambon Ralph et al., 2000; Miceli et al., 1996;
Miceli et al., 1994; Miceli et al., 1991; Raymer et al., 2000).
For example, Caramazza and Hillis (1990) present RGB and HW, who produce semantic
errors on all tasks involving oral output except for repetition. However, they produce no
semantic errors in comprehension or in written output. In arguing their case for post-
semantic damage, they discuss the logogen theory, which holds that the target semantic
representation will activate all entries in the phonological (output) lexicon that are
semantically related to it, with varying degrees of activation depending on the degree of
relatedness.
In presenting case IL, Laine and Martin (1996) argue that her anomia is the result of
reduced activation of the phonological lexicon from the semantic system, which can be
accounted for by an interactive activation model (a non-discrete model). Within this model,
all semantically related words activate their relevant phonological representations to some
extent. However, with weakened connections between semantics and phonology, the
phonological nodes can only be activated to a limited degree. Representations are not lost
from the phonological lexicon, but instead have a reduced probability of accurate retrieval
and phonological activation becomes more vulnerable to the effects of random variation.
It should be pointed out that there is no suggestion that semantic errors are only caused by
post-semantic impairments. Indeed, poor performance on the comprehension test was
strongly associated with increased semantic errors on oral naming for the aphasic
participants (r(4) = 0.74, p < 0.05). This is in accordance with Gainotti, Silveri, Villa and
Miceli (1986) who found that participants with greater comprehension deficits produce
more semantic errors in naming. However, they also found that in their group of five
participants without comprehension deficits, all but one still produced semantic errors. In
fact, it is quite possible that the increase of semantic errors associated with more severe
comprehension deficits is simply an artefact of the increase in total errors on oral naming.
In fact, there was a significant correlation between comprehension test errors and total
errors on oral naming, (r(4) = 0.85, p = 0.02). Furthermore, controlling for this variable by
considering semantic errors on oral naming as a proportion of total errors reduces the
correlation between comprehension test errors and semantic errors to almost zero (r(4) =

9:112
0.09, p = 0.43). This suggests that although semantic errors are positively associated with
semantic deficits, it is perhaps only because increased semantic deficits lead to an increase
of all errors, in keeping with previous views that an increase in semantic errors should, in
many cases, be considered the result of chance (Caramazza & Hillis, 1990; Ellis &
Marshall, 1978).
In addition to cases for which obvious semantic impairments are identified, it is also
common for semantic errors on oral naming to reflect mild damage to the semantic system,
in cases in which the comprehension tests employed are not sensitive enough to detect
these mild impairments. Lambon Ralph and colleagues (2000) argue that receptive
comprehension tasks are less sensitive to semantic defects than are expressive tasks. One
explanation for this phenomenon is that degraded semantic representations might be
sufficiently activated to respond to word-picture matching tasks but not sufficient to
activate the entire vocabulary (Lambon Ralph et al., 1999). For example, Laine and
colleagues (1992) investigated the comprehension deficits of two brain injured
participants. Although they both achieved ceiling on word-picture matching and
classification tasks, they were outside the normal range when asked to indicate a semantic
feature for pictures they had been unable to name. Others have made similar claims that
accurate performance on word-picture matching tasks does not require a fully intact
semantic system (e.g. Howard, Patterson, Franklin, Orchard-Lisle, & Morton, 1985).
According to Lambon Ralph and colleagues, assessment of the semantic system should
include a broad range of comprehension tasks that demand precise understanding of
infrequent concrete and abstract words (2000).
If the method of eliminating semantic deficits as cause of deficits is inadequate, then it may
be possible that the semantic errors are in fact caused by a semantic impairment that is too
subtle to detect on testing. In response to this argument, some authors report participants
who demonstrated intact comprehension even on sensitive measures of the semantic
system. For example, Orpwood and Warrington’s (1995) examination of MRF involved
presenting him with a written word and asking him to define or describe the word, which
could be done through verbalisation, drawing and/or mime. He was found to be very
successful at this task, with a naïve examiner correctly identifying 59/60 of the nouns and
57/60 of the verbs. The authors claim that semantic errors produced by MRF were
therefore the result of damage to output word forms. In situations where the target word

9:113
form is inaccessible, the intact semantic entry might maximally activate a semantically
related word form.
Other aphasic individuals, such as GM and JS (Lambon Ralph et al., 2000), also made
semantic errors on oral naming despite an extensive semantic examination. Another case is
MOS (Lambon Ralph et al., 1999), who was not found to have a measurable deficit on
either comprehension or reading despite a detailed assessment using concrete and abstract
words, yet still produced errors of which more than 25% were semantic relatives. For all
three cases, the authors conclude a breakdown between semantics and phonological
representations (both of which were themselves intact).
Results for MWN, RPD and DHT all provide support for the concept that semantic errors
can occur on oral naming following post-semantic lesions, though in each case it was clear
that this argument could be refuted. For all three participants a semantic impairment is
likely. For RPD and DHT, the claim is also supported by the higher rate of semantic errors
on oral naming than on written naming, though it is quite possible that semantic
impairments are simply expressed differently in each naming task.
Therefore, the overall pattern of these cases might be more in keeping with the view that
semantic errors usually represent mild semantic deficits that are undetected by standard
semantic testing due to the lack of sensitivity of receptive tests. In hindsight, it seems
apparent that a greater depth of semantic testing would have alleviated this problem,
perhaps by replacing PPT with semantic tests of varying difficulty and including a timed
component and both receptive and expressive tasks.
Comments on methodological issues
Results of the unimpaired control group raised concerns about the interpretation of certain
tests in clinical practice. First, the average result of PPT was lower than that originally
reported for English controls (Howard & Patterson, 1992). The authors of the test indicate
that their original sample of controls made no more than three errors on either occasion
that they were tested. From this perspective, one in four of the Australian-educated
controls who took part in this project would have been classified as borderline impaired or
worse. This is of some concern, and suggests the need for a more comprehensive sample of
controls for use in clinical settings in Australia, and perhaps exploring the possibility that

9:114
patients from other cultural backgrounds are even more disadvantaged by this possible
cultural bias.
Second, use of the BORB object recognition test revealed what should be considered an
unacceptably wide range and high standard deviation. Observations of testing, including
comments from the control participants, leads to the suggestion that practice and coaching
on this test could reduce the wide performance variability of this test, thereby improving
reliability and, hopefully, sensitivity.
It also became clear that nonword repetition is extremely sensitive to mild hearing loss, an
observation which must be taken into account when working with older individuals that
may have an unidentified impairment. Audiological examination would be extremely
helpful, both clinically and in research, though patterns of cases presented in this report
were mostly interpreted on the basis of the relationship between word and nonword
repetition. Written naming was also lacking sensitivity, though this is an inevitable effect
of the difficulties that many normal individuals have with spelling.
In hindsight, writing words and nonwords to dictation could have provided valuable
(though not really vital) information for some of the cases. However, dictation was not
included because it did not in any way relate to the original research question, and was
considered superfluous in an already lengthy battery of tests. Another methodological
decision made on the basis of time constraints was to administer word repetition shortly
after written naming, which might have boosted results on the repetition test. Admittedly,
some of the published tests could have been used to separate these tests, though it was
thought that the time taken for written naming meant that this final session was already
quite long. Also, repeat administration of certain tests could have provided valuable
information about a) items consistency, and whether impaired performances reflected
damage to representations or impaired access to those representations, and b) test-retest
consistency to examine fluctuations in test results. Finally, since semantic impairments for
several of the participants were ascribed to slowed semantic processing, additional testing
of processing speed, attention and concentration, and working memory might have
contributed by establishing whether their slowed processing was a problem specific to the
semantic system or a more global pattern of impairment. Better control over temporal
effects (both response time and time between items) could also have provided valuable
information.

9:115
Finally, it has already been established that the items used for the unpublished tests were
probably too familiar and linguistically simple. The items were chosen with the intention
that if unimpaired controls could perform with a high level of accuracy (e.g. upwards of
95%) then even a few errors by aphasic participants would indicate impairment. However,
the stimuli chosen were so easily named and read that most of the aphasic participants also
performed quite well, particularly on the reading test, reducing any regularity effects that
might have been demonstrated on more difficult reading tests. Therefore, hypotheses about
reading patterns and other contrasts could not be properly examined (e.g. Orpwood and
Warrington’s hypothesis). Furthermore, having control scores that were so close to ceiling
reduced the ability to test significant differences between tests relative to the control group
due to the extremely small standard deviations. Therefore, it became clear in hindsight that
word-picture items selected to distinguish between different models and hypotheses
probably need to be chosen on the basis that few unimpaired participants will actually
reach ceiling. This would also enable better discrimination between tests by validating use
of more appropriate statistical measures, such as the Bayesian approach (Crawford &
Garthwaite, 2007). On the other hand, this would perhaps further reduce the sensitivity of
written naming by increasing the level of difficulty for some control participants more than
others, and this would obviously need to be taken into consideration.
In sum, a number of methodological issues became apparent during the course of this
research, most of which related to the design of test materials and to problems with certain
published tests. However, most of these would have been difficult to predict and, even if
they were expected, equally difficult to control. Furthermore, it is argued that the results
gleaned from this research have provided valuable insights into the cognitive architecture
of language processing, and that resolution of some or all of these methodological issues
would further aid our ability to represent language using cognitive models.

116

117
References
Alario, F., Schiller, N. O., Domoto-Reilly, K., & Caramazza, A. (2003). The role of
phonological and orthographic information in lexical selection. Brain and
Language, 84(3), 372-398.
Allport, D. A. (1984). Speech production and comprehension: One lexicon or two. In W.
Prinz & A. F. Sanders (Eds.), Cognition and motor processes (pp. 209-228). Berlin:
Springer-Verlag.
Allport, D. A., & Funnell, E. (1981). Components of the mental lexicon. Philosophical
Transactions of the Royal Society of London, 295(1077, 397-410.
Antonucci, S. M. (2006). The role of the left temporal lobe in naming and semantic
knowledge. Antonucci, Sharon Mary: U Arizona, US.
Baayen, R. H., Piepenbrock, R., & Van Rijn, H. (1993). The CELEX lexical database (CD-
ROM). Philadelphia: Linguistic Data Consortium, University of Pensylvania.
Beaton, A., Guest, J., & Ved, R. (1997). Semantic errors of naming, reading, writing, and
drawing following left-hemisphere infarction. Cognitive Neuropsychology, 14(3),
459-478.
Birdsong, D. (Ed.). (1999). Second Language Acquisition and the Critical Period
Hypothesis. Mahwah, NJ: Lawrence Erlbaum Associates.
Breen, K., & Warrington, E. K. (1995). Impaired naming and preserved reading: A
complete dissociation. Cortex, 31(3), 583-588.
Calvert, G. A., Brammer, M. J., Morris, R. G., Williams, S. C. R., King, N., & Matthews,
P. M. (2000). Using fMRI to Study Recovery from Acquired Dysphasia*1. Brain
and Language, 71(3), 391-399.
Caramazza, A., & Hillis, A. E. (1990). Where do semantic errors come from? Cortex, 26,
95-122.
Colangelo, A., & Buchanan, L. (2005). Semantic ambiguity and the failure of inhibition
hypothesis as an explanation for reading errors in deep dyslexia. Brain and
Cognition Vol 57(1) Feb 2005, 39-42.
Colangelo, A., & Buchanan, L. (2006). Implicit and explicit processing in deep dyslexia:
Semantic blocking as a test for failure of inhibition in the phonological output
lexicon. Brain and Language Vol 99(3) Dec 2006, 258-271.
Colangelo, A., Buchanan, L., & Westbury, C. (2004). Deep dyslexia and semantic errors:
A test of the failure of inhibition hypothesis using a semantic blocking paradigm.
Brain and Cognition Vol 54(3) Apr 2004, 232-234.
Colangelo, A., Stephenson, K., Westbury, C., & Buchanan, L. (2003). Word associations
in deep dyslexia. Brain and Cognition Vol 53(2) Nov 2003, 166-170.
Coltheart, M. (1987). Deep dyslexia: A review of the syndrome. In M. Coltheart, K.
Patterson & J. C. Marshall (Eds.), Deep Dyslexia (second ed.). London: Routledge.
Coltheart, M. (2000). Deep dyslexia is right-hemisphere reading. Brain and Language Vol
71(2) Feb 2000, 299-309.
Crawford, J. R., & Garthwaite, P. H. (2007). Comparison of a single case to a control or
normative sample in neuropsychology: Development of a Bayesian approach.
Cognitive Neuropsychology Vol 24(4) 2007, 343-372.
Crutch, S. J., & Warrington, E. K. (2001). Refractory dyslexia: Evidence of multiple task-
specific phonological output stores. Brain, 124, 1533-1543.
Crutch, S. J., & Warrington, E. K. (2003). The organisation of semantic memory: Evidence
from semantic refractory access dysphasia. Brain and Language, 87(1), 81-82.
Crutch, S. J., & Warrington, E. K. (2005). Gradients of semantic relatedness and their
contrasting explanations in refractory access and storage semantic impairments.
Cognitive Neuropsychology, 22(7), 851-876.

118
Ellis, A. W., & Marshall, J. C. (1978). Semantic errors or statistical flukes? A note on
Allport's "On knowing the meaning of words we are unable to report." The
Quarterly Journal of Experimental Psychology Vol 30(3) Aug 1978, 569-575.
Funnell, E. (1983). Phonological processes in reading: New evidence from acquired
dyslexia. British Journal of Psychology, 74(2), 159.
Gainotti, G., Silveri, M. C., Villa, G., & Miceli, G. (1986). Anomia with and without
lexical comprehension disorders. Brain and Language Vol 29(1) Sep 1986, 18-33.
Garman, M. (1990). Psycholinguistics. Cambridge: Cambridge University Press.
Garrett, M. (1992). Disorders of lexical selection. Cognition Vol 42(1-3) Mar 1992, 143-
180.
Goldblum, M. C. (1985). Word production in surface dyslexia. In K. Patterson, M.
Coltheart & J. C. Marshall (Eds.), Surface Dyslexia. London: Erlbaum.
Goodglass, H. (1983). Linguistic aspects of aphasia. Trends in Neurosciences, 6(6), 241-
243.
Hemera. (1997-2000). Photo Objects 50,000. Premium Image Collection. Quebec: Hull-
Quebec.
Hillis, A. E., & Caramazza, A. (1991). Mechanisms for accessing lexical representations
for output: evidence from a category-specific semantic deficit. Brain & Language,
40(1), 106-144.
Hillis, A. E., Rapp, B. C., & Caramazza, A. (1999). When a rose is a rose in speech but a
tulip in writing. Cortex, 35(3), 337-356.
Howard, D. (1985). The semantic organisation of the lexicon; evidence from aphasia.
Unpublished PhD thesis, University of London.
Howard, D. (1995). Lexical anomia: Or the case of the missing lexical entry. The
Quarterly Journal of Experimental Psychology A: Human Experimental
Psychology, 48A(4), 999.
Howard, D., & Franklin, S. (1988). Missing the meaning?: A cognitive neuropsychological
study of the processing of words by an aphasic patient. (1988). Missing the
meaning?: A cognitive neuropsychological study of the processing of words by an
aphasic patient.
Howard, D., & Patterson, K. (1992). Pyramids and Palm Trees. Bury, St Edmunds, UK:
Thames Valley Test Company.
Howard, D., Patterson, K., Franklin, S., Orchard-Lisle, V., & Morton, J. (1985). The
facilitation of picture naming in aphasia. Cognitive Neuropsychology Vol 2(1) Feb
1985, 49-80.
Hull, R., & Vaid, J. (2007). Bilingual language lateralization: A meta-analytic tale of two
hemispheres. Neuropsychologia Vol 45(9) 2007, 1987-2008.
Jackson, N. E., & Coltheart, M. (2001). Routes to reading success and failure: Toward an
integrated cognitive psychology of atypical reading. (2001). Routes to reading
success and failure: Toward an integrated cognitive psychology of atypical reading.
Jiang, J. J., & Conrath, D. W. (1997). Semantic similarity based on corpus statistics and
lexical taxonomy. Paper presented at the 5th International Conference, Research on
Computational Linguistics, Taiwan.
Katz, R. B., & Lanzoni, S. M. (1997). Activation of the phonological lexicon for reading
and object naming in deep dyslexia. Brain and Language, 58, 46-60.
Kay, J., Lesser, R., & Coltheart, M. (1992). Psycholinguistic Assessment of Language
Processing in Aphasia (PALPA). Hove, UK: Lawrence Erlbaum Associates Ltd.
Laine, M., Kujala, P., Niemi, J., & Uusipaikka, E. (1992). On the nature of naming
difficulties in aphasia. Cortex Vol 28(4) Dec 1992, 537-554.
Laine, M., & Martin, N. (1996). Lexical Retrieval Deficit in Picture Naming: Implications
for Word Production Models. Brain and Language, 53(3), 283-314.

119
Laine, M., Niemi, P., Niemi, J., & Koivuselka-Sallinen, P. (1990). Semantic errors in a
deep dyslexic. Brain and Language Vol 38(2) Feb 1990, 207-214.
Laine, M., Salmelin, R., Helenius, P., & Marttila, R. (2000). Brain activation during
reading in deep dyslexia: An MEG study. Journal of Cognitive Neuroscience Vol
12(4) Jul 2000, 622-634.
Lambon Ralph, M. A. (1998). Distributed versus localist representations: Evidence from a
study of item consistency in a case of classical anomia. Brain and Language, 64,
339-360.
Lambon Ralph, M. A., Cipolotti, L., & Patterson, K. (1999). Oral naming and oral reading:
Do they speak the same language. Cognitive Neuropsychology, 16(2), 157-169.
Lambon Ralph, M. A., Sage, K., & Roberts, J. (2000). Classical anomia: A
neuropsychological perspective on speech production. Neuropsychologia, 38, 186-
202.
Lenneberg, E. H. (1967). Biological Foundations of Language. New York: Wiley.
Levelt, W. J., Schriefers, H., Vorberg, D., Meyer, A. S., Pechmann, T., & Havinga, J.
(1991). The time course of lexical access in speech production: A study of picture
naming. Psychological Review Vol 98(1) Jan 1991, 122-142.
Maki, W. S., McKinley, L. N., & Thompson, A. G. (2004). Semantic distance norms
computed from an electronic dictionary (WordNet). Behavior Research Methods,
Instruments & Computers, 36(3), 421-431.
Marian, V. (2000). Bilingual language processing: Evidence from eye-tracking and
functional neuroimaging. Dissertation Abstracts International: Section B: The
Sciences and Engineering, 61(5-B), pp.
Marian, V., Spivey, M., & Hirsch, J. (2003). Shared and separate systems in bilingual
language processing: Converging evidence from eyetracking and brain imaging.
Brain and Language Vol 86(1) Jul 2003, 70-82.
Martin, N., & Saffran, E. M. (2002). The relationship of input and output phonological
processing: An evaluation of models and evidence to support them. Aphasiology
Vol 16(1-2) Jan-Feb 2002, 107-150.
Miceli, G., Amitrano, A., Capasso, R., & Caramazza, A. (1996). The treatment of anomia
resulting from output lexical damage: Analysis of two cases. Brain & Language,
52(1), 150-174.
Miceli, G., Capasso, R., & Caramazza, A. (1994). The interaction of lexical and sublexical
processes in reading, writing and repetition. Neuropsychologia, 32(3), 317-333.
Miceli, G., Capasso, R., & Caramazza, A. (1999). Sublexical conversion procedures and
the interaction of phonological and orthographic lexical forms. Cognitive
Neuropsychology Vol 16(6) Sep 1999, 557-572.
Miceli, G., Giustolisi, L., & Caramazza, A. (1991). The interaction of lexical and non-
lexical processing mechanisms: Evidence from anomia. Cortex, 27(1), 57-80.
Morton, J., & Patterson, K. (1987). A new attempt at an interpretation, or, an attempt at a
new interpretation. In M. Coltheart, K. Patterson & J. C. Marshall (Eds.), Deep
Dyslexia (2 ed.). London: Routledge.
Newcombe, F., & Marshall, J. C. (1980). Transcoding and lexical stabilization in deep
dyslexia. In M. Coltheart, K. Patterson & J. C. Marshall (Eds.), Deep Dyslexia.
London: Routledge & Kegan Paul.
Nickels, L. (2000). A sketch of the cognitive processes involved in the comprehension and
production of single words. Retrieved on 23/6/2007 from
http://www.maccs.mq.edu.au/~lyndsey/model.doc.
Nolan, K. A., & Caramazza, A. (1982). Modality-independent impairments in word
processing in a deep dyslexic patient. Brain and Language, 16(237-264).
Orpwood, L., & Warrington, E. K. (1995). Word specific impairments in naming and
spelling but not reading. Cortex, 31(2), 239-265.
120
Paradis, M. (2000). Generalizable outcomes of bilingual aphasia research. Folia
Phoniatrica Logopaedica, 52(54), 64.
Patterson, K., Marshall, J. C., & Coltheart, M. (Eds.). (1985). Surface Dyslexia: Cognitive
and Neuropsychological Studies of Phonological Reading. London: Lawrence
Erlbaum Associates.
Plaut, D. C., McClelland, J. L., Seidenberg, M. S., & Patterson, K. (1996). Understanding
normal and impaired word reading: Computational principles in quasi-regular
domains. Psychological Review, 103, 56-115.
Plaut, D. C., & Shallice, T. (1993). Deep dyslexia: A case study of connectionist
neuropsychology. Cognitive Neuropsychology, 10(377-500).
Price, C. J., Howard, D., Patterson, K., Warburton, E., Friston, K., & Frackowiak, R.
(1998). A functional neuroimaging description of two deep dyslexic patients.
Journal of Cognitive Neuroscience Vol 10(3) May 1998, 303-315.
Rastle, K., & Coltheart, M. (1999). Lexical reading and nonlexical phonological priming in
reading aloud. Journal of Experimental Psychology: Human Perception and
Performance, 25(2), 461-481.
Raymer, A. M., Foundas, A. L., Maher, L. M., Greenwald, M. L., Morris, M., Rothi, L. J.,
et al. (1997). Cognitive neuropsychological analysis and neuroanatomic corrlates in
a case of acute anomia. Brain and Language, 58, 137-156.
Raymer, A. M., Maher, L. M., Foundas, A. L., Rothi, L. J., & Heilman, K. M. (2000).
Analysis of lexical recovery in an individual with acute anomia. Aphasiology Vol
14(9) Sep 2000, 901-910.
Riddoch, M. J., & Humphreys, G. W. (1993). Birmingham object recognition battery
(BORB). London: Lawrence Erlbaum Associates.
Rothi, L. J. G., Raymer, A. M., Maher, L. M., Greenwald, M. L., & Morris, M. (1991).
Assessment of naming failures in neurological communication disorders. Clinical
Communication Disorders, 1, 7-20.
Saffran, E., Bogyo, L. C., Schwartz, M. F., & Marin, O. S. M. (1987). Does deep dyslexia
reflect right-hemisphere reading? In M. Coltheart, K. Patterson & J. C. Marshall
(Eds.), Deep Dyslexia (2 ed.). London: Routledge.
Schweiger, A., Zaidel, E., Field, T., & Dobkin, B. (1989). Right hemispher contribution to
lexical access in an aphasic with deep dyslexia. Brain and Language, 37, 73-89.
Shallice, T., McLeod, P., & Lewis, K. (1985). Isolating cognitive modules with the dual-
task paradigm: Are speech perception and prodution separate processes. Quarterly
Journal of Experimental Psychology, , 37A, 507-532.
Southwood, M. H., & Chatterjee, A. (1999). Simultaneous Activation of Reading
Mechanisms: Evidence from a Case of Deep Dyslexia,. Brain and Language, 67(1),
1-29.
Southwood, M. H., & Chatterjee, A. (2000). The Interaction of Multiple Routes in Oral
Reading: Evidence from Dissociations in Naming and Oral Reading in
Phonological Dyslexia. Brain and Language, 72(1), 14-39.
Southwood, M. H., & Chatterjee, A. (2001). The Simultaneous Activation Hypothesis:
Explaining Recovery from Deep to Phonological Dyslexia. Brain and Language,
76(1), 18-34.
Weber-Fox, C. M., & Neville, H. J. (1999). Functional neural subsystems are differentially
affected by delays in second language immersion: ERP and behavioral evidence in
bilinguals. In D. Birdsong (Ed.), Second Language Acquisition and the Critical
Period Hypothesis (pp. 23-38). Mahwah, NJ: Lawrence Erlbaum Associates.
Weekes, B., Coltheart, M., & Gordon, E. (1997). Deep dyslexia and right hemisphere
reading--a regional cerebral blood flow study. Aphasiology Vol 11(12) Dec 1997,
1139-1158.

121
Weekes, B., & Robinson, G. (1997). Semantic anomia without surface dyslexia.
Aphasiology, 11(8), 813-825.
Weigel-Crump, C., & Koenigsknecht, R. A. (1973). Tapping the lexical store of the
adult aphasic: Analysis of the improvement made in word retrieval skills. . Cortex, 9, 411-
418.

122

123
Appendices
Appendix 1. Materials
Appendix 1:a. Full list of test items including details of matching. ........................... 124
Appendix 1:b. Results of item matching..................................................................... 126
Appendix 1:c. Classification of items: Natural vs manmade. .................................... 127
Appendix 1:d. Classification for natural, manmade or 'unclear.' ............................. 127
Appendix 1:e. Design of the comprehension test. ....................................................... 128
Appendix 1:f. Matching of regular/exception groups for semantic test. ................... 129
Appendix 1:g. Comprehension test - distractors and relatedness figures. ................ 130
Appendix 2. Analyses
Appendix 2:a. Calculation of chance overlap in item consistency. ............................ 132
Appendix 2:b. Examples of overlap calculation and interpretation.......................... 132
Appendix 3. Control group results
Appendix 3:a. Acceptable variations and queried responses..................................... 133
Appendix 3:b. Control group performance on lexical decision ................................. 133
Appendix 3:c. Control group performance on BORP ............................................... 133
Appendix 3:d. Control group performance on homophone decision ........................ 134
Appendix 3:e. Controls: Natural/manmade contrast on oral naming....................... 134
Appendix 4. Nonword reading
Appendix 4:a. Nonword reading stimuli and participant responses. ........................ 135
Appendix 5. Error analysis for aphasic participants
Appendix 5:a. MWN: Full list of errors on unpublished tests................................... 137
Appendix 5:b. RPD: Full list of errors on unpublished tests. .................................... 139
Appendix 5:c. DHT: Full list of errors on unpublished tests. .................................... 141
Appendix 5:d. DPC: Full list of errors on unpublished tests. .................................... 143
Appendix 5:e. JWS: Full list of errors on unpublished tests. .................................... 145
Appendix 5:f. SJS: Full list of errors on unpublished tests....................................... 147
Appendix 5:g. Lexical decision – aphasic errors. ....................................................... 149
Appendix 5:h. Homophone decision – aphasic errors................................................ 149
Appendix 5:i. Object decision – aphasic errors.......................................................... 149

124
Appendix 1. Materials
Appendix 1:a. Full list of test items including details of matching.
Animate = natural (1), manmade (2) or unclear (3)
Regular words Exception words
ITEM
Lett
ers
Ph
on
em
es
Sp
ok
en
fr
eq
ue
nc
y
Wri
tten
fr
eq
ue
nc
y
An
ima
te
ITEM
Lett
ers
Ph
on
em
es
Sp
ok
en
fr
eq
ue
nc
y
Wri
tten
fr
eq
ue
nc
y
An
ima
te
bee 3 2 117 1 1 axe 3 3 120 7 3
beer 4 2 657 175 2 ball 4 3 1610 54 3
belt 4 4 375 5 3 bath 4 3 751 65 3
bib 3 3 30 2 3 bear 4 2 1100 12 1
bone 4 3 451 27 2 blinds 6 6 64 3 3
brain 5 4 1174 40 2 book 4 3 4256 676 3
brick 5 4 483 15 3 bowl 4 3 498 27 3
cake 4 3 367 16 2 bread 5 4 1215 112 2
cat 3 3 707 32 1 chalk 5 3 167 8 3
cloud 5 4 503 57 2 cheese 6 3 488 9 2
clown 5 4 56 2 2 chef 4 3 47 1 2
cork 4 3 67 3 3 comb 4 3 99 1 3
crab 4 4 79 2 1 crow 4 3 52 2 1
desk 4 4 1438 35 3 eye 3 1 2184 100 2
dice 4 3 42 0 3 flask 5 5 75 1 3
dog 3 3 1229 56 1 foot 4 3 1704 93 2
door 4 2 5780 111 3 ghost 5 4 327 24 2
drum 4 4 141 9 2 glass 5 4 2192 54 3
duck 4 3 168 6 1 glove 5 4 80 2 3
egg 3 2 633 28 2 hook 4 3 549 2 3

125
Test items continued
Regular words Exception words
ITEM
Lett
ers
Ph
on
em
es
Sp
ok
en
fr
eq
uen
cy
Wri
tten
fr
eq
uen
cy
An
imate
ITEM
Lett
ers
Ph
on
em
es
Sp
ok
en
fr
eq
uen
cy
Wri
tten
fr
eq
uen
cy
An
imate
flag 4 4 326 30 3 hose 4 3 65 1 3
fork 4 3 243 0 3 key 3 2 1250 31 3
frog 4 4 68 6 1 mast 4 4 45 1 3
gate 4 3 856 22 3 nose 4 3 1266 41 2
goat 4 3 199 10 1 pear 4 2 44 0 1
ice 3 2 914 20 2 salt 4 4 709 33 2
kite 4 3 52 2 3 screw 5 4 224 2 3
noose 5 3 26 0 3 scroll 6 5 54 2 3
plane 5 4 774 41 3 shield 6 4 151 6 3
plug 4 4 129 3 3 shoe 4 2 249 4 3
prawn 5 4 18 2 1 ski 3 3 106 4 3
road 4 3 3537 254 2 soup 4 3 344 18 2
shell 5 3 500 18 2 steak 5 4 145 1 2
shorts 6 4 187 8 3 sword 5 3 223 14 3
skull 5 4 304 1 2 tongue 6 3 556 46 2
snail 5 4 45 1 1 vase 4 3 69 2 3
sock 4 3 52 1 3 wasp 4 4 43 0 1
tent 4 4 657 0 3 watch 5 3 1851 99 3
tooth 5 3 223 10 2 wolf 4 4 117 2 1
witch 5 3 274 5 2 worm 4 3 126 7 1
M 4.20 3.30 597.03 26.40 2.20 M 4.40 3.30 630.38 39.18 2.43
SD 0.72 0.69 1041.81 49.64 0.79 SD 0.84 0.91 866.66 107.99 0.75
Items with * were included in the reduced list for written naming.

126
Appendix 1:b. Results of item matching.
Full list Reduced list (written naming)
Reg
ula
r
597
.03
1041.8
1
Reg
ula
r
646
.30
1080.3
4
Sp
oke
n f
req
uen
cy
Ex
cep
tio
n
630.3
8
866.6
6
78
0.6
8
0.5
0
Sp
oke
n f
req
uen
cy
Ex
cep
tio
n
905.1
0
1360
.40 1
8
0.4
7
0.4
3
Re
gu
lar
26.4
0
49.6
4
Re
gu
lar
33.7
0
79.2
1
Wri
tten
fre
qu
en
cy
Ex
cep
tio
n
39
.18
107.9
9 7
8
0.1
6
0.8
8
Wri
tten
fre
qu
en
cy
Ex
cep
tio
n
90
.40
209.2
4 1
8
0.8
0
0.6
4
Reg
ula
r
3.3
0
0.6
9
Reg
ula
r
3.5
0
0.5
3
Nu
mb
er
of
ph
on
em
es
Exc
ep
tio
n
3.3
0
0.9
1
78
0.0
0
1.0
0
Nu
mb
er
of
ph
on
em
es
Exc
ep
tio
n
3.3
0
0.6
7
18
0.7
4
0.4
7
Reg
ula
r
4.2
0
0.7
2
Reg
ula
r
4.5
0
0.8
5
Nu
mb
er
of
lett
ers
Ex
cep
tio
n
4.4
0
0.8
4
78
1.1
4
0.2
6
Nu
mb
er
of
lett
ers
Ex
cep
tio
n
4.5
0
0.8
5
18
0.0
0
1.0
0
Re
gu
lar
9.8
3
0.3
8
Re
gu
lar
9.5
0.5
3
Va
lid
ati
on
su
cces
s
Ex
cep
tio
n
9.7
5
0.4
4
78
0.8
1
0.4
2
Va
lid
ati
on
su
cces
s
Ex
cep
tio
n
9.8
0.4
2
18
1.4
1
0.1
8
Co
mp
ari
so
n
Ca
teg
ory
Me
an
StD
ev
DF
T-t
est
p
Co
mp
ari
so
n
Ca
teg
ory
Me
an
StD
ev
DF
T-t
est
p

127
Appendix 1:c. Classification of items: Natural vs manmade.
FULL SET REDUCED SET
Comparison NATURAL/MANMADE Comparison NATURAL/MANMADE
Category Regular Exception Category Regular Exception
Natural 9 6 Natural 1.00 0.00
Manmade 17 23 Manmade 5.00 2.00
Unclear 14 11 Unclear 4.00 8.00
DF 4 DF 2
W2� 5.72 W2� 3.75
p 0.22 p 0.15
Appendix 1:d. Classification for natural, manmade or 'unclear.'
CLASSIFICATION NATURAL MANMADE UNCLEAR
fruit tools homewares manmade
foods mythical
hardware clothing anatomy occupations CATEGORIES
animals weapons transport musical instruments
bear axe glove beer ghost
bee ball hook bone ice
cat bath hose brain nose
crab belt key bread road
crow bib kite cake shell
dog blinds mast cheese skull
duck book noose chef soup
frog bowl plane cloud steak
goat brick plug clown tongue
pear chalk screw drum tooth
prawn comb scroll egg witch
snail cork shield eye
wasp desk shoe foot
salt (salt shaker)
wolf dice shorts 25
ITE
MS
worm door ski
15 flag sock
flask sword
fork tent
gate vase
glass watch
40

128
Appendix 1:e. Design of the comprehension test.
The semantic distance norms were taken from WordNet (Maki et al., 2004). The norms are
based on computational measures devised by Jiang and Conrath (Jiang & Conrath, 1997),
who combined two previous approaches, the edge-based and node-based approaches, both
of which are concerned with the relationships between nodes in a semantic taxonomy.
According to Maki and colleagues, the Jiang and Conrath method is well supported by
evidence such as semantic similarity ratings from human observers and computational
measures.
Of the 80 word/picture items used as the materials, eight could not be matched with
picturable semantic relatives (four from each of the regular and exception word groups). In
a few cases, one member of the relationship (either the target or the distractor) appeared
with its American name (e.g. prawn � shrimp; duster � eraser). The semantic distance in
these cases was assumed to be equivalent. The only additional caveat was that the distance
norms apply to the words, not the concepts. Therefore, there was a potential for figures to
suggest stronger relationships because of differences between spoken and written
frequency and, perhaps more significantly, relationships between nouns that are also verbs,
and could perhaps be semantically closer that way (e.g. comb/brush). In cases in which one
or both members of a word-pair did not seem to represent the pictured object, a different
relative was sought (the pairing of comb and brush was probably the most ‘verb-like;’ any
pairing that seemed less likely to represent objects for both members was changed for more
obvious object-object relationship.
Phonemic distractors were selected on the bases of phoneme overlap, which was calculated
from the number of shared phonemes (in a reasonably similar position) and number of
unshared phonemes (including same phoneme but in a different word position e.g. brick
and crib share the middle two phonemes but not the first and the last). For the latter,
number of unshared phonemes in each member of the pair was determined and the higher
of the two recorded. The table below also shows the number of shared phonemes divided
by the number not shared, which was the primary basis for matching the regular and
exception word groups.
Several of the semantic distractors shared a single phoneme with the target, which was
only considered reasonable in cases where such a relationship was considerably stronger
than the next best target/distractor relationship. Conversely, some phonological distractors
were also semantically related to the target – this was unavoidable in these instances (e.g.
the only picturable item phonologically similar to shorts is shirts). Although it could
perhaps be argued that items for which semantic and phonological distractors were difficult
to find should have been excluded from the set, this would have further reduced a set of
items that was already quite limited in number, as well as affecting the matching described
in Appendix 1. In total, five semantic distractors shared a single phoneme with the target,
while four phonological distractors could be argued to have a clear semantic link to the
target (this is obviously much more subjective and was not measured in any way). Note
that other complicating factors were not taken into account, such as visual similarity
between distractors. Also, many items also had to be repeated, including some targets that
were used as distractors.
The full list of distractors appears in below, along with individual figures of phoneme
overlap and semantic distance. Unrelated distractors were chosen on the basis that they
were easily picturable and not semantically or phonologically related to the target or to
either of the other two distractors.

129
Appendix 1:f. Matching of regular/exception groups for semantic test.
PHONEME OVERLAP Comparison
SEMANTIC DISTANCE Same phoneme Different phoneme Overlap
Category Regular Exception Regular Exception Regular Exception Regular Exception
Mean 8.53 9.03 2.08 2.13 1.28 1.38 0.68 0.71
StDev 5.46 5.44 0.57 0.76 0.45 0.49 0.34 0.34
DF 70* 78 78 78
T-test -0.39 -0.33 0.19 0.34
p 0.70 0.74 0.85 0.74
*Each group had 4 missing values. Matching of semantic association.
Regular Exception
Within group 22 27
Associated 18 13
Fisher exact p = 0.359

130
Appendix 1:g. Comprehension test - distractors and relatedness figures.
PHONEMIC SEMANTIC TARGET
Distractor S D S/D Distractor Cx Relationship JCN UNRELATED
axe ox 1 1 1.00 saw w tools/woodcutting 6.34 mug
ball bell 2 1 0.50 bat a use together 9.41 drill
bath bark 2 1 0.50 towel a use together 17.70 drill
bear beer 1 1 1.00 tiger w animals 6.77 vice
bee bear 1 1 1.00 wasp w animals/stinging insects 2.51 flute
beer bee 1 1 1.00 wine w drinks 4.00 clock
belt bolt 3 1 0.33 tie w clothing/accessories 6.24 fish
bib bin 2 1 0.50 dummy w baby things scales
blinds blenders 5 2 0.40 curtains w window covers peas
bone phone 2 1 0.50 skull w anatomy/internal 4.17 mouse
book bark 2 1 0.50 pen a b used for a skates
bowl bell 2 2 1.00 spoon a a goes with b 7.28 trike
brain train 3 1 0.33 skull w anatomy/internal 14.24 snake
bread bride 3 1 0.33 meat w food 3.54 crown
brick crib 2 2 1.00 rock a natural vs manmade 16.27 spoon
cake rake 2 1 0.50 pie w food/sweets 3.86 bag
cat hat 2 1 0.50 mouse w animals 8.46 hearse
chalk fork 2 1 0.50 duster (eraser)
w stationary 12.71 barn
cheese peas 2 1 0.50 bread w food 7.87 buoy
chef shed 2 1 0.50 waiter w occupation 13.60 safe
cloud clown 3 1 0.33 moon a in the sky moth
clown crown 3 1 0.33 juggler w occupation/circus folk truck
comb coat 2 1 0.50 brush w hair styling 2.00 tap
cork chalk 2 1 0.50 bottle a wine bottle plugs? 15.41 vice
crab crib 3 1 0.33 lobster w animals/crustaceans 2.22 suit
crow rope 2 2 1.00 bird a sub/super 5.99 bag
desk disk 1 1 1.00 chair w furniture 5.81 shears
dice rice 2 1 0.50 cards w games 18.20 leaf
dog log 2 1 0.50 cat w animals/pets 2.24 tie
door deer 1 1 1.00 hinge a part-whole 16.76 bowl
drum plum 2 2 1.00 guitar w musical instruments 7.05 scarf
duck truck 2 2 1.00 swan w animals/water birds 3.81 stamp
egg peg 2 1 0.50 chicken a a comes from b 15.68 scythe
eye tie 1 1 1.00 ear w anatomy/face 2.62 trowel
flag bag 2 1 0.50 shield a representations couch
flask mask 3 2 0.67 bottle w drink containers 2.33 whip
foot flute 2 2 1.00 shoe a b goes on a 11.57 boat
fork cork 2 1 0.50 knife w cutlery 8.24 whip
frog log 2 2 1.00 rabbit w animals 11.44 anvil
gate plate 2 2 1.00 door a function 2.93 wheel
S = shared phonemes
D = different phonemes
S/D = number of shared phonemes divided by number of different phonemes
Cx = criteria for semantic relationship (w = within the same category; a = associated by function)
JCN = Jiang & Conrath number

131
PHONEMIC SEMANTIC TARGET
Distractor S D S/D Distractor Cx Relationship JCN UNRELATED
ghost toast 3 1 0.33 witch w mythical monsters 12.43 chair
glass grass 3 1 0.33 mug w kitchen/drinking 10.19 bike
glove glass 2 2 1.00 hat a a goes on b 8.12 mace
goat boat 2 1 0.50 cow w animals/farm 4.44 easle
hook book 2 1 0.50 nail w hardware 7.00 trowel
hose rose 2 1 0.50 tap a a goes on b 17.77 deer
ice rice 2 1 0.50 glass a a goes in b 5.99 safe
key cow 1 1 1.00 lock a a goes in b 9.61 net
kite cat 2 1 0.50 bird a function 5.99 mallet
mast mask 3 1 0.33 wheel a boat parts biscuit
noose goose 2 1 0.50 rope a part-whole 10.86 bolt
nose rose 2 1 0.50 ear w anatomy/face 3.97 bowl
pear bear 1 1 1.00 apple w food/fruit 2.07 sink
plane plate 2 2 1.00 car w vehicles 4.53 monk
plug plum 3 1 0.33 sink a a goes in b 16.22 raft
prawn (shrimp)
corn 2 2 1.00 lobster w animals/crustaceans? 3.42 rope
road rose 2 1 0.50 car a b uses a 10.02 lamp
salt bolt 3 1 0.33 pepper w food/spices 4.67 bike
screw scroll 3 2 0.67 nail w hardware 5.31 bed
scroll screw 3 2 0.67 pen a b used for a 20.91 lock
shell shed 2 1 0.50 fish a beach 6.65 ruler
shield shed 2 2 1.00 armour a function 1.59 sunglasses
shoe shark 1 2 2.00 sock w clothing 10.75 couch
shorts shirts 3 1 0.33 pants w clothing/legs 1.79 rock
ski key 2 1 0.50 sled w snow flute
skull skunk 3 2 0.67 brain w anatomy/internal 14.24 house
snail whale 2 2 1.00 slug w animals/slimy invertebrates 2.76 bandage
sock rock 2 1 0.50 foot a a goes on b 15.64 bed
soup suit 2 1 0.50 bowl a part-whole 17.80 ox
steak rake 2 2 1.00 potato a a goes with b 10.41 flowers
sword saw 2 1 0.50 shield w medieval weapons 14.00 pretzel
tent pen 2 2 1.00 house w forms of shelter 8.13 onion
tongue tongs 2 2 1.00 tooth w anatomy/mouth 16.65 cards
tooth roof 1 2 2.00 mouth a part-whole 6.96 sai
vase jars 2 1 0.50 flowers a b goes in a 17.39 horse
wasp watch 2 2 1.00 fly w animals/stinging insects 7.40 phone
watch witch 2 1 0.50 clock w function 1.73 shark
witch watch 2 1 0.50 broom a a uses b 19.92 tongs
wolf bull 2 2 1.00 dog w animals/canines 3.55 throne
worm world 2 2 1.00 caterpillar w animals/invertebrates 12.09 camera
2.13 1.40 0.73 9.29
0.68 0.48 0.34 5.36
S = shared phonemes
D = different phonemes
S/D = number of shared phonemes divided by number of different phonemes
Cx = criteria for semantic relationship (w = within the same category; a = associated by function)
JCN = Jiang & Conrath number

132
Appendix 2. Analyses
Appendix 2:a. Calculation of chance overlap in item consistency.
The calculation of chance overlap is the prediction of overlap between two tests that would
result from chance alone. This calculation generates exactly the same figures as would be
produced by Cohen’s Kappa. Which of the two tests is ‘Test 1’ and which is ‘Test 2’ in the
following equation makes no difference to the result. The equation for chance error
overlap is:
(number of errors Test 1 ÷ number of items test 1) x number of errors test 2
The equation for chance overlap for correct items is:
(number correct Test 1 ÷ number of items test 1) x number correct test 2
The total chance overlap is found by adding these two scores, and this figure can then be
compared to the actual overlap to gauge whether or not the ‘consistency’ between the two
tests is authentic or just due to chance.
Appendix 2:b. Examples of overlap calculation and interpretation.
Example 1
Reading test is 70/80 while repetition is 60/80, with 8 of the errors overlapping (and
therefore 58 correct overlapping, with a total of 66 overlapping items). The calculation
would be:
Errors: 10/80 x 20 = 2.5
Correct: 70/80 x 60 = 52.5
Total chance overlap = 55
Maximum overlap = 70
When the actual overlap of 66 is compared with the chance overlap of 55 (with a
maximum overlap of 70) it can be seen that this overlap is reasonably high.
Example 2
Consider another example with a larger difference between the scores, but the same
overlap of errors. In this example, the reading test is again 70/80 while oral naming is
20/40, with 8 errors again overlapping (and this time 18 correct overlapping, for a total of
26 items overlapping). This time the calculation would be:
Errors: 10/80 x 60 = 7.5
Correct: 70/80 x 20 = 17.5
Total chance overlap = 25
Maximum overlap = 30
In this case, comparing the actual overlap of 26 with the chance overlap of 25 (with a
maximum overlap of 30) is less impressive – the overlap would need to be closer to the
maximum of 30 to suggest consistency between the tests (an overlap of 28 or 30 might be
more convincing, though in this case the gap between chance and maximum overlap is
probably too small to be meaningful).

133
Appendix 3. Control group results
Appendix 3:a. Acceptable variations and queried responses.
Acceptable variations are based on control group responses, and do not include common responses
that included the correct response (e.g. t-bone steak).
Item Acceptable response
Prompted for desired response
bath tub
beer drink/glass etc
blinds blind
chalk blackboard*
crow bird
gate gates
glass cup
road highway
soup bowl
steak t-bone
*To give the chalk context, it was pictured with a blackboard, which was named occasionally.
Appendix 3:b. Control group performance on lexical decision
LEXICAL DECISION n=60
CORRECT
Range 53-60
Mean 58.33
StDev 2.38
REAL WORDS NONWORDS n=30
Range 29-30 24-30
Mean 29.73 28.60
StDev 0.46 2.16
Regular Excep-
tion Pseudo-
homophones Nonhomo-
phonic n=15
Range 14-15 14-15 9-15 12-15
Mean 14.87 14.87 13.87 14.73
StDev 0.35 0.35 2.00 0.80
Appendix 3:c. Control group performance on BORP
BORB
CORRECT n=32
Range 20-29
Mean 25.93
StDev 2.66
Real Unreal n=16
Range 14-16 6-13
Mean 15.27 10.67
StDev 0.80 2.13

134
Appendix 3:d. Control group performance on homophone decision
HOMOPHONE DECISION n=60
TOTAL CORRECT
Range 50-60
Mean 55.65
StDev 3.46
TOTAL YES TOTAL NO n=30
Range 22-30 22-30
Mean 27.35 27.94
StDev 2.55 2.68
REAL WORDS n=40
Range 32-40
Mean 37.60
StDev 2.20
REGULAR EXCEPTION NONWORDS n=20
Range 15-20 15-20 16-20
Mean 18.60 19.00 18.13
StDev 1.30 1.51 1.60
Yes No Yes No Yes No n=10
Range 9-10 5-10 5-10 8-10 6-10 7-10
Mean 9.27 9.33 9.33 9.67 8.93 9.20
StDev 0.46 1.35 1.35 0.62 1.16 0.94
Appendix 3:e. Controls: Natural/manmade contrast on oral naming
NATURAL MANMADE UNCLEAR
n 15 40 25
Mean 14.73 39.33 24.93
StDev 0.59 0.98 0.26
-

135
Appendix 4. Nonword reading
Appendix 4:a. Nonword reading stimuli and participant responses.
Lexicalisations are italicised.
Item
n
um
ber
Sti
mu
lus
item
No
rmal
pro
nu
n-
cia
tio
n
Nu
mb
er
of
lett
ers
Nu
mb
er
of
ph
on
em
es
RPD DPC DHT JWS SJS
1 ked /ked/ 3 3 √ cooked reed kade bed
2 bem /bem/ 3 3 beam tem beam beam bath
3 nar /na:/ 3 2 √ √ \ washing
4 cug /kUg/ 3 3 could ked cugs cup
5 fon /fPn/ 3 3 fond √ fond font tent
6 lat /lzt/ 3 3 nat /lət/ late tent
7 shid .Rhc.� 4 3 sheared shell jabu ship \
8 boak /boTk/ 4 3 boat book book boo-ak bath
9 doop /dup/ 4 3 she-opt dop drom new
10 birl /b2l/ 4 3 birled bird bill bird
11 dusp /dUsp/ 4 4 dust dus ship brush
12 soaf /soTf/ 4 3 soak √ \ soup
13 snite /snaHt/ 5 4 √ snike snipe slug
14 hance /hzns/ 5 4 √ √ hence hant door
15 hoach /hnTsR. 5 3 hoached hot drum hoe-ak pain
16 smode /smoTd/ 5 4 mode s..m..dee \ plaine
17 glope /gloTp/ 5 4 √ goes drom gud
18 grest /grest/ 5 5 √ √ trashed flowers
19 dringe .cYqHmcY.� 6 5 gringle drink \ ring
20 squate .rjvdHs.� 6 4 she-ote see…tee square go-ate oysters
21 churse .sR2r.� 6 3 church church church church church
22 thease .Shr.� 6 3 √ /tisis/ \ flowers
23 shoave .RnTu.� 6 3 shove shell \ sho-ave wood
24 pretch .oqdsR.� 6 4 preach perch scred prench flowers
Mean 4.5 3.417
Standard deviation 1.142 0.717
Total correct 7 5 0 13 0
Percent overlap 71 59 31 83 20
Number of lexicalisations 12 5 10 5 5

136
Appendix 5. Error analysis for aphasic participants
Legend for following pages:
Comp = Comprehension test
ON = Oral naming
WN = Written naming
Read = Reading test
Rep = Repetition test
Sem = semantic error
Ph = phonological error
Mor = morphological error (error indicated -s or –ed)
Un = unrelated error
NR = no response
Delayed = delayed error
Q = Participant cued following an acceptable (non-target) response
(e.g. ‘bird’ Q ‘crow’).
(g) = gestured as part of response
Shading indicates that the item was responded to correctly on all occasions.

137
Appendix 5:a. MWN: Full list of errors on unpublished tests.
Correct (ticked) or error type and response
Target Comp ON WN Read Rep
AXE √ √ √ √ √
BALL √ √ √ √ √
BATH √ Ph /braS/ √ √ √
BEAR √ √ √ √ √
BEE √ √ √ √ √
BEER √ Ph breer √ √ √
BELT √ √ √ √ √
BIB √ √ √ √ √
BLINDS √ √ √ √ √
BONE √ √ √ √ √
BOOK √ √ √ √ √
BOWL √ √ √ √ √
BRAIN √ √ √ √ √
BREAD √ Ph /br2d/ √ √ √
BRICK √ √ √ √ √
CAKE √ √ √ √ √
CAT √ √ √ √ √
CHALK √ √ √ √ √
CHEESE √ √ √ √ √
CHEF √ √ √ √ √
CLOUD √ √ √ √ √
CLOWN √ √ √ √ √
COMB √ √ √ √ √
CORK √ √ √ √ √
CRAB √ √ √ √ √
CROW √ Sem bird Q currawong Sem bird Q ? √ √
DESK √ Delayed √ √ √
DICE √ √ √ √ √
DOG √ √ √ √ √
DOOR √ √ √ √ √
DRUM √ Mor drummed √ √ √
DUCK √ √ √ √ √
EGG √ √ √ √ √
EYE √ √ √ √ √
FLAG √ √ √ √ √
FLASK √ Sem cigarette lighter Sem* cig. lighter √ √
FOOT √ √ √ √ √
FORK √ √ √ √ √
FROG √ √ √ √ √

138
MWN’s errors (continued).
Correct (ticked) or error type and response
Target Comp ON WN Read Rep
GATE √ Ph /dYeIts/ √ √ √
GHOST √ √ √ √ √
GLASS √ Ph grass √ √ √
GLOVE √ √ √ √ √
GOAT √ √ √ √ √
HOOK √ √ √ √ √
HOSE √ √ √ √ √
ICE √ NR - NR - √ √
KEY √ √ √ √ √
KITE √ √ √ √ √
MAST √ √ √ Ph mask √
NOOSE √ Sem rope Sem rope √ √
NOSE √ √ √ √ √
PEAR √ √ √ √ √
PLANE √ Ph prane √ √ √
PLUG √ √ √ √ √
PRAWN √ √ √ √ √
ROAD √ √ √ √ √
SALT √ √ √ √ √
SCREW √ Delayed √ √ √
SCROLL √ √ √ √ √
SHELL √ √ √ √ √
SHIELD √ √ NR - √ √
SHOE √ √ √ √ √
SHORTS √ √ √ √ √
SKI √ NR - √ √ √
SKULL √ Sem skeleton √ √ √
SNAIL √ √ √ √ √
SOCK √ √ Sp sox √ √
SOUP √ √ √ √ √
STEAK √ √ √ √ √
SWORD √ √ √ √ √
TENT √ √ √ √ √
TONGUE √ √ √ √ √
TOOTH √ √ √ √ √
VASE √ √ √ √ √
WASP √ √ √ √ √
WATCH √ √ √ √ √
WITCH √ NR - NR - √ √
WOLF √ √ √ √ √
WORM √ √ √ √ √
Correct 80 64 73 79 80

139
Appendix 5:b. RPD: Full list of errors on unpublished tests.
Correct (ticked) or error type and response
Target Comp ON WN Read Rep
axe √ Sem tomahawk NR - √ √
ball √ √ √ √ √
bath √ √ √ √ √
bear √ √ √ √ √
bee √ √ √ √ √
beer √ Sem drink (q) (√ o/t) √ √ √
belt √ √ √ √ √
bib √ Sem baby √ √ √
blinds √ √ √ √ √
bone √ √ √ √ √
book √ √ √ √ √
bowl √ Sem dish NR - √ √
brain √ √ √ √ √
bread √ √ √ √ √
brick √ √ √ √ √
cake √ √ √ √ √
cat √ √ √ √ √
chalk √ Sem crayon Sem blackboard √ √
cheese √ √ √ √ √
chef √ √ Sem cook √ √
cloud √ Mor -s √ √ √
clown Sem juggler √ √ √ √
comb √ √ √ √ √
cork √ √ √ √ √
crab Sem lobster Mor √ √ √
crow √ Sem bird (q) magpie √ √ √
desk √ √ √ Ph des √
dice √ √ √ √ √
dog √ √ Sem puppy √ √
door √ √ √ √ √
drum √ √ √ √ √
duck √ Sem dove (√ o/t) √ √ √
egg √ √ √ √ √
eye √ Mor eyed √ √ √
flag √ √ √ √ √
flask √ √ √ √ √
foot √ √ √ √ √
fork Sem knife Sem fork, no knife √ √ √
frog √ √ √ √ √
gate √ √ √ √ √

140
RPD’s errors (continued).
Correct (ticked) or error type and response
Target Comp ON WN Read Rep
ghost √ √ √ √ √
glass √ Sem beaker…(√ o/t) √ √ √
glove √ √ √ √ √
goat √ √ √ √ √
hook √ √ NR - √ √
hose √ √ √ √ √
ice √ √ √ √ √
key √ √ √ √ √
kite √ √ √ √ √
mast √ Sem flagship, no, stern √ Ph /mastk/ √
noose √ Mor -s Sem rope √ √
nose √ √ √ √ √
pear √ √ √ √ √
plane √ √ √ √ √
plug √ √ √ √ √
prawn √ √ √ √ √
road √ √ Sem bitumen √ √
salt √ √ √ √ √
screw √ √ √ √ √
scroll √ Sem Magna Carta Sem 0 √ √
shell √ √ Sem 0 √ √
shield √ √ Sp sheild √ √
shoe √ √ √ √ √
shorts √ √ √ √ Ph shore
ski √ √ √ √ √
skull √ Sem skeleton Sem skellton √ √
snail √ Mor -s √ √ √
sock √ Mor -s √ √ √
soup √ Delayed √ √ √
steak √ √ √ √ √
sword √ √ √ √ √
tent √ √ √ √ √
tongue √ √ √ √ √
tooth √ √ √ √ √
vase √ Delayed √ √ √
wasp √ Sem mosquito Sem bee √ √
watch √ √ √ √ √
witch √ √ Sp which √ √
wolf √ √ √ √ √
worm √ √ √ √ √
Correct 77 59 67 78 79

141
Appendix 5:c. DHT: Full list of errors on unpublished tests.
Correct (ticked) or error type and response
Target Comp ON WN Read Rep
AXE √ Ph atches √ Ph ashed √
BALL √ Delayed NR - √ √
BATH √ √ √ √ √
BEAR √ √ √ √ √
BEE √ √ √ √ √
BEER √ √ √ √ √
BELT √ Ph belk √ √ √
BIB √ √ √ Ph big, no √
BLINDS √ √ √ Ph blounds √
BONE √ √ √ √ √
BOOK √ Sem bible Sem bible √ √
BOWL √ √ √ NR - Mor bowled
BRAIN √ √ √ √ √
BREAD √ Ph bled √ √ √
BRICK √ √ √ √ √
CAKE √ √ Sem icing √ √
CAT √ √ √ √ √
CHALK √ NR - √ Ph core Ph shal
CHEESE √ NR - √ √ √
CHEF √ √ √ √ √
CLOUD √ √ √ NR - √
CLOWN Sem juggler √ √ √ Mor -s
COMB √ √ √ √ √
CORK √ Sem bottle opener √ Ph cort √
CRAB √ √ √ Ph scrub √
CROW √ Sem bird (q) evil √ √ √
DESK √ Ph dest √ NR - Ph guest
DICE √ √ √ √ √
DOG √ √ √ √ √
DOOR √ √ √ √ √
DRUM √ Ph grum √ Ph grum Ph grum
DUCK Sem swan √ √ Ph duts √
EGG √ √ √ √ √
EYE √ √ √ √ √
FLAG √ Ph flad √ √ √
FLASK √ Sem whiskey √ Ph flast Ph glass
FOOT √ √ √ √ Ph /f�k/
FORK √ √ √ √ √
FROG √ √ √ √ √
GATE √ NR - √ NR - Ph gaik

142
DHT’s errors (continued).
Correct (ticked) or error type and response
Target Comp ON WN Read Rep
GHOST √ NR - √ √ √
GLASS √ NR cup of, no √ √ √
GLOVE √ NR - √ √ √
GOAT √ Delayed √ √ √
HOOK √ NR - NR - √ √
HOSE √ NR - √ √ √
ICE √ Sem rain √ √ √
KEY √ √ √ √ √
KITE Sem bird NR - √ √ √
MAST √ NR - NR - √ Ph mask
NOOSE √ NR - √ NR - √
NOSE √ √ √ √ √
PEAR √ Sem apple √ √ √
PLANE √ √ √ √ √
PLUG √ Ph glug √ √ √
PRAWN √ √ √ √ √
ROAD √ √ √ √ √
SALT √ √ √ √ √
SCREW √ √ √ √ √
SCROLL √ √ √ √ √
SHELL √ NR - √ √ √
SHIELD √ Ph seal √ NR - √
SHOE √ Mor -s √ √ √
SHORTS √ Mor -s √ Mor -s Mor -s
SKI √ √ √ √ √
SKULL √ √ √ √ √
SNAIL √ √ √ √ √
SOCK √ Mor -s √ √ Ph shock
SOUP √ √ √ √ √
STEAK √ Ph scray √ Ph snake Ph skake
SWORD √ √ √ √ √
TENT √ Delayed √ √ √
TONGUE √ Ph tun √ √ Ph kung
TOOTH √ Mor teeth √ NR - √
VASE √ Sem bowl √ Ph vaze UR glue
WASP √ Sem bee √ Ph wost √
WATCH √ √ √ √ √
WITCH √ √ √ √ √
WOLF √ √ √ √ √
WORM √ √ √ √ √
Correct 77 42 75 61 66

143
Appendix 5:d. DPC: Full list of errors on unpublished tests.
Correct (ticked) or error type and response
Target Comp ON Read Rep WN
axe √ √ √ √ √
ball √ √ √ Ph fall
bath √ √ √ √
bear √ √ √ √
bee √ √ √ NR -
beer √ √ √ Ph fear
belt √ √ √ √
bib √ Circ baby stuff √ √
blinds √ NR - √ Ph
bone √ √ √ √
book √ √ √ √ √
bowl √ √ √ Ph
brain √ √ √ √
bread √ √ √ √
brick √ Ph brook Ph bock √
cake √ Delayed √ √
cat √ √ √ √
chalk Sem duster Ph chorch √ √ Sp calb
cheese √ √ √ √
chef √ cough, C.H., kef NR f… √ NR c
cloud √ Delayed √ Ph ploughed
clown √ √ √ √ NR c
comb √ √ √ √
cork √ Ph qwark √ √
crab √ NR - √ √
crow √ Ph bird (q) NR √ √
desk √ √ √ √
dice √ Ph spelled out (L.I.C.E.) √ NR -
dog √ √ √ √ √
door √ √ √ √
drum √ √ √ √ Sp dume
duck √ √ √ √
egg √ √ √ √
eye √ Delayed √ Ph ice
flag √ √ √ √
flask √ √ √ √
foot √ √ √ √ Sp foo
fork √ √ √ √
frog √ √ √ √
gate √ Un glass √ √

144
DPC’S errors (continued).
Correct (ticked) or error type and response
Target Comp ON Read Rep WN
ghost √ √ √ √
glass Ph grass Delayed √ √
glove √ Mor -s √ √ NR c
goat √ √ √ √
hook √ NR - √ √ NR -
hose √ NR - √ √
ice √ NR - √ √
key √ √ √ √
kite √ Ph skite √ √ Sp kile
mast √ Ph mask Ph mask Ph nast
noose NR - Sem rope Ph nose √ NR -
nose √ √ √ √
pear √ Delayed √ Ph hair
plane √ √ √ Ph play
plug √ √ √ √
prawn √ Mor -s √ √
road √ Delayed √ √ Sp ro
salt √ √ √ √
screw √ Delayed √ √
scroll √ Circ chinese thing √ √ NR -
shell √ √ √ √
shield √ NR - √ Ph sheel
shoe √ √ √ √
shorts √ Mor -s √ Mor -s Sp shorh
ski √ √ √ √
skull √ √ √ √ Sp scal
snail √ √ √ √
sock √ √ √ √
soup √ √ √ √
steak √ √ √ √
sword √ √ √ √ Un sko
tent √ √ √ √ NR c-
tongue √ NR - √ √
tooth √ NR - √ √
vase √ √ √ √
wasp √ NR - √ √
watch NR - √ √ √ Sp whc
witch √ √ √ √ Sp wick
wolf Sem dog Sem vox NR - Ph woof
worm √ √ √ √
Correct 75 48 75 66 3/20

145
Appendix 5:e. JWS: Full list of errors on unpublished tests.
Correct (ticked) or error type and response
Target Comp ON Read Rep WN
axe √ √ √ Ph act Sp ars
ball √ √ √ √
bath √ Circ washing √ √
bear √ √ Ph beer √
bee √ Sem fly √ √
beer √ Sem drink √ √
belt √ Delayed √ √
bib √ Delayed √ Ph bid
blinds √ Sem drapes √ Ph line
bone √ √ √ √
book √ √ √ √ √
bowl √ Sem toilet √ √
brain √ Delayed √ √
bread Delayed √ √ √
brick √ √ √ √
cake Sem pie Circ happy bday √ √
cat √ Delayed √ √
chalk √ Circ to write √ √ Sp calk
cheese √ √ √ √
chef √ √ √ √ Un kook (cook)
cloud √ √ √ √
clown √ √ √ √ √
comb √ Delayed √ √
cork √ Sem √ √
crab √ Sem √ Un fred
crow √ √ √ √
desk √ √ √ √
dice √ Sem marbles √ √
dog √ Delayed √ √ √
door √ √ √ √
drum √ NR - √ √ Sp dump
duck √ Delayed √ √
egg √ √ √ √
eye √ √ √ √
flag √ √ √ √
flask √ Sem bottle √ √
foot Sem shoe Sem toes √ √ Sem feet
fork √ Sem knife √ √
frog √ √ √ √
gate √ √ √ √

146
JWS’ errors (continued).
Correct (ticked) or error type and response
Target Comp ON Read Rep WN
ghost √ Sem spook √ √
glass Ph grass √ √ √
glove √ √ √ √ Un ?craif
goat √ Delayed √ √
hook √ √ √ √ NR -
hose √ √ √ √
ice √ Delayed √ √
key √ √ √ √
kite √ √ √ √ Sp kert
mast √ Ph mask Ph mask Ph mask
noose Sem rope √ Ph nose √ Un ?lassa (lassoo)
nose Sem ear √ √ Ph no
pear √ √ √ Ph bear
plane √ √ √ √
plug √ Sem sink √ √
prawn √ NR - √ √
road √ Delayed √ √ Un ?garda
salt √ √ √ √
screw √ √ √ √
scroll √ Ph stroll √ √ NR -
shell √ NR - √ √
shield √ √ √ √
shoe √ √ √ Mor -s
shorts √ √ √ √ Sem pant?
ski √ Delayed √ √
skull √ Sem hat √ √ NR -
snail √ Sem horse √ √
sock √ √ √ √
soup √ √ √ √
steak √ Sem beef √ √
sword Sem shield √ √ √ Sp sord
tent √ Delayed √ √ √
tongue √ √ √ √
tooth Sem mouth √ √ √
vase √ Delayed √ √
wasp √ Sem fly √ Ph wops
watch √ √ √ √ Sp wath
witch √ NR - √ √ NR -
wolf √ Sem dog √ √
worm √ √ √ √
Correct 75 41 77 71 4/20

147
Appendix 5:f. SJS: Full list of errors on unpublished tests.
Correct (ticked) or error type and response
Target Comp ON WN Read Rep
axe √ √ Un key √ √
ball Sem bat Ph bowl Un cab √ √
bath √ √ √ √ √
bear √ Un yuck √ Un jam √
bee √ Sem fly Sp eeb √ √
beer √ Sem glass Un chare √ √
belt √ NR - Un check NR - √
bib √ Sem baby,pram NR - NR - √
blinds √ Circ open,doors Un kike √ √
bone √ √ Sem dag NR - √
book √ √ √ √ √
bowl √ √ Sem cup Sem soup √
brain √ √ Un chart √ √
bread √ Sem toast Un cuk √ √
brick √ Un foot Sp breed Sem book s/c wood √
cake √ Un nice Un cubam √ √
cat √ √ √ √ √
chalk √ Sem pencil Sp chair Sem drawing √
cheese √ √ √ √ √
chef √ Circ chinese Un chark NR - √
cloud √ Circ sky,rain Sp cud Sem rain √
clown √ Circ rodeo(g) NR - Circ easter show √
comb Sem brush √ Un door √ √
cork √ √ Un edde √ √
crab √ √ Sem claw √ √
crow √ √ NR - Un flower √
desk √ √ Un key √ √
dice Sem cards √ Un rarrd Ph ice √
dog √ Sem cat √ √ √
door √ √ Un teet Circ (g) √
drum Sem guitar √ Un door √ √
duck √ √ Un raddon √ √
egg √ √ Un eye Mor -s √
eye √ √ √ √ √
flag √ √ Un teet √ √
flask Ph mask Sem wine Un done Sem vase √
foot √ √ Un door √ √
fork √ √ Un teeth Un wine √
frog √ √ Un rared √ √
gate √ Sem door Un bickle Circ lock,up there(g) √

148
SJS’ errors (continued).
Correct (ticked) or error type and response
Target Comp ON WN Read Rep
ghost √ Circ halloween NR - Sem halloween √
glass √ NR - Un tub Sem drink √
glove Ph glass √ Un dick Un linning √
goat √ NR - NR - Sem bull √
hook √ Sem paint Un start Un loe-en √
hose √ Circ grass(g) NR \ √ √
ice √ √ Un ith √ √
key Sem lock Ph chee √ √ √
kite √ Circ fly, sails Un key √ √
mast √ Sem flag Un teet NR - √
noose √ Sem rope Un role Un duck √
nose √ Sem eye Un good Ph hose √
pear √ Sem apple Un parth Circ fridge(g) √
plane √ √ Sp plain NR - √
plug Ph plum Circ bath,drains Un teeth √ √
prawn √ NR - Sp prane Mor -s √
road √ Circ drive Un door √ √
salt √ Sem pepper NR teeth Sem pepper √
screw √ Circ roof(g) NR tart Sem cork √
scroll √ Circ old,long time NR - NR - √
shell √ Circ listen(g) NR - NR - √
shield √ Sem iron Un plant Un lawn √
shoe √ Sem foot Un chart Mor -s √
shorts √ √ Un saw NR - √
ski √ √ Un kid Sem ice √
skull √ √ Un stuke NR - √
snail √ Sem slug Un dekeey Sem worms √
sock √ NR - NR - Sem shoes √
soup √ Circ bowl,yummie Un cad √ √
steak √ Un yuck √ √ √
sword √ √ Un stew Un hose √
tent √ √ Sp tant √ √
tongue √ Sem arm Sem eye Sem camp √
tooth √ Mor teeth Sem eye Sem thumb √
vase √ √ Un reeth √ √
wasp √ Circ up there,yuck NR - Sem fly √
watch √ NR - Sp swith √ √
witch Sem broom Circ h'ween,flys NR - NR - √
wolf √ Un yuck Un clart Sem tiger √
worm √ Mor -s Un ebe √ √
Correct 71 32 9 35 80

149
Appendix 5:g. Lexical decision – aphasic errors.
Cor R E Real PH NH Non
MWN 60 15 15 30 15 15 30
RPD 52 15 15 30 10 12 22
DHT 59 15 15 30 15 14 29
DPC 55 13 14 27 13 15 28
JWS 35 13 13 26 3 6 9
SJS 55 14 13 27 15 13 28
Mean 52.67 14.17 14.17 28.33 11.83 12.50 24.33
SD 9.14 0.98 0.98 1.86 4.75 3.39 8.02
Cor = total correct; R = regular words; E = exception words; Real = total for real words (R + E); PH =
pseudo-hompophonic nonwords; NH = non-homophonic nonwords; Non = total for nonwords (PH +
NH).
Appendix 5:h. Homophone decision – aphasic errors
Cor Y(t) N(t) R(Y) R(N) R(t) E(Y) E(N) E(t) Real N(Y) N(N) N(t)
MWN 57 29 28 10 9 19 10 10 20 32 9 9 18
RPD 41 27 14 10 7 17 8 4 12 28 9 3 12
DHT 44 27 17 9 8 17 9 6 15 29 9 3 12
DPC 28 16 12 8 4 12 4 3 7 19 4 5 9
JWS 36 17 19 6 8 14 8 7 15 25 3 4 7
SJS 32 19 13 8 4 12 9 4 13 24 2 5 7
Mean 39.67 22.50 17.17 8.50 6.67 15.17 8.00 5.67 13.67 26.17 6.00 4.83 10.83
SD 10.29 5.79 5.91 1.52 2.16 2.93 2.10 2.58 4.27 4.54 3.35 2.23 4.17
Cor = total correct; (t) = total; Y = homophonic pairs; N = non-homophonic pairs; R = regular word
pairs; E = exception word pairs; Real = total for real word pairs; N = nonword pairs.
Appendix 5:i. Object decision – aphasic errors.
C R UR
MWN 26 16 10
RPD 29 16 13
DHT 27 15 12
DPC 26 15 11
JWS 29 16 13
SJS 29 14 15
Mean 27.67 15.33 12.33
SD 1.51 0.82 1.75
Cor = total correct; R =real objects; UR = unreal objects.