patterns of transnational terrorism, 1970-99: alternative...
TRANSCRIPT

PATTERNS OF TRANSNATIONAL TERRORISM, 1970-99: ALTERNATIVE TIME SERIES ESTIMATES
by
Walter Enders* Department of Economics, Finance, and Legal Studies
University of Alabama Tuscaloosa, AL 35487
and
Todd Sandler
School of International Relations University of Southern California
Von Kleinsmid Center 330 Los Angeles, CA 90089-0043
Revised: October 2001
e-mail of corresponding author: [email protected] Authors' Note: Enders is the Lee Bidgood Chair of Economics and Finance, while Sandler is the Robert R. and Katheryn A. Dockson Professor of International Relations and Economics. Sandler is a member of the School of International Relations and the Department of Economics. We have profited from comments from three anonymous referees and from Patrick James.

PATTERNS OF TRANSNATIONAL TERRORISM, 1970-99: ALTERNATIVE TIME SERIES ESTIMATES
Abstract
Using alternative time series methods, this paper investigates the patterns of transnational
terrorist incidents that involve one or more deaths. Initially, an updated analysis of these fatal
events for 1970-99 is presented using a standard linear model with pre-specified interventions
that represent significant policy and political impacts. Next, a (regime-switching) threshold
autoregressive (TAR) model is applied to this fatality time series. TAR estimates indicate that
increases above the mean are not sustainable during high-activity eras, but are sustainable during
low-activity eras. The TAR model provides a better fit than previously tried methods for the
fatality time series. By applying a Fourier approximation to the nonlinear estimates, we get
improved results. The findings in this study and those in our earlier studies are then applied to
suggest some policy implications in light of the tragic attacks on the World Trade Center and the
Pentagon on 11 September 2001.

PATTERNS OF TRANSNATIONAL TERRORISM, 1970-99: ALTERNATIVE TIME SERIES ESTIMATES
On the morning of 11 September 2001, the world watched in horror as 19 hijackers
wreaked death and destruction on the World Trade Center and the Pentagon. The lethality of
transnational terrorism attained a new height, greatly out of line with the experience of the last
three decades where on average 400-500 people lost their lives each year in transnational
terrorist events (US Department of State, 1989-2000). In a matter of an hour, somewhere
between 5000 to 6000 innocent individuals from upwards of 62 nations died in four coordinated
hijackings. This attack underscores that the security threat confronting industrial nations is more
from clandestine groups with perceived grievances than from rogue nations. The reliance of
modern industrialized economies on technology makes them especially vulnerable to terrorist
attacks, as the events of 11 September 2001 sadly demonstrate.
Terrorism is the premeditated use or threat of use of extra-normal violence or brutality by
subnational groups to obtain a political, religious, or ideological objective through intimidation
of a huge audience, usually not directly involved with the policymaking that the terrorists seek to
influence.1 Key ingredients of the definition include the underlying political motive, the general
atmosphere of intimidation, and the targeting of those outside of the decision-making process.
Terrorists choose their targets to appear to be random so that everyone feels at risk, when getting
on a plane, entering a federal building, or strolling a market square. Business people, military
personnel, tourists, and everyday citizens, rather than politicians, are generally the targets of
terrorists attacks. In the case of the World Trade Center, the victims were not directly involved
in the political decision-making process associated with the demand (i.e., the removal of the US
presence from Saudi Arabia and an end to US support of Israel) that may have been behind the
attacks.2 The incident underscores the importance of applying sophisticated analyses to the study

2
of international terrorism to better understand its patterns, in the hopes of deriving improved
policies and predictions to protect against future attacks.
Although terrorism has plagued civilization from its inception, there has been a
heightened awareness since the end of 1967 Arab-Israeli War and the start of Israeli occupation
of captured territory, at which point terrorism assumed a greater transnational character.
Whenever a terrorist incident (e.g., a bombing, plane hijacking, and assassination) in one country
involves victims, targets, or institutions of at least one other country, the incident is transnational.
Incidents to protest the Israeli occupation resulted in the hijacking of planes on international
flights, the murder of Israeli athletes at the 1972 Munich Olympics, and attacks throughout
Western Europe, and represented instances of transnational terrorism. Given the perpetrators'
citizenship and the multiple nationalities of the victims, the four simultaneous hijackings on 11
September 2001 were transnational terrorist acts. The ability of terrorist events to capture
headlines demonstrates the consequences of such tactics to others, who later adopt them for their
causes. Terrorism is particularly troublesome for liberal democracies, entrusted with protecting
the lives and property of their electorate.3 If such democracies respond inappropriately to a
terrorist threat by either caving in to terrorist demands or overly restricting freedoms, then they
can lose legitimacy and be defeated at the next election (Wilkinson, 1986, 2001).
With the availability of sufficiently long time series, economists and others have applied
time-series techniques to evaluate anti-terrorism policy effectiveness, to uncover trends and
cycles, and to estimate the effects of terrorist activities. A host of policy decisions have been
examined, including the usefulness of retaliatory raids (Brophy-Baermann and Conybeare, 1994;
Enders and Sandler, 1993), the consequences of UN conventions and resolutions on terrorist
activities (Enders, Sandler, and Cauley, 1990), and the impact of media reporting on future
events (Nelson and Scott, 1992; Scott, 2001). Past studies have decomposed the series of all

3
terrorist events into its component series (e.g., assassinations, threats and hoaxes, hostage-taking
events, and bombings) so as to identify any trend or cycles.4 In so doing, it was shown that the
time series for each attack mode displays its own cycle, whose length increases with the
logistical complexity of the action. Apparently, the attack-counterattack interaction between the
terrorists and the authorities give rise to cycles that take longer to play out for more complicated
operations such as skyjackings (Enders et al., 1992). In terms of the estimated effects of
terrorism, studies have examined the relationship of terrorism and tourism as well as that
between terrorism and foreign direct investment.5
When incidents involving casualties (i.e., deaths, injuries, or both) are distinguished from
those with no casualties, there is a striking difference between the two. Namely, casualties series
display more predictability than noncasualties series, which are largely random noise once
detrended (Enders and Sandler, 2000). Thus, estimates and policy evaluation should be based on
a casualty series such as “DEATH,” where one or more deaths among terrorists or victims
resulted from the action, owing to this series’ deterministic factors. This finding suggests that
more intense terrorist events are more predictable than those with less consequence such as
threats, hoaxes, letter bombings, and other small-scale bombings.
This paper carries on the process of improving policy evaluations and estimates of the
patterns of transnational terrorism. At first, time-series-based policy evaluation relied on
intervention analysis, in which dummy variables identifying suspected impact points are tested
for significance for a single series (Cauley and Im, 1988; Enders et al., 1990). This intervention
procedure was later extended to vector-autoregressive (VAR) analysis to capture the
interrelationship among two or more series (Enders and Sandler, 1991, 1993, 1996; Nelson and
Scott, 1992), so that the introduction of, say, metal detectors in airports may curtail skyjackings
but augment hostage-taking events (e.g., kidnappings), not protected by these detectors, as

4
terrorists substitute among modes of attacks in response to policy-induced changes in relative
costs. These VAR studies, like their single-series predecessors, assumed linear representations
with no regime-switching possibilities. Hence, the current exercise represents an important
departure where nonlinear techniques are also applied to the DEATH series, which displays the
greatest deterministic factors. These techniques not only allow the mean of the DEATH series to
differ according to the overall intensity of activities, but they also permit the data to indicate
points at which things become different.
In the next section, we present the terrorists' choice-theoretical model that underlies some
of the empirical findings. This is followed by some important intervention points and a
description of the data. The ensuing section distinguishes the dummy-variable intervention
analysis from the nonlinear threshold model. Next, the regime-switching model is introduced,
followed by the actual estimations. The Fourier-approximation model is estimated in the next
section. The next-to-last section addresses the implications of this article and our prior work on
the aftermath of the attacks on the World Trade Center and the Pentagon. Concluding remarks
are then given.
THEORETICAL MODEL
Our application is to transnational terrorism which has become much more prevalent
during the last thirty years as terrorists have taken advantage of improvements in
communication, transportation, and technology to intimidate a global community with threats of
violence unless their political demands are met. Transnational terrorist incidents are examples of
transboundary externalities, because actions by terrorists or reactions by governments in one
country may impose uncompensated costs or benefits on the people or property of another

5
country.6 Thus, a government plagued with terrorism on its soil may spend too much on
deterrence in an effort to transfer the attack elsewhere, or else a terrorist group may achieve
maximum news coverage by staging their attack in a European capital. When an incident is
planned in one country, but executed in another, it is a transnational event. The kidnapping or
assassination of a citizen from another country in a host country is a transnational terrorist act, as
is a bombing directed at one or more foreign citizens. A skyjacking of a flight that originates in
country A, but that ends in country B, is transnational. If, however, the targeted flight has
passengers from two or more countries, the skyjacking is transnational even if it never takes off.
We focus on transnational terrorism not only because of its importance to international studies,
but also because of the availability of a long consistently coded time series. Moreover,
transnational terrorism poses an important threat to the stability of the global community. The
events of 11 September have not only disrupted air travel, but may have pushed the global
economy, already on the brink, into recession. By increasing cross-border interactions,
globalization can augment the ramifications of catastrophic transnational terrorist events.
Like any agent, terrorists' resources in any period are limited and constrain their actions
to pursue satisfaction derived from a political cause. Because our focus is on the entire series of
terrorist events, terrorists are depicted as allocating their resources between terrorist events (t)
and legal actions (ℓ) so as to maximize their expected utility [E(U)]. Terrorist events includes
bombings, skyjackings, assassinations, and other actions, while legal activities include
propaganda statements and gaining a foothold within a base country or countries of operation. A
terrorist group is viewed as allocating scarce resources, R, between legal activities with a certain
gain, gℓ, and terrorist activities with an uncertain gain, gt. A terrorist incident may end in at least
two states: success where the incident is completed as planned, or failure where the incident is
either not completed or fails in its goal. Success is a random variable whose probability is π. If

6
only two states of the world are permitted for terrorist events, then (1 – π) denotes the probability
of failure. A terrorist group's expected utility is
( ) ( ) (1 ) ( ),S FE U U W U W (1)
where U(W) is the standard von Neumann-Morgenstern utility function. Arguments WS and WF
are the net wealth equivalent measures over the two states of success, S, and failure, F. These
measures equal:
1( ) ( , )S t tW w g R g R e , (2)
2( ) ( , )F tW w g R f R e . (3)
In equation (2), the net wealth derived from a successful terrorist incident includes the group's
current assets net of current earnings, w, the monetary equivalent net gains from legal activities,
and the monetary equivalent net gains from the terrorist act. Rℓ represents the resources assigned
to legal actions, and Rt indicates the resources assigned to terrorism actions. In either state of the
world, monetary gains depend directly on the resources (including time) allocated by the
terrorists to either legal activities or the terror campaign, and these gains are assumed to display
diminishing returns.7 In equation (2), e1 represents the environmental factor that also helps
determine gain during a successful outcome. For example, e1 can reflect actions taken by the
authorities (e.g., freezing assets, retaliatory raids, freedom of press) that influence the benefits of
a terrorist success. As such, e1 denotes a shift parameter.
In equation (3), the net wealth for a terrorist failure includes a group's current assets plus
its net gain from legal activities minus the monetary value of the fine or penalty, f, from failure.
If the group fails but escapes, then this penalty includes wasted resources expended on the
unsuccessful event. When, however, the group is captured, the fine refers to the wasted
resources (including murdered terrorists), the opportunity costs of incarceration, and any
monetary penalties assessed. The loss of one or more terrorists results in the costs of training

7
replacements. In f(•), e2 denotes an environmental factor that influences the level of losses
during failed campaigns. This factor includes activities taken by authorities, such as the severity
of sentences and extradition requests. Once again, e2 represents a shift parameter of the model.
The terrorist group's resource constraint,
R = Rt + Rℓ, (4)
closes the model and indicates that the group's total resources, R, are divided each period
between legal and terrorist activities. Expected utility in equation (1) can be rewritten in terms
of the choice variables (Rℓ, Rt) and the exogenous shift parameters by substituting equations (2)-
(4) into (1). Both the optimal levels of Rℓ and Rt are then determined by maximizing the
resulting expression for expected utility. The likely effects of government policy decisions
resulting from changes in π, e1, and e2 are found through comparative-static analysis, where the
assumption of the model are used to determine the influence that changes in these policy
parameters have on the optimal choice of Rℓ and Rt. Often, additional assumptions concerning
the terrorist group's risk attitudes can help sign these comparative-static impacts.
Some results are fairly clear-cut without further mathematical analysis. Actions by the
authorities to decrease the terrorists' total resources through raids on their camps, infiltration of
the group, or by freezing their assets will curtail both legal and terrorist activities. If a retaliatory
raid were to increase the terrorists' perceived gains from terrorist attacks as means of protest,8
then the terrorists will shift resources out of legal activities into terrorist acts. During periods of
high terrorist activities, this ability to sustain even a greater level of terrorist acts is limited in
contrast to periods of low activities.
Thus far, we represent the problem as the choice-theoretic decision of a single terrorist
group. From the early 1970s, terrorist groups, engaged in transnational acts, have been tied
either explicitly or implicitly in networks consisting of left-wing terrorist groups (Alexander and

8
Pluchinsky, 1992) united in their goal to overthrow democratic governments, Palestinian groups
united in their aim to establish a homeland or to destroy Israel, and fundamentalist terrorist
groups (Hoffman, 1998; US Department of State, 2001) united in their goal to create nations
founded on fundamentalist principles. Since the start of 1980, the number of religious-based
groups has increased as a proportion of the active terrorist groups: 11 of 48 groups in 1992, 16
of 49 groups in 1994, and 25 of 58 groups in 1995 (Hoffman, 1997:3). Bin Laden's al-Qaida
network includes Islamic extremist organizations in many countries, which are linked through
finances, training, and a common enemy. This network includes such groups as Abu Sayyaf (the
Philippines), Egypt's Islamic Group, Harakat ul-Mujahidin (Pakistan), Islamic Movement of
Uzbekistan, Al-Jihan (Egypt), and Bin Laden's own group (Afghanistan) (US Department of
State, 2001). Even left-wing groups and Palestinian groups have been known to train together
and to have other ties (Wilkinson, 1986, 2001; Hoffman, 1998), so that separate networks have
explicit links to one another. Implicit ties come from copying each other's tactics – the so-called
demonstration effect. These networks' common hatred of the United States and Israel means that
heightened attacks by groups in one part of the world can spark increased attacks in other parts
of the world. This implicit coordination shows up as distinct cycles of peaks and troughs in
transnational terrorist activities (Enders et al., 1992; Enders and Sandler, 1999).
Thus far, we have only considered the terrorist choice between legal and terrorist
activities. Another choice by the terrorists must, however, be made in allocating Rt among
alternative modes of attacks so as to equate the expected marginal gain per dollar spent on
alternative operations. Actions by the government to increase the difficulty (i.e., the price) of
one kind of attack will cause the terrorists to substitute into other types of attacks that now
appear to be relatively cheaper (Sandler, Tschirhart, and Cauley, 1983; Enders and Sandler,
1993). Thus, it is essential for authorities to impose policies that cause the terrorists to substitute
9
into less harmful modes of attacks. Authorities have not always been successful in this aim –
e.g., increased US embassy security led to a decrease in such attacks, which usually resulted in
no injuries, and to an increase of assassinations of embassy personnel as they left secure grounds
(Enders and Sandler, 1993). In light of these substitutions, the authorities must also raise the
difficulty of all modes of attacks – e.g., by limiting terrorist resources or through intelligence on
terrorist operations.
INTERVENTIONS AND THE DATA
Six interventions or suspected changes to the terrorist time series are germane to our
analysis and discussion. These interventions are listed in Table 1 along with their abbreviations,
description, and initiation period. Although our interest is to apply a methodology that allows
for ex post data identification of significant changes in the time series, these ex ante influences,
due to either policy changes (i.e., metal detectors at airports, enhanced embassy security, or a
retaliatory raid) or political events (i.e., the rise of religious fundamental terrorism or the start of
the post-cold era),9 are required for updating the linear intervention-based analysis to 1999 and
for comparing this latter analysis to the nonlinear techniques presented at a later point. In
previous papers, five of these six interventions resulted in significant shifts to the aggregate
terrorist series and its various component series. The sole exception is the US retaliatory raid on
Libya, which resulted in just an immediate impact that dissipated rapidly as the series returned to
its pre-intervention mean.10
Data on transnational terrorism incidents are drawn from International Terrorism
Attributes of Terrorist Events (ITERATE), which records, among other things, the incident date,
its location, type of event, and casualties (i.e., deaths or injuries), if any. ITERATE 2 covers
10
1968-77 (Mickolus, 1982), ITERATE 3 covers 1978-87 (Mickolus, Sandler, Murdock and
Fleming, 1989), and ITERATE 4 covers 1988-91 (Mickolus, Sandler, Murdock and Fleming,
1993). To bring the data set up to date, we coded the necessary variables for 1992:1-1999:4
based on written descriptions provided by Mickolus. Coding consistency for ITERATE 2 and its
various updates has been preserved by applying the same criteria for defining transnational
events and associated variables. This consistency was enhanced owing to an overlap among
coders and monitors – e.g., Sandler participated in the coding of the data for 1977:1-1999:4.
ITERATE drew its information from the world print and electronic sources including the
Associated Press, United Press International, Reuter tickers, major US newspapers (e.g., the
Washington Post and the New York Times), and the Foreign Broadcast Information Service
(FBIS). The FBIS Daily Reports, which draws from hundreds of world print and electronic
media sources, served as the single most important source up through the start of 1996.11
ITERATE does not contain information about state sponsorship, because countries keep this
information secret; hence, we cannot distinguish such events in our analysis.
ITERATE does not classify incidents as transnational terrorism that relate to declared
wars or major military interventions by governments (e.g., Chechnyan acts against Russian
military personnel), or guerilla attacks on military targets conducted as internationally
recognized acts of belligency. If, however, the guerilla attacks were against civilians or the
dependents of military personnel in an attempt to create an atmosphere of fear to foster political
objectives, then the attacks are considered terrorism. Palestinian acts in Israel that do not harm
foreigners are not classified as transnational terrorism. While a domestic event may become
transnational if a foreigner is the unintended victim, instances of this are rare. If this randomness
of victims was great, then the large number of US victims, who are the intended target on
average of about 40 percent of all transnational acts (US Department of State, 1989-2001), would

11
not consistently characterize the data totals each year. Official government-sanctioned acts in
response to terrorist attacks, such as the US bombing of Libya or US seizure of an Egyptian
plane carrying the terrorists from the Achille Lauro incident, are not themselves coded.
ITERATE also excludes unintended acts from the data set. If, for example, a foreign newspaper
reporter is killed in the cross fire between government troops and guerillas, the reporter's death is
not considered a terrorist assassination. ITERATE, however, does code terrorist acts against
foreign aid workers or UN peacekeepers.
We extract three quarterly time series from ITERATE: (i) a DEATH series, where one or
more individuals died as a result of the incident; (ii) a WOUNDED series, where one or more
individuals were injured, but no one died, as a result of the incident; and (iii) a
NONCASUALTIES series, where no one died or was injured as a result of the incident. We use
terrorist incident “count” data computed on a quarterly, rather than weekly or daily, basis to
eliminate zero-valued observations, inconsistent with the underlying normal distribution
assumption of the various autoregressive (AR) analyses (Harvey, 1989). Based on Enders and
Sandler (2000), we shall focus on the DEATH series, which has the most deterministic factors of
the three series owing to its intensity. This earlier study showed the NONCASUALTIES series
to be essentially random after detrending and the WOUNDED series to be less deterministic than
the DEATH series. Nevertheless, we shall apply our analysis to all three series.
DUMMY VARIABLES VERSUS THE THRESHOLD MODEL
A number of papers have tried to estimate and forecast transnational terrorist events. One
key issue is to ascertain the effects of various policy interventions and political events on the
occurrence of transnational terrorism. For example, Enders and Sandler (2000) estimated the

12
following autoregression (with t-statistics in parentheses):
yt = 4.037 + 0.406 yt-1 + 5.62 METALt – 0.26 EMB76t – 5.92 EMB85t (1.77) (3.22) (2.28) (–0.11) (–3.20)
– 7.93 LIBYAt + 4.17 FUNDt + 6.77POSTt (5) (–1.30) (1.89) (3.19) where yt is the quarterly number of incidents with one or more deaths. METALt, EMB76t,
EMB85t, LIBYAt, FUNDt, and POSTt are all dummy variables that represent the various
intervention points as defined previously in Table 1.
The use of dummy variables in this fashion yields some interesting findings. The impact
of metal detectors in airports is estimated to have increased the number of incidents with deaths
by 5.62 incidents per quarter, implying a substitution from skyjackings into more deadly
events.12 The steady-state value of this increase rises to 9.46 [= 5.62/(1 – 0.406) ] incidents per
quarter. Fortification of U.S. embassies in 1985, but not in 1976, is found to decrease the short-
run number of incidents with deaths by 5.92 incidents per quarter, but with a long-run effect of
9.97 fewer incidents per quarter. Moreover, the break-up of the Soviet Union is found to have a
large positive impact on terrorism: the immediate impact effect is estimated to be 6.77 incidents
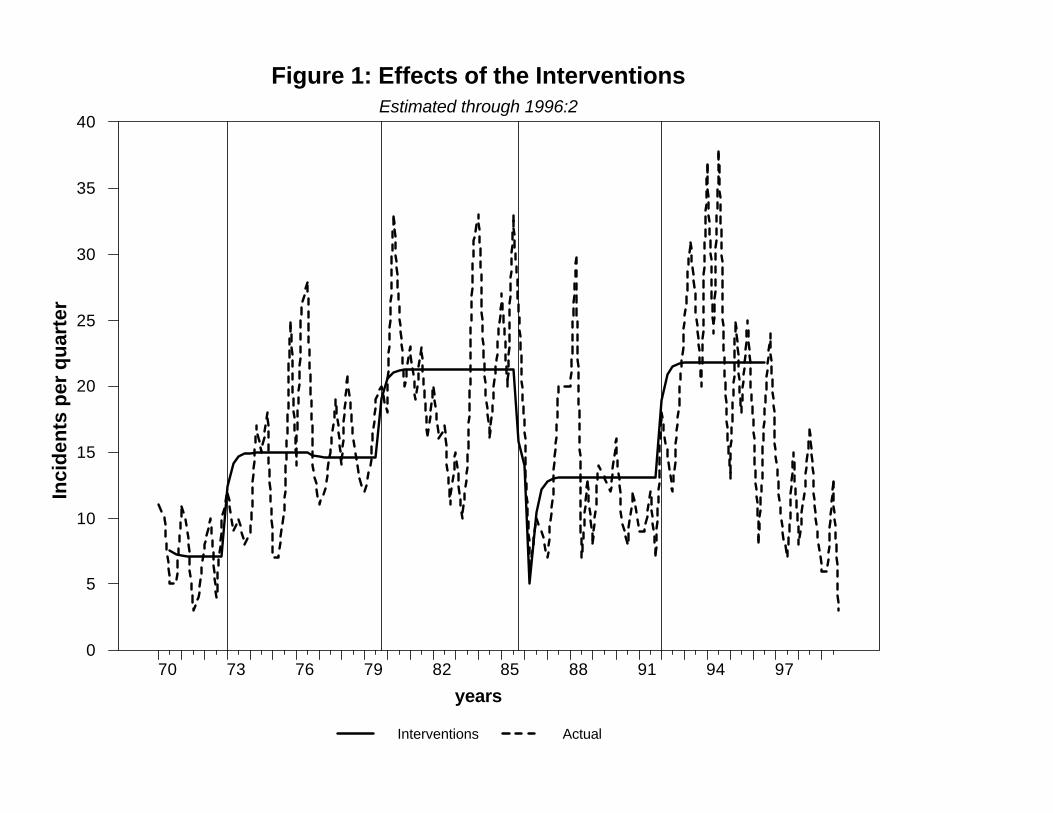
per quarter rising to a total of 11.4 incidents per quarter. In Figure 1, incidents per quarter are
measured on the vertical axis and the years on the horizontal axis. The dashed line represents the
actual number of fatal incidents, while the vertical lines indicate the four significant intervention
dates. The solid locus with horizontal segments shows the estimated magnitudes of the effects of
the interventions. To depict the impact of each intervention, we set y1 equal to the actual value
of death incidents in 1970:1 and generated the remaining values using equation (5). It is clear
from Figure 1 that the mean number of incidents rose from about 6.5 to about 16 per quarter after
the installation of metal detectors in 1973. The values are shown through only 1996:2 since
equation (5) was estimated using data from 1970:1 to 1996:2.

13
Some words are instructive about the political events behind some of the various peaks in
Figure 1. The peaks in 1976 and 1977 are primarily attributed to activities of Palestinian groups
outside of Israel and left-wing European terrorists (Mickolus, 1982). The spikes in 1981, 1983,
and 1985 are due to terrorist activities by left-wing groups in Europe and South America, as well
as from spillover terrorism from the Middle East (Mickolus et al., 1989). The Libyan retaliatory
raid by the United States and the backlash it caused are behind the peak in 1986. Numerous
Middle-East-motivated deadly terrorist attacks, coupled with Afghan rebel attacks in Pakistan,
led to the spike in 1988 (US Department of State, 1989). Finally, the peaks in the early 1990s
are rooted in religious fundamentalism (by HAMAS and others) and in separatism (in Sri Lanka)
(US Department of State, 1990-96). Actions by the Kurdish Workers Party in Turkey and by
narcoterrorists in Colombia also contributed to these totals. The Afghanistan War trained many
individuals with fundamentalist views, who account for many lethal events in the 1990s and
beyond.
The use of multiple dummies, however, raises a number of concerns as follows:
1. There is a danger of ex post fitting if the break points’ dates are chosen as a result of
an observed change in the variable of interest, then test statistics lose their importance. Clearly,
with enough dummy variables, any series can be fitted to any degree desired. The problem is
reinforced by the fact that the starting dates for the FUND and POST variables were found by a
grid search method, for which the two starting dates were those that maximized the overall fit of
the regression (Enders and Sandler, 1999, 2000). There is, however, less of a problem if
interventions are chosen ex ante based on hypothesized changes to the data that are then tested
for significance.
2. Other incidents that roughly coincide with the break point dates may, in part, be
responsible for the observed change in the series. For example, events surrounding the demise of

14
the Soviet Union (as measured by POST) came about the time of the war in Kuwait. As
recognized by Enders and Sandler (2000), it is exceedingly difficult to distinguish between the
influences of two near, but distinct, events.
3. The efficacy of the estimates cannot rely on the usual asymptotic properties of an
autoregression. If there is a single break point, Lutkepohl (1991) showed that the standard
asymptotic properties hold if it is assumed that observations on both sides of the break increase
as sample size increases, but that a “logical problem” arises in the presence of multiple breaks.
Given that there are a fixed number of observations lying between EMB76 and EMB85,
increasing the sample size does nothing to increase the number of points lying between these two
break points. Lutkepohl (1991:410) stated that “… the large sample 2-distribution … may be
used if the periods between the interventions is reasonable large. Since no small sample results
are available it is not clear, however, how large is large enough to obtain a good approximation
to the asymptotic 2-distribution.”
4. The interventions need not be modeled as [0, 1] dummy variables; for example, Enders
et al. (1990) used an alternative form for the METAL dummy. Although the United States began
installing metal detectors in its airports in the first quarter of 1973, it took almost a full year for
installation to be completed internationally at major airports. As such, they used an intervention
variable equal to 1/4 in 1973:1; 1/2 in 1973:2; 3/4 in 1973:3; and 1 in 1973:4. More generally,
interventions can have temporary or permanent effects on a series that may grow or fade over
time. The standard way to determine the ‘best’ form of the intervention variable is to use the one
that provides the best in-sample fit.
5. The effects of the different dummies may overlap each other. This could be especially
problematic if there is any misspecification in the way that each dummy is allowed to affect the
system. For example, instead of being a 0 versus 1 dummy, suppose that the importance of
15
Islamic fundamentalism has grown over time. The POST variable will then capture some of this
effect, leading some of the subsequent increase in terrorism resulting from FUND to be wrongly
attributed to POST.
6. The effects of the interventions are allowed to affect only the mean of the series, even
though the autoregressive coefficient(s) may themselves be affected by the changes.
7. Finally, there may be other events that influence terrorism, not included in the model –
e.g., political events in the Middle East or Latin America may have had profound effects on the
terrorism series.
Some of the problems with multiple dummy variables are apparent when we re-estimate
equation (5) using an updated version of ITERATE with observations for 1996:3-1999:4. After
incorporating these 14 additional observations into the data set, we obtain the following
regression estimates of the DEATH series:
yt = 4.10 + 0.423 yt-1 + 4.71 METALt – 0.479 EMB76t – 4.91 EMB85t (2.10) (4.98) (1.89) (–0.201) (–2.65)
– 8.64 LIBYAt + 4.02 FUNDt + 2.50 POSTt, AIC = 1008.2, SBC = 1030.4, (6) (–1.37) (1.82) (1.48) where AIC is the Akaike Information Criteria and SBC is the Schwartz Bayesian Criteria.13 If
we omit EMB76t and LIBYAt we obtain:
yt = 4.15 + 0.417 yt-1 + 4.54 METALt – 5.29 EMB85t + 3.80 FUNDt + 2.87 POSTt, (7) (2.13) (4.93) (1.99) (–2.88) (2.11) (1.72)
AIC = 1006.3, SBC = 1022.9.
Even if we use equation (7), it is striking that METALt is barely significant at the 5% level
and POSTt is not significant at the 5% level. Moreover, the absolute values of the magnitudes of
the coefficients and the associated t-statistics for EMB85t and FUNDt are all closer to zero than
in equation (5). Thus, when we use the updated data, it appears that the interventions were not
that important for the DEATH series after all. To explain the erosion in the coefficients and their

16
significance, we note that the number of incidents with deaths declined throughout the updated
sample period (see the extended portion of the dashed line in Figure 1), so that the magnitude of
the jump in incidents attributed to the demise of the Soviet Union was not sustained. Moreover,
the decrease in the overall mean of the incident series pushed the t-statistics for the previously
significant interventions closer to zero. Quite simply, the recent decline in the number of
DEATH incidents makes it difficult to interpret the importance of the previous interventions.
Perhaps, the importance of POSTt had just a temporary effect lasting only a few years (see our
previous point 4); there may have been other influences not captured by the interventions (see
point 7); or the original effect of POSTt was due to overfitting (see point 1). Of course, it would
be possible to capture the decline in terrorism with yet another dummy for the 1996:3-1999:4
period, but, this simply compounds the problems encountered when using multiple interventions.
A word of caution and clarification is in order before we present some nonlinear time
series methods for addressing these issues. Linear intervention analysis has its place if
intervention points are chosen ex ante based on theoretical priors. For a skyjacking time series,
the significant of metal detectors would remain even with the addition of another few years of
data because these detectors had such a large and sustained impact on skyjackings. The
influence of metal detectors on the DEATH series, which includes all incidents and not just
skyjackings, is apt to be more tenuous as equations (6)-(7) indicate. Thus, our exploration of
alternative time series methods is not intended to dismiss intervention analysis when used with
theoretical priors in the proper setting.
REGIME-SWITCHING ESTIMATION
One way to circumvent some of the above problems is to estimate the DEATH series

17
using a type of regime-switching model. Intuitively, there may be several states of the world and
the severity of terrorism may differ in each. Suppose, for example, that a political event or
policy intervention occurs that causes the amount of terrorism to switch into the high state.
Since terrorists are using relatively large amounts of their scarce resources, it would be
surprising to find that attacks exhibit a high degree of persistence in the high state. Terrorism
could persist in this high state for a while until another event takes place that switches the system
into the low state. Terrorism could then remain low until yet another political or policy shock of
sufficient magnitude occurs that switches the system back into the high state. If our theoretical
model about resource allocation is correct, then we anticipate that activity levels above the
estimated mean of the series for the high state cannot last for long, unlike the low-state scenario
where terrorist resources are not stretched and departures from the mean can persist. The cause
of the shock sufficient to switch the system could be unknown to the researcher; nevertheless, it
is possible to estimate the behavior of the terrorist incidents in the various states.
Consider a two-regime version of the threshold autoregressive (TAR) model developed
by Tong (1983, 1990):
t
p
iitit
p
iititt y + I+y + Iy
10
10 )1( , (8)
where yt is the series of interest, the i, and i are coefficients or constants to be estimated, is
the value of the threshold, p is the order of the TAR model, and It is the Heaviside indicator
function:
.0
1
1
1
t
tt yif
yifI (9)
The nature of the system is that there are two states of the world. In the high-terrorism
state, yt-1 exceeds the value of the threshold so that It = 1 and (1 – It ) = 0, where yt follows the
18
autoregressive process, 0 + iyt-i. Similarly, in the low-terrorism state, yt-1 falls short of the
threshold , so that It = 0 and (1 – It ) = 1, where yt follows the autoregressive (AR) process,
0 + iyt-i. There are essentially two attractors or potential “equilibrium” values: the system is
drawn toward 0/(1 – i) in the high state and toward 0/(1 – i) in the low state. Moreover,
the degree of autoregressive decay will differ across the two states if for any value of i, i i.
The key feature of the TAR model is that a sufficiently large t shock can cause the system to
switch between states.
The momentum threshold autoregressive (M-TAR) model used by Tong and Lim (1980)
and Enders and Granger (1998) allows the regime to change according to the first-difference of
{yt-1}. Hence, equation (9) is replaced with
.0
1
1
1
t
tt yif
yifI (10)
The M-TAR model is useful in capturing situations in which the degree of autoregressive decay
depends on the direction of change in {yt}. For example, Enders and Granger (1998) showed
that interest rate adjustments to the term-structure relationship display M-TAR behavior. If,
however, all i = i, then the TAR and M-TAR models are equivalent to an AR(p) model.14
If τ is known, then the estimation of the TAR and M-TAR models is straightforward.
Simply set the indicator function according to equations (9) or (10) and form the variables Ityt-i
and (1 – It )yt-i. The coefficients of equation (8) can be estimated using ordinary least squares
(OLS), and the lag length p determined as in an AR model.15 When τ is unknown, Chan (1993)
showed how to obtain a super-consistent estimate of the threshold parameter. For a TAR model,
the procedure is to order the observations from smallest to largest such that:
y1 < y2 < y3 ... < yT. (11)
For each value of yj, let τ = yj, set the Heaviside indicator according to equation (9), and estimate
19
an equation in the form of equation (8). The regression equation with the smallest residual sum
of squares contains the consistent estimate of the threshold. In practice, the highest and lowest
15 percent of the {yj} values are excluded from the grid search to ensure an adequate number of
observations on each side of the threshold. For the M-TAR model, equation (11) is replaced by
the ordered first-differences of the observations.
Notice that the TAR model overcomes a number of the problems involved with the use of
dummy variables. Most importantly, the dates of the regime switch at which the series passes
the threshold are not specified ex ante by the researcher; instead, the data itself determine
whether the series is in the high- or low-terrorism state. Since there are no specific intervention
points, the standard asymptotic properties of the estimates hold. For example, the asymptotic
properties of the estimates are such that individual coefficients can be tested using standard t-
statistics and joint restrictions – such as the symmetry restriction that all i equal all i – can be
tested using an F-test. Obviously, there are no overlapping dummy variables and the alternative
regimes are allowed to affect the degree of autoregressive decay as well as the mean of each
series. If, therefore, the goal is to determine the magnitude of any specific intervention, such as
the effect of the end of the Cold War, then the TAR model is not especially useful, because it
includes no exogenous variables. This again emphasizes that alternative time series methods can
fulfill different purposes making them complementary.
THE ESTIMATED THRESHOLD MODEL
We begin by estimating the DEATH series as a threshold autoregressive process with a
single lagged value. As indicated by equation (7), we search over all potential thresholds to
obtain (with t-statistics in parentheses):

20
yt = [ 19.95 + 0.07yt-1 ] It + [ 7.09 + 0.47yt-1 ] (1 – It ), (12) (4.63) (0.38) (3.10) (2.39)
where the estimate of the threshold is = 18. If we purge the model of the insignificant lagged
coefficient occurring whenever yt-1 18 and re-estimate the model, we obtain:16
yt = [ 21.53 ] It + [ 7.09 + 0.47yt-1 ] (1 – It ), (13) (23.02) (3.12) (2.41) AIC = 1005.4, SBC = 1016.5.
Diagnostic checking indicates that the model is appropriate. For example, the first eight
autocorrelations of the residuals are less than 0.13 in absolute value and the Ljung-Box Q-
statistics for 4, 8, and 12 lags indicate that there are no significant residual correlations at
conventional levels. We also estimate the model setting p = 2, and find that the coefficients of
yt-2It and yt-2 (1 – It) are both insignificant. We set the indicator function using the M-TAR
specification. Our estimated models never fit the data as well as the TAR models reported
above.17 Finally, Tsay’s (1989) method of arranged autoregressions do not yield any evidence of
multiple thresholds.
For comparison purposes, we estimate the DEATH series as a linear autoregression. The
best-fitting model is the following AR(1) equation:
yt = 6.81 + 0.56yt-1, AIC = 1012.1, SBC = 1017.7. (14) (5.03) (7.25) Notice that AIC and SBC both select the TAR model over the linear model. In addition, as
measured by either criteria, the TAR model fits better than either intervention model reported in
equations (6) and (7). This is particularly important since the TAR model makes no use of the
“explanatory” variables employed in the intervention model. In fact, the SBC actually selects the
linear model over either of the intervention models!
The threshold model yields very different implications about the behavior of the terrorism
DEATH series than the linear models. The linear AR(1) model indicates that the sequence

21
convergences to the long-run mean of approximately 15.5 incidents per quarter [ 6.81 (1.0 –
0.56) 15.5 ]. Moreover, the degree of autoregressive decay is always constant. Regardless of
whether the number of incidents is above or below the mean, the degree of persistence is
estimated to be 56%. In contrast, the estimated threshold model in equation (13) suggests there
is no single long-run equilibrium value for the number of incidents, since there are high- and
low-terrorism regimes or states. In the low state, the system gravitates toward 13 incidents per
quarter [ 7.09 (1.0 – 0.47) 13 ]. The point estimates of this low-state regime are similar to
those of the linear AR(1) model. When the number of incidents exceeds the 18-incident
threshold, there tends to be an immediate jump to 21.53 incidents per quarter. Whenever the
number of incidents exceeds 21.53, we estimate that there will be an immediate decline to 21.53
incidents in the subsequent quarter, so that, there is no persistence for terrorist activity exceeding
the key value of 21.53 incidents.18 The high-incident state can be maintained until a shock of
sufficient magnitude causes a switch of regime; but, the number of events in this high-incident
state cannot be maintained at more than 21.53 incidents. Since the estimated standard deviation
of {εt} is equal to 6.14, the magnitude of a typical shock is likely to cause a regime switch. In
fact, we uncover a number of short-lived terrorist campaigns of heightened activity (including
one immediately following POST) – see Figure 1.
We also examine other incident series for threshold autoregressive effects. We find no
evidence of any autoregressive behavior in the non-causality series, which is dominated by
threats, hoaxes, letter bombs, and other low-intensity activities. As these incidents use few
resources, it is to be anticipated that they contain no predictable pattern. The number of
incidents containing wounded individuals (but no deaths) appeared to be a symmetric AR(2)
process. One explanation is that a TAR specification is not appropriate to capture the form of the
non-linearity in this series. Another is that these incidents use few resources relative to incidents

22
with deaths, so that there may not be any important differences in the persistence of this type of
terrorism.
THE FOURIER APPROXIMATION
As indicated above, the TAR model cannot ascribe the effects of a regime switch to any
particular event. An alternative way to capture any potential non-linearity's in the data is to use
the methodology of Ludlow and Enders (2000), where a simple modification of the
autoregressive framework allows the autoregressive coefficient to be a time-dependent function
denoted by α(t). For simplicity, consider an AR(1) process without an intercept term. If α(t) is
an absolutely integral function, for any desired level of accuracy, then it is possible to write:19
yt = α(t)yt-1 + εt, (15)
with sin coss
0 k k
k=1
2 k 2 k(t)= + t + t A A B
T T
,
where s refers to the number of frequencies contained in the process generating α(t).20
The key point is that the behavior of any deterministic sequence can be readily captured
by a sinusoidal function even though the sequence in question is not periodic. As such, non-
linear coefficients may be represented by a deterministic time-dependent coefficient model
without first specifying the nature of the asymmetry. The nature of the approximation is such that
the standard ARMA model emerges as a special case. If the actual data-generating process is
linear, all values of Ak and Bk in equation (15) should be zero. Thus, instead of positing a
specific model, the specification problem is transformed into one of selecting the proper
frequencies to include in equation (15). Ludlow and Enders (2000) called the approximation in
equation (15) an F-ARMA process. Since the value of s can be large, the estimation problem is
23
to determine the particular Fourier coefficients to include in the analysis.
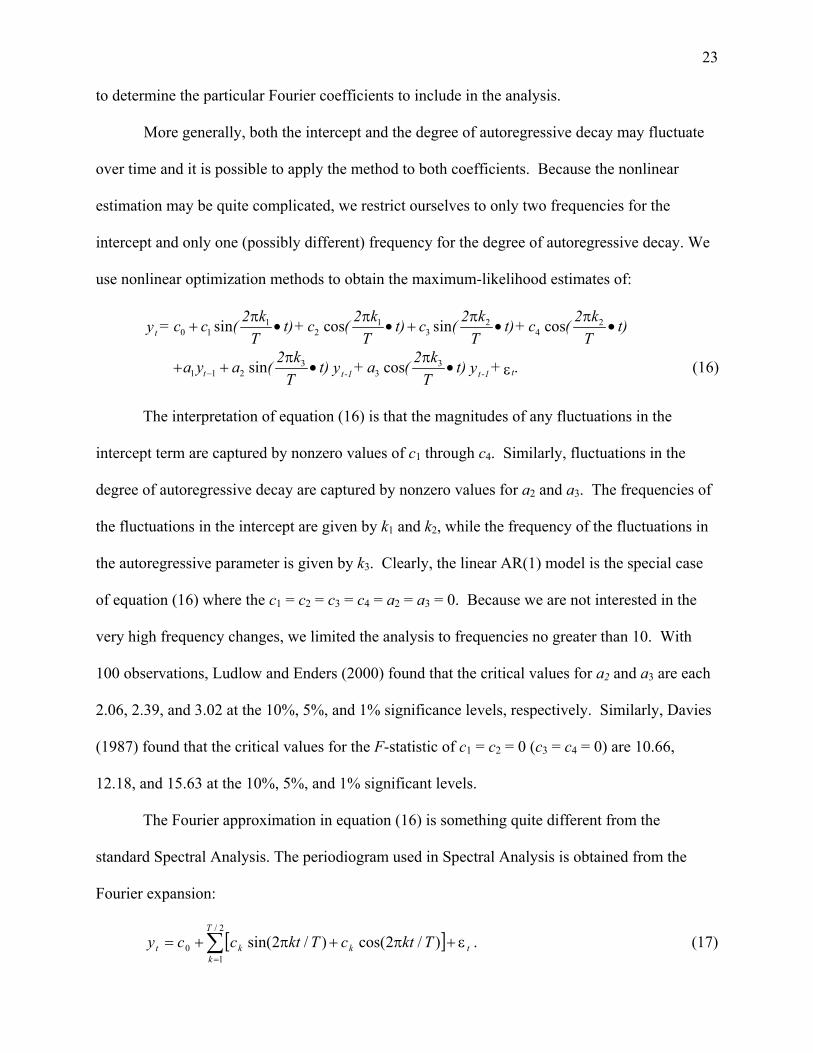
More generally, both the intercept and the degree of autoregressive decay may fluctuate
over time and it is possible to apply the method to both coefficients. Because the nonlinear
estimation may be quite complicated, we restrict ourselves to only two frequencies for the
intercept and only one (possibly different) frequency for the degree of autoregressive decay. We
use nonlinear optimization methods to obtain the maximum-likelihood estimates of:
1 1 2 20 1 2 3 4sin cos sin cost
2 k 2 k 2 k 2 k = c c ( t) + c ( t) c ( t) + c ( t) y
T T T T
3 31 1 2 3sin cos .tt t -1 t -1
2 k 2 ka y a ( t) + a ( t) + y y
T T
(16)
The interpretation of equation (16) is that the magnitudes of any fluctuations in the
intercept term are captured by nonzero values of c1 through c4. Similarly, fluctuations in the
degree of autoregressive decay are captured by nonzero values for a2 and a3. The frequencies of
the fluctuations in the intercept are given by k1 and k2, while the frequency of the fluctuations in
the autoregressive parameter is given by k3. Clearly, the linear AR(1) model is the special case
of equation (16) where the c1 = c2 = c3 = c4 = a2 = a3 = 0. Because we are not interested in the
very high frequency changes, we limited the analysis to frequencies no greater than 10. With
100 observations, Ludlow and Enders (2000) found that the critical values for a2 and a3 are each
2.06, 2.39, and 3.02 at the 10%, 5%, and 1% significance levels, respectively. Similarly, Davies
(1987) found that the critical values for the F-statistic of c1 = c2 = 0 (c3 = c4 = 0) are 10.66,
12.18, and 15.63 at the 10%, 5%, and 1% significant levels.
The Fourier approximation in equation (16) is something quite different from the
standard Spectral Analysis. The periodiogram used in Spectral Analysis is obtained from the
Fourier expansion:
t
T
kkkt TktcTktccy
2/
10 )/2cos()/2sin( . (17)

24
In particular, Spectral Analysis uses all possible integer frequencies in the interval k = [1, T/2] in
order to assess relative contribution of high, medium, and low frequencies to the total variation
of {yt}. Instead, equation (16) uses only the two most significant frequencies in order to
approximate a time-varying intercept term. This is supplemented by a (possibly) third frequency
to approximate a time-varying degree of autoregressive decay. Estimating (16) and eliminating
the coefficient with t-values less than 1.96 in absolute value, we obtain:21 c0 = 11.84 (11.77), c1
= –3.24 (–5.63), c3 = –2.85 (–5.31), a1 = 0.24 (4.05) and a3 = –0.14 (–2.96), where t-statistics are
in parentheses. In addition, the frequencies are k1 = 2.105, k2 = 3.23, and k3 = 6.80.
Given that there are two frequencies for the intercept and that the degree of
autoregressive decay oscillates, the time path for the estimated series is highly nonlinear. In
order to depict the estimated movements of {yt}, we set y1 equal to the actual number of
incidents in 1970:1 and generated the values through 1999:4 using our estimated coefficient
values. The resulting series is shown as the fluctuating solid line in Figure 2.22 For comparison
purposes, we also include the actual number of incidents and the effects of the interventions
(now updated through 1999:4) that were shown in Figure 1.
The intervention and the F-ARMA models both suggest (i) an increase in DEATH
incidents after the installation of metal detectors in 1973 (METAL), (ii) an increase near 1979
(around the time of FUND), (iii) a sharp decline at the time of embassy fortifications in 1985
(EMB85), and (iv) a relatively constant time profile through 1992. Overall, the F-ARMA model
tracks the actual series much better than the intervention model. There are, however, some
interesting comparisons to be drawn from the different estimates of the intervention and Fourier
models. As displayed in Figure 2, the intervention model in equation (7) estimates that metal
detectors had a long-run impact of 7.79 incidents per quarter with the full impact on the DEATH
series being attained almost immediately. The Fourier model tells a different story. Beginning

25
in 1973:1, the estimated number of DEATH incidents rose steadily until the third quarter of
1976. If all of this increase can be ascribed to the deployment of metal detectors, the estimated
long-run impact is 14 DEATH incidents per quarter (22 estimated incidents for 1976:3 minus
eight estimated incidents in 1972:4). Part of the discrepancy between the two estimates might be
that the installation of the detectors was not immediate. The installation of these detectors in US
airports was immediate in 1973:1, while their installation in non-US airports took place more
gradually (Enders et al., 1990).
A very interesting comparison emerges with respect to the POST variable. The
intervention results in equation (7) give the long-run impact of POST to be 4.92 additional
DEATH incidents per quarter. In contrast, the Fourier model estimates that the DEATH series
gradually rose from approximately 11 to 27 incidents throughout the 1991-94 period. Thereafter,
DEATH incidents steadily declined until the end of the sample period.
IMPLICATIONS AND POLICY RECOMMENDATIONS
In this section, we shall draw some implications and policy recommendations in regards
to the events of 11 September 2001, based on the analysis of this paper and our cumulative work
on examining terrorist time series. The attack on the World Trade Center and the Pentagon came
during a time when transnational terrorism was in a relatively low-activity period. Retaliatory
strikes typically produce a shock to the time series that generates higher levels of attacks as
terrorists protest the action (Enders and Sandler, 1993). An intertemporal substitution occurs as
terrorists move attacks planned for the future into the present to demonstrate their displeasure.
The TAR analysis findings indicate that this heightened activity can be sustained for a long
period, because it will be coming during a low-activity period when resources can be shifted

26
from nonterrorist activities of these terror networks. Thus, nations associated with the alliance
forged by the United States must be vigilant for these increased attacks not only during the
period of military action begun on 7 October 2001, but also well after this period. This means
that national guard at US airports may need a longer deployment than originally planned (i.e.,
longer than six months).
All time series associated with terrorist events display cyclical behavior (Enders et al.,
1992; Enders and Sandler, 1999). This is also true of the time series with one or more casualties
(i.e., death or injuries). In Enders and Sandler (2000:322), the length of the cycles for the
casualties time series is just under two years. Thus, the trough in Figure 2 at the end of 1999 is
anticipated to be followed by a peak toward the end of 2001, which proved to be an accurate
prediction. Our work23 on the relationship between the rise of fundamentalist terrorism and
heightened casualties from terrorist attacks suggests that terrorist attacks as a reaction to
retaliatory strikes will involve a greater number of casualties than, say, the increased terrorism
following the US retaliatory raid on Libya in April 1986.
If there is a basic message from our work on the effects of policy interventions, it is that
piecemeal policy is ineffective.24 That is, efforts to secure US airports and borders will cause
terrorists to stage their attacks at other venues and in other countries against Americans. Quite
simply, terrorists respond to “higher prices” for one mode of attack stemming from a policy
intervention (e.g., better metal detectors and security screening at airports) by substituting into an
alternative mode where measures have not been taken. The installation of metal detectors in
airports cut down on skyjackings but was associated with an increase in other kinds of hostage-
taking events (Enders and Sandler, 1993). Despite recent events in New York and Washington,
DC, Americans are still most vulnerable abroad. Consider the statistics for 2000, during which
there were 423 transnational terrorist attacks worldwide. Although not a single such attack
27
occurred in the United States, 200 of these attacks were against US people or property (US
Department of State, 2001:1). This poses a real dilemma for the United States, because security
measures abroad cannot be dictated to other countries. Actions by the United States to protect its
diplomatic and military personnel abroad will make its unprotected citizens more inviting
targets.
The kinds of actions that work best accomplishes one of two outcomes: a reduction in
the resources of terrorists or an increased difficulty associated with all modes of attack.
Coordinated strikes to hit the al-Qaida network throughout the world are required to attain the
first outcome. Cooperative efforts worldwide to freeze al-Qaida’s assets would also foster the
first outcome. To raise the “price” of all modes of terrorist attacks, countries would have to
increase security throughout society, which impinges on personal freedoms in liberal
democracies. Moreover, such massive actions would be prohibitively costly to countries. A
cheaper means for accomplishing the second outcome would be better field intelligence so that
any kind of planned terrorist incidents can be stopped in the planning stage.
The fight against transnational terrorism presents a serious collective action problem to
nations confronting the threat of terrorist acts. Destroying a global terrorist network represents a
pure public good to all targeted nations, because its destruction yields benefits that are both
nonrival and nonexcludable among nations (Sandler, 1997:129-138). As such, nations are apt to
free ride on the efforts of the country or countries that perceive the greatest benefits from such
actions. Given the events of 11 September 2001, the country with the most at stake from
destroying this network is the United States, followed by the United Kingdom, which lost the
second greatest number of its citizens in the World Trade Center attack. The US interest is
bolstered by it being the primary target of transnational terrorism for the last couple of decades
(US Department of State, 1989-2001). Despite the invocation of Article 5 of the NATO Treaty,
28
the rooting out of the al-Qaida and other networks is anticipated to be primarily an American
operation. There is an irony here, because collective action among terrorist groups in sharing
training and financing has been quite substantial. To date, this suggests that terrorists are more
united in their common goals than are countries in addressing the transnational terrorist threat.
Perhaps, the recent horrors will change this collective action failure.
In the terrorists’ attempt for greater brutality and casualties to capture media attention, it
will be difficult to outdo the carnage or terror of 11 September. The casualties from the four
simultaneous skyjackings are equal to the cumulative deaths from all transnational terrorist
events between 1985 and 2000 (US Department of State, 1989-2001). This suggests that
symbolic targets at home and abroad that rival the World Trade Center or the Pentagon may be
chosen for the annual spectacular event that has characterized transnational terrorism over the
last 30 or so years. Another means for achieving greater casualties would be to resort to
weapons of mass destruction (e.g., biological or chemical agents) as portended by the Sarin
attack on the Tokyo subway on 20 March 1995 by Aum Shinrikyo.25 Clearly, transnational
terrorism has taken on a new threat level since 11 September.
This heightened threat level suggests that this date should be investigated as an
intervention point in future time series studies as time progresses. Have the events of this day
changed the pattern of transnational terrorism? For example, do future attacks involve greater
numbers of casualties? Has the mix of attack modes or where terrorist incidents are staged
changed since 11 September? These are questions for future time series investigations. Another
issue concerns the war on terrorism coordinated by the United States that started on 7 October
2001. The effectiveness of this war can be evaluated using intervention analysis, intervention-
VAR techniques, and TAR methods. Given its greater objective to root out terrorist networks,
this retaliatory war might have a more permanent impact than past episodic retaliations.

29
CONCLUDING REMARKS
Each advance in the study of time series provide a new method that can be applied to the
analysis of transnational terrorism. In the current paper, we have used a regime-switching model
to find turning points in the time series of events, for which one or more persons die. The so-
called DEATH series is used because it is more predictable than less-intense series where
individuals are either injured or unscathed. A regime-switching model offers a better fit than
either a linear AR(1) representation or an intervention representation, with one or more dummy
variables for policy changes. With the regime-switching depiction, increases in activity above
the mean are not sustainable during high-terrorism eras, while there is a 56% persistence for
changes around the mean during low-terrorism eras. This finding has implications for policy or
political decisions that may result in either a regime switch or else a shock, insofar as the
persistence of such shocks depends on whether terrorist activities are already running high or
low.
We also applied a Fourier approximation to the nonlinear estimates of the DEATH series
for 1970:1-1999:4. In so doing, we derive better estimates than those that characterize earlier
articles. Our Fourier-series-based estimates are superior in identifying recent downturns in the
lethality of transnational terrorism in the post-cold war era.
The appropriate technique depends on the issue under investigation – there is no time
series method best for all issues. The TAR model is best applied to a single time series at a time
in contrast to the VAR model. If, for example, the effectiveness of a policy intervention – e.g.,
heightened security measures at US airports in the wake of the 11 September attacks – is under
scrutiny, then intervention analysis applied to the study of multiple time series is the preferred

30
methodology. When a single time series is pertinent, TAR and intervention analysis can be both
applied to determine which results have the better statistical properties. In the case of the
DEATH series, TAR appeared to be the more appropriate representation.
31
References
Alexander, Y. and D. Pluchinsky (1992) Europe’s Red Terrorists: The Fighting Communist
Organizations. London: Frank Cass.
Brophy-Baermann, B. and J.A.C. Conybeare (1994) Retaliating Against Terrorism: Rational
Expectations and the Optimality of Rules Versus Discretion. American Journal of
Political Science 38:196-210.
Cauley, J. and E.I. Im (1988) Intervention Policy Analysis of Skyjackings and Other Terrorist
Incidents. American Economic Review Papers and Proceedings 78:27-31.
Chan, K.S. (1993) Consistency and Limiting Distribution of the Least Squares Estimator of a
Threshold Autoregressive Model. The Annals of Statistics 21:520-533.
Davies, R. (1987) Hypothesis Testing When a Nuisance Parameter is Present Only Under the
Null Hypothesis. Biometricka 74:33-43.
Enders, W. and C.W.J. Granger (1998) Unit-Root Tests and Asymmetric Adjustment with an
Example Using the Term Structure of Interest Rates. Journal of Business and Economic
Statistics 16:304-311.
Enders, W., G.F. Parise, and T. Sandler (1992) A Time-Series Analysis of Transnational
Terrorism: Trends and Cycles. Defence Economics 3:305-320.
Enders, W. and T. Sandler (1991) Causality between Transnational Terrorism and Tourism:
The Case of Spain. Terrorism 14:49-58.
Enders, W. and T. Sandler (1993) The Effectiveness of Anti-Terrorism Policies: Vector-
Autoregression-Intervention Analysis. American Political Science Review 87:829-844.
Enders, W. and T. Sandler (1996) Terrorism and Foreign Direct Investment in Spain and
Greece. KYKLOS 49:331-352.
Enders, W. and T. Sandler (1999) Transnational Terrorism in the Post-Cold War Era.

32
International Studies Quarterly 43:145-167.
Enders, W. and T. Sandler (2000) Is Transnational Terrorism Becoming More Threatening? A
Time-Series Investigation. Journal of Conflict Resolution 44:307-332.
Enders, W., T. Sandler, and J. Cauley (1990) Assessing the Impact of Terrorist-Thwarting
Policies: An Intervention Time-Series Approach. Defence Economics 2:1-18.
Harvey, A.C. (1989) Forecasting, Structural Time Series Models and Kalman Filter.
Cambridge: Cambridge University Press.
Hoffman, B. (1998) Inside Terrorism. New York: Columbia University Press.
Hoffman, B. (1997) The Confluence of International and Domestic Trends in Terrorism.
Terrorism and Political Violence 9:1-15.
Ludlow, J. and W. Enders (2000) Estimating Non-Linear Time-Series Models Using Fourier
Coefficients. International Journal of Forecasting 16:333-347.
Lutepohl, Helmut (1991) Introduction to Multiple Time Series Analysis. Berlin: Springer-
Verlag.
Mickolus, E.F. (1982) International Terrorism: Attributes of Terrorist Events 1968-1977
(ITERATE 2). Ann Arbor, MI: Inter-University Consortium for Political and Social
Research.
Mickolus E.F., T. Sandler, and J.M. Murdock (1989) International Terrorism in the 1980s: A
Chronology of Events, 2 vols. Ames, IA: Iowa State University Press.
Mickolus, E.F., T. Sandler, J.M. Murdock, and P. Fleming (1989), International Terrorism:
Attributes of Terrorist Events 1978-87 (ITERATE 3). Dunn Loring, VA: Vinyard
Software.
Mickolus, E.F., T. Sandler, J.M. Murdock, and P. Fleming (1993), International Terrorism:
Attributes of Terrorist Events 1988-1991 (ITERATE 4). Dunn Loring, VA: Vinyard
33
Software.
Midlarsky, M.I., M. Crenshaw, and F. Yoshida (1980) Why Violence Spreads: The Contagion
of International Terrorism. International Studies Quarterly 24:262-298.
Nelson, P.S. and J.L. Scott (1992) Terrorism and the Media: An Empirical Analysis. Defence
Economics 3:329-339.
Sandler, T. (1997) Global Challenges: An Approach to Environmental, Political, and Economic
Problems. Cambridge: Cambridge University Press.
Sandler, T. and H.E. Lapan (1988) The Calculus of Dissent: An Analysis of Terrorists’ Choice
of Target. Synthese 76:245-261.
Sandler, T., J.T. Tschirhart, and J. Cauley (1983) A Theoretical Analysis of Transnational
Terrorism. American Political Science Review 77:36-54.
Schmid, A.P. and A.J. Jongman (1988) Political Terrorism: A New Guide to Actors, Authors,
Concepts, Data Bases, Theories, and Literature. New Brunswick, NJ: Transaction
Books.
Scott, J.L. (2001) Media Congestion Limits Media Terrorism. Defence and Peace Economics
12:215-227.
Tong, H. (1983) Threshold Models in Non-Linear Time Series Analysis. New York: Springer-
Verlag.
Tong, H. (1990) Non-Linear Time-Series: A Dynamical Approach. Oxford: Oxford University
Press.
Tong, H. and K.S. Lim (1980) Threshold Autoregression, Limit Cycles and Cyclical Data.
Journal of Royal Statistical Society. Series B (Methodological) 42:245-292.
Tsay, R.S. (1989) Testing and Modeling Threshold Autoregressive Processes. Journal of the
American Statistical Association 84:231-240.

34
US Department of State (various years, 1989-2001) Patterns of Global Terrorism. Washington,
DC: US Department of State.
Wilkinson, P. (1986) Terrorism and the Liberal State, revised ed. London: Macmillan.
Wilkinson, P. (2001) Terrorism Versus Democracy: The Liberal State Response. London:
Frank Cass.

35
Footnotes
1. This definition captures the essential features of those in the literature. See Hoffman
(1988, chap. 1), Mickolus (1982), and Schmid and Jongman (1988).
2. Since no claim of responsibility or demands have been made in wake of the attacks,
no one knows for sure what these atrocities were intended to achieve. If the attacks were
directed by Osama Bin Laden, as the evidence suggests, then his demands are the ones listed in
parentheses.
3. The seminal study on the terrorist dilemma confronting a liberal democracy is
Wilkinson (1986).
4. Articles that analyze trends and cycles include Cauley and Im (1988), Enders, Parise,
and Sandler (1992), and Enders and Sandler (1999). A pioneering analysis by Midlarsky,
Crenshaw, and Yoshida (1980) was the first to employ the autocorrelation function in the study
of terrorist time series.
5. The causality between transnational terrorism and Spanish tourism was investigated
by Ender and Sandler (1991), whereas the relationship between terrorism and foreign direct
investment for a few select countries was studied by Enders and Sandler (1996).
6. On these transboundary externalities, see Sandler and Lapan (1988).
7. Diminishing returns to terrorists’ resources are reflected by 0, 0, 0,t tR R RRg g g
and 0,RRg where subscripts on the respective gain function indicate first- and second-order
partial derivatives. These partials indicate that resources have a positive, but declining, marginal
impact on gain.
8. Studies on the aftermath of retaliatory raids have consistently found an heightened
level of terrorism following such raids (Enders and Sandler, 1993; Brophy-Baermann and
Conybeare, 1994).

36
9. With the start of the post-cold war era, there is a ratcheting down of the number of
terrorist events as state-sponsors reduced their support of transnational terrorism, and Russia and
the United States had few faceoffs (Enders and Sandler, 1999, 2000; Hoffman, 1998).
10. The impact of these interventions was shown in Enders and Sandler (1993, 1999,
2000) and Enders et al. (1990).
11. For a more in-depth description of the sources for ITERATE, consult Mickolus,
Sandler, and Murdock (1989, vol. 1, pp. ix-xxvi). This source also has the working definition for
transnational terrorism that the coders were instructed to apply.
12. This substitution into more deadly events is also shown in Enders and Sandler
(1993).
13. AIC is calculated as T•rss + 2•k, where T = number of usable observations, rss =
residual sum of squares, and k = number of parameters estimated. SBC is calculated as T•rss +
ln(T)•k. Note that the SBC tends to select the more parsimonious model since it heavily
penalizes the inclusion of additional coefficients (k).
14. AR(p) refers to an autoregressive model with a lag length of p periods.
15. To allow for the different intercepts, we must include It and (1 – It) as regressors.
16. For the TAR model, the value of has to be estimated. Hence, we include it as a
parameter when calculating the AIC and the SBC (i.e., we add 1 to the value of k ).
17. To save space, we do not report the estimated M-TAR models. Moreover, Tsay’s
(1989) method of arranged autoregressions do not yield any evidence of multiple thresholds or of
a delay parameter other than unity. Details are available from the authors on request.
18. Similarly, when there are more than 18, but less than 21.53 incidents, we estimate
that there will be a jump to 21.53 units in the subsequent period. Thus the skeleton of the system
is such that there are two long-run equilibria: 13 and 21.53 DEATH incidents per quarter.
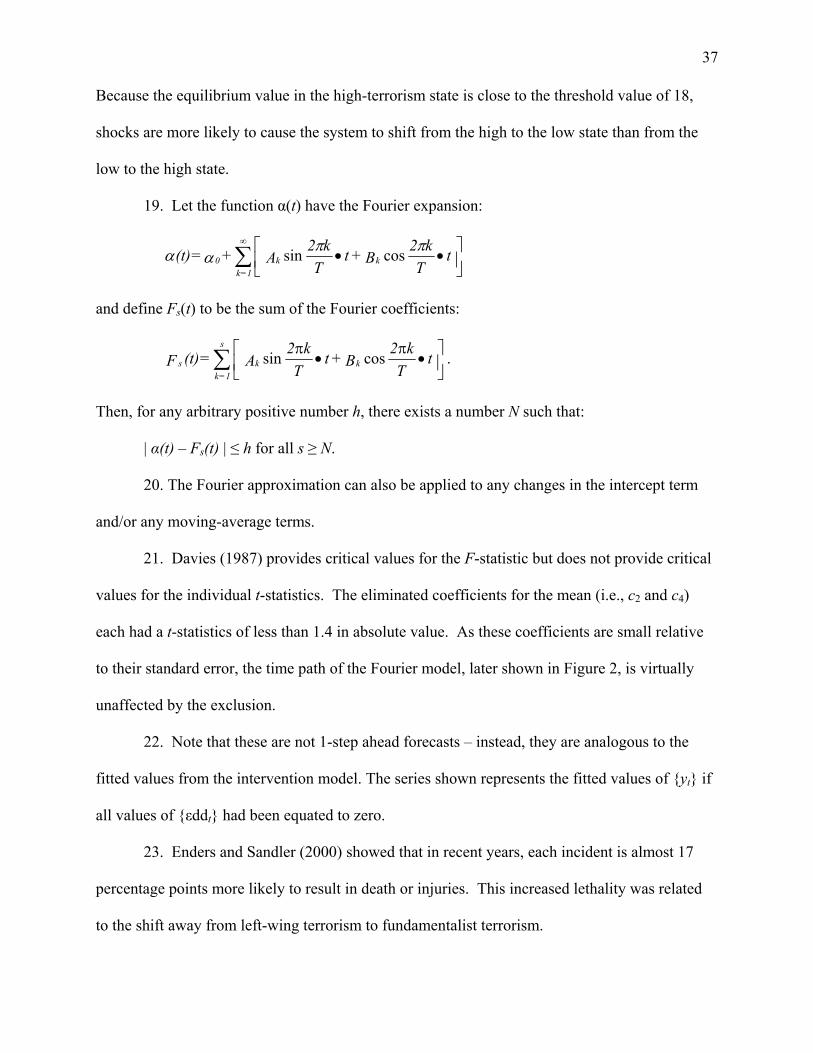
37
Because the equilibrium value in the high-terrorism state is close to the threshold value of 18,
shocks are more likely to cause the system to shift from the high to the low state than from the
low to the high state.
19. Let the function α(t) have the Fourier expansion:
tT
k2 B + t
T
k2 A + = (t) kk
=1k0
cossin
and define Fs(t) to be the sum of the Fourier coefficients:
t
T
k2 B + t
T
k2 A = (t)F kk
s
1=ks cossin .
Then, for any arbitrary positive number h, there exists a number N such that:
| α(t) – Fs(t) | ≤ h for all s ≥ N.
20. The Fourier approximation can also be applied to any changes in the intercept term
and/or any moving-average terms.
21. Davies (1987) provides critical values for the F-statistic but does not provide critical
values for the individual t-statistics. The eliminated coefficients for the mean (i.e., c2 and c4)
each had a t-statistics of less than 1.4 in absolute value. As these coefficients are small relative
to their standard error, the time path of the Fourier model, later shown in Figure 2, is virtually
unaffected by the exclusion.
22. Note that these are not 1-step ahead forecasts – instead, they are analogous to the
fitted values from the intervention model. The series shown represents the fitted values of {yt} if
all values of {εddt} had been equated to zero.
23. Enders and Sandler (2000) showed that in recent years, each incident is almost 17
percentage points more likely to result in death or injuries. This increased lethality was related
to the shift away from left-wing terrorism to fundamentalist terrorism.

38
24. For a theoretical model on the ineffectiveness of piecemeal policy, see Sandler and
Lapan (1988).
25. During rush hour, eleven sarin-filled bags planted on five subway trains created
terror, pandemonium, and injuries at fifteen Tokyo subway stations, resulting in the deaths of
twelve people and the hospitalization of more than 5,000.
Interventions Actual
Figure 1: Effects of the InterventionsEstimated through 1996:2
years
Inci
den
ts p
er q
uar
ter
70 73 76 79 82 85 88 91 94 970
5
10
15
20
25
30
35
40

Fourier Actual Intervention
Figure 2: The F-ARMA and Intervention Models
years
Inci
den
ts p
er Q
uar
ter
70 73 76 79 82 85 88 91 94 970
5
10
15
20
25
30
35
40

Table 1. Interventions
Abbreviation Description Starting Date
METAL Metal detectors installed in US airports on 5 January 1973, followed shortly thereafter by their installation in airports worldwide.
1973:1
EMB76 A doubling of the spending to fortify and secure US
embassies beginning in October 1976. 1976:4
FUND The rise of religious fundamentalist-based terrorism
starting with the 4 November 1979 takeover of the US embassy in Tehran. Intervention date established statistically in Enders and Sandler (2000).
1979:4
EMB85 Further increases in spending to secure US embassies by
Public Law 98-533 in October 1985. 1985:4
LIBYA US retaliatory raid against Libya on the morning of 15
April 1986 for its alleged involvement in the terrorist bombing of La Belle Discothèque in West Berlin on 5 April 1986.
1986:2
POST The start of the post-cold war era with the official demise
of the Warsaw Pact on 1 July 1991 and the breakup of the Soviet Union on 20 December 1991.
1991:4
* For just LIBYA, the dummy variable for the intervention is 1 for the quarter beginning the intervention and 0 thereafter. For the other five interventions, the dummy variable remains at the value of 1 for all periods after the intervention