patterns of volunteering, giving, and participating among
TRANSCRIPT
Patterns of Volunteering, Giving, and Participating Among Occupational Groups in Canada
by
L. Kevin Selbee and Paul B. Reed
Carleton University and Statistics Canada
Ottawa
2006
Prepared for
Volunteer Canada and the Canadian Medical Foundation
Ottawa

2
Contents Summary of Findings
Introduction
• Occupation as a Master Trait, and the Conjunction of Occupation
with Giving, Volunteering and Civic Participating
• Defining Occupational Groups in the Canadian Occupational
Structure
• A Word About Our Data and Analysis
Part I: Volunteering, Giving, and Civic Participating Among Occupational Groups A. Volunteering Among Occupational Groups
B. Charitable Giving Among Occupational Groups
C. Civic Participation Among Occupational Groups
Part II: The Case of Medical Professionals and Other Health Workers: A Detailed look at Contributory Behaviours in the Health Sector D. Volunteering Among Medical Professionals Other Health Workers
E. Charitable Giving Among Medical Professionals and Other Health
Workers
F. Civic Participation Among Medical Professionals and Other Health
Workers
Commentary and Conclusions

3
Summary of Findings
Part I: Volunteering, Giving, and Civic Participating Among Occupational Groups
A. Volunteering Among Occupational Groups
• Professionals and upper-level managers had the highest rates of volunteering
of any occupational group in 2003 (41% or higher). An important exception
among professionals was those in the physical and applied sciences who
volunteered at a level similar to white collar workers (34% and 36 %
respectively). Volunteering among blue collar workers was significantly
lower (25%) than all other occupational groups.
• Differences between occupational groups in rates of volunteering are closely
associated with differences in the variety of nonprofit and voluntary
organizations and groups that individuals are members of, or participate in.
Occupations where civic participation is high generally have higher rates of
volunteering, and where civic participation is low, volunteering is also low.
Individuals who are active in these types of organizations generally have
more opportunity to work as volunteers, but they are also more likely to be
recruited to be volunteers.
• The average number of hours volunteered each year is highest among
professionals in the physical and applied sciences and among professionals
in law, arts and social sciences. Average hours are lowest among health
professionals. Because health professionals have relatively high rates of
volunteering, their low average annual hours indicate that these volunteers,
compared to other occupational groups, are more likely to be short-term or
episodic volunteers.

4
• Upper-level managers and blue collar workers were the occupational
categories most likely to volunteer for culture and recreational organizations.
Professionals in health and in law, arts and social science were the groups
most likely to volunteer for education and research organizations, and health
professionals were most likely to volunteer for religious organizations.
• The work people do as volunteers for an organization is often related to the
skills and experience they possess as a consequence of their occupational
position. Professionals in business and upper-level managers are likely to be
involved in volunteer activities that make use of their business and
administrative skills, such as office work, providing information or
organizing events. Professionals in law, arts and social science, the group
that includes a large contingent of school and university teachers, are more
likely to be involved in teaching or coaching tasks, and health professionals
are more likely to be involved in providing care and physical or emotional
support. Tasks that require skills that most everyone has, such as providing
food or transportation, are done by many volunteers from across all the
occupation groups.
• Upper-level managers, and professionals in business and in the physical and
applied sciences were the least likely to seek out opportunities on their own
to volunteer, but were most likely to have been asked to volunteer, to have
been recruited. The high level of recruitment among business professionals
and upper-level managers may reflect both the value of their organizational
skills and the benefits that may accrue to an organization because of its
connection to businesses in the community through these volunteers.
• Across all occupational groups, more than one quarter of volunteers say that
one reason they volunteer is because their friends do. Volunteering, across
all occupations, is not just a way to provide free labour to an organization; it
5
is also a social activity where people meet as friends rather than just co-
workers.
• The reasons people do not volunteer are diverse but two important ones for
all occupations are an unwillingness to make a long-term commitment of
their time, and not having been personally asked to volunteer. These may be
two areas where nonprofit and voluntary organizations can actually promote
volunteering by making known the value of even small commitments of
time, and by encouraging their volunteers to actively recruit other people.
B. Charitable Giving Among Occupational Groups
• Giving to charitable organizations is widespread in all occupations, but it is
particularly prevalent among professionals and managers. This group of
occupations also gives the largest average amount of money each year. The
exception is professionals in the physical and applied sciences, where the
proportion of donors is lower than the other professionals and whose
average annual donation is also substantially lower. However, giving is
lowest, in both the proportion of donors and the size of annual donations,
among the occupations at the low end of the income scale, white and blue
collar workers.
• Even when charitable giving is expressed as a proportion of household
income, giving is substantially lower among professionals in the physical
and applied sciences and the white and blue collar workers.
• More than any other occupation, health professionals made donations to
health organizations, but business professionals gave a larger share of all
their donations to these organizations than did any other occupation.
Professionals in business, and the physical and applied sciences, were more
likely to donate to social service organizations, and professionals in the
6
physical and applied science gave a larger share to this type. A larger
percentage of professionals in business and in law, arts and social science
made donations to religious organizations and the latter group gave a larger
share of total donations than any other occupation. Health professionals
were more likely than others to donate to education and research
organizations, but all occupations donated about an equal share of all
donations to these organizations. Professionals in the physical and applied
sciences were more likely to give to philanthropic intermediaries such as the
United Way, but it was upper-level managers who gave the largest share of
their donations to this type. Upper-level managers were more likely than
others to support cultural and recreational organizations and also gave a
larger share of their donations to these organizations.
• The proportion of donations that goes to religious organizations each year
generally increases as the proportion of the occupation who are active in a
religious congregation increases. Adjusted for income, professionals in
health and in law, arts and social sciences gave more to religious
organizations than did other occupational groups.
• For all occupations, sponsoring someone in a charity event like a walk-a-
thon was the most common method of making a charitable donation (51% of
all occupations), but it generated relatively little money for charities (only
5% of all donated dollars). A slightly less common method of donating was
giving at a church, mosque, synagogue or temple, but the proportion of all
donated dollars that was given in this manner is far higher than any other
method of making donations. An even less uncommon way of making a
donation was to approach a charity on one’s own initiative (only 7% of all
donors did so), but the total value of these donations was second only to
those given through religious institutions.

7
• Professionals are more likely than others to give to charities because they
feel they have a responsibility to their community. White and blue collar
workers tend to give because they know someone who has been affected by
the cause an organization supports.
• Across all occupations, a substantial proportion of Canadians wonder if their
charitable donations will be used efficiently and believe that charities spend
too much on administrative and fundraising costs.
C. Civic Participation Among Occupational Groups
• A majority of working Canadians are members of, or participate in,
nonprofit or voluntary organizations and groups, even when occupation-
related organizations (such as unions) are excluded from consideration.
Participation is higher among professionals and managers than white and
blue collar workers.
• Participation in civic organizations concerned with sports or recreation
organizations is widespread among professionals and managers but is less
common among white collar and blue collar workers. Professionals in law,
art and social sciences are more likely than other occupation to participate in
culture, education and hobby organizations, and in school, neighbourhood or
community associations. Health professionals are more likely than others to
participate in religious organizations.
• Voting in elections at the federal, provincial or municipal levels is low
among white and blue collar workers, sectors of society where lower income
and lower education levels can be associated with political disaffection.
Voting is also low among professional in the physical and applied sciences,
where neither income nor education are low.

8
Part II. The Case of Medical Professionals and Health Workers: A Detailed Look at Contributory Behaviours in the Health Sector.
D. Volunteering Among Medical Professionals and Other Health Workers
• Among Canadians working in the health sector, health professionals are
most likely to be volunteers (41%), followed by medical doctors (38%) and
medical technicians, aides and orderlies (29%). The last group contributes
the highest average hours each year (130) followed by health professionals
(90) and medical doctors (82). The rates of volunteering among those in the
health sector are similar to those of other occupations, but the hours devoted
to volunteering are lower.
• Part of the explanation for the low rate and hours volunteered among
medical doctors may lie in the fact that physicians average the highest hours
spent in paid work of all occupations, so they may have less time available
for activities outside work and family. In addition, some physicians
contribute to individual and community well-being through pro bono work
which may not be reported as volunteer activity or direct personal helping.
• Female medical doctors are substantially more likely to be volunteers than
are male doctors. In fact, female MDs are more likely to be volunteers than
either men or women in any other occupation. Among health workers other
than physicians, men and women volunteers in equal measure.
• Medical doctors in Ontario are much more likely to be volunteers than MDs
elsewhere in Canada. This is also true of medical aides and orderlies, but
not of other health sector professionals. Among all other occupations, those
in Ontario volunteer at about the same rate as those elsewhere.
9
• Medical doctors aged 55 and over are more likely to be volunteers than are
those who are younger. This is also true for other health workers, and for
professionals and managers outside the health sector. The lower level of
participation as volunteers among younger individuals in these occupations
may be a consequence of time demands in their work and being in the earlier
stages of their careers. Later in life, once those careers are established and
family responsibilities have eased, there may be more time and energy
available for activities in the community.
E. Charitable Giving Among Medical Professionals and Other Health Workers
• Charitable giving is widespread among those who work in the health sector,
and particularly among medical doctors, of whom 92% made one or more
donations in 2000. The amount donated to charities each year is high among
health professionals ($395 per year) and is the highest of all occupations
among medical doctors ($541 per year). To some degree, these occupations
can afford to give more to charities because their household income is
relatively high, but even when giving is expressed as a percentage of
household income, medical doctors, along with other non-health sector
professionals, are at the top, giving 0.66% of their income to charities each
year.
• Of all occupations, medical doctors, (99%) are more likely to donate to
health organizations than are any other occupation but medical technicians,
aides and orderlies give a larger share of their donations (24%). Health
professionals are more likely than others to donate to social service
organizations and they, along with upper-level managers, give a large share
of all their donations to this type. Health professionals are also more likely
to support religious organizations than are other occupations, but medical
doctors give a larger share of their donations to these organizations than any
occupation. Medical doctors are also the group that most supports

10
organizations in the area of education and research, both in terms of the
percentage of MDs that donate to this type and of the percentage of their
charitable dollars that go to this type.
• The most common method for making charitable donations, among medical
doctors, is by responding to mail requests. The largest share of their
donations also goes via this method. For other health professionals,
sponsoring someone in a charity event is the most common donation
method, but like MDs, these individuals give the largest share of their
donations in response to mail request (when religious donations are
expected). The largest share of donations by medical technicians, aides and
orderlies (again expecting religious giving) goes to charities through payroll
deduction plans.
• Substantially more medical doctors than other health sector workers decide
in advance the organization they will donate to, and a majority of medical
doctors and other health professionals make regular donations to specific
organizations. In these terms, medical doctors plan their charitable giving to
a greater extent than those in other occupations.
• More than any other occupation, medical doctors give to charities because of
a sense of responsibility to their community. Their giving is also much more
likely to fulfill religious beliefs or obligations, a reflection of the high
proportion of religiously-active individuals in this occupation.
• For other health professionals and medical technicians, aides and orderlies,
the most common reason for giving to charities is because they or someone
they know have been personally affected by the cause the organization
supports.

11
• The reasons why donors do not give more to charities are diverse, but almost
half of all donors give as one reason their dislike of the way organizations
make requests for donations. Other reasons for limiting donations that many
medical doctors (81%) give was because they had already given enough
money directly to people outside their household. As it turns out, MDs are
much more likely than other occupations to give money to relatives,
including children and parents who do not live with them (72% of MDs
versus 33% of all other occupations). A substantial proportion of donors
(27% overall) indicated that they did not give to charities because they
volunteered their time instead. This reason was more common among
medical doctors (45%) and other health professionals (34%), where it may
reflect the practice of providing pro bono care to people in need, since this is
both a donation of time and money (in the form of fees foregone); health
professionals may see this service as a form of donating in lieu of formal
charitable giving.
F. Civic Participation Among Medical Professionals and Other Health Professionals
• Across all occupations, about 57% of working Canadians are members of, or
participate in, nonprofit and voluntary organization and groups (excluding
occupation-related associations and unions). Participation is highest among
medical doctors (84%) and other professionals (71%), and is lower among
other health professionals (65%) and medical technicians, aids and orderlies
(58%).
• The average number of organizations in which individuals participate each
year is highest among medical doctors and other health professionals. Other
professionals and upper-level managers participate in slightly fewer
organizations, and white collar workers participate in the fewest.

12
• The frequency with which individuals take part in community organizations
or groups is highest among medical doctors and non-health sector
professionals, (48% participate two or more times per month) but where
only 8% of MDs participate infrequently a year or less, a fairly large portion
of other professionals, (23%) participate infrequently. A slightly smaller
proportion of other health professionals participate frequently (43%) but
they too have a large proportion who participate infrequently 921%).
• Participation in community sports and recreation organizations is highest
among medical doctors, other professionals and upper-level mangers (40%).
Participation is slightly lower among other health professionals (36%), and
lowest among medical technicians, aides and orderlies, and white and blue
collar workers (about 28%). Medical doctors and other professionals are
also more likely to participate in culture, education and hobby organizations
than are other occupations, with fairly low participation rates among medical
technicians, aides and orderlies, and white and blue collar workers.
Participation in religious organizations and groups highest among health
professionals, including MDs.
• When organizations and groups that cater to leisure-time activities are
combined (sports, recreation, culture, education and hobbies), participation
by medical doctors is high (68%). By comparison, participation among
other health professionals, medical aides and orderlies, and white and blue
collar workers is markedly lower (less than 45%). Medical doctors, and
other professionals, show a preference for having their leisure or recreational
activities take place in a structural organizational context.
• Voting in federal, provincial or municipal elections is highest among other
health professionals, other professionals and upper-level managers. Voting
is lower among medical doctors and medical technicians, aides and
orderlies.

13
• On a number of political activities, such as researching political issues,
expressing views to the media or to a politician, boycotting products for
ethical reasons, or attending public meetings, medicals doctors and other
professionals were the most active of all occupational groups.

14
Introduction Occupation as a Master Trait, and the Conjunction of Occupation with Giving,
Volunteering and Civic Participating
Among the many diverse traits that together constitute each individual
person, some exert much more influence than others on what kinds of behaviours
we exhibit, or how we perceive and interact with the world around us. Our place of
birth, the religious creed we adhere to, the type and quality of formal education we
possess ― these are some of the “master traits” that influence our lives. That the
work we do, the way in which we make our living ― our occupation, in short ― is
central among these master traits is an accepted part of conventional wisdom. Our
occupation is primary in establishing our place in the social order via the level of
income it provides and the status is conveys; our occupation molds more than a few
of the beliefs and ideals that guide our lives by virtue of the mindset and values that
it rests on; our occupation exerts more than a little influence on the kinds of people
we meet and relationships we form; and our occupation often has a significant
bearing on the nature and the strength of our self-identity. It is commonplace when
meeting someone for the first time to inquire about what “line of work” or
occupation that person is involved in. We implicitly understand that a doctor has
high technical competence, prestige, authoritativeness, and a well-above-average
income. We “naturally” understand that a public school teacher possesses a
different, less technical repertoire of skills, plied in a different kind of
organizational setting, receives considerably less remuneration, and enjoys less
prestige and authoritativeness than a physician.
Some occupations, by virtue of their social and economic standing, carry
greater or lesser social expectations and responsibilities; people in those with higher
prestige and income such as the professions are implicitly expected to make greater
contributions to society in the form of leadership, civic involvement and charitable
15
giving; those who enjoy less prestige and income, such as blue collar workers, carry
lower expectations in this regard.
This study is about the unmapped aspect of occupations that concerns their
patterns of civic involvement and contributing to the community. Using data from
two large national surveys, it documents the extent and manner in which individuals
in Canada’s principal occupational categories engage in formal volunteering,
charitable donating, direct personal helping and giving, and participating in civic
organizations and activities. We believe the study provides insights into variations
in how Canadians’ connect to their communities and their attitudes and behaviours
regarding supporting the common good, and how these are molded to some degree
by the differing mindset and socioeconomic conditions associated with different
kinds of work and preparatory training.
Defining Occupational Groups in the Canadian Occupational Structure
This report is based on information taken from two national surveys carried
out by Statistics Canada. One is the National Survey of Giving, Volunteering and
Participating (NSGVP), conducted in 2000 with a total sample size of 18,300
respondents aged 15 and over, of whom 10,372 were working Canadians with an
occupational designation. The second is the General Social Survey, Cycle 17
(GSS17), conducted in 2003 with a sample size of 16,817 working Canadians age
15 and over.
As its name suggests, the NSGVP 2000 contains a large amount of detailed
information about volunteering and charitable giving and is the source for the
analysis of volunteering and giving in sections A and B of Part I. The GSS17 has
more extensive information on the civic and political participation of Canadians so
it is the basis for the analysis in Section C of Part I.

16
In Part II of the report, we turn our attention to the contributory behaviour
of individuals who work in the health sector in Canada, specifically medical
doctors, other health professionals, and medical technicians, aides and orderlies, and
examine how their contributory behaviour compares with the rest of the
occupational structure. The first section (D) of Part II examines the volunteering
behaviour of occupations in health and other sectors and is based on the GSS17
information, because the size of the sample for this survey makes it possible to
generate more reliable estimates about the volunteering of the smallest occupational
group we examine, medical doctors, relative to the smaller sample size of the
NSGVP 2000.
In section E of Part II, we examine the charitable giving of individuals in the
health sector and elsewhere and the source of this information is again the 2000
NSGVP because the number of medical doctors who are donors is large enough to
produce reliable estimates of giving behaviour from the survey.
In the final section (F) in Part II, we examine the civic and political
participation of those in the health and other sectors. The information in this section
is taken from the GSS17.
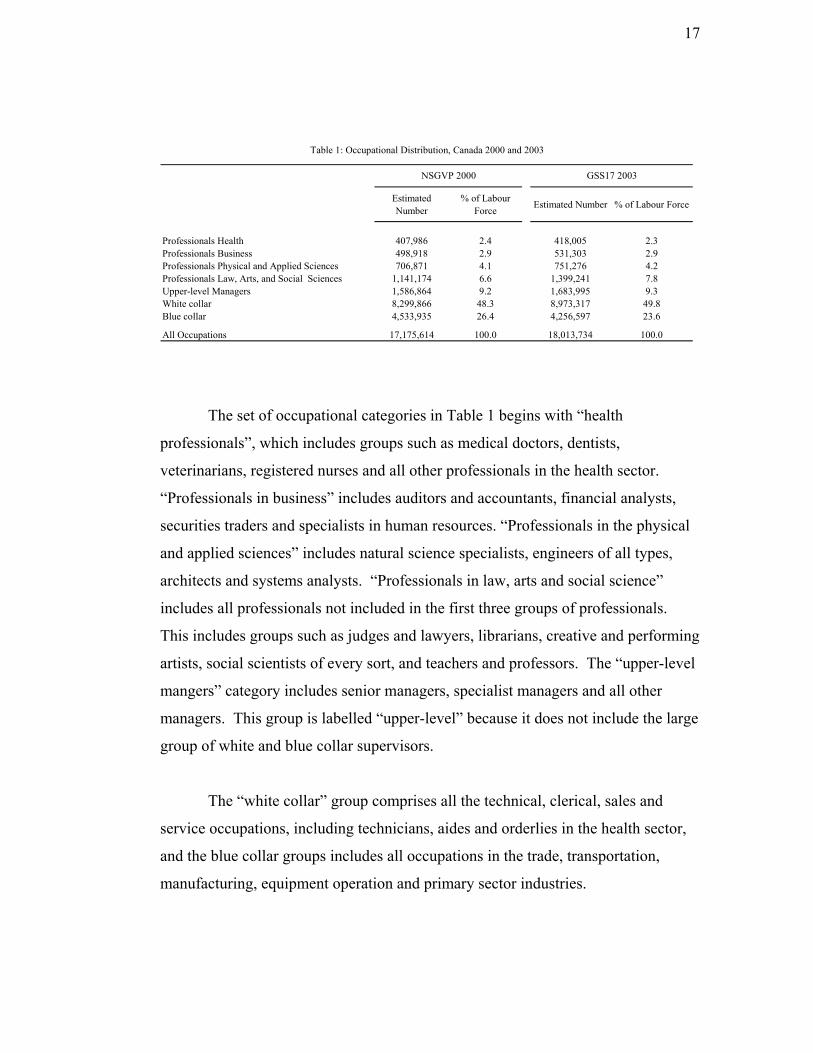
The set of occupational categories employed to examine the contributory
behaviours of working Canadians differs between Part I and Part II of the analysis.
In Part I, where the analysis focuses on the behaviour of four groups of
professionals, upper-level managers and white and blue collar workers, the
categories are those in Table 1 which shows the sample distributors from the
NSGVP for 2000 and from the GSS17 for 2003. In Part II, where the analysis
focuses on medical doctors, other health professionals, medical technicians, aides
and orderlies, as well as other professionals (not in the health sector), upper-level
managers, and white and blue collar workers, the set of categories used in that in
Table 2 below, which again shows the distribution of working Canadians across this
set of occupational groups for 2000 (NSGVP) and 2003 (GSS17).
17
Estimated Number
% of Labour Force Estimated Number % of Labour Force
Professionals Health 407,986 2.4 418,005 2.3Professionals Business 498,918 2.9 531,303 2.9Professionals Physical and Applied Sciences 706,871 4.1 751,276 4.2Professionals Law, Arts, and Social Sciences 1,141,174 6.6 1,399,241 7.8Upper-level Managers 1,586,864 9.2 1,683,995 9.3White collar 8,299,866 48.3 8,973,317 49.8Blue collar 4,533,935 26.4 4,256,597 23.6
All Occupations 17,175,614 100.0 18,013,734 100.0
Table 1: Occupational Distribution, Canada 2000 and 2003
NSGVP 2000 GSS17 2003
The set of occupational categories in Table 1 begins with “health
professionals”, which includes groups such as medical doctors, dentists,
veterinarians, registered nurses and all other professionals in the health sector.
“Professionals in business” includes auditors and accountants, financial analysts,
securities traders and specialists in human resources. “Professionals in the physical
and applied sciences” includes natural science specialists, engineers of all types,
architects and systems analysts. “Professionals in law, arts and social science”
includes all professionals not included in the first three groups of professionals.
This includes groups such as judges and lawyers, librarians, creative and performing
artists, social scientists of every sort, and teachers and professors. The “upper-level
mangers” category includes senior managers, specialist managers and all other
managers. This group is labelled “upper-level” because it does not include the large
group of white and blue collar supervisors.
The “white collar” group comprises all the technical, clerical, sales and
service occupations, including technicians, aides and orderlies in the health sector,
and the blue collar groups includes all occupations in the trade, transportation,
manufacturing, equipment operation and primary sector industries.

18
Together, the four professional occupational groups made up about 17% of
the labour force in 2003, with professionals in law, arts and social science the
largest of the four. Managers made up 9% of the labour force, with blue collar
occupations accounting for 24%. White collar workers by far constitute the largest
component of the labour force at 50%.
Estimated Number % of Labour Force Estimated
Number % of Labour Force
92,988 0.5 68,267 0.4314,998 1.8 349,738 1.9407,481 2.4 458,949 2.5
2,346,963 13.7 2,681,819 14.91,586,864 9.2 1,683,995 9.37,892,385 46.0 8,514,368 47.34,533,935 26.4 4,256,597 23.6
17,175,614 100.0 18,013,734 100.0
Medical Technicians, Aides and OrderliesOther ProfessionalsUpper-level ManagersWhite CollarBlue Collar
Total
GSS17 2003
Table 2: Occupational Distribution, Canada 2000 and 2003.
Other Health Professionals
NSGVP 2000
Medical Doctors
The set of occupational categories employed in Part II of the report (Table 2)
begins with “medical doctors.” This group includes specialists, general
practitioners, and family physicians. “Other health professionals” include all
professionals in the health sector other than MDs, including dentists, pharmacists
and registered nurses. “Medical aides and orderlies” includes all medical and dental
technicians, and medical and dental aides, assistants and orderlies. The “other
professionals” group includes all professionals who are not in the health sector, and
mangers are the same group as in Table 1. The “white collar” group is as described
for Table I, but here it excludes medical technicians, aides and orderlies. The “blue
collar” group is again the same as described for Table 1.
In 2000 and 2003, medical doctors made up about one half of one percent of
the Canadian occupational structure, based on estimates from the NSGVP and
GSS17 data. Other health professionals constituted almost 2%. The small number
of medical doctors in both the NSGVP and GSS17 samples requires that caution be

19
exercised when comparing estimates for MDs to those for other large occupational
groups. We have taken these data at face value as the best available estimates of
how individuals in various occupational groups behave, but it should be
remembered that estimates (percentages or averages) can have non-trivial sampling
variability and that small to medium differences between occupational groups may
not be as substantively significant as some of the numbers imply.
A Word About Our Data and Analysis Prior to commencing work on this study, we examined a broad range of
potential data sources. Seven were identified that contained useful information on
volunteering and/or charitable giving. The key differences among them, however,
for the purpose of examining the connection between occupation and contributory
behaviours, was the level of detail available for classifying respondents. We found
the data files fell into one of the three following categories:
A. Very limited usefulness ― data files in which professionals could be
identified separately from all other occupational groups, but not possible to
distinguish physicians from other health professionals. These files include
the following:
-1997 National Survey of Giving, Volunteering and
Participating
-1987 Volunteer Activity Survey
-1994 General Social Survey Cycle 9
-1996 General Social Survey Cycle 11
B. Somewhat useful ― data permitting identification of physicians from other
health professionals, but not able to differentiate among medical doctors,
20
dentists and veterinarians. The one file here was the 1998 General Social
Survey, Cycle 12.
C. Most useful ― two data files which permit separate identification of
physicians from dentists, veterinarians, and all other health professionals, as
well as the other principal occupational categories. These two data files
form the basis for this study of different contributory behaviours by different
occupational groups.
The first data file is the 2000 National Survey of Giving, Volunteering and
Participating with a sample size of 14,724. Its strength is its extensive data
on formal volunteering and charitable giving as well as on direct personal
helping and giving, including hours volunteered and dollars donated. Its
weakness is its limited data on other forms of civic participation, and its
modest sample size that could restrict some parts of the analysis.
The second is the 2003 General Social Survey, Cycle 17 with a sample size
of 25,951. Its strength is its extensive data on numerous forms of civic
participation and civic engagement. Its weakness is that it contains no data
on charitable giving other than whether or not it has occurred during the 12
months preceding the survey.
Our analysis does not seek to establish precise connections, in the form of
correlation coefficients, between various aspects of giving and volunteering on one
hand and particular occupational groups on the other. Our objective is to uncover
the patterns of contributory behaviour, if any, that characterize major occupational
groups, and for this we have used a bivariate analytical approach.

21
Part I: Volunteering, Giving and Civic Participating Among Occupations
A. Volunteering Among Occupational Groups
A.1. The Incidence and Magnitude of Volunteering
• In the Canadian population, between 2000 and 2003, volunteering rose from
29% to 34% of the population aged 15 and older who were employed (Table
A.1). And while the total amount of time people volunteered rose
substantially, from 734 million to 883 million hours, the hours per volunteer
actually declined from 149 to141 per year. The increase in volunteering, both
in the national rate and total aggregate hours, was the result of an influx to
volunteering of individuals whose volunteer behaviour contributed fewer
hours than was typical in 2000: more people were volunteering but they
tended to volunteer fewer hours each year.
2000 2003 2000 2003 2000 2003
Professionals Health 43 41 19,366,726 15,128,213 110 89Professionals Business 40 45 30,158,664 28,902,554 152 123Professionals Physical Sci 23 34 30,076,354 33,695,312 184 133Professionals Law, Arts, Soc Sci 49 51 95,749,983 104,241,957 171 148Upper-level Managers 33 43 81,210,233 101,693,360 157 141White collar 29 36 340,473,782 454,304,864 143 143Blue collar 21 25 137,523,125 145,659,243 148 141
All Occupations 29 34 734,558,866 883,625,503 149 141
Rate Total Hours Volunteered
Table A.1: Volunteering in Last 12 Months, NSGVP 2000 and GSS17 2003
Average Hours per Volunteer
• With the exception of health professionals, all occupational groups increased
their rate of volunteering over the three-year period. Among health
professionals, the rate was essentially unchanged or perhaps declined very
slightly (43% in 2000 and 41% in 2003). However, because the health
22
professionals already had a high rate of volunteering in 2000 relative to most
other occupational groups, the rise in volunteering served mainly to bring the
levels of participation of the other groups up to the level of health
professionals.
• By 2003, volunteering among professionals in law, arts and social sciences
(51%) was substantially higher than any other occupational group. In a
grouping with slightly lower rates were business professionals (45%),
managers (43%) and health professionals (41%). These were followed by the
other white collar occupations (36%) and professionals in the physical and
applied sciences (34%). Considerably lower were the blue collar occupations
(25%).
• It is not clear whether differences in the general characteristics of the
occupations account for the different levels of volunteering. However,
exploration of possible explanations has turned up some results that begin to
clarify why rates of volunteering differ across occupations. Using a factorial
logistic regression procedure, we can determine which characteristics of
individuals, other than occupation itself, might account for the different levels
of volunteering among occupational groups. Starting with a model that
includes a set of dummy variables representing the seven occupational groups
in Table A.1, a model that perfectly reproduces the proportion of each
occupation that volunteered (the rates in Table A.1), we can introduce control
variables in an attempt to eliminate the statistically significant differences that
exist in the rates in Table A.1. This analysis we report here is based on data
from the 2000 NSGVP, but analysis based on GSS17 data produced
essentially the same results.
• A number of social and demographic factors previously found to be important
indicators of who will volunteer were examined individually in order to
determine if they would reduce the significant differences between

23
occupational groups in the rate of volunteering. Many of these factors did
reduce these differences but only slightly, not to the extent of eliminating the
differences entirely. However, one factor did eliminate the differences
between almost all the groups of professionals and managers, namely the
number of different types of nonprofit, voluntary or charitable organizations a
respondent was a member of, or participated in, over the previous year. This
participation, importantly, does not include organizations for which the
respondent had volunteered over the same period. While this factor does not
count the number of organizations but rather the number of different types of
organizations (of seven), there is a strong correlation between the actual
number of organizations and the number of types an individual participates
in.* In essence, this factor is a measure of the tendency for individuals to be
active in organizations or groups in their community. The analysis suggests
that the more organizations a person is active in during the year, the greater
the likelihood they will also be a volunteer. This in itself is not a surprising
result, particularly because there is substantial research that demonstrates that
one reason people give for volunteering is that they were asked to do so
(Freeman, 1997:S141). Clearly, the more organizations a person participates
in, the greater will be the opportunities they will have to volunteer their
services, and the greater the likelihood they will be asked to help out as a
volunteer. The fact that controlling for this form of participation eliminates
much of the difference in the rates of volunteering between health
professionals, business professionals, law, arts and social science
professionals, and managers, indicates that the observed differences in
volunteering are largely due to different levels of participation in voluntary
organizations among these groups.
* In the GSS17 survey, the correlation between the two is very strong at r=0.872)

24
% volunteers Average civic participation*
Professionals Law, Arts, Social Sciences 49 1.06
Professionals Health 43 0.97
Professionals Business 40 0.83
Upper-level Managers 33 0.72
White collar 29 0.61
Professionals Physical Sciences 23 0.61
Blue collar 21 0.48
Table A.2: Volunteering and Organizational (Civic) Participation, NSGVP 2000
NSGVP 2000
* Numberr of types of civic organizations the respondent is a member of, or participates in
• Table A.2 shows the very strong link between occupational groups and
participation in nonprofit, voluntary and charitable organizations. In this
table, the occupational groups are ranked according to their level of
volunteering and the levels of participation very closely match the ranking of
volunteering. Differences in the rates of volunteering in Table A.1 arise
because one group has more individuals at the higher levels of participation (a
higher average) than does another group. After accounting for differing levels
of civic participation, their probability of being a volunteer is essentially the
same for all the professionals and managers (within the limits of sampling
variability).
• Once we account for their levels of civic participation, the likelihood of being
a volunteer is the same for managers, white collar workers and professionals
in the physical and applied sciences. At the bottom of the ranking, the blue
collar occupations show significantly lower levels of volunteering relative to
all other groups with the exception of professionals in the physical sciences,
even when we control for their levels of civic participation.

25
• Overall, a substantial portion of the differences between occupational groups
in levels of volunteering are due to differences between them in the extent to
which they are active in various types of civic organizations. Although only a
tentative hypothesis, the likely explanation for this effect is that those who
participate in more organizations have more opportunity to volunteer, and are
more likely to be recruited to volunteer. In either case, they have a greater
likelihood of being volunteers by being active in more organizations.
• While differences in civic participation may account for some of the
differences in volunteering among occupational groups, this does not really
explain those differences, it merely changes the focus from why there are
differences in levels of volunteering to why there are differences in civic
participation. Nonetheless, it does begin to provide an understanding of the
range of factors that are linked to the tendency to volunteer.
• The average hours volunteers devote to various organizations each year
declined slightly between 2000 and 2003. In 2000, health professionals gave
the fewest hours (110) while professionals in the physical and applied
sciences gave the most (184). However, statistical tests show that the
differences between all the occupations in 2000 are not substantively large
and are probably due to random sampling variation.
• In 2003, the average hours are much more alike across occupations, with the
notable exception of health professionals at 89 hours per year. Statistical tests
show that the average for this group is actually lower than any other
occupation, but information from GSS 17 on hours volunteered should be
treated as providing tentative estimates because of the way hours were
ascertained in that survey. The use of an ordinal scale of successively higher
ranges of hours volunteered, and an open-ended category for the highest
hours, requires estimating hours volunteered from range mid-points and an
arbitrary value for the highest range of hours (albeit one based on the average

26
annual hours for that range of hours volunteered, as taken from the NSGVP
2000). As a result, the hours volunteered for 2003 may not be entirely reliable
estimates of actual hours and should be treated with caution.
One Two or More Total
Professionals Law, Arts, Soc Sci 44 56 100.0Upper-level Managers 49 51 100.0Professionals Business 50 50 100.0Professionals Physical Sci 59 41 100.0White collar 61 39 100.0Professionals Health 64 36 100.0Blue collar 65 35 100.0
All Occupations 59 41 100.0
% of volunteers
Table A.3: Number of Organizations Volunteered For, NSGVP 2000
Number of Organizations Volunteered for
• We have already noted that one factor that may account for differences in total
hours volunteered annually is the number of different organizations members
of each occupational group do volunteer work for. Table A.3 shows the
proportion of each occupation that volunteered for only one organization, or
for two or more organizations. The occupational groups are ordered top to
bottom on the basis of the proportion of volunteers who donated their time to
two or more organizations. The three groups where one-half or more of
volunteers worked for two or more organizations ― managers, and
professionals in business and in law, arts and social sciences― are groups that
also volunteered above-average hours in 2000 (Table A.1). The three groups
in Table A.3 with the lowest proportion of volunteers for two or more
organizations, viz., health professionals and white and blue collar occupations,
are all groups with below-average annual hours volunteered in 2000. As one
might expect, individuals who volunteer for more than one organization tend
to spend more time volunteering each year. The one anomaly in this pattern is

27
the group of professionals in the physical and applied sciences whose average
hours volunteered is the highest of any occupational group while the
proportion volunteering for two or more organizations is relatively low.
However, this occupational group is the smallest in the sample and
consequently has the largest confidence interval around estimates such as
hours volunteered, so the anomaly may be more apparent than real.
A.2. Types of Organizations Volunteered for
• In the NSGVP 2000, volunteers reported in detail on up to three organizations
for which they volunteered. The organizations were coded into twelve
groups, and a condensed version of this classification is presented in Table
A.4 with the four most common types in detail and the remaining eight types
grouped together as a residual “other” category. This group includes
organization types such as those concerned with environment, development
and housing, law and advocacy, and international affairs.
Health and Social
Services
Culture, Recreation and Sports
Education and Research Religion Other types
Professionals Health 39 25 25 28 *Professionals Business 35 33 18 22 39Professionals Physical Sci 37 31 * * 34Professionals Law, Arts, Soc Sci 39 27 32 22 32Upper-level Managers 42 39 15 17 31White collar 42 29 20 19 23Blue collar 32 40 14 17 23
All Occupations 39 32 20 19 26
Percentage of Organizations in Canadaa 16 29 5 19 31
a. Source: Table 1.1 in Hall et. al., 2004. * results supressed due to small cell counts
Table A.4: Organizations Volunteered for, NSGVP 2000
% of volunteers
• Employed Canadians were in aggregate most likely to volunteer for health and
social service organizations (39%), followed closely by culture, recreation and

28
sports organization (32%). Substantially fewer volunteered for education and
research (20%), religious (19%), or a wide range of other types of
organizations (26%). The high levels of volunteering for the first two types
are not surprising given the large number and range of organizations each type
includes. The culture, recreation and sports category, for example, includes
virtually all organizations that exist to support and promote recreational or
leisure-time activities. These range from groups that support the arts, through
hobby and special interest clubs, youth groups, and a wide variety of sports
organizations that provide athletic activities for people of all ages. The
prevalence and diversity of these organizations is evident in the fact that the
culture and recreation category made up 29% of nonprofit and voluntary
organizations, the single largest group in Canada in 2003 (last row in Table
A.4).
• The health and social service group, which makes up the third largest group of
organizations (16%), also represents a wide diversity of nonprofit and
charitable organizations. These include social service organizations that
provide child, youth and family services, emergency relief and shelter, and
income and material support services. Also in this group are the health
service organizations that include hospitals and nursing homes, mental health
services, and groups providing public health and wellness education services.
Together, the health and social service types represent a very broad spectrum
of local voluntary organizations, many with extensive national and provincial
affiliations and presence. This in itself makes them important and visible
groups within any community, enhancing their ability to attract volunteers.
They are also the types of organizations that provide support and assistance to
people in need, and are thus a direct means by which Canadians can reach out
and help other individuals in their communities.
• Organizations that are involved in providing services for education and
research represent only a small proportion of all nonprofit and voluntary
29
organizations (5%), but even so they attract a disproportionately large share of
all working volunteers (20%). These organizations provide services in
support of primary and elementary education, post-secondary education and
research in the medical, natural and social sciences, but more than 90% of
those who volunteer in these areas are involved in organizations that support
the education and activities of children in primary and secondary schools. In
essence, these are people who volunteer for parent-teacher organizations and
other groups that support our schools, and is consistent with prior research
that shows that the presence of school-aged children in the home is a very
strong predictor whether or not parents are volunteers (Reed & Selbee, 2000;
Selbee, 2004: 142-143). School-aged children draw their parents into
participation in various organizations that provide cultural, recreational, and
especially, educational services for children.
• Organizations that support religious congregations are also an important
venue for participation as a volunteer. These make up about one-fifth (19%)
of all organizations and attract about one-fifth (19%) of employed volunteers.
The organizations that constitute this group are unique in ways not shared by
the other types. There are many distinct religions represented in the Canadian
population and a very large number of local congregations within these
affiliations, each the potential focus of specific nonprofit and charitable
activities and organizations. At the same time, participation in these activities
will be almost entirely limited to active members of congregations. So while
many such organizations exist in Canada, the pool of potential volunteers will
tend to be limited to members of that religion and the extent of actual
participation restricted even more to those who are active participants in their
congregation.
• The final organizational type, the residual “other” category, actually
comprises 8 distinct types, none of which individually attracts more than 8%
of employed volunteers. As a result, in combination these types attract 26%

30
of volunteers while representing 31% of all nonprofit and charitable
organizations.
A.2.1. Volunteering for Health and Social Service Organizations
• Not only does volunteering vary across different types of organizations, but
the levels of participation by different occupational groups in each type show
interesting differences (Table A.4). With the exception of blue collar
workers, all occupational groups show a similar tendency to participate as
volunteers for health and social service organizations. The low participation
rate among blue collar workers actually results from a reduced rate of
volunteering for health organizations in particular. Across all occupations,
about 16% of volunteers worked for health organizations while 26% worked
for social services organizations. Among blue collar volunteers, 25%
provided help for social service organizations but only 9% helped out in
health organizations. Why blue collar volunteers show this pattern is not
clear, but may relate to there being less of a match between the skills and
experience blue collar workers offer and the needs of health organizations.
Conversely, volunteers among health professionals, whose skills and
experience are likely in high demand in health organizations, are most likely
to assist these organizations (21% of these volunteers do so).
A.2.2. Volunteering for Culture, Recreation and Sports Organizations
• Culture, recreation and sports organizations are another area where all
occupations show a relatively high tendency to volunteer, ranging from a low
of 25% of among health professionals to a high of 40% of blue collar
volunteers (Table A.4). Volunteering for organizations in this category is
dominated by participation in sports organizations. Among all volunteers,
31
19% assisted sported organizations, 10% assisted in other recreational
organizations and only 5% helped out in culture and arts organizations.
Among blue collar volunteers, just over 25% helped out in sports and 14% in
other recreational organizations. At the other end of the spectrum, health
professionals have the lowest participation in the culture, recreation and sports
category (25%). Unfortunately, sample counts for health professionals
participating in sports organizations are too small to give reliable estimates,
but if sports and recreation organizations are taken together, it is clear that
health professionals are disinclined to volunteer for these types: while 36% of
blue collar volunteers worked for either sport or recreation organizations, only
22% of health professionals did so. Volunteers among managers also tend to
offer their services to organizations in culture, recreation and sport (39%) and
to sports organizations in particular (33%). To a large degree, the high rates
of participation in this category of organizations are due to two related factors.
The manager and blue collar occupational groups are predominantly male
(59% and 82% respectively) whereas the other occupational groups are not (as
a group, 50% of professionals and 40% of white collar workers are males),
and males are almost twice as likely to volunteer for sports organizations as
females (24% versus 13% across all occupations). The predominance of
males in the management and blue collar groups and the proclivity of males to
volunteer for sports organizations results in high participation rates in the
culture, recreation and sports category for these two occupational groups.
A.2.3. Volunteering for Education and Research Organizations
• Participation in the education and research category of organizations is
dominated by volunteering for organizations dealing with primary and
secondary education (Table A.4). Across all occupational groups, 91% of
individuals who volunteered in this category did so for organizations involved
in assisting schools and school-aged children, so the differences between

32
occupation groups in table A.4 are mainly due to differences in the tendency
for each group to be actively involved in the education system.
• In this category, gender also appears to play an important role in determining
the levels of participation across occupational groups. In the two occupational
groups with the lowest participation rate, managers at 15% and blue collar
workers at 14%, men are in the majority, and male volunteers in these groups
are substantially less likely to volunteer for organizations of this type than are
male volunteers in other occupations. Among male volunteers in the manager
group, 11%, and among male volunteers in the blue collar group, 12% were
involved in education organizations. By comparison, 22% of male volunteers
in the professions, and 18% in white collar jobs worked for education
organizations. At the same time, among female volunteers in all occupational
groups, between 21% and 29% were involved with organizations in the
education category. Women are more likely to be actively involved in
organizations that support the education of their children. Although men
appear less likely to be directly involved in their children’s education, a
substantial part of their participation in sport and recreation organizations may
involve the provision of these services for children. In short, women may be
more active in providing educational services to children while men are more
active providing recreational services.
A.2.4. Volunteering for Religious Organizations
• Volunteering for religious organizations is fairly similar across all
occupations, at between 17% and 22% of volunteers (Table A.4). The health
professionals are slightly higher at 28%, but this is not a statistically
significant difference when compared to the overall average of 19%.
33
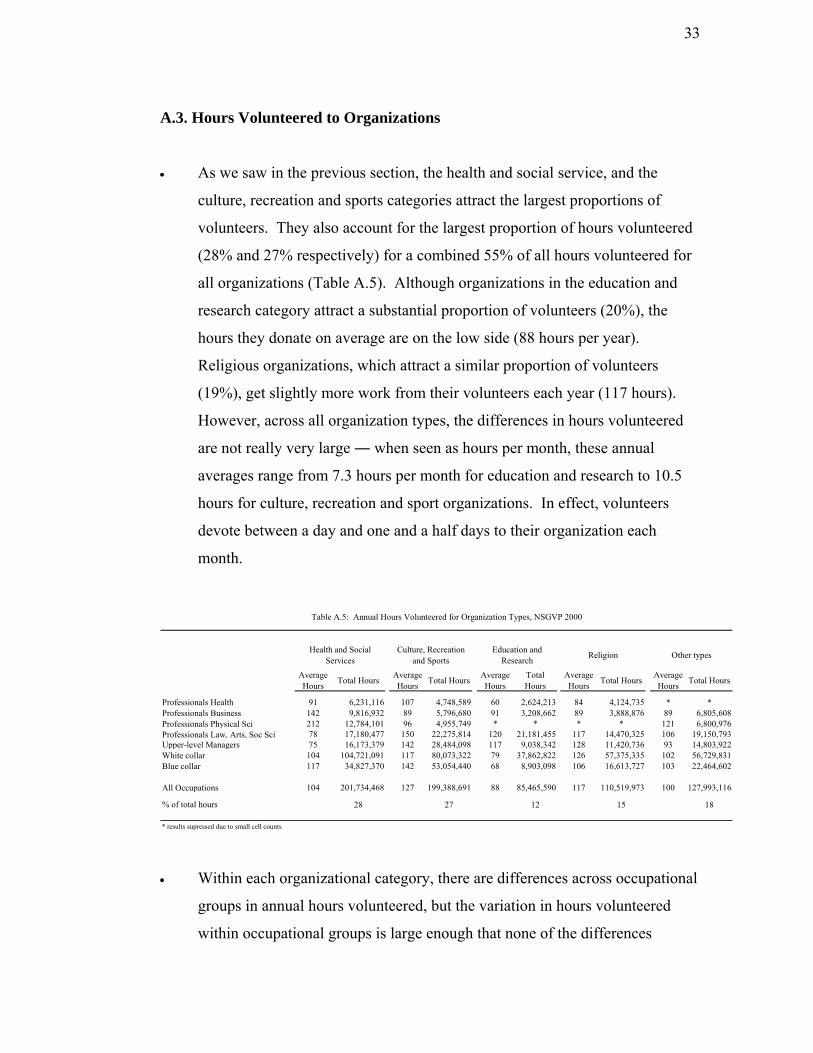
A.3. Hours Volunteered to Organizations
• As we saw in the previous section, the health and social service, and the
culture, recreation and sports categories attract the largest proportions of
volunteers. They also account for the largest proportion of hours volunteered
(28% and 27% respectively) for a combined 55% of all hours volunteered for
all organizations (Table A.5). Although organizations in the education and
research category attract a substantial proportion of volunteers (20%), the
hours they donate on average are on the low side (88 hours per year).
Religious organizations, which attract a similar proportion of volunteers
(19%), get slightly more work from their volunteers each year (117 hours).
However, across all organization types, the differences in hours volunteered
are not really very large ― when seen as hours per month, these annual
averages range from 7.3 hours per month for education and research to 10.5
hours for culture, recreation and sport organizations. In effect, volunteers
devote between a day and one and a half days to their organization each
month.
Average Hours Total Hours Average
Hours Total Hours Average Hours
Total Hours
Average Hours Total Hours Average
Hours Total Hours
Professionals Health 91 6,231,116 107 4,748,589 60 2,624,213 84 4,124,735 * *Professionals Business 142 9,816,932 89 5,796,680 91 3,208,662 89 3,888,876 89 6,805,608Professionals Physical Sci 212 12,784,101 96 4,955,749 * * * * 121 6,800,976Professionals Law, Arts, Soc Sci 78 17,180,477 150 22,275,814 120 21,181,455 117 14,470,325 106 19,150,793Upper-level Managers 75 16,173,379 142 28,484,098 117 9,038,342 128 11,420,736 93 14,803,922White collar 104 104,721,091 117 80,073,322 79 37,862,822 126 57,375,335 102 56,729,831Blue collar 117 34,827,370 142 53,054,440 68 8,903,098 106 16,613,727 103 22,464,602
All Occupations 104 201,734,468 127 199,388,691 88 85,465,590 117 110,519,973 100 127,993,116
% of total hours 28 27 12 15 18
Table A.5: Annual Hours Volunteered for Organization Types, NSGVP 2000
* results supressed due to small cell counts
Other typesReligionHealth and Social Services
Education and Research
Culture, Recreation and Sports
• Within each organizational category, there are differences across occupational
groups in annual hours volunteered, but the variation in hours volunteered
within occupational groups is large enough that none of the differences

34
between occupational groups are statistically significant. In short, there is a
high probability that the annual hours volunteered by the occupational groups
within an organization type are essentially the same. This does not imply that
all volunteers within an occupational group tend to work the same number of
hours each year for a given organizational type. Rather it means that in all
occupation groups there are individuals who volunteer only a few hours per
year while others volunteer a substantial amount of time, and this pattern is
fairly constant across occupations.
A.4. Types of Work Done By Volunteers
• Individuals who were volunteers were asked about the kinds of work they did
for various organizations. These tasks cover a wide range of activities
volunteers undertake for these organizations, including the work done in the
day-to-day operation of the organization such as office work, organizing
events or serving on boards and committees, the provision of the service
offered by the organization such as public education, teaching or coaching,
and providing care and support, food, or transportation to clients.
A B C D ECanvas, Office
Work, Information and Organizing
Events
Serve on a Board or
Committee
Teaching or Coaching
Provide Care or Support
Provide Food, Transportation or Maintenance of
Facilities
Other Tasks
Professionals Health 71 51 25 43 37 37Professionals Business 89 56 31 * 28 30Professionals Ph
F
ysical Sci 79 40 27 23 50 42Professionals Law, Arts, Soc Sci 88 58 41 36 46 41Upper-level Managers 88 54 32 26 49 35White collar 76 37 28 30 41 33Blue collar 75 36 30 28 48 39
All Occupations 79 42 30 30 43 35
* results supressed due to small cell counts
Task Group
% of volunteers
Table A.6: Types of Tasks Performed by Volunteers, NSGVP 2000

35
• The fifteen types of work volunteers could be involved in are compressed into
six related task groups in Table A.6. Since volunteers could have done any or
all of the tasks in the six groups over the previous year, the percentage in each
column represents the proportion of each occupational group who indicated
that they had done one or more kinds of tasks in that set. The information in
the table does not represent the amount of time the volunteers may have spent
doing a particular type of task; some volunteers may have devoted only a
small part of the total time they volunteered to work of a particular kind while
others may have spent all their time doing one kind of work.
• The first set of tasks encompasses the day-to-day activities that are the
mainstay of successfully running nonprofit or voluntary organizations,
including raising money, organizing and supervising events, providing
information to the public, and office and administrative work. The broad
range of activities that this set encompasses is evident in the fact that eight out
of ten volunteers (79%) had performed one or more of the jobs in this set over
the previous year. This is not surprising given the fact that over half (54%) of
all nonprofit and voluntary organizations are run exclusively by volunteers
(Hall et. al, 2004: Table 3.8:35). In these organizations, most of the members
are expected to provide some help in the routine operation of the organization.
• In spite of this, there are significant differences across the occupational groups
in the likelihood of performing tasks in this group. On one side are
professionals in health and in the physical sciences and white and blue collar
workers where about 75% of volunteers (ranging from 71% to 79%) were
involved in tasks in this set. On the other side are managers and professionals
in business and in law, arts and social sciences, where a significantly higher
proportion (about 88%) were involved in the regular operation of the
organization. For two of these groups, this result makes sense in light of the
educational and occupational skills they bring to the volunteer context. Both
managers and business professionals are routinely engaged in management

36
and administration duties in their places of work, and these skills may
predispose them, or increase their chances of being recruited to undertake
similar assignments in voluntary organizations. The reason for high
participation among professionals in law, arts and social sciences is not
immediately obvious, but over 36% of this group are primary and secondary
school teachers who have manifest skills in organizing and managing people
in group settings.
• Among the four occupational categories with somewhat lower levels of
participation in the tasks in set A, it may be the case that they are less likely to
bring managerial or administrative skills from their place of work and are thus
less inclined, or even less often asked, when these tasks are available.
• The second set of tasks involves participation on boards of directors and
committees associated with the organizations. These tasks are particularly
interesting because boards and committees represent the oversight bodies
usually involved in setting the broader policy agendas for the organization. In
many formal organizations, membership on these bodies is often limited to
small bodies of individuals in executive and other leadership positions, but the
democratic character of nonprofit and voluntary organizations is evident in the
fact that 42% of volunteers participate in these activities in a given year. This
participation, nonetheless, is not evenly distributed across occupational
groups. Professionals and managers, in general, are more likely to sit on
boards and committees than are those lower down the occupational hierarchy
in white and blue collar occupations. The single exceptions are professionals
in the physical and applied sciences whose participation rate (40%) is much
like that of white and blue collar groups (37% and 36% respectively). It is
plausible that the kinds of skills required for the physical and applied sciences,
focused as they are on scientific and technical activities, make these
individuals less inclined to positions where managerial or “people” skills are
more appropriate.

37
• The low levels of participation among white and blue collar workers may
reflect another characteristic of boards and committees. It is possible that the
educational and occupational skills these individuals possess are less likely to
prepare them for kinds of work carried on by boards and committees than is
true for professionals. But it is also true that members of the leadership cadre
within organizations are often recruited not only for the skills and abilities
they possess, but also for the legitimate action and even prestige they may
bring to the organization and its activities. An organization involved in
promoting and providing health care services to community youth, for
example, will benefit by having relevant experts on its board or committees
(i.e., medical doctors, social workers, school teachers). Recruiting experts to
these positions benefits the organization internally by providing experienced
advice on policy and practices, and externally by legitimating its voice and
goals with the public, with financial supporters, and with governments.
Nonetheless, whether through disinclination or a lack of demand, individuals
at the lower end of the occupational structure are under-represented in the
leadership and decision making levels of nonprofit and voluntary
organizations.
• The third set of tasks undertaken by volunteers specifically focuses on
teaching or coaching activities. Although there is some variation in
participation rates among volunteers in six of the occupation groups, the
difference between the lowest of these, health professionals at 25%, and the
highest, managers at 32%, is not statistically significant. Only volunteers in
the law, arts and social science group, at 41%, are statistically more likely to
undertake teaching or coaching activities. As noted earlier, 36% of this
occupational group is made up of elementary and secondary school teachers,
and it would seem logical that these volunteers would be most inclined to
undertake teaching and coaching tasks. In fact, teachers are substantially
more involved in teaching or coaching as volunteers (52%) than are the other
38
volunteers (34%) in this occupational group. The skills and experience
teachers gain in the school system are easily transferred to the voluntary
organization setting.
• The fourth group of tasks, providing care and support, also shows the
connection between the skills volunteers employ in their occupations and the
kinds of work they undertake in nonprofit and voluntary organizations. The
tasks in set D involve the provision of physical, mental and emotional care
and support, including counseling and friendly visits, seniors' health care, and
activities in self-help mutual aid groups. Many individuals in the two
occupational groups that are likeliest to perform these tasks, health
professionals (43%) and professionals in law, arts and social sciences (36%),
are directly concerned, in their careers, with promoting physical and
emotional health. For health care professionals the connection is obvious, but
the group of professionals in law, arts and social sciences also includes
occupations that are mainly concerned with mental and emotional health, such
as psychologists, social workers, family counselors and ministers of religion.
Among these occupations, which comprise 14% of this occupational group,
over 55% performed these tasks as volunteers.
• Compared to the first two occupational groups, the remaining four were
significantly less likely to provide care and support as volunteers, and the
differences among these four are not statistically significant. Combined,
about 29% of volunteers in these occupations performed these types of tasks.
Although participation is lower in these groups, it is still the case that about
three out of 10 volunteers were involved in providing care and support at
some point in the previous year.
• Tasks in the fifth set are probably the more mundane, but no less important,
kinds of work that volunteers can do. These include collecting, serving or
delivering food and other goods, maintaining or repairing facilities, and doing

39
volunteer driving. To a large extent, these tasks do not require specialized
skills on the part of the volunteers, and at the same time are jobs that arise
from time to time in many organizations and are often done by anyone who’s
available. This is reflected in the fact that almost half of the volunteers in
each occupational group had performed one or more of the tasks in this set in
the previous year.
• The final group of tasks (set F) is dominated by a residual category of tasks
not identified in the previous groups. The fact that about one in three
volunteers from all the occupation groups indicated that they performed other
jobs for their organizations is a reflection of the broad range of work that
nonprofit and voluntary organizations perform in the community.
N of Volunteers Average Number of task types performed
Professionals Health 162,091 3.6Professionals Business 197,910 3.7Professionals Physical Sci 163,686 3.4Professionals Law, Arts, Soc Sci 559,280 4.4Upper-level Managers 501,439 4.0White collar 2,291,500 3.3Blue collar 903,818 3.4
All Occupations 6,235,617 3.6
Table A.7: Diversity of Tasks Performed by Volunteers, NSGVP 2000
• The diversity of tasks undertaken by volunteers can be measured by counting
how many of the fourteen identified tasks each volunteer performed. The
average number of tasks performed by volunteers in each occupational group
is reported in Table A.7. The data suggest that managers (4.0 tasks) and
professionals in law, arts and social sciences (4.4 tasks) perform a somewhat
more diverse array of tasks for their organizations than do either white collar
(3.3) or blue collar (3.4) volunteers. This may be the consequence of the
broader range of skills and experience these individuals bring to volunteer

40
activities that qualify them for a greater diversity of tasks. Nonetheless, it is
evident that across all occupations, nowhere is there a significant degree of
specialization or concentration in the tasks performed since for all
occupations, volunteers, on average, perform between three and a half and
four and a half different jobs for their organizations.
A.5. Becoming a Volunteer
• Individuals come to volunteering by many different routes, but these can be
summarized in four broad groups, presented in Table A.8. Previous research
has consistently shown that a dominant way people become volunteers is by
being asked, by being recruited by others (Wilson and Musick, 1998:800).
Recruitment can take many forms: individuals may be approached directly by
an organization seeking help, they may be asked by friends or relatives to
offer their services as volunteers, or they may be encouraged, whether
explicitly or implicitly, by their employer to offer their services in some way.
From Table A.8 it is evident that being recruited by others is the most
common way people become volunteers in Canada ― over half of all
volunteers started because someone asked them to.
Was Asked Own Account Was a MemberBecause of Children or
Spouse
Professionals Health 52 30 25 *Professionals Business 58 26 34 20Professionals Physical Sci 61 27 * *Professionals Law, Arts, Soc Sci 53 40 28 17Upper-level Managers 57 25 25 24White collar 50 33 24 15Blue collar 48 28 26 18
All Occupations 51 31 25 17
Table A.8: How Individuals Become a Volunteer, NSGVP 2000
% of volunteers
* results supressed due to small cell counts
41
• The second way people become volunteers is essentially on their own
initiative, which includes approaching an organization and offering their
services, and by responding to general public appeals. Across all occupations
in Canada, almost one-third (31%) of volunteers began by approaching
organizations on their own.
• A third route to volunteering is internal recruitment ― being asked or pressed
to undertake volunteer tasks when already a member of an organization. It
goes without saying that membership in many nonprofit and voluntary
organizations carries with it the obligation, or at least the expectation, that
members will actively take part in running the organization and will assist in
the delivery of the services it provides. This may involve serving on the
executive or committees, routine administrative work, and periodic help with
the delivery of services to members, non-members or clients. In Canada
about one in four (25%) volunteers started volunteering because they were
members of an organization.
• The last way individuals become volunteers is because of the involvement of
their children or spouse in nonprofit or voluntary organizations. Although
some volunteers begin because their spouse asks them or simply takes them
along, it is more likely that most people who start volunteering this way do so
because their children become involved in activities and organizations that
encourage or even require that parents provide some volunteer time as a
condition of their children’s participation. In Canada, about 17% of
volunteers started because family members were involved in nonprofit or
voluntary organizations or associations.
• While for all occupational groups, being asked to volunteer was the most
common route to volunteering, there are differences that reinforce the idea
that professionals and managers are desirable recruits for nonprofit or
voluntary organizations. The proportions of these two groups that are asked

42
to volunteer (55% for all professionals and 57% for managers) are statistically
slightly larger than those of the white collar (50%) and blue collar (48%)
groups. The difference is not large, but it does suggest that skills, experience
and perhaps the prestige of professionals and managers make them preferred
targets for recruitment by organizations.
• For managers, there is another factor that comes into play in accounting for
their high level of recruitment. It is not uncommon for business firms and
companies to encourage, and at times require, that their middle and upper
level managers take an active part in community and civic affairs. Often this
takes the form of participation as a volunteer for nonprofit and voluntary
organizations. Managers in the 2000 NSGVP survey, for example, were more
than twice as likely to have begun volunteering because they were asked to do
so by their employer than are the other occupations as a group (11% for
managers versus 4% for all other occupations).
• The second way of becoming a volunteer is to approach an organization and
offer one’s services, and about one-third (31%) of volunteers started in this
way. Professionals as a group (34%) and white collar workers (33%) were
somewhat more likely to volunteer on their own initiative than were either
managers (25%) or blue collar workers (28%). The high rate among
professionals, however, is mainly due to the very high proportion of
individuals in law, arts and social sciences (40%) who approached
organizations on their own. The proportion of health professionals who did
the same stands at about the level for all occupations, while the proportions
for professionals in business (26%) and the physical and applied sciences
(27%) are on a par with managers and blue collar workers. The explanation
for these results is not obvious, but there is an interesting pattern that emerges
when we compare the rates in the first column (those who were recruited)
with rates in the second column of Table A.8 (those who volunteered on their
own). The occupation groups with the highest likelihood of having been
43
recruited are least likely to volunteer on their own (professionals in health,
business, physical and applied sciences, and managers), while those with a
below-average likelihood of being recruited have a higher-than-average
likelihood of volunteering on their own (white collar workers). The two
exceptions are professionals in law, arts and social sciences, who are
above-average for recruitment and volunteering on their own, and the blue
collar workers who are low on both recruitment and volunteering on their
own. For the latter group, the low rates for recruitment and on one’s own
initiative may simply reflect the general reticence of blue collar workers to
become involved as volunteers, as evidenced by their low rates of
volunteering overall (Table A.1: 21% and 25% in 2000 and 2003 as compared
to the national averages of 29% and 34%).
• The pattern of high recruitment and high “own account” volunteering for
professionals in law, arts and social services in part reflects the fact that their
skills and experience make them valuable recruits for many organizations.
But it is also due to the fact that among those in this occupational category
who do volunteer on their own, over 31% are elementary or secondary school
teachers, and half of them volunteered for education-related organizations.
Thus a substantial component of the “own account” volunteering by law, arts
and social science volunteers is teachers involved in the parent-teacher,
student council, or other extra-curricular organizations associated with the
school system.
• Professionals in health, business, physical sciences, and managers all have a
higher-than-average likelihood of recruitment and lower-than-average
likelihood of volunteering on their own. It is almost as if there is a fixed pool
of people in these occupations who are willing and able to volunteer and the
higher the level of recruitment the smaller the pool becomes and the fewer

44
people left to volunteer on their own.* However, it may also be the case that
the propensity for individuals in these occupations to volunteer is low in
general, and their relatively high rates of volunteering are only due to the fact
that they are actively recruited by organizations.
• The third way people become volunteers is another form of recruitment, but in
this case, as members of an organization, they are asked to perform volunteer
duties for the organization. This differs from being recruited from outside the
organization in the sense that internal recruitment undoubtedly carries a fairly
strong obligation to concur. Across all occupations, there is virtually no
difference in the proportion of volunteers who started because their
organization needed volunteer help ― roughly one-quarter of volunteers
began in this fashion.
• The final way people become involved as volunteers is because family
members, particularly children, are involved in an organization of some type.
In some instances this form of volunteering is also obligatory, as when youth
sport leagues require parental involvement, even if sporadically. It can also
occur when parents become active in providing recreation or other services as
a way of spending time with their children. Across occupational groups the
proportion of volunteers who began because of family members is much the
same at about 17%. Among managers, however, the rate is higher at 24%.
Does this mean that managers are more inclined to get involved in their
children’s activities? Probably not; instead, it likely has more to do with the
fact that managers are more likely (43% versus 35%) than other occupations
to have school-aged children (6 to 17) in the home, and thus are more likely to
begin volunteering because of their children.
* It is important to recall that each person in the survey could report on up to three volunteering events (organizations), so the same person can actually have started in up to three different ways. For that reason the percentages across columns of Table A.5.A are not linked in any way, and they do not necessarily add to 100% within occupations across the table.

45
A.6. Reasons for Volunteering
• The reasons why individuals act as volunteers are as diverse as the volunteers
themselves. For five of eight reasons ascertained in the NSGVP of 2000,
there were no significant differences among occupational groups in the
proportion of volunteers who agreed with the reason offered. Among these are
volunteering to help a cause (95% of all volunteers agree), to use their skills
and experience (82%), because they have been personally affected or know
someone who has been affected by the cause (70%), to fulfill religious
obligations or beliefs (23%), and because they were required to by their
school, employer or government (8%). For the other three there are some
interesting differences.
Explore Own Strengths Because Friends Do Improve Job
Opportunities
Professionals Health 60 35 *Professionals Business 45 23 *Professionals Physical Sci 51 27 *Professionals Law, Arts, Soc Sci 55 23 22
Subtotal All Professionals 54 26 18Upper-level Managers 47 28 15White collar 65 30 30Blue collar 55 37 23
All Occupations 59 30 24
% of volunteers who agree
Reasons For Volunteering
Table A.9: Reasons For Being A Volunteer, NSGVP 2000
* results supressed due to small cell counts
• The first reason for volunteering where there are occupational differences is
“to explore one’s own strengths.” As is evident in Table A.9, white collar
volunteers, at 65%, are substantially more likely to agree that this is a reason
for their volunteering. This is followed by blue collar and professional
volunteers, at about 55%, and managers slightly lower at 47%. Although it is
difficult to say exactly what volunteers mean when they agree with this

46
reason, it would seem to refer to the opportunity to work in an environment
that challenges them in ways not available in other areas of their lives. From
this point of view, it is perhaps understandable that white collar workers
would value this aspect of volunteering more than managers or professionals.
The jobs the white collar workers perform are typically subject to levels of
routinization and subordination in an authority structure that would restrict the
range of experience that they can acquire at employed work. Volunteering
can then be one way for these individuals to expand the kinds and contexts of
work they are able to undertake. For professionals and managers,
volunteering is less likely to provide this sort of outlet, although it is still the
case that about half of volunteers in these occupations agree that this is a
reason why they volunteer. For blue collar workers, “exploring one’s own
strengths” may not be of great concern for people in the working class.
• The second reason described in Table A.9 is volunteering because one’s
friends volunteer. Overall, almost one in three volunteers (30%) report this as
a reason they volunteer. This points to an aspect of volunteering that is often
overlooked ― it is obviously unpaid work done for an organization but at the
same time it is a social activity, a way of spending time with friends and
acquaintances (Reed, et. al., 2000). This aspect of volunteering is particularly
important for blue collar workers (37%), and may be why this group shows a
strong preference for culture, recreation and sport organizations (Table A.4)
which are mainly member-benefit organizations that focus on providing social
activities for members. Among professionals, who are drawn more to
organizations in health and social services or education and research where
the focus is on providing services to a particular clientele, this reason is of less
importance.
• The final reason for volunteering is in order to improve one’s job
opportunities, and it is not surprising that white collar and blue collar workers
both espouse this reason. Volunteering can improve employment prospects in

47
two ways; first, by providing training and experience that enhance the
volunteer’s qualifications for other jobs, and second, by establishing or
expanding social networks that are important means for finding new
employment. This aspect of volunteering will be of less importance for
professionals and high-level managers who already have substantial expertise
and training, and will also have fairly extensive social networks based on their
occupational positions. However, it is also apparent that there are individuals
in these occupations who do see volunteering as a way to bolster their careers.
A.7. Reasons for Not Volunteering
• In Canada in 2000, about 71% of employed Canadians had not done any
volunteer work over the previous year. Across the full range of occupations,
nonvolunteers ranged from a high of 75% of blue collar workers to a low of
51% of professionals in law, arts and social sciences. The most common
reason for not volunteering was not having extra time (79% of nonvolunteers
agreed with this reason). Working full- or even part-time, combined with
obligations surrounding family life can often leave little time for discretionary
activities like volunteering. By comparison, only 48% of individuals who
were not employed gave lack of time as one of the reasons they were not
volunteers. There were other reasons for not volunteering that all occupation
groups gave in equal measure: 24% simply had no interest, 18% felt they had
already done enough volunteering, 13% could not volunteer because of health
reasons, 8% had had a disagreeable experience in the past with volunteering,
and 7% were concerned they might be sued over volunteer activities.

48
Unwilling to make a year-
round commitment
Give money instead of time
No one has personally asked you
Do not know how to become
involved
Financial cost of volunteering
Professionals Health 59 58 29 * *Professionals Business 56 50 30 17 *Professionals Physical Sci 66 39 47 26 14Professionals Law, Arts, Soc Sci 47 31 27 14 13Upper-level Managers 51 48 37 13 9White collar 47 36 40 19 19Blue collar 48 39 41 22 20
All Occupations 49 39 39 19 17
Table A.10: Reasons for Not Being a Volunteer, NSGVP 2000
% of non-volunteers
* results suppressed due to small cell counts
• Six of the reasons that were not equally supported by all occupational groups
are presented in Table A.10. The most common of these was an
unwillingness to make a year-round commitment (49% of all occupations). In
some respects, this reason is similar to simply not having extra time, although
it does acknowledge that volunteering can involve a long-term obligation to
provide regular services to a group or organization. Professionals, with the
exception of those in law, arts and social science, are more likely to select this
as a reason for not volunteering. All nonvolunteers give lack of time as a
reason for not volunteering, but professionals more than others also feel
unable to commit to long-term volunteer responsibilities with an organization.
Since professionals are more likely to be recruited (asked) to volunteer, a
situation where a long-term commitment is probably more often expected,
there may be greater reticence on the part of professionals to accede to that
commitment. However, the law, arts and social science professionals are the
least likely to be concerned about a commitment (along with white and blue
collar workers), and they show above-average levels of being recruited, so
being recruited to volunteer may not account for the unwillingness to commit
in the long-term.
• About 39% of nonvolunteers report that they give money instead of
volunteering their time. This reason is distinctly more common among health
49
professionals (58%), business professionals (50%) and high level managers
(48%) than among the other occupational group (between 31% and 39%). For
individuals who find it difficult to put time aside for volunteering, providing
financial assistance to an organization may be another way to support the
goals of the organization, but it is also a more viable strategy for those who
can afford to do so. In this case, the three occupations that give money rather
than time are at the high end of the income scale.
• A third reason people say they do not volunteer is because they have not
personally been asked to help out ― they have not been recruited. Two
groups more likely to give this reason are white and blue collar workers (40%
and 41% respectively), and this is fully consistent with the fact that volunteers
in these occupations are the least likely to have actually been recruited to
volunteering (Table A.8). Apparently, nonprofit and voluntary organizations
are less likely to focus their recruiting activities on people in these
occupations. In doing so, organizations may be overlooking a large pool of
potential volunteers because the implication of this reason is that at least some
of these people actually would volunteer if they were personally approached.
At the same time, a substantial proportion of this group (36%, or one in three)
also indicates that they do not know how to become involved in volunteering
on their own. So there is a sizeable group of individuals here who lack
information on how to become volunteers and are less likely to be the subject
of, but who may be receptive to, active recruitment.
• Two other occupational groups are also less likely to be asked to volunteer ―
managers and professionals in the physical and applied sciences. For
managers, this pattern is understandable if we also take two pieces of
information in Table A.8 into consideration. Managers who were volunteers
were among these most likely to have been recruited (57%), and least likely to
offer to volunteer on their own (25%). Combined with the relatively large
proportion (37%) of managers who do not volunteer because they have not
50
been asked, these results suggest that managers become volunteers mainly
when asked to do so.
• The same situation exists for the professionals in the physical and applied
sciences. Earlier we saw how this group was substantially less likely to be
volunteers than were high-level managers or other professionals (23% versus
33% to 49%). At the same time, volunteers from the physical and applied
sciences were most likely to have been recruited to volunteering (61%) and
among those least likely to volunteer on their own (27%). Those who were
not volunteers were most likely to say they had not been asked (47%) and
most likely to not know how to become involved (26%). This pattern
suggests the professionals in this occupational group are less aware of
opportunities to volunteer and thus are less likely to offer their services on
their own, and are less often recruited by organizations, but when they do
volunteer it is mainly because they were in fact recruited to do so. This
pattern may be related to the demand for the skills and knowledge this group
possesses relative to managers and other professionals. Unlike the latter
groups, professionals in the physical and applied sciences have skills and
knowledge that largely deal with scientific or technical aspects of the world
and these skills may be less in demand in most nonprofit and voluntary
organizations. In other words, there are few organizations that specifically
need the skills and knowledge of a physicist, a chemist, an architect or a
structural engineer. As a result, people in this occupational group may be less
prone to volunteer simply because there is less of a fit between their
specialized skills and their perception of the needs of nonprofit and voluntary
organizations.
• The fourth reason people say they do not volunteer is because they do not
know how to become involved and we have already discussed the groups that
are most likely to give this reason. However, it is noteworthy that managers
and most professionals are substantially less likely not to volunteer because

51
they lack information about opportunities to do so. This in itself may be a
reflection of their day-to-day involvement with people and groups in their
work environment who are involved in volunteering. In other words, the
social networks these occupational groups entail are likely to be good sources
of information about opportunities to volunteer.
• A final reason for not volunteering is worth noting because it again shows
why participation on the part of white and blue collar workers tends to be
lower than in other groups. About one in five individuals in this group do not
volunteer because of the financial costs they perceive to be associated with
volunteering. Volunteering can entail some costs and obviously those at the
high end of the occupational structure are better able to bear such costs and
thus are less concerned about them. However, the concern with potential
costs among less well-paid workers suggests that organizations might
encourage more participation if they were better able, or more willing, to
defray such cost for these individuals.
A.8. Employer Assistance in Volunteering
• The final aspect of volunteering differences across occupational groups is the
extent to which these individuals’ employers provide assistance for their
volunteer activities. This assistance can take one or more of three forms: use
of facilities or equipment, time off or time on the job for volunteering, and
approval to change work hours to accommodate time spent volunteering.
Across all occupations, about 41% of employees who were volunteers
received assistance of this type from their employers. However, for high-level
managers alone, support from employers was significantly higher (at 54%)
than any other occupational group. In one way, this may simply be a
consequence of the fact that high-level managers control the resources, in
terms of both labour and physical plant, of the companies they work for and

52
thus can essentially approve the use of these for their own volunteering.
However, since managers were much more likely to have been asked by their
employer to volunteer, the higher level of employer assistance may also
reflect the companies’ or employees’ desire to provide more than just a
volunteer body but also to facilitate the activities of that volunteer. The
evidence would seem to support this second reason for employer assistance.
Among volunteer managers who were not asked to volunteer by their
employer, 49% did receive assistance, but among those who were asked to
volunteer by their employer, fully 91% received assistance. So not only do
businesses encourage volunteering among employees as a way of contributing
to their communities, but they are also willing to accommodate their
employees’ work as volunteers by authorizing the use of equipment and
company time for these activities.
Figure A.11: Received Help from Their Employer
36
41
36
44
54
39 38
0
10
20
30
40
50
60
Healthprofessionals
ProfessionalsBusiness
ProfessionalsPhysical Sci
ProfessionalsLaw, Arts, Soc
Sci
Managers White collar Blue collar
% receiving help from their employer

53
B. Charitable Giving Among Occupational Groups
B.1. The Incidence and Magnitude of Charitable Giving
• About 81% of all employed individuals make at least one charitable donation
each year (Table B.1).
• Among particular occupational groups, nearly all business professionals make
donations (96%), with professionals in health and in law, arts and social
sciences close behind (89%). Rates for professionals in the physical and
applied sciences and upper-level managers stand at 83% and 86% respectively,
while white and blue collar worker rates are 79% and 77%.
Donors (000's)
Rate (%)
% of donors
Total Dollars Donated
% of Total $ Donated Mean Median
Professionals, Health 362 89 2.6 155,419,902 4.3 430 180Professionals, Business 478 96 3.5 246,706,876 6.8 516 230Professionals, Physical Sci 587 83 4.2 190,678,866 5.2 325 130Professionals, Law, Arts, Soc Sci 1,014 89 7.3 495,193,524 13.6 488 173Upper-level Managers 1,367 86 9.9 567,176,053 15.5 415 168White collar 6,532 79 47.2 1,429,278,079 39.2 219 60Blue collar 3,493 77 25.3 563,711,421 15.5 161 45
All Occupations 13,833 81 100.0 3,648,164,721 100.0 264 74
Table B.1: Charitable Giving in the Last 12 Months, NSGVP 2000
Donors Only
dollars
• Not only are they most likely to make a donation, but business professionals
also average the largest annual donation ($516), with professionals in law, arts
and social sciences donating $488 annually. Somewhat further back are health
professionals and upper-level managers at $430 and $415 respectively.
Professionals in the physical and applied sciences give substantially less than
the other occupations at the top of the occupational hierarchy. However, tests
indicate that the annual averages for physical and applied science professionals
are significantly lower, in statistical terms, only as compared to the business

54
professionals. Workers in the white and blue collar occupations, reflecting
their lower incomes, donate $219 and $161 respectively each year.
• The high levels of giving among professionals and upper-level managers is
evident in the fact that for each occupational group, the percentage of total
dollars donated to charities in 2000 is larger than the percentage of donors each
group represents. Business professionals, for example, made up 3.5% of all
donors, but they accounted for nearly twice (6.8%) that percentage of all
dollars donated to charities and nonprofits. Similarly, the low levels of giving
among white and blue collar workers is evident in that they account for a
smaller percentage of total donations than their percentage of donors, even
though together these individuals accounted for about 55% of all the money
donated to charities.
Average Household Income Donors (000's)
mean median
Professionals, Health 81,478 362 0.61 0.25Professionals, Business 89,188 478 0.61 0.28Professionals, Physical Sci 84,805 587 0.48 0.17Professionals, Law, Arts, Soc Sci 80,707 1,014 0.79 0.24Upper-level Managers 81,174 1,367 0.63 0.21White collar 58,287 6,532 0.43 0.13Blue collar 59,230 3,493 0.36 0.09
All Occupations 65,230 13,833 0.47 0.13
% of Household Income
Donors only
Table B.2: Percent of Household Income Donated to Charities, NSGVP 2000
• Clearly, an individual’s ability to make donations is related to their level of
income. Those with higher incomes will have more discretionary income out
of which they can make contributions. Table B.2 adjusts each occupation’s
giving by expressing their total charitable giving as a percentage of household
income. As with the average donations, professionals and upper-level
managers tend to give a higher proportion of income to charity relative to

55
occupations with lower household incomes (white and blue collar groups). The
exceptions are professionals in the physical and applied sciences, where the
percentage of income donated to charities is on a par with that of white collar
workers.
B.2. Patterns of Occupational Groups’ Charitable Giving to Organizations
• In the NSGVP 2000, information was collected about the types of organization
individuals gave donations to. The percentage of each occupational group that
made a donation to a particular organization type is presented in Table B.3 for
the six main types, with a residual category of “All Others” for six other types
that were less commonly the recipient of donations.
Health Social Services Religion
Education and
Research
Philanthropic Intermediaries and Volunteer
Promotion
Culture and Recreation All Others
Professionals, Health 87 54 45 34 24 17 21Professionals, Business 82 57 49 25 30 23 23Professionals, Physical Sci 71 56 30 25 40 19 14Professionals, Law, Arts, Soc Sci 73 53 48 31 33 22 23Upper-level Managers 76 54 41 25 32 26 23White collar 68 47 35 25 19 16 17Blue collar 61 44 37 23 17 17 13
All Occupations 68 48 37 25 22 18 17
Table B.3: Percent of Occupation Group That Gives to Each Type of Organization, NSGVP 2000
%
• Health organizations received donations from the largest percentage of working
Canadians (69%). The largest proportion of donors to health organizations was
among health (87%) and business professionals (82%). The groups least likely
to donate to these organizations were the white collar (68%) and blue collar
(61%) workers, although still better than six out of ten donors in both groups
did contribute to this type. This undoubtedly reflects the high profile of
various types of special interest health organizations and the fact that they care

56
for those who are ill is a strong focus of concern and often a personal
experience for most Canadians.
• Social service organizations received substantial support from Canadians;
almost half of all working donors gave to organizations of this type. Unlike
health organizations, there was relatively little variation across occupational
groups in their tendency to support this type. Between 44% (blue collar) and
57% (business professionals) of donors made one or more donations to aid
social service organizations. Since these organizations often deal with the most
needy in society, this indicates a broad range of support for the social provision
of basic necessities.
• A substantial proportion (37%) of employed Canadians made a donation to a
religious organization. Professionals and managers show extensive support for
this type, with the exception of those in the physical and applied sciences who
were least likely of all occupations to donate to religious organizations. Even
those in white collar (35%) and blue collar occupations (37%) were more likely
to donate to religious organizations. As we shall see later in the report, the low
level of financial giving by physical and applied science professionals is due to
this occupational group having a small proportion of religiously active
individuals compared to any other occupation.
• Support for education and research organizations was very similar across
occupations (about 25% of donors) with the exception of professionals in law,
arts and social sciences, who were slightly more likely to support this type
(31%) and health professionals who were markedly more likely to support
them (34%). The level of support from the former group is understandable
because it includes teachers from kindergarten through university levels who
would be both aware of, and interested in the success of organizations devoted
to providing educational services. The broad support for these organizations

57
by health professionals, in contrast, does not appear to be related to their
occupational situation.
• Organizations that act as philanthropic intermediaries or are involved in
volunteer promotion received donations from just over one in five donors.
Although it is impossible to determine from the NSGVP data, a major share of
this giving probably involves donations to the United Way campaigns that
occur annually each fall across Canada. Two occupational groups stand out in
giving to these types of organizations — professionals in the physical and
applied sciences, and blue collar workers. The latter are least likely to donate
to these organizations (17%), although they are not far behind the white collar
workers (19%). The professionals in the physical and applied sciences, in
contrast, show a markedly higher propensity to support organizations of this
type. This may indicate that these individuals, whose jobs are less “people-
oriented” relative to other professionals or managers, are less aware of
opportunities to donate to specific organizations and instead donate to umbrella
organizations that then disburse the funds to service providing organizations.
• The final recipient type includes culture, recreation and sports organizations.
These receive support from a fairly modest proportion of donors overall (18%).
Upper-level managers show a slightly higher propensity to give to these types
of organizations, and this may have to do with the widespread practice of large
corporations and businesses acting as sponsors for all sorts of cultural and
recreation activities, ranging from opera companies to little league hockey.
Managers for companies that act as sponsors are likely to take a personal
interest in supporting their sponsored organizations and activities. This may
also account for the tendency for business professionals to support
organizations of this type.

58
Health Social Services Religion
Education and
Research
Philanthropic Intermediaries and Volunteer
Promotion
Culture and Recreation
All Others
Total Donations
Professionals, Health 18 9 49 4 6 2 11 100Professionals, Business 34 7 38 4 7 3 7 100Professionals, Physical Sci 25 16 32 3 13 3 8 100Professionals, Law, Arts, Soc Sci 14 9 56 4 9 3 5 100Upper-level Managers 21 12 37 2 16 5 6 100White collar 18 9 50 3 7 3 9 100Blue collar 16 11 49 4 8 4 9 100
All Occupations 19 10 47 3 9 3 8 100
% of total donations
Table B.4: Percent of Total Donations by Each Occupation Group Going to Each Type of Organization, NSGVP 2000.
• While the data in the previous table shows the breadth of support for various
types of organizations in terms of the proportion of donors who give to
particular organization types, the level of support can be measured by the
proportion (%) of donations going to each type (Table B.4). From this
perspective, nearly half of all the money (47%) donated to nonprofits and
charities goes to religious organizations. Some portion of this money will go to
religious organizations that are charities in the traditional sense of the term, but
an indeterminate portion goes to the maintenance of religious congregations.
For individuals who are religiously active, support for their religious
community can be substantial and may be a large proportion of their total
giving. Across all occupations, support for religious organizations is high.
Better than half of the money donated by professionals in health, in law, arts
and social science, and among white and blue workers goes to religious
organizations. Among the other three occupational groups, one-third or more
of total donations go to this type.
• The connection between participation in a religious congregation and the
proportion of donations that go to religious organizations is visible in Table B.5
when the occupational groups are ranked on the basis of how religiously active
they are (defined as the percent who attend services monthly or more often). In
general, the larger the percentage of an occupational category that is religiously
active, the larger the proportion of religious donations. The two exceptions are

59
business professionals who are quite active but give a relatively small
proportion of their donations to religious organizations, and blue collar workers
who are not very active as a group but still give almost half their money to
religious groups.
% Religiously Active* Religious Dollars as % of Total Dollars Donated
Professionals, Health 44 49Professionals, Business 40 38Professionals, Law, Arts, Soc Sci 38 56White collar 31 50Upper-level Managers 29 37Blue collar 28 49Professionals, Physical Sci 19 32
All Occupations 31 47
Table B.5: Religious Attendance and Religious Giving, NSGVP 2000
* The religiously active attend services monthly or more often
• After religious organizations, health organizations attract the next largest share
of monies donated by working Canadians (19%).
• Health professionals, who were the most likely to support this type (87% did
so), give a relatively small proportion (18%) of their donations to health
organizations. This suggests that while almost all health professionals give to
health organizations, their donations are relatively small.
• At the other extreme are business professionals who also tend to support health
organizations (82%) and who give more than a third of all their donations
(34%) to this type.
• Social service organizations receive about 10% of the money donated to
charities, but they are a favoured target of professionals in the physical and
applied sciences who give 16% of their money to this type.
• Education and research organizations receive a relatively constant share of
donated monies across all organizations.
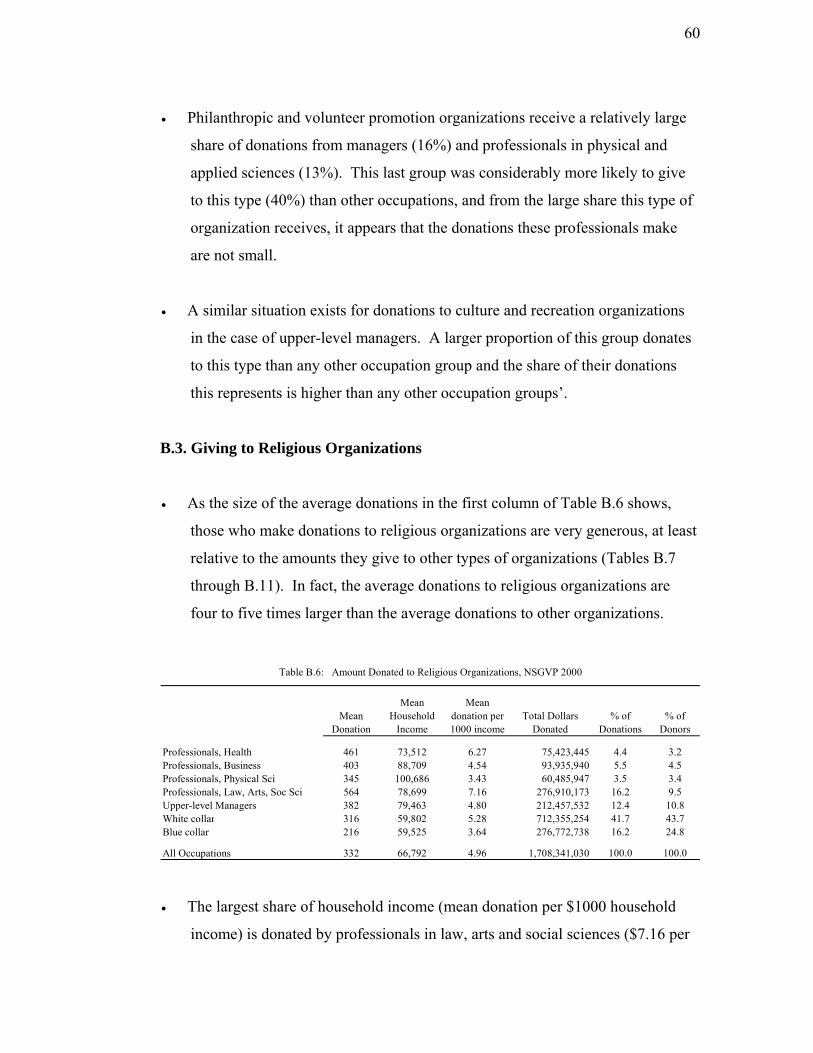
60
• Philanthropic and volunteer promotion organizations receive a relatively large
share of donations from managers (16%) and professionals in physical and
applied sciences (13%). This last group was considerably more likely to give
to this type (40%) than other occupations, and from the large share this type of
organization receives, it appears that the donations these professionals make
are not small.
• A similar situation exists for donations to culture and recreation organizations
in the case of upper-level managers. A larger proportion of this group donates
to this type than any other occupation group and the share of their donations
this represents is higher than any other occupation groups’.
B.3. Giving to Religious Organizations
• As the size of the average donations in the first column of Table B.6 shows,
those who make donations to religious organizations are very generous, at least
relative to the amounts they give to other types of organizations (Tables B.7
through B.11). In fact, the average donations to religious organizations are
four to five times larger than the average donations to other organizations.
Mean Donation
Mean Household
Income
Mean donation per 1000 income
Total Dollars Donated
% of Donations
% of Donors
Professionals, Health 461 73,512 6.27 75,423,445 4.4 3.2Professionals, Business 403 88,709 4.54 93,935,940 5.5 4.5Professionals, Physical Sci 345 100,686 3.43 60,485,947 3.5 3.4Professionals, Law, Arts, Soc Sci 564 78,699 7.16 276,910,173 16.2 9.5Upper-level Managers 382 79,463 4.80 212,457,532 12.4 10.8White collar 316 59,802 5.28 712,355,254 41.7 43.7Blue collar 216 59,525 3.64 276,772,738 16.2 24.8
All Occupations 332 66,792 4.96 1,708,341,030 100.0 100.0
Table B.6: Amount Donated to Religious Organizations, NSGVP 2000
• The largest share of household income (mean donation per $1000 household
income) is donated by professionals in law, arts and social sciences ($7.16 per
61
$1000), followed by health professionals ($6.27 per $1000). These two
occupational categories show a tendency to focus their giving on religious
organizations because they give the largest share of household income and they
give the highest proportion of their donations to these organizations relative to
the other occupational groups (see Table B.4).
• White collar workers also favour giving to religious organizations, with the
third highest share of income ($5.28) and the second highest proportion of total
donations.
• Professionals in the physical and applied sciences are substantially less
supportive of religious organizations. They donate the lowest share of income
($3.43) and the smallest proportion of their total donations.
• Blue collar workers give the second smallest share ($3.64 per 1000) of
household income to religious organizations, even though they give a high
proportion (49%) of all their donations to these groups. This indicates that
while they support religious organizations, their donations tend to be relatively
small. This can also be seen in the fact that blue collar workers make up 25%
of donors to religious organizations but account for only 16% of the charitable
funds these organizations receive.
• The strong support of law, arts and social science professionals for religious
organizations is also evident in that they represent about 10% of donors but
account for a substantially larger share (16%) of all donations to these groups.
B.4. Giving to Health Organizations
• The average donations to health organizations (Table B.7), which received the
second largest proportion of total donations, are considerably smaller than
those for religious organizations.
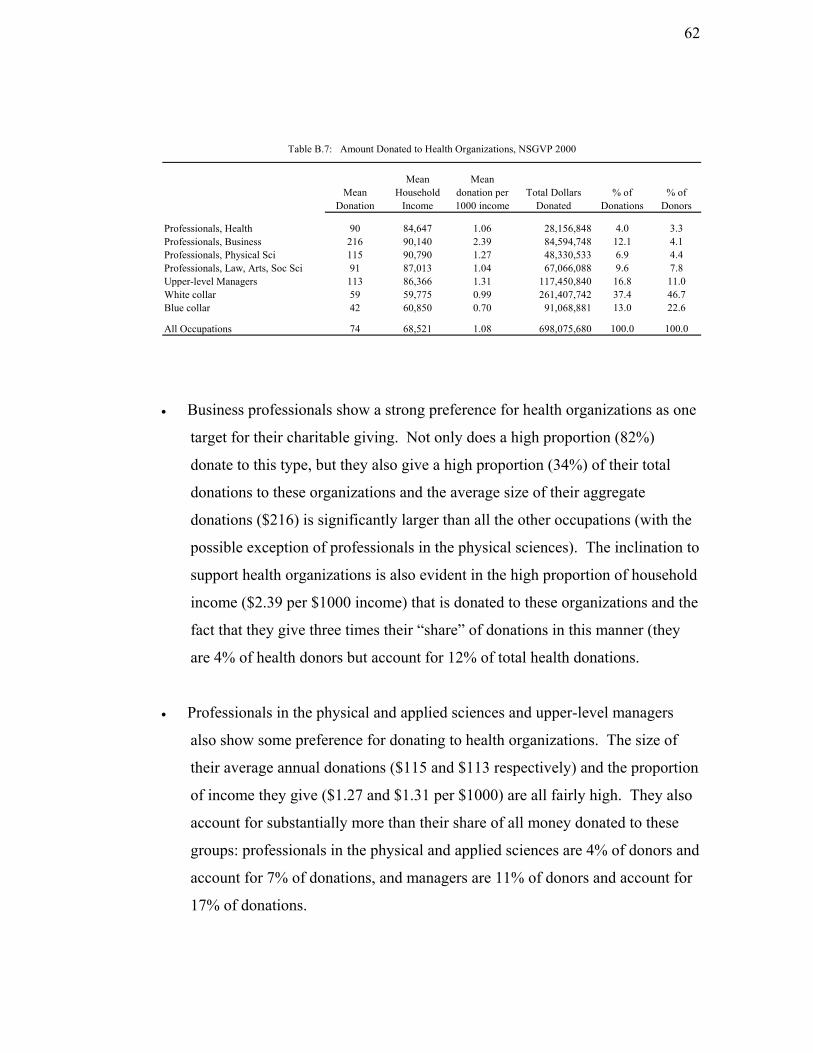
62
Mean Donation
Mean Household
Income
Mean donation per 1000 income
Total Dollars Donated
% of Donations
% of Donors
Professionals, Health 90 84,647 1.06 28,156,848 4.0 3.3Professionals, Business 216 90,140 2.39 84,594,748 12.1 4.1Professionals, Physical Sci 115 90,790 1.27 48,330,533 6.9 4.4Professionals, Law, Arts, Soc Sci 91 87,013 1.04 67,066,088 9.6 7.8Upper-level Managers 113 86,366 1.31 117,450,840 16.8 11.0White collar 59 59,775 0.99 261,407,742 37.4 46.7Blue collar 42 60,850 0.70 91,068,881 13.0 22.6
All Occupations 74 68,521 1.08 698,075,680 100.0 100.0
Table B.7: Amount Donated to Health Organizations, NSGVP 2000
• Business professionals show a strong preference for health organizations as one
target for their charitable giving. Not only does a high proportion (82%)
donate to this type, but they also give a high proportion (34%) of their total
donations to these organizations and the average size of their aggregate
donations ($216) is significantly larger than all the other occupations (with the
possible exception of professionals in the physical sciences). The inclination to
support health organizations is also evident in the high proportion of household
income ($2.39 per $1000 income) that is donated to these organizations and the
fact that they give three times their “share” of donations in this manner (they
are 4% of health donors but account for 12% of total health donations.
• Professionals in the physical and applied sciences and upper-level managers
also show some preference for donating to health organizations. The size of
their average annual donations ($115 and $113 respectively) and the proportion
of income they give ($1.27 and $1.31 per $1000) are all fairly high. They also
account for substantially more than their share of all money donated to these
groups: professionals in the physical and applied sciences are 4% of donors and
account for 7% of donations, and managers are 11% of donors and account for
17% of donations.

63
• The tendency for professionals in business, professionals in the physical and
applied sciences, and upper-level managers to favour health organizations may
have to do with the fact that the occupational experience of many of these
individuals, who are possibly less “people-oriented” in their work than the
other professional groups, provide them with less information about
opportunities to donate to other types of organizations. In this situation the
prevalence and high public profile of many health organizations may
disproportionately attract the donations of these occupational groups.
• Blue collar workers do support health organizations ─ a larger proportion of
this group makes at least one donation to health organizations than to any other
type, but both the average size of their donations ($42) and the proportion of
household income ($0.70 per $1000 income) are quite low.
B.5. Giving to Social Service Organizations
• The average annual donation to social service organizations (Table B.8) across
all occupations is slightly lower than that for health organizations ($56 versus
$74).
Mean Donation
Mean Household
Income
Mean donation per 1000 income
Total Dollars Donated
% of Donations
% of Donors
Professionals, Health 70 74,383 0.95 13,786,939 3.7 2.9Professionals, Business 65 83,691 0.78 17,879,221 4.8 4.1Professionals, Physical Sci 91 92,558 0.99 30,111,766 8.1 4.9Professionals, Law, Arts, Soc Sci 85 83,100 1.02 46,080,033 12.3 8.1Upper-level Managers 94 84,968 1.11 69,200,965 18.5 11.0White collar 44 58,269 0.75 135,449,382 36.3 46.1Blue collar 40 60,405 0.66 61,055,747 16.3 22.9
All Occupations 56 66,908 0.83 373,564,054 100.0 100.0
Table B.8: Amount Donated to Social Service Organizations, NSGVP 2000
• There is some variation in the average donation to social service organizations
among the professional and upper-level manager groups but none of the

64
differences are large enough to be statistically significant. Among these
individuals there is no strong evidence that one or more occupational groups
preferentially support social service organizations.
• If there is any indication that some occupations favour support for social service
organizations, it is among the three groups with the highest average donations.
Professionals in the physical and applied sciences, and in law, arts and social
sciences, and managers, tend to donate the largest proportion of their household
income ($0.99, $1.02 and $1.11 per $1000 income respectively) and also tend
to give more than their share when they do donate (5% of donors versus 8% of
donations; and 11% of donors versus 19% of donations).
B.6. Giving to Education and Research
• The size of donations to education and research organizations (Table B.9) is
about one-half the average for health organizations ($35 versus $74).
Mean Donation
Mean Household
Income
Mean donation per 1000 income
Total Dollars Donated % of Dollars
% of Donors
Professionals, Health 56 69,821 0.81 6,962,319 5.7 3.5Professionals, Business 74 98,086 0.75 8,900,179 7.3 3.5Professionals, Physical Sci 40 101,720 0.39 5,776,573 4.7 4.1Professionals, Law, Arts, Soc Sci 59 86,298 0.69 18,805,991 15.4 9.1Upper-level Managers 41 91,147 0.45 14,107,930 11.6 9.9White collar 28 60,500 0.47 46,703,778 38.3 46.9Blue collar 26 61,641 0.42 20,585,775 16.9 22.9
All Occupations 35 69,476 0.50 121,842,543 100.0 100.0
Table B.9: Amount Donated to Education and Research Organizations, NSGVP 2000
• Care must be taken when comparing giving to education and research
organizations across occupational groups; the spread in the size of donations
within each group is much larger than the differences between the groups in
their average donations. As a result, there are no statistically significant
differences between the average donations of any occupations.

65
• The organizations in this category are overwhelmingly involved in the
provision of support and services for the kindergarten through grade 12, the
K12 school system. For parents with children who benefit from these activities,
there may be a fairly strong obligation to support these organizations
financially, even to the extent of paying set fees. Since these costs would apply
equally to all parents regardless of income or occupation, there may not be
much difference between occupational groups in the size of their donations to
organization of this type.
• There is weak evidence that professionals in health, business, and law, arts and
social sciences preferentially support these organizations to some degree. For
all three groups, their average donation per 1000 dollars of household income
are the highest, and they donate about 40% more than their share to these
organizations (4% of donors versus 6% of donations, 4% of donors versus 7%
of donations, and 9% of donors versus 15% of donations).
B.7. Giving to Philanthropic Intermediaries and Volunteer Promotion
• Although one-quarter of working Canadians make one or more donations to
these kinds of organizations each year, these donations represent only 9% of
the money donated to all charities and nonprofits. Nonetheless, the average
donation made to these organizations ($109) ranks second only to the average
donation to religious organizations (Table B.10).
• One occupation group stands out in its preference for giving to organizations in
this category; upper-level managers annually average $211 in donations, give a
substantially higher proportion of household income ($2.04 per $1000 income)
and almost twice their share of the donations that go to organizations that act as
philanthropic intermediaries or support volunteer promotion. The reason
managers show a preference for this form of giving may be connected to the
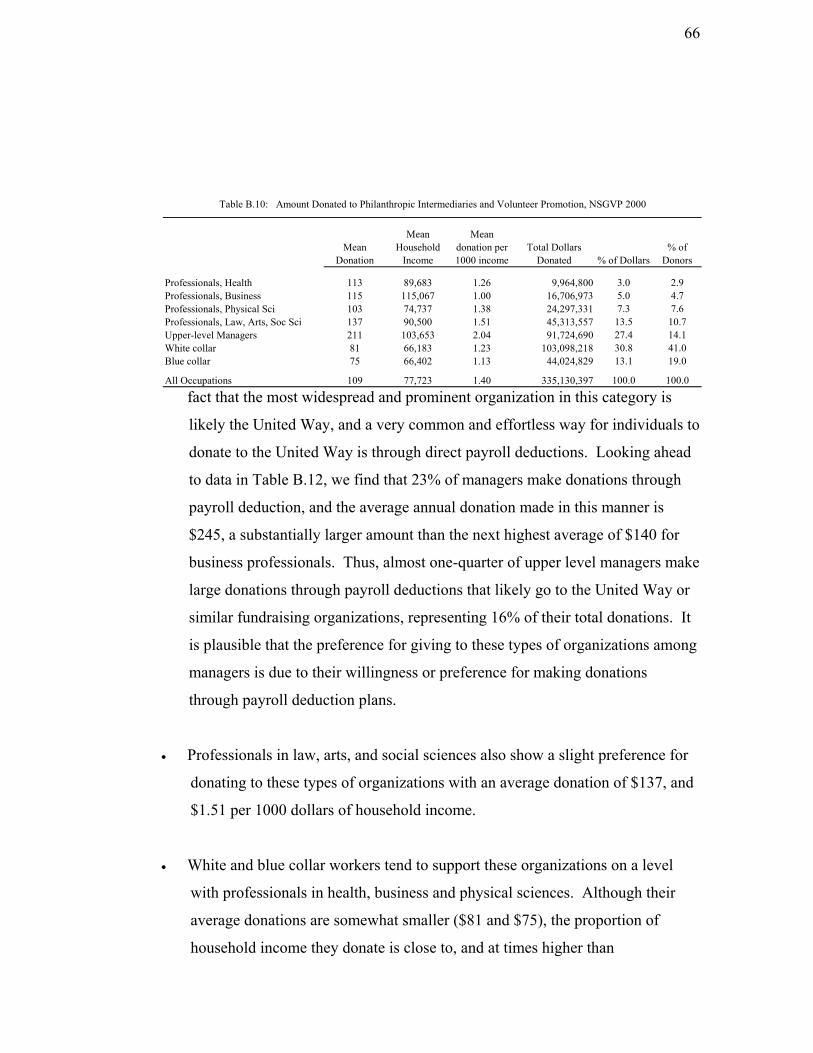
66
ct that the most widespread and prominent organization in this category is
to
r
Professionals in law, arts, and social sciences also show a slight preference for
White and blue collar workers tend to support these organizations on a level
Mean Donation
Mean Household
Income
Mean donation per 1000 income
Total Dollars Donated % of Dollars
% of Donors
Professionals, Health 113 89,683 1.26 9,964,800 3.0 2.9Professionals, Business 115 115,067 1.00 16,706,973 5.0 4.7Professionals, Physical Sci 103 74,737 1.38 24,297,331 7.3 7.6Professionals, Law, Arts, Soc Sci 137 90,500 1.51 45,313,557 13.5 10.7Upper-level Managers 211 103,653 2.04 91,724,690 27.4 14.1White collar 81 66,183 1.23 103,098,218 30.8 41.0Blue collar 75 66,402 1.13 44,024,829 13.1 19.0
All Occupations 109 77,723 1.40 335,130,397 100.0 100.0
Table B.10: Amount Donated to Philanthropic Intermediaries and Volunteer Promotion, NSGVP 2000
fa
likely the United Way, and a very common and effortless way for individuals
donate to the United Way is through direct payroll deductions. Looking ahead
to data in Table B.12, we find that 23% of managers make donations through
payroll deduction, and the average annual donation made in this manner is
$245, a substantially larger amount than the next highest average of $140 fo
business professionals. Thus, almost one-quarter of upper level managers make
large donations through payroll deductions that likely go to the United Way or
similar fundraising organizations, representing 16% of their total donations. It
is plausible that the preference for giving to these types of organizations among
managers is due to their willingness or preference for making donations
through payroll deduction plans.
•
donating to these types of organizations with an average donation of $137, and
$1.51 per 1000 dollars of household income.
•
with professionals in health, business and physical sciences. Although their
average donations are somewhat smaller ($81 and $75), the proportion of
household income they donate is close to, and at times higher than

67
professionals in this group. This may reflect the success of organiz
the United Way in generating support across all parts of society.
ations like
.8. Giving to Culture and Recreation Organizations
The average annual donation of 50 dollars to culture and recreation
rage for
Upper level managers show some preference for making donations to culture
ld income
d).
B
•
organizations (Table B.11) is second lowest, just higher than the ave
education and research organizations ($35).
•
and recreation organizations. A larger proportion of this occupational group
(26%) than any other makes the highest average donations to these
organizations. Managers also give the largest proportion of househo
($0.95) and contribute substantially more than their “share” to cultural and
recreational organizations (14% of donors account for 23% of dollars donate
Mean Donation
Mean Household
Income
Mean donation per 1000 income
Total Dollars Donated % of Dollars
% of Donors
Professionals, Health 55 83,591 0.66 3,441,271 2.7 2.5Professionals, Business 66 86,143 0.77 7,419,439 5.9 4.5Professionals, Physical Sci 57 92,701 0.62 6,472,633 5.1 4.5Professionals, Law, Arts, Soc Sci 71 96,852 0.73 15,906,816 12.6 9.0Upper-level Managers 82 86,820 0.95 29,052,369 22.9 14.1White collar 40 60,642 0.67 43,027,731 34.0 42.5Blue collar 37 66,326 0.56 21,273,603 16.8 23.0
All Occupations 50 72,033 0.70 126,593,863 100.0 100.0
Table B.11: Amount Donated to Culture and Recreation Organizations, NSGVP 2000
Among the remaining other occupational groups, giving to culture and
r
f
•
ecreation organizations is fairly even, with the exception of blue collar
workers who donate the lowest average ($37) and the lowest proportion o
household income ($0.56).

68
• The broad range of organizations encompassed by this category, from the
National Ballet to little league hockey to the neighbourhood chess club, make it
difficult to interpret the level of support these organizations generate among the
different occupations. Although donations tend to be small, and the proportion
of all monies donated to them is small (3%), they represent by far the single
largest group of nonprofit and voluntary organizations, about 30% (Hall
2004:13). These organizations clearly receive rather small donations from
relatively small groups of individuals who support their goals.
B.9. Giving to All Other Organizations Combined
• This category includes organizations involved with: the environment; economic
development and housing; law, advocacy and politics; international affairs;
occupation-related groups; and those not otherwise classified. As noted in
earlier sections, about 17% of working Canadians donate to one or more of
these types, accounting for 8% of all the money they donate to charities. These
numbers are small enough to make the estimates for giving by individual
occupational groups unreliable. Information is provided here only for the
overall average for all the occupations as a group. The average donation to this
category of organizations was $98, which represented about $1.40 per $1000 of
household income, a fairly high proportion relative to other organizational
types. Thus relatively few individuals make donations organizations making
up this set, but the donations to all 6 organization types are as large or larger
than those they make to health, social service or education and research
organizations.
B.10. Methods of Making Charitable Donations
• The most common method of making a donation to charity across all
occupations was to sponsor someone in a charity event such as a walkathon
(59% of all occupations donated in this way, in Column A in Table B.12).

69
The largest proportion of all the money donated to charities was donated
through individual churches, mosques, synagogues and temples – 42% of all
donations were made by this means (column B for All Occupations). The
largest annual donation ($317) and the highest average donation per donation
event ($291) were also made by this method. Since giving through this
method far surpasses all other forms for all the occupational groups, it
dominates the percentage of total donations, the average annual donation per
person, and the average donation per donation event. There are, however,
some general observations on the other methods of making donations, and
some patterns among occupations that are worth highlighting.
Solicitation Method
A B C D A B C D A B C D A B C D
Mail requests 46 13 124 73 47 13 140 79 37 18 158 91 43 12 142 72Pay to attend charity events 40 9 96 74 30 7 114 95 27 16 192 177 33 8 115 89Payroll deduction 13 3 103 91 15 4 140 140 29 11 129 124 19 5 123 118Sponsoring someone in event 57 4 29 23 57 4 38 30 54 6 37 32 59 4 34 26In Memoriam donations 39 7 78 63 45 21 239 171 15 3 74 60 29 4 64 49Asked by someone at work 25 2 43 36 23 3 67 54 33 3 32 28 31 5 75 65Door to door canvasers 55 2 18 13 46 2 22 16 37 3 27 17 46 2 23 15Canvased at a shopping centre 22 1 18 15 24 1 15 14 25 1 9 7 27 1 13 10Respond to a telephone request 14 2 72 61 19 2 47 34 11 3 73 55 11 1 43 32At church/mosque/temple 38 44 500 459 42 34 422 369 27 27 326 312 46 47 500 459On own initiative 15 6 176 154 7 5 372 307 10 3 96 89 9 5 284 215Radio, Television or Telethon * * * * 9 1 64 7 * * * * 6 0 39 36Other methods * * * * * * * * * * * * 9 6 336 304
Total donations 100 430 100 516 100 325 100 488
Solicitation MethodA B C D A B C D A B C D A B C D
Mail requests 42 14 138 89 25 10 92 59 19 10 81 53 28 12 110 68Pay to attend charity events 35 11 124 103 26 9 78 71 19 9 74 66 26 9 94 82Payroll deduction 23 13 245 228 14 7 119 112 14 8 104 97 16 8 136 128Sponsoring someone in event 59 6 40 30 50 6 25 20 45 5 20 17 51 5 27 22In Memoriam donations 27 3 52 43 20 5 51 43 18 5 43 34 22 6 66 53Asked by someone at work 24 3 52 44 22 2 25 22 17 2 23 20 22 3 35 31Door to door canvasers 40 3 28 18 36 3 19 13 38 5 19 14 38 3 21 14Canvased at a shopping centre 27 1 17 15 30 1 9 8 26 1 9 7 28 1 11 9Respond to a telephone request 12 2 86 71 9 1 31 26 8 2 37 30 10 2 44 36At church/mosque/temple 41 34 346 329 33 45 305 278 35 46 215 199 35 42 317 291On own initiative 7 3 178 168 6 5 169 156 6 4 102 92 7 4 170 152Radio, Television or Telethon 9 1 56 52 9 2 42 40 8 2 36 34 8 1 44 42Other methods 6 5 322 247 5 3 134 114 2 2 136 117 5 4 206 174
Total donations 100 415 100 219 100 161 100 264
Upper-level Managers White collar Blue Collar All Occupations
Table B.12: Percent of Each Occupational Group that Donated Through Each Method (Column A); Percent of Total Donations by each Occupational Group that was made by each Method (Column B); Average Annual Donation Per Person (Column C) and Average Donation Per Donation Event (Column D), NSGVP 2000
Professionals, Health Professionals, Business Professionals, Physical and Applied Sciences Professionals, Law, Arts, Soc Sci
% $ % $ % $ % $
$% $ % $
* results supressed due to small cell counts
% $ %
70
• For each occupational group, the three most common methods for making
donations (aside from giving through a religious organization) are by
sponsoring someone in a charity event, responding to door-to-door
canvassing, or by responding to requests in the mail. The first two may be
common ways of making donations, but the donations made are fairly small.
On average across all occupations, 5% of all the money given to charities
comes from sponsoring someone (or $27 dollars per donor per year), and 3%
from door-to-door canvassing (or $21 per donor per year). Mailed requests
for donations are considerably more effective in generating donations,
particularly among professionals and managers. In these groups, responding
to mailed requests account for between 12% and 18% of all the dollars they
donate, and the average donations per year are between $124 and $158
dollars. Answering mailed requests is less common among white and blue
collar workers, accounting for 10% of their donations, with averages of $92
and $81 per year.
• Payroll deductions for charity is a popular method for professionals in the
physical and applied sciences (29%) and upper-level managers (23%),
although the average amount donated this way each year is substantially
higher among managers ($245 versus $129).
• “In memoriam” donations are common among professionals in health (39%)
and business (45%), but the annual average donation by business
professionals ($239) is much larger than the health professionals ($78). In
fact, business professionals give sufficient money “in memoriam” that it
accounts for one-fifth (21%) of all the money they donate, considerably
higher than the 6% it accounts for across all occupations.
• Approaching a charity to make a donation on one’s own initiative is not a
common method of making donations (7% of all occupations do so), but the
average amount donated annually in this fashion is quite large, often ranking

71
second only to the annual average donation to a religious organization. The
least effective method for generating donations is by canvassing on the street
or in a mall. Although a fairly large proportion (28%) of all occupations
makes donations in this manner, they typically donate only $11 each year.
B.11. Planned Charitable Giving
• On average, almost one-quarter of working Canadians decide in advance which
organizations they will support through charitable donations, rather than
responding to solicitation by organizations (Table B.13).
Decide on Organization in
Advance
Donate Regularly to Certain Organizations
Professionals, Health 28 54Professionals, Business 27 44Professionals, Physical Sci 33 43Professionals, Law, Arts, Soc Sci 31 51Upper-level Managers 28 49White collar 21 36Blue collar 21 34
All Occupations 23 39
Table B.13: Characteristics of Planned Giving, NSGVP 2000
% yes
• This form of planned giving is highest among professionals and managers
(ranging from 27% to 33% of each group), with white collar and blue collar
occupations markedly less likely to decide which organizations they will
support in advance.
• On average, 39% of working Canadians give regularly to specific charitable
or nonprofit organizations.

72
• This form of planned giving is very high among managers and professionals
in health and in law, arts and social sciences; about half of all donors in these
occupations give regularly to selected organizations.
• This form of planned giving is slightly less common among professionals in
business and in the physical and applied sciences (between 43% and 44%).
• Giving of this type is substantially less common among white and blue collar
workers – just over one-third donate regularly to specific organizations.
• There is a close correspondence between the individuals who select recipient
organizations in advance, and those that tend to donate regularly to certain
organizations. In every occupational group, 70% or more of those who plan
their giving in advance donate regularly to particular organizations.
Conversely, across all occupation groups, 60% or more of those who make
donations in response to being solicited by charities, vary the organizations
they support. Thus there are two “typical” types of donors – a smaller group
(between one-fifth and one-third of a given occupation group) who select a
particular charity and then support it with regular donations, and a large
group (between one-third and one-half of a given occupational group), that do
not plan their giving in advance but instead donate to one or more charities
that approach them convince them they are worthy of support.
B.12. Reasons Donors Give to Charities
• Across all occupations, more than 92% of donors say that one reason they
make donations is because they feel compassion for people in need, and 90%
or more give because they want to support a cause in which they believe.
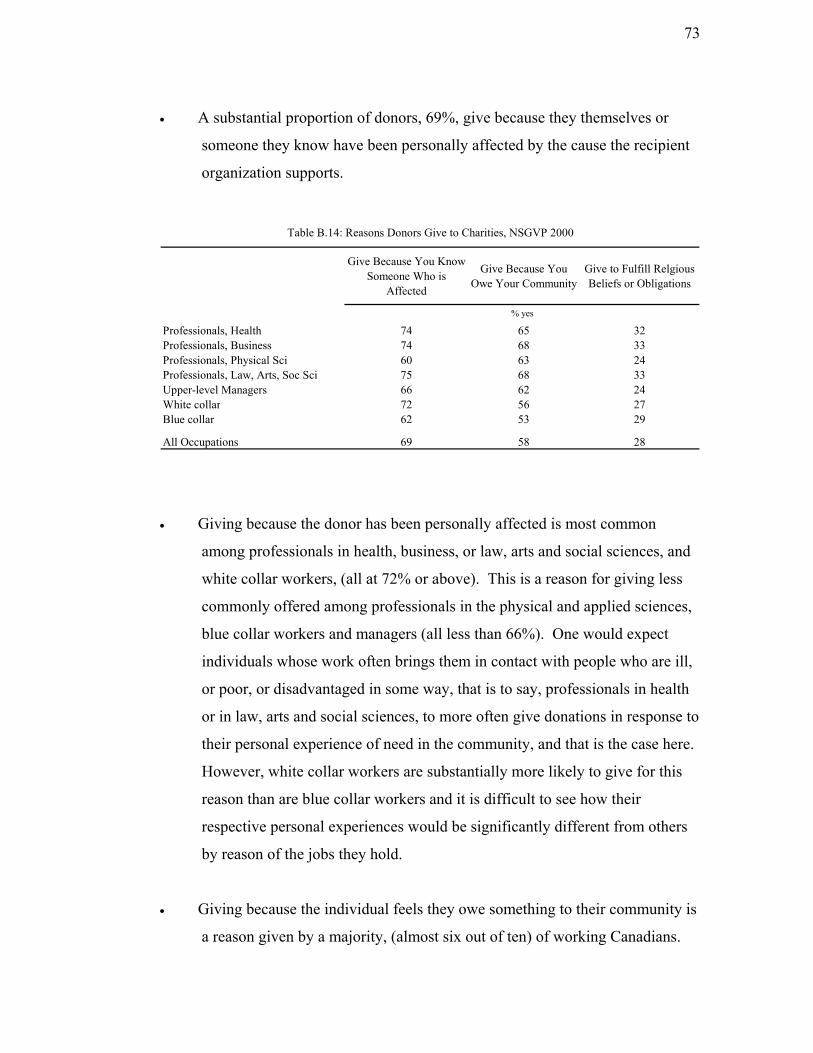
73
• A substantial proportion of donors, 69%, give because they themselves or
someone they know have been personally affected by the cause the recipient
organization supports.
Give Because You Know Someone Who is
Affected
Give Because You Owe Your Community
Give to Fulfill Relgious Beliefs or Obligations
Professionals, Health 74 65 32Professionals, Business 74 68 33Professionals, Physical Sci 60 63 24Professionals, Law, Arts, Soc Sci 75 68 33Upper-level Managers 66 62 24White collar 72 56 27Blue collar 62 53 29
All Occupations 69 58 28
Table B.14: Reasons Donors Give to Charities, NSGVP 2000
% yes
• Giving because the donor has been personally affected is most common
among professionals in health, business, or law, arts and social sciences, and
white collar workers, (all at 72% or above). This is a reason for giving less
commonly offered among professionals in the physical and applied sciences,
blue collar workers and managers (all less than 66%). One would expect
individuals whose work often brings them in contact with people who are ill,
or poor, or disadvantaged in some way, that is to say, professionals in health
or in law, arts and social sciences, to more often give donations in response to
their personal experience of need in the community, and that is the case here.
However, white collar workers are substantially more likely to give for this
reason than are blue collar workers and it is difficult to see how their
respective personal experiences would be significantly different from others
by reason of the jobs they hold.
• Giving because the individual feels they owe something to their community is
a reason given by a majority, (almost six out of ten) of working Canadians.

74
This reason is more common among individuals at the top of the occupational
hierarchy, the professionals and upper-level managers, than it is among white
and blue collar workers. As a reason for charitable giving, a sense of
obligation to others in society is more widespread among individuals who
occupy advantaged positions and perhaps have a greater awareness of
benefits of advancing the common good. For those who enjoy fewer of the
social benefits, there may be less basis for a similar sense of obligation.
• A substantial proportion of working Canadians (31%) are active in their
religious communities, and it is reasonable to expect these individuals to give
in response to the tenets of their religion. Across all occupations, among
those who attended religious services monthly or more often, between 50%
and 70% said they gave for religious reasons. Even among those who
attended services less often, an average of 14% gave for religious reasons.
• In total, 28% of working Canadians gave for religious reasons, and this was
fairly common across all occupations, with two exceptions. Professionals in
the physical and applied sciences and upper-level managers were less likely
to give with religious motives. Since these were the two occupational groups
with the lowest proportions of religiously active individuals, this reason will
naturally be less common.
B.13. Reasons for Not Donating More to Charities
• Two reasons that about half of donors gave for not giving more to charities
were that they were saving for their own future needs (51%), and that they
preferred to spend the money in other ways (48%). There were virtually no
differences between occupational groups in stating these reasons.

75
• One of the more common reasons for not giving more was because the donor
disliked the way organizations made requests for donations (48% overall);
this was most common among professionals in health and in law, arts and
social sciences (Table B.15). The work these two groups are involved in is
more likely to bring them in contact with people in need and as a result they
may more often be the target of fundraising campaigns that rely on
compassion or a sense of obligation in order to generate donations. If these
occupational groups are approached more often, the prevalence of this reason
of not giving more may indicate a higher level of donor fatigue.
Dislike the Way Requests for
Donations Made
Do Not Think the Money Will
Be Used efficiently
Give Enough Directly to
People
Volunteer Instead
Hard to Find a
Worthy Cause
Professionals, Health 53 44 41 37 13Professionals, Business 42 37 32 29 9Professionals, Physical Sci 49 55 30 19 12Professionals, Law, Arts, Soc Sci 55 41 29 35 6Upper-level Managers 51 49 41 23 13White collar 46 43 33 28 13Blue collar 49 53 39 23 19
All Occupations 48 46 35 27 14
Table B.15: Reasons Donors Do Not Give More to Charities, NSGVP 2000
% who agree with the reason
• The two groups less likely to disapprove of the way solicitations are made are
professionals in business and white collar workers. For the latter, it may
simply be the case that they are much less likely to be repeatedly approached
for donations. On one hand, their lower income makes them less likely targets
of fundraising, but also the large number of Canadians in this category simply
means that each person, on average, will be approached fairly infrequently.
The low level of dislike among business professionals may indicate a broader
acceptance of free-market business practices, including the repeated and at
times aggressive fundraising strategies of charitable organizations.

76
• A large proportion of working Canadians who are donors (46%) limit their
giving because they believe the money will not be used efficiently by the
organizations. Among managers, professionals in the physical and applied
sciences and blue collar workers, half or more of donors do not give more to
charities because they believe the money will not be used appropriately. For
blue collar workers this belief may reflect a more general lack of information
about the workings of charitable organizations, and perhaps also a more
widespread negative response to occasional revelations of administrative
malfeasance in prominent charitable organizations. The level of distrust
among professionals in the physical and applied sciences is unique among
professionals and may explain why they are least likely to be donors, and on
average give considerably less than other professionals (see Table B.1).
• Professionals in health, managers, and blue collar workers are most likely to
limit their giving because they have given enough money directly to other
people. Four in ten donors in these groups gave this as a reason for not giving
more, while just over three in ten individuals in the other occupations did so.
For blue collar workers, this response is perhaps understandable because any
money they give to others comes out of incomes that are much lower than
those of managers or professionals. However, white collar workers, whose
average household income is actually slightly lower than blue collar workers’
(see Table B.2), are less likely to give this reason for restricting their giving.
The prevalence of this reason among health professionals and managers,
whose incomes are relatively high, suggests that for these groups, giving
directly to others from a limited budget is not the situation that prompts this
response.
• Just over one-quarter of donors say they volunteer instead of giving more
money to charities. The two occupational groups that are most likely to offer
this reason, professionals in health and in law, arts and social sciences, are
also the two groups with the highest rates of volunteering (Table A.l). Some

77
individuals in these groups may actually be making a trade-off between
charitable giving and volunteering in fulfilling their sense of obligation to the
community. The low proportion (19%) of professionals in the physical and
applied sciences who say they volunteer instead of donating may reflect the
fact that among professionals, this group has a very low rate of volunteering
(23% compared to 40% or higher for other professional groups).
• On average, about 14% of working Canadians say they limit their donations
because it is difficult to find a worthy cause. What may be worrisome is that
almost 20% or one in five blue collar workers give this as a reason for
restricting their donations. This may occur because adequate information
about how and where to make donations is not reaching members of this
occupational group. It may also indicate that individuals in this group who
may be hesitant to come forward on their own are not being approached by
organizations soliciting funds. In other words, blue collar workers are less
likely to give, and to give less, partly because they are simply not being asked.
• As evidence of fairly widespread concern about how charitable donations are
actually used, respondents in the NSGVP 2000 were asked to express their
opinions on charitable organizations’ administrative and fundraising costs.
Table B.16, shows that about 40% of all working Canadians, donors and non-
donors, believe charitable organizations spend too much on administration
and fundraising, and this concern is fairly evenly spread across all the
occupational groups. There may be good reason for all charitable
organizations to undertake greater effort to make their internal accounting
transparent and available to the public.
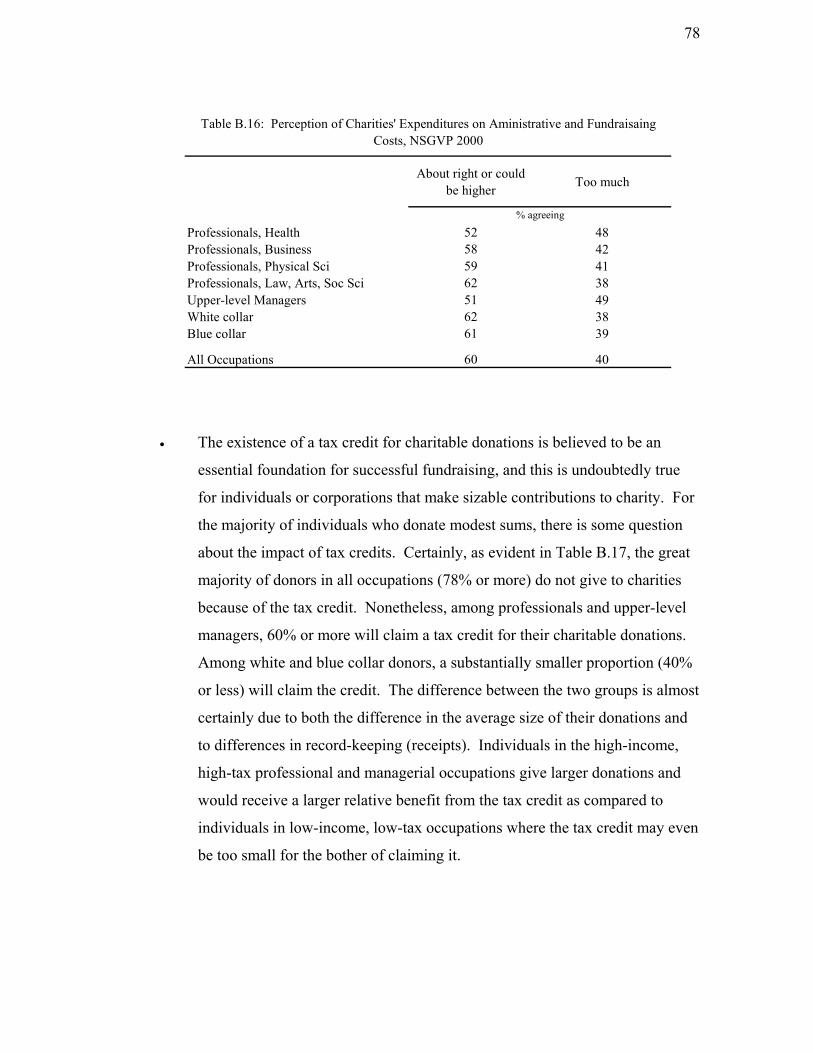
78
About right or could be higher Too much
Professionals, Health 52 48Professionals, Business 58 42Professionals, Physical Sci 59 41Professionals, Law, Arts, Soc Sci 62 38Upper-level Managers 51 49White collar 62 38Blue collar 61 39
All Occupations 60 40
Table B.16: Perception of Charities' Expenditures on Aministrative and Fundraisaing Costs, NSGVP 2000
% agreeing
• The existence of a tax credit for charitable donations is believed to be an
essential foundation for successful fundraising, and this is undoubtedly true
for individuals or corporations that make sizable contributions to charity. For
the majority of individuals who donate modest sums, there is some question
about the impact of tax credits. Certainly, as evident in Table B.17, the great
majority of donors in all occupations (78% or more) do not give to charities
because of the tax credit. Nonetheless, among professionals and upper-level
managers, 60% or more will claim a tax credit for their charitable donations.
Among white and blue collar donors, a substantially smaller proportion (40%
or less) will claim the credit. The difference between the two groups is almost
certainly due to both the difference in the average size of their donations and
to differences in record-keeping (receipts). Individuals in the high-income,
high-tax professional and managerial occupations give larger donations and
would receive a larger relative benefit from the tax credit as compared to
individuals in low-income, low-tax occupations where the tax credit may even
be too small for the bother of claiming it.

79
Do Not Give for Tax Reasons
Will Claim Tax Credit
Would Give More If Better Tax
Credit
Professionals, Health 89 74 56Professionals, Business 78 67 45Professionals, Physical Sci 79 61 55Professionals, Law, Arts, Soc Sci 82 71 50Upper-level Managers 89 60 47White collar 88 41 50Blue collar 87 31 50
All Occupations 87 45 50
Table B.17: Tax Credit Effects on Giving, NSGVP 2000
% yes
• The impact of tax policy on charitable giving may not be entirely
inconsequential. About half of current donors say they would give more to
charities if there were a greater tax credit, but how much more this would
entail is unknowable.
C. Civic and Political Participation Among Occupations
C.1. Civic Participation
• When work-related nonprofit organizations such as unions and professional
associations are considered, two-thirds of working Canadians are members of,
or participate in civic groups or organizations (Table C.1). When these work-
related organizations are excluded, 57% are involved.

80
N % N %
Professionals, Health 369,003 88 283,892 68Professionals, Business 410,813 77 366,292 69Professionals, Physical Sci 530,736 71 453,097 60Professionals, Law, Arts, Soc Sci 1,231,517 88 1,090,560 78Upper-level Managers 1,161,205 69 1,076,270 64White collar 5,691,116 64 5,013,827 56Blue collar 2,512,261 59 2,047,163 48
All Occupations 11,906,651 66 10,331,101 57
Table C.1: Participation in Civic Organizations in Last 12 Months, GSS17 2003
Without Occupational Associations or Unions
With Occupational Associations or Unions
Participation in Organizations
• Participation in civic organizations, excluding those that are work-related, is
significantly higher among law, arts and social science professionals (78%)
than any other occupational groups. The rate of participation is equal for
health and for business professionals (68%-69%). Participation rates declined
further from managers (64%) through professionals in the physical and
applied sciences (60%) and white collar workers (56%) to a low among blue
collar workers of 48%.
• The way the occupational groups are ranked in terms of their participation in
civic organizations is very similar to the way they would be if we were to rank
them on the extent to which the work they typically do involves them in the
care, supervision, education or remediation of other members of society. It is
plausible that the more an individual’s work brings them in contact with
people in these contexts, the greater their interest in being engaged in other
ways.
• On average, professionals in health and in law, arts and social sciences
reported involvement in two civic organizations (Table C.2). Business
professionals and managers were involved in slightly fewer, with

81
professionals in the physical and applied sciences, and white and blue collar
workers active in the fewest. Thus, not only are professionals and managers
more likely to participate in civic organizations; they also tend to participate in
more organizations. The exceptions are professionals in the physical sciences
who were at the other end of the spectrum - less likely to participate, and in
fewer organizations, than other professionals.
Civic organizations, including Occupational
Associations
Civic organizations, excluding
Occupational Associations
Active through the Internet
Professionals, Health 3.0 2.1 0.7Professionals, Business 1.9 1.5 0.7Professionals, Physical Sci 1.7 1.3 0.9Professionals, Law, Arts, Soc Sci 2.7 2.1 0.9Upper-level Managers 1.9 1.7 0.7White collar 1.5 1.3 0.4Blue collar 1.3 1.0 0.3
All Occupations 1.7 1.3 0.5
average number
Table C.2: Level of Participation in Civic Organizations, GSS17 2003
• Using the internet as a means to participate in civic organizations was about
evenly distributed among professionals and managers. It was distinctly lower
among white and blue collar workers, a sector of society where both access to
the internet and the computing skill to do so comfortably are less common.
• The frequency with which individuals participate in all civic organizations
(including work-related ones) is highest among professionals (Table C.3).
And as would be expected, there is a reciprocal relationship between
frequency and diversity of civic participation: those who participate in more
organizations (professionals in law, arts and social sciences and in health)
tend to participate most frequently, and those who participate in few
organizations, such as blue collar workers, are involved in these organizations
less often.

82
Two or more times per month Once a month or less Less than once per year Total
Professionals, Health 44 37 19 100Professionals, Business 44 30 26 100Professionals, Physical Sci 40 25 35 100Professionals, Law, Arts, Soc Sci 55 29 16 100Upper-level Managers 42 24 34 100White collar 39 20 40 100Blue collar 32 22 46 100
All Occupations 39 23 38 100
Table C.3: Frequency of Participation in Organizations, GSS17 2003
%
Civic Participation, with occupational associations
• If the extent and frequency of participation in civic organizations is one
indication of an occupational group’s level of civic engagement, the
professions tend to exhibit high levels of engagement while blue collar
workers exhibit the lowest levels.
• Approximately one-third of working Canadians belong to, or participate in,
work-related organizations, a category which includes professional
associations, business and industry groups, and unions (Table C.4).
Participation in these kinds of organizations is very high among professionals
in health and in law, arts and social sciences. For health professionals, the
high rate reflects widespread membership in medical organizations such as the
Canadian Nurses Association and the Canadian Medical Association. For the
broad category of professionals in law, arts and social sciences, the high level
of participation reflects membership in the Canadian Bar Association and
chapters of the Teachers’ Federation. It also includes membership in a wide
diversity of professional organizations linked to academic and career
specialties.
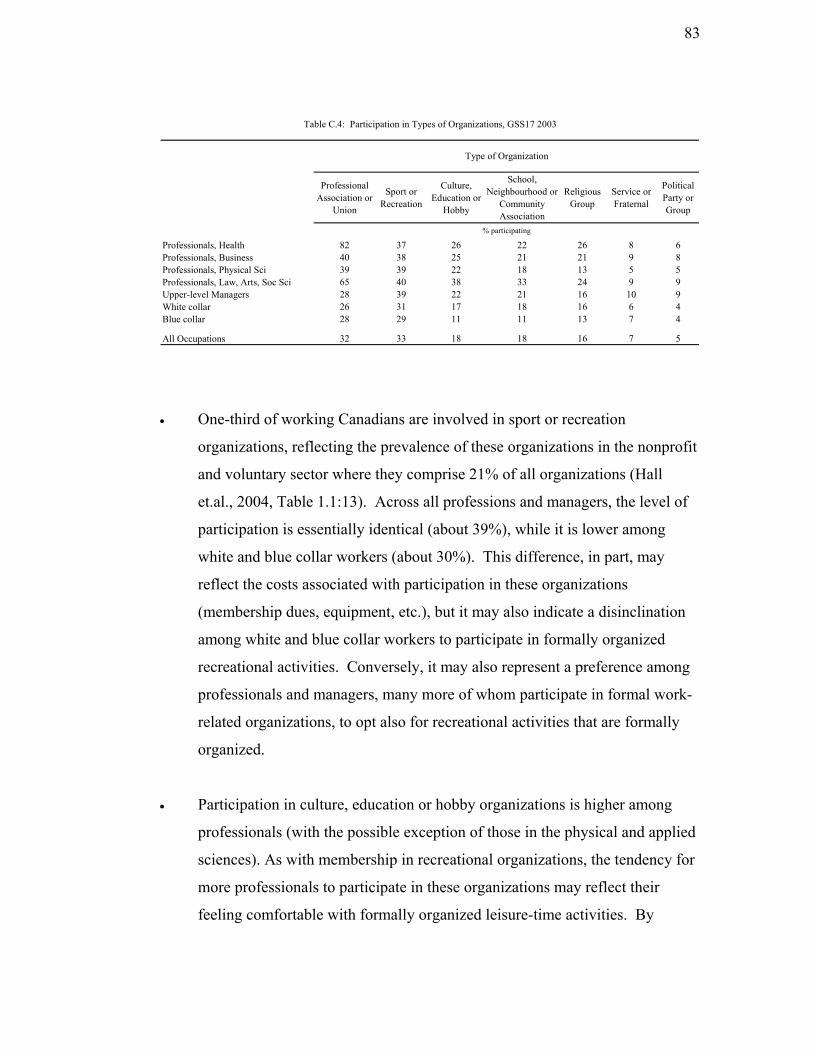
83
Professional Association or
Union
Sport or Recreation
Culture, Education or
Hobby
School, Neighbourhood or
Community Association
Religious Group
Service or Fraternal
Political Party or Group
Professionals, Health 82 37 26 22 26 8 6Professionals, Business 40 38 25 21 21 9 8Professionals, Physical Sci 39 39 22 18 13 5 5Professionals, Law, Arts, Soc Sci 65 40 38 33 24 9 9Upper-level Managers 28 39 22 21 16 10 9White collar 26 31 17 18 16 6 4Blue collar 28 29 11 11 13 7 4
All Occupations 32 33 18 18 16 7 5
% participating
Table C.4: Participation in Types of Organizations, GSS17 2003
Type of Organization
• One-third of working Canadians are involved in sport or recreation
organizations, reflecting the prevalence of these organizations in the nonprofit
and voluntary sector where they comprise 21% of all organizations (Hall
et.al., 2004, Table 1.1:13). Across all professions and managers, the level of
participation is essentially identical (about 39%), while it is lower among
white and blue collar workers (about 30%). This difference, in part, may
reflect the costs associated with participation in these organizations
(membership dues, equipment, etc.), but it may also indicate a disinclination
among white and blue collar workers to participate in formally organized
recreational activities. Conversely, it may also represent a preference among
professionals and managers, many more of whom participate in formal work-
related organizations, to opt also for recreational activities that are formally
organized.
• Participation in culture, education or hobby organizations is higher among
professionals (with the possible exception of those in the physical and applied
sciences). As with membership in recreational organizations, the tendency for
more professionals to participate in these organizations may reflect their
feeling comfortable with formally organized leisure-time activities. By

84
comparison, the very low levels of participation among blue collar workers
suggest they have less interest in formal leisure-time activities.
• Almost one-fifth of working Canadians are members of, or participate in
school, neighbourhood or community groups or associations. Participation is
particularly high among professionals in law, arts and social sciences, and is
particularly low among blue collar workers. The former, in their work, deal
most directly with the social side of every day life and this may translate into
a more proactive stance in the activities they pursue outside of work. They
also possess the legal, educational or social knowledge and skills that would
place a high value on their participation in these types of organizations. The
low level of participation among blue collar workers, conversely, may reflect
their lack of knowledge and skills in this area, but it may also reflect less
opportunity to participate if these community-based organizations are less
common in their neighbourhoods.
• Slightly more than one in six working Canadians were members of, or
participated in religious organizations. Participation in such organizations and
groups is consistent with the extent to which each occupational group is
religiously active as measured by frequency of religious attendance. The
three occupational groups with the highest levels of religious group
participation ― professionals in health, in business, and in law, arts and social
sciences ― are the groups with the largest proportion of religiously active
members (see Table B.5), while two occupational groups with the lowest
participation in religious groups, the professionals in the physical and applied
sciences and blue collar workers, are the two with the smallest proportion of
religiously active members. Civic participation in religious groups of various
sorts is understandably a consequence of a religious congregation.
• Participation in fraternal or community service organizations is notably low
compared to other types of organizations (7%), but the pattern of participation

85
across occupations is of interest. Four of the occupational groups are
significantly more likely to participate in these organizations than the other
three ― high-level managers, and professionals in business, in law, arts and
social sciences, and in health. For managers and business professionals, this
is likely to be participation in business-related service organizations such as
the Chamber of Commerce or the Rotary Club. For professionals in health or
law, arts and social sciences, it may be participation in the more broadly-
based service organizations such as the Lions, Optimists or Kiwanis Clubs.
• Participation in fraternal or service organizations is lower among
professionals in the physical sciences, and white and blue collar workers.
However, this is the one area of participation in voluntary (non-work related)
groups and organizations where blue collar workers are slightly more likely in
statistical terms to participate than are white collar workers. The particular
combination of social club, community and charitable activity may be
particularly attractive to this group of Canadians, where other types of
organizations are less so.
• Participation in political parties or groups is very low across all occupational
groups, but is highest among professionals and managers (again with the
exception of professionals in the physical and applied sciences). The levels of
participation are highest among the occupational groups that may contain
centre-right (managers and business professionals) and centre-left (law, arts
and social sciences) political persuasions. The participation rates for white
and blue collar workers are only slightly lower, but with differences that
nonetheless are statistically significant. Lower levels of participation among
these individuals are consistent with the higher levels of political indifference
found among white and blue collar workers (Jedwab, 2004).

86
C.2 Voting and Political Activities
• Three-quarters of working Canadians say they voted in at least one recent
election. Participation in this most basic form of citizen participation is lower
in particular elections. About two-thirds of the GSS17 survey respondents
voted in the most recent federal or provincial election, and just over half in
municipal elections (Table C.5).
Any election Federal Provincial Municipal
Professionals, Health 82 79 74 62Professionals, Business 85 78 78 62Professionals, Physical Sci 74 71 67 49Professionals, Law, Arts, Soc Sci 84 80 78 61Upper-level Managers 81 77 75 63White collar 71 65 64 52Blue collar 70 64 63 50
All Occupations 74 68 67 54
Table C.5: Voted in Most Recent Elections, GSS17 2003
% yes
• In every election, the pattern of participation across occupations is virtually
identical. Upper-level managers and professionals, except those in the
physical and applied sciences, show high levels of participation, with white
and blue collar workers’ participation is about 10 percentage points lower.
This last pattern obviously reflects higher levels of disengagement that tend to
exist at the lower levels of the occupational and socio-economic structure.
• The reason for the low rate of participation at all levels among professionals
in the physical and applied sciences is less clear, but it is consistent with much
of the data on the contributory and participatory behaviour of this group that
we have examined up to this point. Whether looking at volunteering,
charitable giving or civic participation, professionals in this occupational
category show distinctly lower levels of participation relative to other
professionals. This pattern may be the clearest evidence we have for the
nature of the connection between the work a person does and the character of

87
their participation in social contexts outside their workplace. Among all the
professionals and managers, the work of professionals in the physical and
applied sciences does not directly deal with people as other members of
society, nor with society itself in some larger sense. This may predispose
them less towards various forms of interaction with others, or it may actual
limit their opportunities for participation. In either case, the result is below-
average levels of social and civic engagement.
ly
Participation in political actions takes many forms among working Canadians
•
(Table C.6). Almost one-third had signed a petition, one-quarter or more had
researched political issues, boycotted or bought products for ethical reasons or
attended a public meeting. Substantially fewer had contacted the media or a
politician to express their views, marched in a demonstration or rally, or
volunteered for a political party.
Signed a Petition
Researched Political Issues
Chosen or Boycotted
Products for Ethical Reasons
Attended a Public
Meeting
Expressed Views by Contacting News media or
Politician
Marched in a Demonstration
Volunteered for a Political
Party
Professionals, Health 43 34 33 30 17 9 *Professionals, Business 34 37 29 26 21 7 5Professionals, Physical Sci 37 48 31 28 16 7 3Professionals, Law, Arts, Soc Sci 50 51 47 39 25 17 5Upper-level Managers 31 33 29 31 18 5 5White collar 31 26 21 19 11 7 2Blue collar 25 21 15 20 10 5 2
All Occupations 32 29 24 23 13 7 3
% yes
Table C.6: Participation in Political Actions, GSS17 2003
* results supressed due to small cell counts
Across all seven types of political action, professionals in law, arts and social
White and blue collar workers are least likely to participate in any of the
types of political action, and in most cases, their levels of participation are
markedly lower than that of professionals (but not always that of managers).
•
sciences were most likely to report participation in the previous 12 months.
•

88
I: The Case of Medical Professionals and Health Workers: A Detailed Look at Contributory Behaviours in the Health Sector
Part I
D. Volunteering Among Medical Professionals and Other Health Workers
• Volunteering time and giving money to charitable organizations are two
standard ways individuals contribute to the vitality of their communities. As
noted earlier, professionals of all types show a significantly higher tendency
to work as volunteers compared to the other three occupational groups. And
although professionals in the health sector appear lightly more likely to be
volunteers than other professionals (43 versus 39 percent), the difference is
not statistically significant. Managers, administrators, and routine white-
collar groups are about equally likely to volunteer (their rates are not
significantly different statistically) but are about 6 to 10 percentage points
less likely to volunteer than professionals. Blue collar occupation groups are
least likely to volunteer (21%) a level which is significantly lower than all the
other organization groups.
• While health professionals have one of the highest rates of participation as
volunteers, they also have the lowest average hours volunteered per year,
although their mean annual hours of 110 are significantly lower only when
compared to other professionals. Thus, where health professionals show a
probability of volunteering that equals or exceeds other occupational groups,
the amount of time they devote to these activities appears to be lower than all
other groups. To examine these patterns further, we sub-divided the health
professionals into two groups, treating MDs and other health professionals
separately, and treating medical aides and orderlies separately from other
white collar workers.

89
D.1. The Incidence and Magnitude of Volunteering
Be da (0.4% of all
General Social Survey Cycle 17 (Table D.1).
Medical A 9Other ProfUpper MaWhite Co 10Blue colla 08
All Occup 110
cause MDs are a small proportion of the population in Cana•
occupations), we have usable data on volunteering only from the 2003
Estimated Number of Volunteers Rate
% of Volunteers
% of Occupational
StructureTotal Hours Volunteered
% of Total Hours
Mean Hours
Median Hours
lth Professionals 144,626 41 2.3 1.9 12,902,452 1.5 90 34ides and Orderlies 132,780 29 2.1 2.5 17,262,648 2.0 130 10essionals 1,202,692 45 18.9 14.9 166,839,824 18.9 140 112nagers 725,456 43 11.4 9.3 101,693,360 11.5 141 111llar 3,073,629 36 48.4 47.3 437,131,709 49.5 144 1r 1,048,781 25 16.5 23.6 145,659,243 16.5 141 1
ations 6,353,947 35 100.0 100.0 883,625,503 100.0 141
Volunteers Only
Table D.1: Volunteering in Past 12 Months, GSS17 2003
MDs 25,983 38 0.4 0.4 2,137,357 0.2 82 35Other Hea
•
fessionals at 41%. These rates are slightly higher
than those for white collar occupations (36%) and are distinctly higher than
•
•
ee
occurs for the “other professional” category.
Blue collar groups are substantially under-represented among volunteers.
The highest rates of volunteering occur among professionals (45%) and
managers (43%). Rates for health professionals are slightly lower with MDs
at 38% and other health pro
the rate of volunteering among blue collar occupations (25%), or among
medical aides and orderlies (29%).
MDs comprise about 0.4% of all volunteers, equal to the proportion they
comprise in the population.
Other health professionals, other professionals, and managers are all over-
represented among volunteers, when the percentage of volunteers is
compared to the percentage in the occupational structure. The largest degr
of over-representation
•

90
• As with MDs, medical aides and orderlies, and white collar occupations
participate as volunteers at levels that are about equal to their proportion of
• volunteering in 2003, or an
average of 82 hours per volunteer during the year.
• Other health professionals contributed almost 13 million hours in 2003, or an
average of 90 hours per volunteer. This is only slightly higher than MDs (but
is not statistically significant).
• The average amount of time volunteered each year is about the same (around
140 hours) for other professionals, managers, and white and blue collar
occupations. These averages are significantly higher, statistically, than the
•
ese
outside of work. Table D.2 shows that as
a group, MDs tend to work the most hours in a given week (just over 50
and
se groups, less time will be available for
volunteering compared to most other occupations.
• r all the
ek. In
fact they volunteer almost twice as much time each week (2.7 hours) as do
the occupational structure.
MDs contributed just over 2.1 million hours to
averages for both MDs and other health professionals.
One reason why we offer the conjecture that both the participation rate and
average hours volunteered by MDs are lower than that of other health
professionals, other professionals and managers, may relate to the time th
occupational groups have available
hours). This is a significantly higher average than that of all but managers
blue collar workers. For the
However, hours spent at paid employment do not appear to account fo
differences between MDs and other occupations. Managers, who work an
average of 3 fewer hours each week, volunteer 1 hour more each we
MDs (1.6 hours).

91
Table D.2: Hours Worked in the Last Week, GSS17 2003
Last Week
Hours EmployedHours
Volunteereda
2.5Other Professionals 39.3 2.7Upper Managers 47.1 2.7
C.1 divided by 52
MDs 50.3 1.6Other Health Professionals 36.0 1.7Medical Aides and Orderlies 34.6
White Collar 34.7 2.8Blue collar 43.9 2.7
All Occupations 27.6 2.7
a. This is the average annual hours in Table
ing”,
ree.
•
ies,
D.2.1.
• We cannot determine how much pro bono work MDs reported they did in
their medical practice. If they do not consider this work to be “volunteer
then there will be a tendency for both their participation rate and hours
volunteered to be underestimated to some unknown deg
D.2. Characteristics of Volunteers
Because MDs represent a small proportion of the sample in GSS 17, it is
difficult to get accurate numbers about the character of those who act as
volunteers. However, if the characteristics are restricted to broad categor
some interesting results can be obtained.
Gender
• From the data in Table D.3, it would appear that women MDs are more likely
to volunteer than their male counterparts. However, given the limited
number of MDs in each gender group, the difference between men and
women is not statistically significant.

92
No Yes Total
MDs Male 70 30 100.0Female 49 51 100.0Total 62 38 100.0
Other health professionals Male 57 43 100.0Female 59 41 100.0Total 59 41 100.0
Medical aides and orderlies Male 71 29 100.0Female 71 29 100.0Total 71 29 100.0
Other professionals Male 57 43 100.0Female 53 47 100.0Total 55 45 100.0
r Managers Male 57 43 100.0Female 56 44 100.0Total 57 43 100.0
e collar Male 66 34
Total 75 25 100.0
Uppe
Whit 100.0Female 63 37 100.0
tal 64 36 100.0
ale 76 24 100.0Female 72 28 100.0
Volunteer
Table D 3: Volunteers by Gender, GSS17 2003
%
To
Blue collar M
• or, the other health professionals,
and medical aides and orderlies, men and women are equally likely to be
s. This is also true of other professionals and managers.
re
Among others who work in the health sect
volunteer
• Only among white and blue collar workers are the proportions of men and
women who volunteer statistically different, and in both cases women a
slightly more likely to be volunteers.

93
D.2.2. Region
• MDs in Ontario appear more likely to be volunteers than MDs elsewhere in
Canada, but the differences (seen in Table D.4) among MDs are barely
significant statistically. Thus the 24 percentage point difference (seen in
Table D.4) may actually be substantially smaller.
er Managers Outside Ontario 56 44 100.0Ontario 58 42 100.0Total 57 43 100.0
White c0
100.0
lue collar Outside Ontario 75 25 100.0Ontario 77 23 100.0
Table D.4: Volunteers by Region, GSS17 2003
Volunteer
%No Yes Total
MDs Outside Ontario 71 29 100.0Ontario 46 54 100.0Total 62 38 100.0
Other health professionals Outside Ontario 59 41 100.0Ontario 59 41 100.0Total 59 41 100.0
Medical aides and orderlies Outside Ontario 75 25 100.0Ontario 65 35 100.0Total 71 29 100.0
Other professionals Outside Ontario 56 44 100.0Ontario 54 46 100.0Total 55 45 100.0
Upp
ollar Outside Ontario 65 35 100.0Ontario 62 38 100.Total 64 36
B
Total 75 25 100.0
• collar workers in Ontario, are also
more likely to be volunteers than are their counterparts elsewhere in Canada.
In contrast, among other health professionals, other professionals, managers,
Medical aides and orderlies, and white

94
and blue collar workers, the levels of volunteering are essentially the same in
Ontario and elsewhere.
D.2.3.
• ational groups concerns
the stage in the lifecycle where a particular group tends to be most active as
volunteers. For all occupation groups, with the exception of MDs,
individuals ages 55 and older are as or slightly more likely to participate as
volunteers when compared to individuals ages 54 or younger (Table D.5).
However, for all these groups, the slightly higher rate in the older age bracket
is not statistically different from that of the lower age bracket. The MDs are
the exception; they show a distinctly higher (and statistically significant)
likelihood for volunteering at older rather than younger ages.
• Earlier we found that MDs who were volunteers average substantially fewer
volunteered hours per year than all other occupational groups and we noted
that the amount of time MDs devote to their practices could have a bearing.
Since MDs worked the most hours per week of all the occupational groups,
their discretionary time available for volunteering might be more limited than
is the case for those in other lines of work. For many MDs, it is apparent that
they are able to reduce the time they devote to work after age 55. In the GSS
17 survey, MDs aged 54 and younger worked an average of 55 hours each
week. For MDs aged 55 and older, this falls significantly to 36 hours per
week. This drop in hours worked (-19 hours) is substantially larger than
occurs for any other occupational group (the next largest being a 7-hour drop
among other health professionals). Thus it may be the case that the large
Age
One way MDs differ substantially from other occup
increase in the rate of volunteering by MDs after age 55 is partly a
consequence of having more time available to devote to pursuits outside of
home and work.

95
Table D.5: Volunteers by Age Group, GSS17 2003
No Yes Total
MDs Age 54 and under 72 28 100.0Age 55 and older 32 68 100.0Total 62 38 100.0
ther
Medica
Other p
Upper 08 100.03 100.0
White col
Blue co
Volunteer
%
O health professionals Age 54 and under 59 41 100.0Age 55 and older 55 45 100.0Total 59 41 100.0
l aides and orderlies Age 54 and under 72 28 100.0Age 55 and older 64 36 100.0Total 71 29 100.0
rofessionals Age 54 and under 56 44 100.0Age 55 and older 51 49 100.0Total 55 45 100.0
Managers Age 54 and under 58 42 100.Age 55 and older 52 4Total 57 4
lar Age 54 and under 64 36 100.0Age 55 and older 66 34 100.0Total 64 36 100.0
llar Age 54 and under 75 25 100.0Age 55 and older 75 25 100.0Total 75 25 100.0
D.3. D
•
lp
utside
e, domestic work, home maintenance and outdoor work;
istribution of Direct Helping by Occupational Groups
Another way to contribute to one’s community is by providing assistance
directly to those in need without any organization or group as an
intermediary. The GSS 17 survey inquired about several types of direct he
individuals could have provided over the last month to individuals o
their own household. The types of help include: domestic help, which
includes child car

96
providing transportation or running errands; teaching, coaching, or giving
practical advice; and providing unspecified emotional support.
Estimated number of help-
giversRate
Domestic work,
including childcare
Transport or errands
Teaching, coaching or
advising
Emotional support
MDs 58,086 85 43 45 60 68Other health professionals 309,925 89 51 53 50 76Medical aides and orderlies 394,154 86 51 55 48 69Other professionals 2,304,834 86 50 52 56 64Upper Managers 1,378,211 82 51 49 48 56White collar 7,151,672 84 52 50 49 65Blue collar 3,343,617 79 57 47 42 45
All Occupations 14,940,499 83 53 50 48 60
Table D.6: Direct Help Given by Respondents in the Last Month, GSS17 2003.
All Types of Direct Help Specific Types of Direct Help
%
• In general terms, the proportion of each occupation group that provided
assistance to someone who was not a member of their household are virtually
identical at about the national rate of 83% (Table D.6). The highest
participation rate occurred among other health professionals (89%), while the
lowest occurred among blue collar workers (79%). Evidently, in any given
month, the vast majority of adult Canadians provide assistance of some sort
directly to relatives, friends, neighbours and others.
emotional support
(60%), although this is not very far ahead of the other three types, each of
aintenance,
at
MDs were less likely to provide than other occupational groups.
• The most common form this direct help took was providing
which was done by about half of adult Canadians. In the case of domestic
help, which includes housework, childcare, and home and yard m
the participation rate for MDs was lowest at 43% and highest for blue collar
workers at 57%. In contrast, for teaching, coaching or giving advice, MDs
were highest at 60%, while blue collar workers were lowest at 42%.
Providing transportation or running errands was also a form of assistance th

97
E. Charitable Giving Among Medical Professionals and Other Health Workers
E.1. The Incidence and Magnitude of Charitable Giving
• Donations to charitable and nonprofit organizations are a vital part of the
funding these organizations receive each year: in 2000, 78% of the population
ages 15 and older made at least one donation to these types of organizations,
with total donations amounting to over 4.9 billion dollars (Statistics Canada,
2001:13). Three years earlier, the proportion of donors was slightly higher at
81%, while total donations were about 3.7 billion dollars.
As one would expect, people in occupations at the high end of the income
ors
n
ce unless the differences
are very large. In the case of rates of giving, for example, statistical tests
l
And
•
scale ― various professionals and upper-level managers and administrat
― are more likely to be donors and tend to donate more money (Table E.1).
Among these, medical doctors are most likely to have made a donatio
(92.1%), and on average among donors, to give the most money to charities
($541). As we will find throughout this analysis, however, the very small
size of the MD group in the sample means that differences between them and
other groups will often not show statistical significan
show that the proportion of MDs who give to charity is significantly larger
only compared to routine white collar (78%) and routine blue collar (77%)
occupations. Similarly, the average size of donations among MDs who are
donors is not statistically larger than any of the other occupations. However,
when MDs are combined with other health professionals, the average
donation of $430 for the category is significantly higher than that for medica
aides, orderlies, and white collar and blue collar occupational groups.
on the other hand, the average annual donation of health professionals is not
significantly different from other professionals or managers.

98
Donors (000's) Rate % of donorsTotal Dollars
Donated% of $
donated Mean Median
MDs 86 92 0.6 46,293,62Other Health Professionals 276 88 2.0 109,126,28
1 1.3 541 2001 3.0 395 150
Health Professional Subtotal 362 89 2.6 155,419,902 4.3 430 180 Aides and Orderlies 373 91 2.7 78,933,156 2.2 212 65
ther P 70per M 8
White CBlue col
All Occu
dollars
Table E.1: Formal Charitable Giving in Last 12 Months, NSGVP 2000
Donors Only
MedicalO rofessionals 2,079 89 15.0 932,579,265 25.6 449 1Up anagers 1,367 86 9.9 567,176,053 15.5 415 16
ollar 6,159 78 44.5 1,350,344,923 37.0 219 60lar 3,493 77 25.3 563,711,421 15.5 161 45
pations 13,833 81 100.0 3,648,164,721 100.0 264 74
•
e the evidence is
not firmly conclusive, it does suggest that average donations among medical
nd
• ns in
•
ary
giving across
Nonetheless, the average annual donation total for MDs is larger than the
average for other professionals, and for managers. So whil
doctors are on a par with, and possibly higher than the other professional a
managerial occupations.
In addition, MDs represent about 0.6% the occupations reporting donatio
the NSGVP 2000, but they account for more than double that proportion of
all dollars donated (1.3%). The other upper-level occupations also tend to
give more than their share, but not to the extent that exist among MDs. The
nearest occupational group in these terms is other non-health professionals
who make up 15% of all donors and account for about 26% of all dollars
donated. Managers are third, making up 10% of donors and accounting for
16% of dollars donated.
Obviously the amount an individual can or will donate depends on the income
they have available for these discretionary expenditures, and discretion
income will rise as income itself rises. For this reason, direct comparisons
across occupational groups of the actual amount of money donated to
charities is somewhat misleading because it compares apples with oranges
and pears. An alternative way to compare levels of charitable

99
occupational groups is to examine the proportion of household income each
person donates to charities. Table E.2 presents this information for those who
actually make donations in each occupational group. The table shows that
the proportion of household income donated to charities is quite similar for
the four highest income occupational groups. Medical doctors, other health
professionals, other professionals, and managers all contribute around six-
tenths of one percent of their household income. Occupations with lower
household incomes ― medical aides and orderlies, and routine white and
blue collar occupations ― donate about four-tenths of one percent of that
income. Even when expressed as the proportion of household income given
he
have a substantial discretionary component in their
household budgets.
0Other He
Medica 57,534 372,498 0.39 0.15Other P 80,592 2,079,221 0.66 0.23
pper Managers 76,776 1,367,177 0.63 0.21hite Collar 56,427 6,159,312 0.43 0.13
lue c
All Occ
to charities, the higher income households give proportionally more than t
lower income households. This may indicate a greater proclivity for giving
among the upper echelons of the occupational structure, but it may also
indicate that the lower-income households are still below the level where
individuals or households
Average Household Income
Number of Donors mean median
104,527 85,644 0.66 0.4alth Professionals 72,378 276,089 0.59 0.25
Health Professional Subtotal 79,705 361,734 0.61 0.25l Aides and Orderliesrofessionals
% of Household Income
Donors only
Table E.2: Percent of Household Income Donated to Charities, NSGVP 2000
MDs
UWB ollar 57,377 3,493,327 0.36 0.09
upations 62,439 13,833,270 0.47 0.13
• igher
to
Across all measures of the extent and amount of charitable giving, the h
occupational groups are more likely to make charitable donations, and tend
give more money when they do make donations, either in absolute dollar

100
amounts, or relative to their annual income. And in all these aspects of
giving, health professionals and medical doctors in particular, are at the top
end of the distribution.
atterns of Charitable Giving
In addition to information on the amount of donations, the NSGVP 2000 al
collected information about the kinds of organizations donations went to a
the methods used to solicit the donations. The kinds of organizations to
which donations were made are grouped into 12 broad types, including
culture and recreation, education and research, health, social services,
environment, development and housing, law, advocacy and politics,
philanthropic intermediaries and volunteer promotion, international,
religious, union and professional associations, and a final “not elsewhere
classified” group.
E.2. P
• so
nd
• There is wide diversity in charitable organizations to which individuals can
make donations. The factors that determine which ones they choose to
support are also varied, including personal experience, participation in the
activities of a particular organization, and the national prominence or
effectiveness of fundraising campaigns. But one factor is probably important
for many individuals; organizations that are closely involved in activities that
relate to a particular occupation’s area of specialization may well be favoured
by individuals in that occupation. This occurs because the specialized
knowledge associated with an occupation makes a member more aware of the
needs and goals of a particular organization or types, and there may also be a
sense of obligation to support organizations that work in an area that is close
to or even part of one’s own occupational activity.

101
• de
Philanthropic
MDs 100Other He 100
100Medical A 100Other Prof 100Upper M 100White Co 100Blue colla 100
All Occup 100
Who Give to Each Type of Organization, NSGVP 2000
* results sup
The six most common types of organizations to which donations were ma
are presented in Table E.3, with the 6 least common types combined as
“other” organizations.
Table E.3: Percent of Occupation Group
Health Social Services Religion and
Research
Intermediaries and Volunteer
Promotion
Culture and Recreation
All Others
Total of Donors
99 36 42 53 * * *alth Professionals 83 60 46 28 * * *
Health Professional Subtotal 87 54 45 34 24 17 31ides and Orderlies 72 48 31 30 23 24 31essionals 75 55 43 28 34 22 28
anagers 76 54 41 25 32 26 30llar 67 47 35 25 19 16 23r 61 44 37 23 17 17 19
ations 68 48 37 25 22 18 24
%
ressed due to small cell counts
Education
.2.1. The Incidence of Giving to Health Organizations
have a long and
successful history of health advocacy that has brought them to national
prominence, such as, for example, the March of Dimes organization that has
E
• For occupational groups as a whole, health-related organizations were the
most common recipient of charitable donations ― more than 68% of all
occupations made one or more donations to these organizations, followed
successively by social service, religious, and education and research
organizations (Table E.3). There is a visible link between the type of
organization to which individuals make donations and the nature of their
occupations. For example, health professionals, and physicians in particular,
tend to make donations to health-related charities. But a majority of all
occupations also make at least one donation to these charities each year. This
may reflect the fact that there are many well-established national
organizations representing specific diseases and health concerns that actively
seek support by donors. Many of these organizations

102
championed child-related health concerns since the 1930’s, and the Canadian
Cancer Society which has long been an organization with an important r
cancer education and re
ole in
search, also begun in the 1930’s with direct support
from the Canadian Medical Association. These and other health
organizations have both a high profile and a broad-based appeal that
encourages public support through annual donations. As one would expect,
individuals directly involved in the health care sector are the strongest
supporters of these initiatives. Donations to health organizations is also
strong among other professionals and managers; about three quarters of them
give to these organizations, and although white and blue collar groups are
less inclined to donate to these types, still the majority do so.
E.2.2. The Incidence of Giving to Education and Research
Medical doctors also show a strong pattern of making donations to
ble E.3). This type
includes organizations concerned with education services at all levels in the
,
ions
of
ne-
ace of
in
om pre-
es
•
organizations involved in education and research (Ta
education system, and research organizations in the medical, physical, life
and social sciences. Here the difference between MDs and other occupat
is even more marked than for health organizations. Where more than half
doctors gave to education and research organizations, only between o
quarter and one-third of any other occupational group did so. On the f
it one might assume that the tendency for MDs to donate to organizations
this group is linked to the presence of medical and other science research
organizations in this category. However, this is not the case; all of the
organizations to which MDs made donations in this group were involved in
the provision of services for various levels of the school system, fr
school to universities to adult education. In supporting organizations in this
group, MDs are focusing on organizations that support education servic
rather than research in any of the sciences.

103
E.2.3.
•
Table E.3).
es and
e
g
The occupation group least likely to support social service organizations,
f them annually
making a donation in support of these organizations. However, statistical
l terms
g
E.2.4.
• ere
The Incidence of Giving to Social Services Organizations
After health organizations, the second most widely supported type of
organization are those involved in the delivery of social services (
Included in this group are organizations concerned with family servic
family welfare, services for the handicapped and elderly, shelters, and incom
support programs. Other health professionals, other professionals, and
managers lead the way with just over half of donors in these groups givin
money to such organizations. Not far behind at just under 50% are medical
aides and orderlies and white and blue collar occupational groups.
•
however, is medical doctors with only about 36 percent o
tests show that this proportion is not significantly lower in statistica
than the rates for other medical professionals, and thus the low rate amon
MDs may simply be due to their low numbers in the survey and resulting
large sample variability. Nonetheless, the pattern of giving among MDs
indicates that they tend to focus their giving on health and education
organizations and thus are less likely to support other organization types.
The Incidence of Giving to Religious Organizations
The third most prevalent type of organization as a recipient of donations w
religious organizations. This category includes churches, synagogues,
temples, mosques and similar organizations that promote religious beliefs,
and related associations and auxiliaries of such organizations. Donations to
these organizations can be annual donations of support such as tithing or
pledging, or charitable requests made through or on behalf of these
organizations.

104
• The figures in Table E.3 show that between 40% and 46% of medical doctors,
other health professionals, other professionals and managers make donations
ss
rtion
to support
the charitable goals of that organization.
E.2.5. er
•
ited
buted
organizations across Canada in 2003. Statistics on donations to these types of
for MDs are low
enough to be unreliable estimates on their own and have been combined with
•
ompared
ionals. This, however, is about the middle of the distribution
for other occupational groups which range from a high of 32% for managers
to religious organizations. The other occupation groups are slightly le
likely to give to religious organizations, but the differences between the upper
and lower echelon occupations are not large enough to be statistically
significant. Overall, then, just over one-third of employed Canadians make
donations to religious organizations. This is about the same as the propo
of employed Canadian donors who report regular attendance (monthly or
more often) at religious services (31%), a group whose participation in a
congregation undoubtedly increases their exposure and willingness
The Incidence of Giving to Philanthropic Intermediaries and Volunte
Promotion
Ranking just behind education and research organizations for donations
among occupational groups are organizations that are philanthropic
intermediaries or that promote volunteering. Chief among these is the Un
Way of Canada, a philanthropic intermediary that collected and distri
more than $250 million in donations to more than 17,000 nonprofit
organizations are presented in Table E.3, but the counts
the data for other health professionals to produce an “all health professional”
subtotal.
Professionals outside the field of health led the way in donations to these
organizations, with about 34% making donations annually. Health
professionals, at 25%, are less likely to give to these organizations c
to other profess

105
to a low of 17% for blue collar occupations. Health professionals are slightly
more likely to give to these organizations than is the average for all
occupation groups in Canada, but they do not stand out to any great degre
from the other occupations.
The Incidence of Giving to Culture and Recreation Organizations
The sixth most common recipients of charitable donations are organization
supporting cultural and recreational organizations. According to the 2000
Survey of Nonprofit and Voluntary Organizations, these organizations m
e
E.2.6.
• s
ake
up more than 22% of all nonprofit and voluntary organizations in Canada.
us social issues, these organizations are mainly
concerned with supporting cultural, social and sports activities as recreational
of as
w, are a
al
kely to
•
ps together receive a substantial amount of support, particularly
among those working in the health sector, other professionals, and managers.
o a
ent in the
And unlike most of the other organization types which are largely concerned
with addressing vario
pursuits. They are thus not the kinds of organizations typically thought
charities, and as the relatively low levels of support in Table E.3 sho
lower priority for most individuals’ charitable giving. Among all
occupational groups, managers are most likely to support this group. Medic
doctors, along with the white and blue collar occupations, are least li
give to organizations in this group.
The levels of donating to the remaining six organization types are markedly
lower than for the specific six types already examined. As Table E.3 shows,
these grou
However, no more than 12% of any occupational group made donations t
particular type among the six, and the low levels of support are evid
overall percentage of donors that made donations to these types of
organizations: environment, 7%; development and housing, 2%; law,
advocacy and politics, 5%; international, 6%; and unions and professional

106
associations, 1%. About 3% of all occupations also made donations to
organizations that could not be classified into any of the other eleven
categories.
.3. The Magnitude of Giving to Nonprofit and Charitable Organizations
The information in the sections above shows how extensive is support for
ch
were
of total
very other occupational group’s giving to
these three types of organizations: a substantial proportion of each group
e
•
t this
rities
E
•
various types of organizations among occupational groups, but it does not
indicate how large that support is. Another way to examine how
occupational groups support nonprofit organizations is by looking at the
proportion of all dollars donated by each occupational group that goes to ea
type of organization. The figures in Table E.4 present a different picture of
charitable giving than appeared in Table E.3. Virtually all MDs who
donors made a donation to one or more health organizations, but this
accounted for only about one-fifth (20%) of all the money they donated to
charities. The situation is the same for social services, where one-third (36%)
of doctors who were donors made contributions that account for 3%
donations from MDs, and for education and research organizations, where
50% of doctors made contributions that amounted to 7% of total donations.
This pattern essentially repeats for e
gives to a particular type but the proportion of total dollars donated that thes
donations represent is very much lower. This means that while giving to
these types of organizations is widespread, the size of the donations is
actually quite modest.
In contrast, giving to religious organizations is exceptionally high ― less than
half (42%) of MDs who were donors give to these organizations, bu
accounts for approximately 58 cents of every dollar they donate to cha
(58% of total donations). This pattern is repeated for all other occupational

107
groups where between 32% and 46% of individual donors make donatio
religious organizations that account for between 38% and 50% of all m
they donate t
ns to
oney
o charities. Compared to any other type of organization, a very
substantial part of all the monies donated to charities and nonprofits goes to
religious organizations. For Canada as a whole, just over one-third (37%) of
accounts for almost a half (47%) of all the money that goes to charities each
MDsOther He
Medical 100Other Pr 100Upper MaWhite CoBlue colla
All Occu
Ta GVP 2000.
occupational groups make donations to religious organizations but this
year.
Health Social Services Religion Education
and ResearchAll Other
organizations To
Donations
20 2 58 7 13 100alth Professionals 17 12 45 4 23 100
Health Professional Subtotal 18 9 49 4 20 100Aides and Orderlies 24 8 43 3 22ofessionals 21 10 46 4 19
nagers 21 12 37 2 27 100llar 18 10 50 3 19 100r 16 11 49 4 20 100
pations 19 10 47 3 20 100
ble E.4: Percent of Total Donations by Each Occupation Group Going to Each Type of Organization, NS
% of total donations
tal
The importance of active participation in a religious congregation has been
noted in much of the research on contributory behaviours and on charitable
giving specifically (Selbee and Reed, 2004) Active participation, defined
attending religious services monthly or more often, is distinctly higher among
MDs (at 56%) than among any other occupational group (Table E.5). Oth
health professionals are not as active in their religious congregation (40
and all the other groups are even less
•
as
er
%),
active, with only between 27% and 33%
attending services monthly or more often.
•
The connection between active participation in a religious organization and
charitable giving is considerably stronger among MDs than other
occupations. More than half of all MDs are active religious participants and

108
the money these people donate to religious organizations accounts for about
57% of all the money MDs in total give to charities. Among other
occupational groups, the proportion of all donations active religious
participants give to religious organizations ranges between 32% and 42%. S
while MDs give a very large portion of all charitable donations to support
religious organizations, the other occupational groups also direct a subst
share of their giving in this way.
o
antial
% Religiously Active* Religious Dollars as % of Total Dollars Donated
MDs 56 57Other Health Professionals 40 38
Health Professional Subtotal 44 44Medical Aides and Orderlies 27 32Other Professionals 33 39Upper Managers 29 30White Collar 31 41Blue collar 28 37
All Occupations 31 38
Table E.5: Religious Attendance and Relgious Giving, NSGVP 2000
* The religiously active attend services monthly or more often
• This type of giving is in many ways different from the giving that is typicall
thought of as charitable giving. Money donated to support a religious or fait
community in large part goes to maintenance of the infrastructure of that
religious organization. Most of these organizations do provide various kinds
of services such as educational or health programs, but often the clientele is
largely restricted to members of the congregation, and are not likely to make
up more than a small part of the congregation’s annual expenditures. As a
consequence, a significant but unknown pro
y
h
portion of the money donated to
religious organizations is not directly used to support activities that would
typically be described as charity functions that benefit the community.

109
E.3.1.
•
ed
.6. Their average donation is substantially
larger than any other occupational group (although the differences between
MDs and any other groups are not statistically significant). In order to
compare the size of donations relative to the groups’ household income, the
mean donation is re-expressed as dollars donated per thousand dollars of
average household income (in column 3 of the table). Again, the tendency
for MDs to support religious organizations is evident. On average, they
contribute 11 dollars for every 1000 dollars of household income. This is
almost twice the next highest occupational group, the other professionals
($56 per $1000). And although low sample numbers for MDs means that
there is substantial imprecision in the statistics for this occupational group,
when combined with other health professionals, they are still the group that
gives the largest share of their household income to religious organizations.
at
• nal
groups, at least in relation to their household income with the exception of the
The Magnitude of Giving to Religious Organizations
The largest single organizational category in terms of total dollars received in
donations are religious organizations: they receive 47% of all dollars donat
to charities and nonprofits. The tendency for MDs to support religious
organizations is evident in Table E
The effect of this pattern of giving is evident in the last two columns of the
table. Medical doctors represent 0.7% of all donors to religion organizations
but they contribute a proportion of all monies to religious organizations th
is about twice that size (1.3%). The only other occupational group that
contributes a share of funds that is distinctly larger than their share of donors
is other professionals. Thus professionals as a group provide a
disproportionately higher share of money to religious organizations than do
all the other occupational groups.
Giving to religious organizations is about the same for all other occupatio

110
blue collar group. These people tend to give a distinctly lower proportion of
.
2.53.2
Medical Other PrUpper M 0.8White C 1.5Blue col
All Occup 100.0
their income ($3.64 per $1000) to religious organizations
Mean Donation
Mean Household
Income
Mean donation per 1000 income
Total Dollars Donated
% of Donations
% of Donors
alth Professionals 382 75881 5.03 48,698,075 2.9Health Professional Subtotal 461 73512 6.27 75,423,445 4.4
Aides and Orderlies 290 53995 5.37 34,002,486 2.0 2.3ofessionals 480 85574 5.60 431,332,060 25.2 17.5anagers 382 79463 4.80 212,457,532 12.4 1
ollar 317 60120 5.28 678,352,768 39.7 4lar 216 59525 3.64 276,772,738 16.2 24.8
ations 332 66792 4.96 1,708,341,030 100.0
Table E.6: Amount Donated to Religious Organizations, NSGVP 2000
MDs 736 65191 11.30 26,725,370 1.6 0.7Other He
E.3.2. The Magnitude of Giving
•
s and managers; on average, give
more money to health organizations each year, and give a larger share of their
than their share of the number of donors. Health professionals, as a group, do
to Health Organizations
Among the four main recipients of donations, health organizations receive the
second largest share (Table E.4: 19.1%) of all money donated to charities and
nonprofits by all occupational groups. Since organizations in this category
are engaged in providing services directly related to the concerns of the
medical professions, one would expect both MDs and other health
professionals to extensively support these types of organizations. This is true
in terms of the proportion of MDs (97%) and other health professionals
(83%) who make at least one donation to health organizations, but the extent
or size of their support lags behind other occupational groups. Two
occupational groups, other professional
annual household income (Table E.7). As a result, these two occupational
groups account for a larger share of money donated to health organizations

111
not significantly differ from aides and orderlies or managers, but do on
average give more than white and blue collar occupations.
Mean Donation
Mean Household
Income
Mean donation per 1000 income
Total Dollars Donated
% of Donations
% of Donors
MDs 108 106711 1.01 9,152,849 1.3 0.9Other Health Professionals 83 76480 1.09 19,003,999 2.7 2.4
Health Professional Subtotal 90 84647 1.06 28,156,848 4.0 3.3Medical Aides and Orderlies 71 61861 1.15 19,076,021 2.7 2.8Other Professionals 129 88825 1.45 199,991,369 28.6 16.4Upper Managers 113 86366 1.31 117,450,840 16.8 11.0White Collar 58 59641 0.98 242,331,721 34.7 43.9Blue collar 42 60850 0.70 91,068,881 13.0 22.6
All Occupations 74 68521 1.08 698,075,680 100.0 100.0
Table E.7: Amount Donated to Health Organizations, NSGVP 2000
E.3.3. The Magnitude of Giving to Social Service Organizations
ollar
account
• Overall, social service organizations rank third in the proportion of donations
(10.2%) received from all occupational groups. Other professionals and
managers led the way in contributions to these organizations with mean
annual contributions of $82 and $94 per year (Table E.8). The average
amount donated by MDs was on a par with routine white and blue c
occupations, with all three groups having statistically significant lower
average donations relative to other professionals and managers. In fact,
managers stand out in providing support for these organizations ― they give
the highest amount, $1.11 per 1000 dollars of household income, and
for a disproportionately large proportion of the money donated to these
organizations, as 11% of donors they accounted for 19% of all money
donated.

112
Table E.8: Amount Donated to Social Service Organizations, NSGVP 2000
Mean Donation
Mean Household
Income
Mean donation per 1000 income
Total Dollars Donated
% of Donations
% of Donors
MDs 38 60487 0.63 1,156,205 0.3 0.5Other Health Professionals 76 76942 0.99 12,630,733 3.4 2.5
Health Professional Subtotal 70 74383 0.95 13,786,939 3.7 2.9Medical Aides and Orderlies 35 59890 0.59 6,354,339 1.7 2.7Other Professionals 82 85969 0.96 94,071,020 25.2 17.1Upper Managers 94 84968 1.11 69,200,965 18.5 11.0White Collar 45 58168 0.77 129,095,044 34.6 43.4Blue collar 40 60405 0.66 61,055,747 16.3 22.9
All Occupations 56 66908 0.83 373,564,054 100 100
E.3.4. The Magnitude of Giving to Education and Research Organizations
The fourth largest recipients of donations were education and research
organizations. In giving to these types of organizations, medical doctors led
as the highest
(although significantly higher only than aides and orderlies, and white and
also
heir
f
ing
•
the occupational groups (Table E.9). Their average donation w
blue collar) as was the amount they gave per 1000 dollars of household
income ($1.03). As a result, the share of total donations they account for
(2.5%) is about double their share of donors (1.3%). Other professionals
show a high average donation (and a disproportionately higher share of
donation), although this is partly because their incomes are quite high ― t
donations per 1000 dollars of household income is quite similar to that o
other health professionals. Managers have one of the lowest levels of giv
per 1000 dollars of income ― on a par with the routine white and blue collar
occupations.

113
Mean Donation
Mean Household
Income
Mean donation per 1000 income
Total Dollars Donated % of Dollars
% of Donors
MDs 67 65346 1.03 3,065,455 2.5 1.3Other Health Professionals 50 72443 0.69 3,896,864 3.2 2.2
Health Professional Subtotal 56 69821 0.81 6,962,319 5.7 5.7Medical Aides and Orderlies 22 61227 0.37 2,473,255 2.0 3.1Other Professionals 57 92567 0.62 33,482,742 27.5 16.7Upper Managers 41 91147 0.45 14,107,930 11.6 9.9White Collar 29 60448 0.48 44,230,523 36.3 43.8Blue collar 26 61641 0.42 20,585,775 16.9 22.9
All Occupations 35 69476 0.50 121,842,543 100 100
Table E.9: Amount Donated to Education and Research Organizations, NSGVP 2000
E.3.5. The Magnitude of Giving to All Other Organizations
Finally, Table E.10 shows the pattern of giving to all other organizational
e
nual
e.
Other HH
Medical 84 66174 1.27 17,027,055 2.3 3.0Other Pr 139 86466 1.61 173,702,074 23.3 18.4
agers 172 88534 1.95 153,958,787 20.6 13.2hite Collar 92 60802 1.52 256,334,868 34.3 41.0
Blue collar 78 63482 1.23 114,228,279 15.3 21.7
All Occupations 110 70777 1.55 746,341,415 100.0 100.0
•
types combined. Here MDs lag behind every other group in terms of th
proportion of household income they donate (dollars per $1000 of income),
even though their average annual donation is in the middle range for the other
occupational groups. The group that stands out in giving to these
organizations is other health professionals, who have both the highest an
donation, and give the largest share ($2.33/1000) of their household incom
Mean Donation
Mean Household
Income
Mean donation per 1000 income
Total Dollars Donated
% of Donations
%
124 132690 0.93 6,193,742 0.8 0.7ealth Professionals 178 76469 2.33 24,896,610 3.3 2.1ealth Professional Subtotal 164 91281 1.79 31,090,352 4.2 2.8Aides and Orderliesofessionals
Table E.10: Amount Donated to All Other Organizations, NSGVP 2000
of Donors
MDs
Upper ManW

114
• In the full picture of donations to various types of organizations, a number of
patterns are evident. Among all occupations, religious organizations are by
far the main recipients of donations to charities and nonprofits. For this type
of giving, MDs appear to lead the other occupational categories,
notwithstanding the small sample numbers.
• Among non-religious organizations, those concerned with health issues are
most widely supported and receive the largest share of donations. This is not
surprising given the prominence of many disease-specific organizations with
both long histories and coordinated national representation. Contrary to
expectations, medical professionals, and medical doctors in particular, do not
pes of
organizations. Other professionals and managers tend to give a larger
s
levels of support. In large part, this may well be a consequence of lower
levels of household income.
E.4. Methods of Making Donations
• There are numerous ways that charity and nonprofit organizations solicit
donations from the general public. There are also many ways that individuals
can make donations on their own initiative. In the 2000 NSGVP, questions
were asked about fourteen distinct ways to donate money. Several of these
are rarely-used methods and because of small sample sizes, have been
collapsed into a generic “other method” category. This includes donations
stand out in the amount of support they provide to these ty
proportion of their household income to these organizations than do those
who actually work in the health industry. For social service organizations,
MDs support these organizations to a lesser extent than do other professional
and managers. In contrast, MDs do support education and research
organizations, although their support is only slightly, if at all, higher than
other professionals and managers. Across all four types of organizations, the
white and blue collar occupation groups tend to show comparatively lower

115
made on the internet, in response to radio or television solicitations such as
telethons, donations of stocks and bonds, and any other methods not specifie
in the list. In addition, for most of the methods of making donations, the cell
counts for medical doctors were too small to produce reliable esti
result, most of the analysis focuses on health
d
mates. As a
professionals as a group,
although some usable estimates are available for MDs.
•
most
Ds, is
s in this
•
. On one side, the individual who is sponsored
in a particular charity event is often a family member, often one’s children, or
cquaintance, but rarely a stranger. So there is
a connection between the donor and the person asking for the donation, a
l
ss,
n
It is also important to remember that each individual may make donations
through any or all methods. As is evident in column A of Table E.11, which
reports the percentage of each occupational group that contribute through
various methods, all groups donate via a wide range of methods (the
percentages in each column add to much in excess of 100%). The
common method for every occupational group, with the exception of M
by sponsoring a participant in a charity event, such as a walkathon. About
half of health professionals, other professionals and managers made a
contribution to charity by sponsoring someone in a charity event. Blue collar
and white collar occupational groups are less likely to make donation
manner (35% and 39% respectively), but it still ranks as the most common
method of giving.
The widespread use of sponsoring individuals is understandable given the
nature of this form of donation
perhaps a neighbour, friend or a
factor that brings into play various familial and social obligations and
expectations that makes it difficult to refuse to sponsor a child in their efforts
to raise money for a charity. On the other side, as evident in column A for al
occupations in Table E.12, those who do sponsor someone in one of these
events, on average, donates only 27 dollars to charity through this proce
which is the tenth highest of the 12 methods. Although sponsoring people i

116
charity events is a pervasive means of donating, each donor does not actually
give much money through this method. Still, as column B in Table E.11
shows, these small donations, made by a fairly large proportion of the donor
population, are enough to account for 5% of all the money donated to
charities by all occupational groups, putting this method in fifth place o
Sponsoring someone in a charity event commonly invol
verall.
ves giving money to
someone who is related to, or at least acquainted with the donor, and typically
A B
Mail reques 14Pay to atten 9Payroll de 6Sponsorin 5In Memori 25 8Asked by s 26 4Door to do 38 2Canvased a 1Respond to 1At church/ 40On own ini 5Other meth 6
Total dona 100
ccupational GroupA B A B A B A B
il requPay to attePayroll deSponsoringIn MemoriAsked by sDoor to doCanvased aRespond toAt church/On own iniOther meth
Total dona
er professionals
* results supr
Table E. ional Group
Upper Managers White collar Routine Blue collar All Occupations
involves only a modest amount of money.
al GroupA B A B A B A B
ts 65 18 33 11 41 13 30 7 37d charity events 62 10 27 9 35 9 24 11 27
duction * * 16 4 15 3 18 13 23g someone in event * * 58 5 50 4 50 5 51am donations 59 10 27 6 35 7 19 6omeone at work * * 24 3 22 2 21 3or canvasers 57 3 47 2 49 2 37 4t a shopping centre * * 24 1 19 1 33 2 23 a telephone request * * 15 3 12 2 16 2 11
mosque/temple * * 39 40 34 44 25 43 35tiative * * 16 8 13 6 * * 8ods * * 18 8 14 6 9 5 12
tions 100 100 100 100
Medical aides and orderlies Oth
11: Percent of Each Occupational Group that Donated Through Each Method (Column A) and Percent of Total Donations by each Occupatthat was made by each Method (Column B), NSGVP 2000
MDsOther health professionals
Health Professionals SubtotalOccupation
O
Ma ests 37 14 19 11 15 10 23 12nd charity events 30 11 20 9 14 9 21 9duction 29 13 13 7 13 8 16 8 someone in event 51 6 39 6 35 5 41 5
am donations 23 3 16 5 14 5 18 6omeone at work 21 3 17 2 13 2 18 3or canvasers 35 3 28 3 29 5 31 3t a shopping centre 23 1 23 1 20 1 23 1 a telephone request 10 2 7 1 6 2 8 2
mosque/temple 36 34 26 46 27 46 28 42tiative 6 3 5 5 4 4 5 4ods 14 6 11 5 8 4 11 5
tions 100 100 100 100essed due to small cell counts

117
Occupational GroupA B A B A B A B A B
sts 139 76 116 72 124 73 43 31d charity events 77 52 109 92 96 74 91 82 134 110uction * * 103 91 103 91 155 146 128 124 someone in event * * 29 23 29 23 19 15 36 28am donations 87 66 72 60 78 63 63 53 128omeone at work * * 46 38 43 36 25 25 60r canvasers 23 19 17 11 18 13 19 14 24 15
at a shopping centre * * 18 15 18 15 9 7 12 10 a telephone request * * 67 57 72 61 30 26 52 39
mosque/temple * * 356 323itiative * * 185 160
(dollars)
Table E.12: Average Annual Donation Per Person (Column A) and Average Donation Per Donation Event (Column B), NSGVP 2000
MDsOther health professionals
Health Professionals Subtotal
Medical aides and orderlies Other profess
Mail reque 145 78Pay to attenPayroll dedSponsoringIn Memori 97Asked by s 52Door to dooCanvased Respond toAt church/ 500 459 325 313 447 409On own in 176 154 * * 237 194
ther methods * * 150 141 154 143 105 88 201 181
otal donations 115 79 87 55 97
Occupational GroupA B A B A B A B
Mail requests 138 89 96 61 81 53 110 68Pay to attend charity events 124 103 77 70 74 66 94 82Payroll deduction 245 228 116 110 104 97 136 128Sponsoring someone in event 40 30 25 20 20 17 27 22In Memoriam donations 52 43 51 43 43 34 66 53Asked by someone at work 52 44 25 22 23 20 35 31Door to door canvasers 28 18 19 13 19 14 21 14Canvased at a shopping centre 17 15 9 8 9 7 11 9Respond to a telephone request 86 71 31 26 37 30 44 36At church/mosque/temple 346 329 304 276 215 199 317 291On own initiative 178 168 178 163 102 92 170 152Other methods 162 139 74 68 60 56 105 95
Total donations 92 63 53 72* results supressed due to small cell counts
(dollars)
Upper Managers White collar Blue collar All Occupations
ionals
O
T
• The second most common way of donating money, for all occupational
groups, is by giving money to door-to-door canvassers. In contrast to
sponsoring someone in a charity event, giving money to door-to-door
canvassers is effectively giving money to strangers representing organizations
that may be more or less well-known to the donor. And while most charities
that collect funds in this way make every effort to provide information that
establishes the legitimate credentials of the canvassers, there can still be some
question of how well the potential donor knows the goals of the canvassing
organization. In addition, donors may be less inclined to make substantial
donations to particular organizations or causes that simply arrive on their
doorstep. This is evident in column B of Table E.11, in that most
occupational groups, including health professionals and MDs in particular,
tend to give only a small percentage of their total annual donations to door-

118
to-door canvassing. This is supported by the data in both columns A and B of
Table E.12. In 2000, all occupations averaged only about 20 dollars in total
in donations through this method, and averaged only 14 dollars each time
canvassers came to their door. This method of raising funds for nonprofits
and charities is a common way for people to give money, but it does not
represent a major source of donations for these organizations, nor is it a major
method for substantial contributions among occupational groups.
• Among all occupations, the third most prevalent method for making donations
to charities and nonprofits is through the individual’s church, mosque,
synagogue or temple. In examining the types of organizations to which
individuals make donations, we observed that across all occupations a very
substantial proportion of people (37%, in Table E.3) give to religious
organizations, and this giving accounts for a very large proportion of the
dollars (47%, Table E.4) they donate to charities and nonprofits. Those
figures will not necessarily match the ones in Tables E.11 and E.12
concerning giving through a religious organization. To some degree, giving
to a religious organization and giving through a religious organization will
pport
gogue
such
e
have been the same thing for many people ― the money they give in su
of their religious congregation is donated at their church, mosque, syna
or temple. However, it is possible to donate that money in other ways,
as responding to mail or telephone requests, and it is possible to make
donations through a religious organization to other charitable organizations,
such as contributing to a collection for the poor or famine relief at one’s plac
of worship. Thus, contributing through a church, mosque, synagogue or
temple may include both donations to that particular religious organization
and donations collected by the religious organization on behalf of other
charities or groups.

119
•
ues
religious
organizations, accounting for more than 40% of the value of all donations.
r
tions
ations.
s
s
• s
ney
9
er proportion of donors in these two occupational groups
respond to mailed requests while the proportion of money donated in this
manner is still significant suggests that compared to higher-income
Among all occupations, a large portion (20%) make one or more donations
through a religious organization, and the amount donated by this means is
very substantial, amounting to 42% of all dollars donated (Table E.11). In
fact, for all occupational groups, the lion’s share of the dollars they donate
reach charities and nonprofit groups through churches, mosques, synagog
and temples. Topping the list of occupations are health professionals and
other professionals where about 35% make contributions through
Managers are about as likely to donate in this fashion but this accounts for a
smaller proportion of all the donations they make. White and blue colla
occupations, and medical aides and orderlies are less likely to make dona
in this way, although the share of their dollars donated through religious
organizations is the same or even higher than the higher-income occup
While fewer people in these occupations donate in this fashion, the dollar
they donate this way represent a larger share of all the money these group
give to charities.
A less common but still important method of making donations in terms of it
share of total donations is mailed requests, particularly among health
professionals, including MDs, other professionals, and managers. Among
these occupations, more than one-third make donations in response to mailed
requests, and this accounts for between 11 and 14 percent of all the mo
they donate. This method of making donations is particularly common
among MDs where 65% give 18% of all donations in this way. It is
substantially less prevalent among white and blue collar occupations, at 1
and 15 percent of each group respectively, although the proportion of money
donated by each group is only slightly lower than the other occupational
groups. Since a low

120
occupational groups, these two groups tend to give more in response to mai
requests.
The four methods discussed above are the most prevalent and together
account for a large proportion of total giving for all occupation groups. The
remaining methods occur less across occupations and vary in the proportio
of total giving they represent. They also indicate some interesting
characteristics of Canadians’ giving behaviour in general.
One method of making a donation almost everyone is familiar with is givi
to canvassers with charity pots in shopping centres or on street corners,
particularly during the Christmas season. Evidently many Canadians do m
a contribution to charity by giving in this way because almost one-quarter of
occupational groups do so (Table E.11). But the unplanned and happenstan
character of these methods is also evident in the small size of the donations
that this generates
l
•
n
• ng
ake
ce
, and the low proportion of total giving (about 1% overall)
it accounts for. Donations made in this way do not total more than 18 dollars
hen
•
ounts
s
• a
g
managerial occupations (23%) and is a fairly important part (13%) of their
annually for any occupational group (Table E.12 column A). People are
willing to donate in this manner but they tend to give very modestly w
they do make a donation.
Paying to attend a charity event is popular among health professionals, other
professionals and managers ― between 27% and 35% do this, and it acc
for between 9 and 11 percent of their total giving. This method is les
common among white and blue collar occupations groups (20% and 14%
respectively) but it does constitute a similar proportion of their total giving
(9% for both groups).
Some forms of giving stand out for particular occupational groups. Making
donation through payroll deduction schemes is fairly common amon

121
total giving. Being able to donate in this manner requires that the
individuals’ company have a payroll deduction program in place, and 41% of
managers work in organizations where payroll deductions are possible. Thus
ectively)
tal giving (4%
and 6% respectively). Some of the tendency for managers to make use of
e
s
n
eductions represent the largest annual average
donation per person for white and blue collar workers (Table E.11, column
•
lf-employed were presumed not to be eligible for
payroll deduction programs. As a result, MDs, who are 73% self-employed,
n
a large proportion (85%) of managers who can donate through payroll
deductions actually do so. In comparison, larger proportions of other health
professionals (52%) and other professionals (48%) can access payroll
deduction plans, but fewer are inclined to do so (16% and 23% resp
and this form of giving accounts for a smaller part of their to
payroll deductions for making donations may involve their perceived role, by
themselves and others, in setting an example by participating in such
programs in their own organizations. Certainly, managers tend to give
substantially more ($245 per year, Table E.12) in this manner than any other
group. There may be less pressure on professionals in these organizations,
whose jobs are not directly concerned with running the organization, to mak
use of formal payroll plans. Participation in these plans is also less prevalent
among white and blue collar occupations (about 13% for both) but it is not an
insignificant part of their total giving (7-8%). In fact, along with donation
through religious organizations or on their own initiative, the amounts give
annually through payroll d
A). Thus both those who direct organizations and those who work for
organizations use payroll deductions as an important means of making
charitable donations.
As an aside, this method for making donations was asked of employed
persons only and the se
41% of them with employees (i.e., payroll), could not select this method as a
way of making donations. Even among MDs who were employees of a
organization, very few had a payroll deduction plan available to them. In

122
fact, for all occupations only 31% of individuals worked in busines
did allow payroll deductions for charities.
One method of making donations where medical professionals and othe
professionals stood out, both in prevalence and proportion of total giving,
were “in memoriam” donations. Among MDs, 59% used this method,
accounting for 10% of total giving. Among other health professionals and
other professionals, 25% and 28% used this method, accounting for 6% and
8% of total giving respectively. For most people, in memoriam donations
will be limited to donations on behalf of deceased family members. But the
stronger sense of collegiality within the professions may be reflected i
greater willingness and opportunity to make donations to a charity in me
of friends or colleagues who have died. As with other methods of making
contributions, the occupational groups encompass distinct characteristics tha
can encourage particular types of giving methods.
One means of making donations that does not stand out in any particular way
for most occupational groups in its prevalence or as a proportion of total
giving, but does so in terms of the size of donation these donors tend to make
is giving on one’s own incentive. Those who give to charities in this man
do not form a sizeable portion of givers in any occupational group (5% of al
occupations), except among other health professionals (16%), nor does
form of giving account for much of total giving (4% for all occupations
again except among o
ses that
• r
n a
mory
t
•
,
ner
l
this
),
ther health professionals (8% of total giving).
Nonetheless, for all occupations, including other health professionals, the
gh
a
average annual donation made on one’s own initiative is remarkably hi
(Table E.12, column A), often only surpassed by annual giving through a
religious organization. While not many individuals in any occupational
group choose to approach a charity organization on their own, most waiting
to be approached and asked to donate in some way, those who do seek out
charity show a heightened generosity in their giving, averaging 170 dollars

123
for this per year, which is substantially more than any other method except
through a religious organization. Those who donate with clear intention and
goals in mind are willing to give more than is usually the case when they are
who
e who
E.5. P
•
ned giving occurs when
individuals decide, in advance of making donations, which organizations they
ich
l
tions, a
•
approached and asked to donate. This is supported by the fact that those
decide how much they will donate each year in advance of being asked to
donate, give an average of 490 dollars to charities each year, while thos
wait until they are asked to donate give less than half that much, an average
of 210 dollars. Planned, intentional giving is strongly associated with higher
levels of giving across all occupational groups.
lanned Charitable Giving
The extent to which charitable giving is a planned behaviour can vary
considerably across individuals, and there are a number of ways it can reflect
a planned and considered action. One form of plan
will donate to rather than simply responding to organizations that asked for
donations. Overall, about one-quarter of all donors decide in advance wh
organizations will receive their support. Figure E.13 demonstrates that
advanced planning is more common among the higher income occupation
groups, including other professionals, managers, and MDs. However, for the
majority of donors in any occupation group, donations are usually made in
response to being asked by particular organizations. So while a substantia
proportion of donors do decide in advance on who will get their dona
larger proportion still wait until they are approached before giving to a
charity.
Another way individuals may plan their charitable giving is by regularly
making donations to particular organizations. Overall, about 39% of donors
give regularly to particular organizations, but as is evident in Figure E.14,
this form of giving is more common among the wealthier occupational

124
groups, such as medical doctors, managers, other health professionals and
other professionals. In contrast, more than half of medical aides and
orderlies, and white and blue collar workers, tend to vary the organizations
they support.
Figure E.13: Decide on Organizations in Advance
39
31
2425
perc
ent
22
28
21 21
23
10
15
20
30
35
40
• y
y
n and
nt donated occur in response to annual or seasonal appeals. These
people intend to donate, and may have some idea of the type of organization
ow
ng to
MDs Other HealthProfessionals
Medical Aides andOrderlies
Other Professionals Managers White Collar Blue collar All Occupations
The extent of advanced planning for charitable donations varies considerabl
across occupations. For many individuals, making charitable donations is a
process that they undertake regularly and consistently over time, with a fairl
clear idea of both the recipient organization or cause and how much money
they will give. For others, giving is also a planned event, but has a more
specific or directed character in that the timing, the recipient organizatio
the amou
or cause they will support when asked, and may also have some idea of h
much they would like to give, but they wait until an appropriate organization
actually approaches them in some way before they donate. For still a third
group, giving is very much a reactive behaviour. These people are willi

125
donate, but who they give to and how much they give is determined once
they are actually approached by an organization requesting support.
Figure E.14: Donate Regularly to Certain Organizations
58
53
44
4749
3534
39
20
25
30
35
40
45
50
55
60
65
MDs Other HealthProfessionals
Medical Aides andOrderlies
Other Professionals Managers White Collar Blue collar All Occupations
perc
ent
E.6. Reasons for Charitable Giving
t
l
of
• s
• The reasons that lie behind an individual’s charitable giving can be quite
varied, and it is often the case that a number of different reasons are in play a
the same time. At one extreme are reasons that arise largely out of
considerations of self-interest, such as the tax benefits of giving, or the socia
esteem associated with conspicuous giving. At the other extreme are acts
giving that are motivated largely by feelings of altruism, by a concern for the
welfare of others in society who have needs that they cannot fulfill on their
own. Between these two extremes are a whole range and mix of motives that
prompt individuals to donate to charities.
One motive that many Canadians express as an important reason for giving i
the feeling that they owe something to their community. As is evident in

126
Figure E.15, a majority of every occupational group believes they have a
responsibility to support organizations aiming to improve conditions in their
communities. But it is also evident that this sense of social responsibility is
highest among MDs at 80%. Other professionals and managers also believe
that it is an important reason for charitable giving, but even in the lowest
group, blue collar occupations at 53%, this is still a widespread reason for
giving to charities.
Figure E.15: Give Because You Owe Your Community
80
60 59
66
62
5653
58
0
10
20
30
40
50
60
70
80
90
ations
perc
ent
•
e
d with someone who had cancer,
for example, is likely to be motivation to donate to organizations that aid both
MDs Other HealthProfessionals
Medical Aides andOrderlies
Other Professionals Managers White Collar Blue collar All Occup
Another important motivation for giving is that the individual personally
knows someone who has been affected by something that is the object of
concern for an organization or group. The most common form of this
situation is probably making donations to heath-related organizations becaus
a friend or family member has been affected by a disease the organization
deals with. Thus, being personally involve
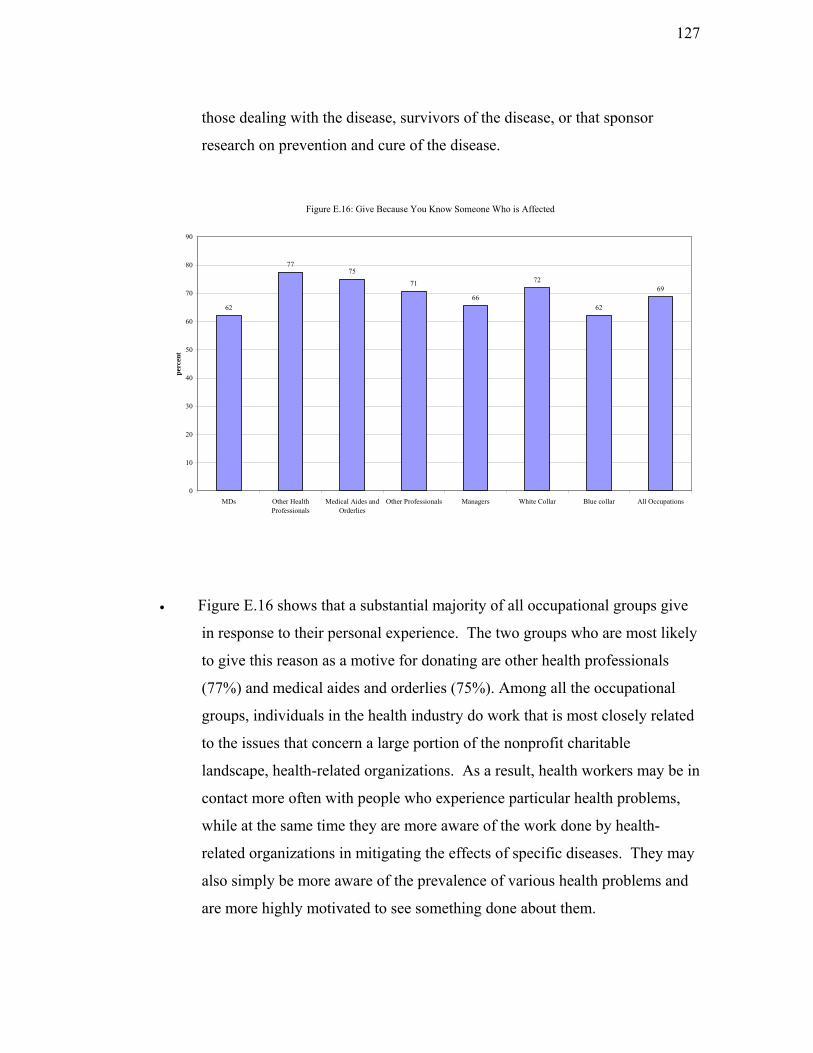
127
those dealing with the disease, survivors of the disease, or that sponsor
research on prevention and cure of the disease.
Figure E.16: Give Because You Know Someone Who is Affected
77
62
75
71
66
72
62
69
0
10
20
30
40
50
60
70
80
90
MDs Other HealthProfessionals
Medical Aides andOrderlies
Other Professionals Managers White Collar Blue collar All Occupations
perc
ent
• Figure E.16 shows that a substantial majority of all occupational groups give
in response to their personal experience. The two groups who are most likely
to give this reason as a motive for donating are other health professionals
(77%) and medical aides and orderlies (75%). Among all the occupational
groups, individuals in the health industry do work that is most closely related
e in
ms,
y
to the issues that concern a large portion of the nonprofit charitable
landscape, health-related organizations. As a result, health workers may b
contact more often with people who experience particular health proble
while at the same time they are more aware of the work done by health-
related organizations in mitigating the effects of specific diseases. They ma
also simply be more aware of the prevalence of various health problems and
are more highly motivated to see something done about them.
128
• ent
t their charitable giving is
motivated by this type of personal experience; only 62% offer this as a
reason. However, this probably does not mean that MDs are less sensitive to
the misfortunes of others; rather it means that MDs’ motives for giving are
more generalized and prompted less by personal experience than by a general
concern for others in society. The high proportion of MDs who donate
because of a generalized sense of obligation to their community supports this
interpretation (Figure E.15).
• Among professionals outside the health sector, and upper managers, giving
because of personal experience and giving because of a sense of obligation to
society carry about equal weight. Among white and blue collar workers,
giving is more often motivated by personal experience than by a generalized
sense of responsibility to the community.
• It is evident that having personal experience with individuals in need is a
widespread and important motive for charitable giving, but it is only among
s
on to
The experience of MDs at first glance seems to run counter to this argum
— doctors are among the least likely to state tha
MDs that this motive takes second place to a generalized sense of obligation
to support others in the community. From where this strong sense of having
an obligation to help others in society arises is not clear in our data, but the
figures in the next chart (Figure E.17) may provide some indication. MDs
were substantially more likely (41%) to give to charities because of their
religious beliefs than any other group. This accords with the fact that MD
were the most likely of all occupation groups to be religiously active. Thus it
would appear that a strong sense of obligation to others is connected with
active participation in a religious congregation. The sense of an obligati
help others rooted in a religious creed is not absent in the other occupational
groups, but it is distinctly lower (an average of 28%) and does not vary much
across these groups.
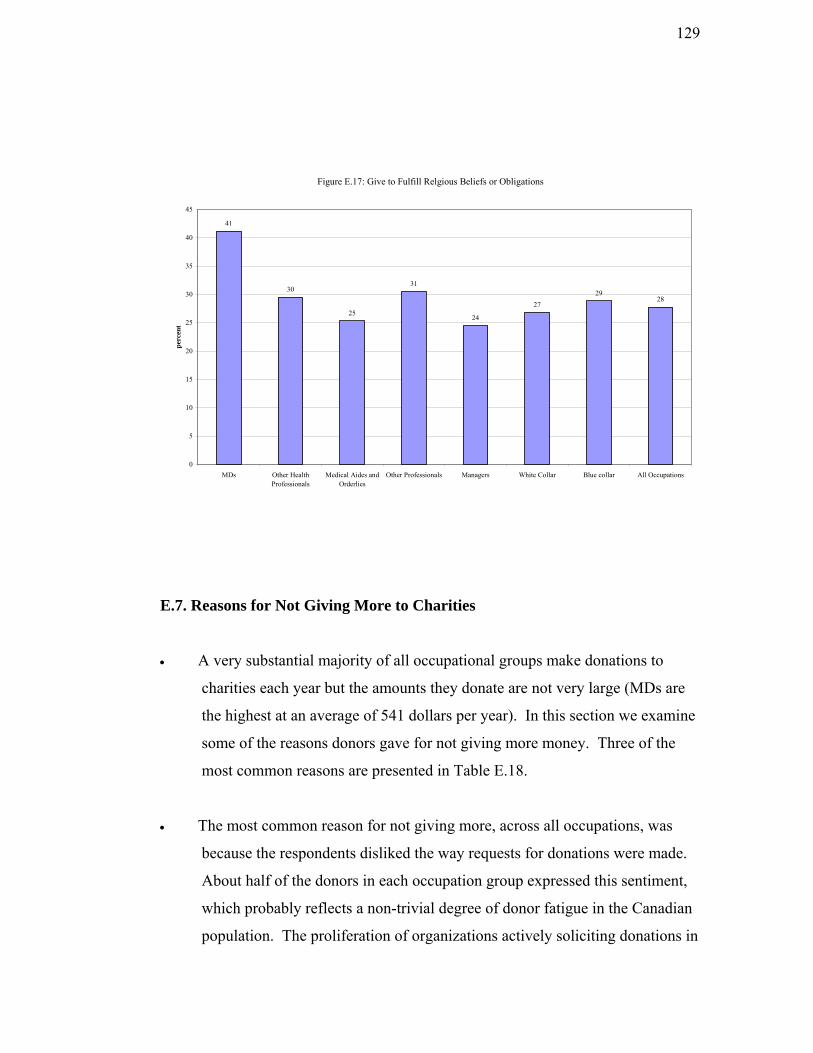
129
Figure E.17: Give to Fulfill Relgious Beliefs or Obligations
41
30
25
31
24
2729
28
0
5
10
15
20
25
30
35
40
45
perc
ent
E.7. R
•
ine
•
ts a non-trivial degree of donor fatigue in the Canadian
population. The proliferation of organizations actively soliciting donations in
MDs Other HealthProfessionals
Medical Aides andOrderlies
Other Professionals Managers White Collar Blue collar All Occupations
easons for Not Giving More to Charities
A very substantial majority of all occupational groups make donations to
charities each year but the amounts they donate are not very large (MDs are
the highest at an average of 541 dollars per year). In this section we exam
some of the reasons donors gave for not giving more money. Three of the
most common reasons are presented in Table E.18.
The most common reason for not giving more, across all occupations, was
because the respondents disliked the way requests for donations were made.
About half of the donors in each occupation group expressed this sentiment,
which probably reflec

130
every imaginable way may be having a negative impact on Canadians’
willingness to make donations.
Dislike the Way Requests for Donations
Made
Give Enough Directly to People Volunteer Instead
MDs 46 81 45Other Health Professionals 55 29 34Medical Aides and Orderlies 50 44 32Other Professionals 51 30 29Upper Managers 51 41 23White Collar 46 33 27Blue collar 49 39 23
All Occupations 48 35 27
Table E.18: Reasons Donors Do Not Give More to Charities, NSGVP 2000
% who agree with the reason
• The second reason given for not donating more is that the respondents feel
they have, in addition to their formal charitable donations, already given
enough money on their own directly to others. This brings up the question of
ted. Clearly some individuals
limit their formal charitable giving because they also gave money, as gifts
hird
ve with them. Among
the other occupations, between 28% and 36% gave money to family members
Ds
how formal and informal giving are interrela
and not loans, to others. For most of the occupational groups, about one-t
say they limit their formal giving for this reason, but MDs stand out because
8 out of 10 limit their formal giving because of their informal giving. The
reason for this is that MDs are much more likely to give money to their
relatives, including children or parents who do not li
in this way, but 72% of MDs had done so. A much higher proportion of M
than any other occupational group provide direct monetary support to their
relatives, and this is their most common reason for limiting their formal
charitable giving.

131
• nate
an donating money. For most occupational
groups, between one-quarter and one-third gave this as a reason for not
giving more money to charities and other nonprofits. The exception is
medical doctors who were the most likely occupational category to give this
as a reason. As noted earlier in reference to volunteering among medical
doctors, this may reflect in part the practice of providing pro bono care in
their medical practice. Since this represents a donation of both time (for the
care provided) and money (fees foregone), MDs may see this service as a
form of contributory behaviour undertaken in lieu of formal charitable giving.
• While there are many reasons people have for limiting their charitable
donations, one factor that may affect an individual’s willingness to donate is
their perception of how organizations use the donations they receive.
ns
t is
A third reason donors give for limiting their formal giving is that they do
their time as volunteers rather th
Particularly important in this regard is the perception that many organizatio
spend too much on administrative and fundraising activities and that not
enough goes directly to help those the organization purports to serve. The
statistics in Table E.19 suggest that this negative perception of charitable
organizations is fairly widespread in Canada. Across all occupations,
between 4 and 5 of every 10 employed Canadians think charitable
organizations spend more than they should on simply maintaining the
organization. This perception is more common among other health
professionals and upper-level managers (52% and 48% respectively), bu
also prevalent among MDs and other professionals (43% and 40%). Since
these occupational groups account for nearly half (46%) of all money donated
to charities, the negative perception about how donations are used may have a
significantly negative effect on individuals’ willingness to donate.

132
About right or could be higher Too much
57 43rofessionals 48 52
al Aides and Orderlies 57 43rofessionals 60 40
Managers 52 48Collar 62 38ollar 62 38
pations 61 39
ble E.19: Perception of Charities' Expenditures on Administrative and Fundraising Costs, NSGVP 2000
% agreeing
MDsOther Health PMedicOther PUpper White Blue c
All Occu
Ta
•
occupations, a majority of MDs (73%) are self-employed or own their own
businesses, and additional tax credits would benefit these individuals.
Where the perception of charitable organizations may limit donations, the tax
credits individuals receive are thought to encourage giving, particularly for
those willing to make substantial donations. Although the great majority
(87%) of donors do not give because of the tax credit they might receive,
Figure E.20 shows that the majority of the four groups at the top of the
occupational hierarchy will claim the tax credit for their donations. Since
these are both the high income and high donation occupations, it follows that
they would take advantage of the tax credit. For the occupations where
income and giving are lower, the proportion who use the tax credit is
distinctly lower. Would a more generous tax credit increase the amount
individuals are willing to donate? The evidence in Figure E.21 suggests that
about half of employed Canadians would give more, but a better tax credit
would have the greatest effect for medical doctors (almost three-quarters say
they would give more). This is likely due to the fact that as the highest
average donors in dollar amounts, a larger tax credit would have the greatest
effect on their tax bill. But it may also be due to the fact that unlike the other

133
Figure E.20: Will Claim A Tax Credit
79
72
49
67
60
41
31
45
0
10
20
30
40
50
60
70
80
90
100
MDs Other HealthProfessionals Orderlies
Medical Aides and Other Professionals Upper Managers White Collar Blue collar All Occupations
perc
ent a
gree
Figure E.21: Would Give More If Better Tax Credit
72
5255
5047
50 51
MDs Other HealthProfessionals
Medical Aides andOrderlies
Other Professionals Upper Managers White Collar Blue collar All Occu
50
0
10
20
30
40
50
60
70
80
90
100
pations
perc
ent a
gree
F. Civic Participation Among Medical Professionals and Other Health

134
Workers
F.1. The Incidence of Participation in Organizations
• In addition to volunteering or charitable giving, individuals contribute to the
well-being of their community and to society in general, through participation
in groups, organizations, networks or associations of various sorts. These can
be formally organized groups or associations, or informal groups where
people get together regularly to pursue an activity of some sort.
• The number and percentage of each occupational group that took part in
organizations or groups during the previous 12 months are presented in the
first two columns of Table F.1. The second pair of columns show the
participation numbers and rates where participation in occupation-related
associations, including unions, is excluded. In many instances, participation
in these types of organizations is either actually mandatory (as in closed shop
unions) or virtually mandatory, as in professional associations, where
membership is an essential condition for pursuing one’s career.
N % N %
MDs 65,708 96 56,973 83Other Health Professionals 303,294 87 226,918 65Medical Aides and Orderlies 351,482 77 264,855 58Other Professionals 2,173,066 81 1,909,949 71Upper Managers 1,161,205 69 1,076,270 64White Collar 5,339,634 63 4,748,972 56Blue collar 2,512,261 59 2,047,163 48
All Occupations 11,906,651 66 10,331,101 57
Table F.1: Participation in Civic Organizations in Last 12 Months, GSS17 2003
Without Occupational Associations or Unions
With Occupational Associations or Unions
Participation in Organizations
• Across all occupations, about two-thirds of employed Canadians regularly
ted,
participate in community groups or organizations. As might be expec

135
participation which includes occupational associations is highest among
professionals, both in the health sector and elsewhere, and is very high for
participation rate drops for all occupational groups but is still substantially
icipate in
multiple organizations.
MDsOther HMedica 0.4Other P 0.9
pper Managers 1.9 1.7 0.7hite Collar 1.5 1.3 0.4
Blue collar 1.3 1.0 0.3
All Occupations 1.7 1.3 0.5
medical doctors. When occupational associations are excluded, the
higher for MDs. Not only do more MDs participate, but they are also likely to
be active in a greater number of these groups and organizations. If
occupational associations are counted (the first column in Table F.2), MDs
participate on average in almost four (3.76) organizations. Other
professionals, both inside and outside the health sector, also part
Civic organizations, including Occupational
Associations
Civic organizations, excluding
Occupational Associations
Active through tInternet
3.8 2.9 1.3ealth Professionals 2.8 2.0 0.5l Aides and Orderlies 2.0 1.4rofessionals 2.3 1.8
average number
Table F.2: Level of Participation in Civic Organizations, GSS17 2003
he
UW
• When work-related organizations are excluded from the count, MDs still show
the highest level of participation, averaging almost three organizations.
Participation among other health professionals, other professionals and
upper-level managers is substantially lower at about two organizations, with
the remaining occupational groups at less than one and a half organizations.
To the extent that participation in formal and informal groups and
organizations represents one aspect of an individual’s civic engagement,
professionals in health, including medical doctors, are more actively engaged
2
e
than other occupational groups. As a side note, the last column in Table F.
shows that medical doctors are also the most likely to use the internet as on

136
way in which to participate in some groups and organizations. Perhaps th
Canadian Medical Association’s efforts to encourage doctors to use the
internet as an information resource have been successful.
The extent of an individual’s civic engagement can also be measured by the
frequency with which they participate in groups and organizations.
F.3 shows, medical doctors are among the most active. Along with other
professionals, almost half of doctors (48%) participate in civic org
two or more times each month, and for MDs only a small percentage (8%)
participates less often th
e
•
As Table
anizations
an once per year. In comparison, medical aides and
orderlies, upper managers, and white and blue collar workers, among whom
frequent participation is not substantially lower (34%, 42%, 39% and 32%
respectively), do show markedly higher proportions (one third or more) who
participate very infrequently. Even among other health professionals and
other professionals in general, where relatively high proportions participate
fairly frequently (43% and 48%), more than one in five do so very
infrequently. Thus MDs not only belong to, or participate in more
organizations, but they also participate more often.
00Other HMedicaOther PUpper MWhite C 100Blue co 100
All Occ 0
Table F.3: Frequency of Participation in Organizations, GSS17 2003
Two or more times per month Once a month or less Less than once per year To
48 44 8 1ealth Professionals 43 36 21 100l Aides and Orderlies 34 33 33 100rofessionals 48 28 23 100
anagers 42 24 34 100ollar 39 20 41
llar 32 22 46
upations 39 23 38 10
%
Civic Participation, with occupational associations
tal
MDs
F.2. The Types of Civic Organizations Participated In

137
• T als
s participation by
occupational groups in five of the more common types. In the discussion that
• P
er and is
here is a broad range of types of civic organizations and groups individu
can be members of, or participate in. This section examine
follows, participation in a given type can involve participation in any number
of organizations of that type, and each individual can participate in any or all
of the five types.
articipation in work-related associations or unions differs very substantially
across occupational groups (Table F.4). The importance and prevalence of
professional associations and unions in the health sector is evident in the
extensive participation of MDs (85%), other health professionals (81%), and
even medical aides and orderlies (58%) in these organizations. The
importance of professional associations in general is also evident in that the
majority of other professionals belong to an organization of this type. For the
other occupational groups, the extent of participation is distinctly low
close to the national average of 32%.
Professional Association or
Union
Sport or Recreation
Organization
Culture, Education or
Hobby Organization
Religious Group
School, Neighbourhood or
Community Association
MDs 85 40 44 26 19Other Health Professionals 81 36 22 26 23Medical Aides and Orderlies 58 28 13 20 18Other Professionals 53 39 31 20 26Upper Managers 28 39 22 16 21White Collar 24 31 17 16 18Blue collar 28 29 11 13 11
All Occupations 32 33 18 16 18
Table F.4: Participation in Types of Organizations, GSS17 2003
% participating
About one-third of working Canadians participate in sport or recreational
l doctors and other
•
organizations. Participation is highest among medica

138
health professionals, other professionals and upper-level managers (36% to
izations to structure their non-work activities.
,
uite low
d
rt and recreation groups with
participation in culture, education and hobby groups. In Figure F.5, the
occupations are ranked from high to low according to the percentage of each
group that participated in any organizations in either of the two types. Among
professionals and managers, half or more are involved in structured leisure
activities, while 40% or fewer in the lower occupations are engaged in these
situations. Workers in jobs at the lower end of the hierarchy, who together
make up 76% of employed Canadians, tend not to participate in structured
recreational or cultural activities.
40%). Medical aides and orderlies, and white and blue collar workers are less
likely to be involved in these types of organizations (28% to 31%). These
types of organizations are involved mainly in the provision of leisure-time
activities, either for adults or for their children, and the higher level of
participation among professionals and managers suggests that they make more
use of these organ
• A similar pattern emerges for participation in culture, education or hobby
organizations, another type mainly involving recreational activities. Upper-
level managers and professionals of all types, but particularly MDs (44%)
participate in organizations of this type. In contrast, the participation of
individuals in jobs at the lower end of the occupational hierarchy is q
(between 11% and 17%). These occupational groups do take part in organize
leisure activities and groups but their participation is substantially less
extensive than the professional and manager groups. This is even clearer
when we combine participation in spo

139
Figure F.5: Participation in Sport, Recreation, Culture, Education or Hobby Organizations
68
55
50
45
40
35 34
0
10
20
30
40
50
60
70
80
perc
ent
•
his
.
Participation in school, neighbourhood or other community groups is not
extensive — just under one in five working Canadians participate in these
types of groups. Again there is a slight tendency for occupational groups at
the upper end of the occupational hierarchy to be involved with these groups
than is the case for medical aides and orderlies, and white and blue collar
workers.
MDs Other Professionals Upper Managers Other HealthProfessionals
White Collar Medical Aides andOrderlies
Blue collar
Participation in religious groups for civic action is highest among MDs and
other health professionals, and lowest among blue collar workers. T
pattern of participation is not surprising given that MDs and other health
professionals were the most active attendees of religious services (56% and
44% attended monthly or more often), while blue collar workers were much
less active in religious congregations (28% attended monthly or more often)
Clearly, participation in the civic activities of religious groups is usually
closely connected with, and perhaps even a direct consequence, of being
actively involved in a religious congregation.
•
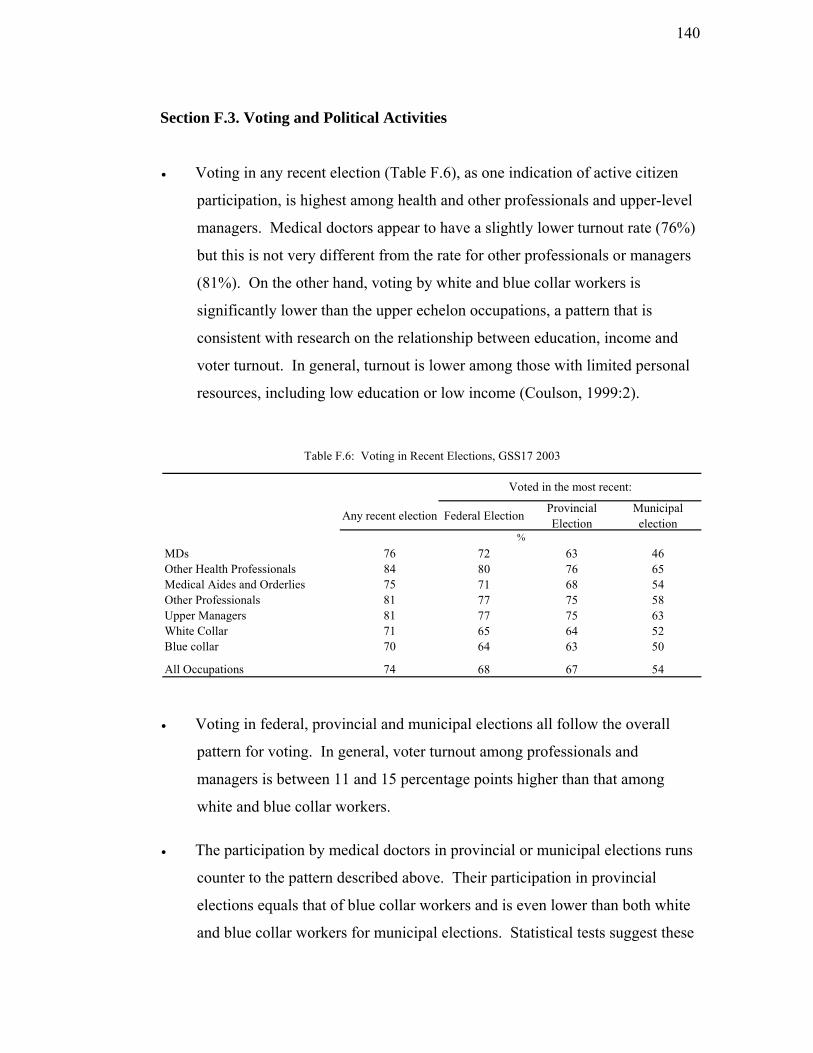
140
Section F.3. Voting and Political Activities
• Voting in any recent election (Table F.6), as one indication of active citizen
participation, is highest among health and other professionals and upper-level
managers. Medical doctors appear to have a slightly lower turnout rate (76%)
but this is not very different from the rate for other professionals or managers
(81%). On the other hand, voting by white and blue collar workers is
significantly lower than the upper echelon occupations, a pattern that is
consistent with research on the relationship between education, income and
voter turnout. In general, turnout is lower among those with limited personal
resources, including low education or low income (Coulson, 1999:2).
MDsOther MedicOther UpperWhiteBlue collar
All Oc
Table F.6: Voting in Recent Elections, GSS17 2003
Voted in the most recent:
Any recent election Federal Election Provincial Election
Municipalelection
76 72 63 46Health Professionals 84 80 76 65al Aides and Orderlies 75 71 68 54Professionals 81 77 75 58 Managers 81 77 75 63 Collar 71 65 64 52
70 64 63 50
cupations 74 68 67 54
%
• l
ong professionals and
managers is between 11 and 15 percentage points higher than that among
• s
ite
ollar workers for municipal elections. Statistical tests suggest these
Voting in federal, provincial and municipal elections all follow the overal
pattern for voting. In general, voter turnout am
white and blue collar workers.
The participation by medical doctors in provincial or municipal elections run
counter to the pattern described above. Their participation in provincial
elections equals that of blue collar workers and is even lower than both wh
and blue c

141
results be treated with some caution because the low number of medical
doctors in the survey. The turnout for provincial elections among MDs (63%)
r
y
• Overall, there is reason to question respondent-reported rates of voting in
municipal elections in particular. In the period 1990 to 1999 in eight major
Canadian cities country-wide, for example, voter turnout averaged 41%, and
only in Winnipeg did it average above 50% (Vital Signs, 2001:5).
per Mhite C
Blue coll 5
All Occu 7
Table F.7: Participation in Political Activities, GSS17 2003
% yes
* results su
is not statistically different from the white collar workers (64%) nor the othe
health professionals (76%), the group with highest turnout. As a result, our
best estimate is that the turnout of MDs was somewhere between 63% and
76%. In the turnout for municipal elections, however, participation by MDs
was significantly lower than that of either other health professionals or
managers. In Canada, the majority (65%) of those who do not vote in
elections report that either there were no important election issues or that the
were busy or working (Coulson, 1999:4). Perhaps one of these two situations
applies more to MDs than to other professionals.
Researched Political Issues
Volunteered for a Political Party
Expressed Views by Contacting News media or
Politician
Signed a Petition
Chosen or Boycotted
Products for Ethical Reasons
Attended a Public
Meeting
Marched in a Demonstration
MDs 42 * 26 40 46 32 *Other Health Professionals 33 * 15 44 31 30 9Medical Aides and Orderlies 22 * 9 35 23 23 9Other Professionals 47 5 22 43 39 34 12Up anagers 33 5 18 31 29 31 5W ollar 27 2 11 31 21 19 7
ar 21 2 10 25 15 20
pations 29 3 13 32 24 23
pressed due to small cell counts
• In participating in a variety of direct political or civic activities, medical
doctors and other professionals were the most active of all occupational
groups in researching political issues, expressing their views to the media or
politicians, choosing or boycotting products for ethical reasons, and attending
142
public meetings. MDs along with managers were also most likely to spea
public meetings. In contrast, white and blue collar workers were least likely
to take part in any of these activities.
mentary and Conclusions
We began with the goal of identifying patterns in the contributory
iours of occupational groups, and we are now able to spell out those patterns
files for each group.
k at
Com
behav
in pro
hysicians:
• d
•
• their
counterparts
• cite a shortage of time for not being able to volunteer
• are almost all charitable donors
• donate the highest amount annually
• favour religious and educational organizations for their giving and
volunteering
• are most likely of all occupations to engage in planned giving
• have the highest rate and variety of participation in civic organizations,
especially in leisure activity organizations (sports, recreation, culture,
education and hobby groups).
Other health professionals:
•
• have no differences in volunteering by age or gender
P
have the highest rate of volunteering, slightly below that of managers an
other professional groups
contribute the least quantity of volunteer time of any occupational group
who are older (55+), or female, are more likely to volunteer than
have average rates of volunteering and devote below-average hours (90) to
volunteering

143
•
•
• ational category to support social
service organizations financially
• show high civic participation and voting
derlies:
•
f their donations to health organizations than any other
occupation
ipate in civic activities at the average rate
Busine
n
iative
ng ($516)
ocial service and religious organizations
“in memoriam” than others do
al
Pro s
• st
84)
• have a rate of charitable giving that is lowest of all professionals and
average annual donations ($325) and their charitable
• t share, of all occupations, to social service organizations
favour education and religious organizations
have a below-average level of charitable giving ($395)
are more likely than any other occup
Medical technicians, aides and or
volunteer at very low rates and give below average hours (130)
• have a high giving rate but among the lowest annual amount ($212) donated
• give a larger share o
• partic
ss professionals:
• have a relatively high rate of volunteering and average hours volunteered
• are much more likely to have been recruited than to have volunteered o
their own init
• have both a high incidence and level of charitable givi
• show a preference for giving to s
• give a larger share of their donations
• are average in their civic participation, and high in voting and politic
activities
fes ionals in the physical and applied sciences:
have almost the lowest rate of volunteering of any group and the highe
number of hours volunteered (1
managers, as is their
giving as a percentage of household income.
give the larges

144
• display low participation in school, neighbourhood and community
Professionals in law, arts and social sciences:
at are the highest of any
occupational group and average hours volunteered that are second highest
and
ns on their own initiative
ighest level of donating
($488), after physicians
proportion of household income to charities
• giving extensively
unity and
Up
• ve-average volunteering rates and average hours volunteered
• are most likely to volunteer for culture and recreation organizations
ey are mostly recruited by
• n above-average level of giving ($415)
of
organizations, and religious organizations
• show annual volunteering rates (51%) th
(171)
• show a stronger preference than other occupations for education
research organizations
• have the highest proportions of volunteers who approached volunteer
organizatio
• have an average rate of giving but the second h
• give the highest
• give a larger share of than any other occupational group to religious
organizations
engage in planned
• are most likely of all to participate extensively in school, comm
neighbourhood organizations and groups
per level managers:
show abo
• are unlikely to volunteer on their own ― th
others
have an average rate of giving and a
• have an average level of civic participation, with a larger proportion
managers involved with fraternal or service organizations than any other
occupation

145
Wh c
• vels of volunteering, giving and
civic participation
ations to religious organizations
Blue col
• have average or mostly below-average rates of volunteering, giving and
c
• a pations when they volunteer to do so for sports
a
T nce literature to guide us in making sense of these
patte . tion between
occu i
community, only one seeks to construct an explanatory account. Wilson and
Musi ( ivic skills” which are necessary “to
organ e
for a pro likely to be provided by certain
inds of jobs than others. By way of empirical analysis, they found this to be
ly, they found individuals engaged in self-directed work to
be m e
emp ss
corp
riche
contributing and participating than W
• ost strongly affected by the number of
community organizations an individual participated in
ite ollar workers:
have below-average or average rates and le
• give an above-average share of their don
lar workers:
ivic participation
re most likely of all occu
nd recreation organizations.
here is little in social scie
rns Of the handful of studies with a focus on the potential connec
pat on and behaviours that involve contributing to and participating in the
ck 1997) posit as a linking mechanism “c
iz a meeting, give a presentation, write a memorandum, or take responsibility
ject” (p. 225) and that these skills are more
k
strongly true; additional
or likely to volunteer, and public sector workers much more so than self-
loyed or private sector workers (and “professionals employed by busine
orations….least likely of all professionals to volunteer”, (p. 261)).
We believe the patterns uncovered in the present analysis show a rather
r set of work-related factors to be connected to community-oriented
ilson and Musick, as borne out by these facts:
the probability of volunteering is m

146
• professionals in health and in law, arts and social science are most involved
far less
• beyond the incidence of volunteering, giving and participating, different
roups vary significantly in how much and which types of
We obs males predominate showed different
ontributory behaviours than ones with large female populations; we observed that
ccupation-specific differences in religious activity were accompanied by
alent
um of
eople from the throughout the community and people in need (compare physicians
ing active
that of all typical
socio-demographic traits, occupation exerts among the strongest influence on
of any category in contributing to their communities, and those in physical
and applied science
• white and blue collar individuals are least likely to be civically active
occupational g
volunteer and charitable organizations they favour and in their manner of
supporting them.
erved that occupations where
c
o
differences in contributing and participating; we observed that occupational
differences in the initial decision to volunteer or donate ― being recruited or
solicited, versus taking the initiative oneself ― are significant.
In the patterns that exist between and within occupational groups, there are
other connections that can be inferred. One is that financial resources are a
significant differentiator (compare white and blue collar categories with many
highly paid professionals); another is the extent to which the occupation’s prev
focus is people (doctors, teachers, lawyers) compared with a focus on tasks
(business professionals, and blue collar workers) or things (professionals in the
physical and applied sciences); another is that occupations which routinely bring
individuals into face-to-face contact with others, especially a wide spectr
p
with business professionals) have much higher contributory behaviours and a
further observation is the extent to which the occupation’s work entails be
in networks and in organizational settings.
Previous studies we have undertaken have shown clearly

147
civ ll
Reed, 2 y
has shown how occupation constitutes a causal nexus for contributory behaviours
and e
ica y active volunteers and charitable givers (Reed and Selbee, 2000; Selbee and
004). The array of observations and influences comprising the present stud
th manifold ways in which that connection occurs.

148
Bibliography Adams, Damon
AMA Survey: More Doctors Volunteering. http:/assu.org/amednews/2002.
/www.ama-
Doctors in Canada. Toronto: University of Toronto Press, 1991.
Professions and Civic Engagement: Trends in Rhetoric and Practice, 1875-1995, pp.163-210 in Theda Skocpol and Morris P. Fiorina, eds., Civic Engagement in American Society. New York and Washington: Russell Sage Foundation and Brookings Institution Press, 1999.
Coulson, Tony
Voter Turnout in Canada. Electoral Insight, Ottawa: Elections Canada, November, 1999.
Culler, Steven D., and R. O. Ohsfeldt
The Determinates (sic) of the Provision of Charity Medical Care by Physicians. Journal of Human Resources, 21,1, (Winter), 138-156, 1986.
Cunningham P., J. Grossman, R. St. Peter and C. Lesser
Managed Care and Physicians’ Provision of Charity Care, Journal of the American Medical Association, 281 (12): 1087-92, 1999.
Freeman, Richard B. Working For Nothing: The Supply of Volunteer Labor. Journal of Labor Economics 15:s140-s166, 1997.
Gibelman, M., and J. Sweifach
Acting on Our Values: Do Human Service Professionals Volunteer? Paper presented at the Annual Conference of ARNOVA (The Association for Research on Nonprofit Organizations and Voluntary Action), 2004.
Hagedorn, Robert, and S. Labovitz.
Participation in Community Associations by Occupation. American Sociological Review, 33:259-271, 1968.
Hall, M. H., M.L. de Wit, D. Lasby, D. McIver, T. Evers, C. Johnston, J. McAuley, K. Scott, G. Cucumel, L. Jolin, R. Nicol, L. Berdahl, R. Roach, I. Davies, P. Rowe, S. Frankel, K. Brock, V. Murray.
Highlights of the National Survey of Nonprofit and Voluntary Organizations, Statistics Canada: Ottawa, 2004.
Blishen, Bernard R.
Brint, Steven and C.S. Levy
149
edwab, J.
Reducing the Democratic Deficit: The Causes of Low Voter Turnout as y Canadians. Association for Canadian Studies, December, 2004.
eed, P. B. and L K. Selbee Characteristics of Active Volunteers in Canada. Nonprofit
a Reed, P., K. Selbee, A. O’Connell, R. Laforest, and S. Hitsman
h
eed, Marie C., P.J. Cunningham, and J. Stoddard
ns Pulling Back from Charity Care. Centre for Studying Health
omanski, Erin
ltruism Does Lead to Volunteering.
alinsky, Eileen
eering and the Health Care
aul Reed
a Research report, 2004.
VLE
J
Viewed bwww.acs-aec.ca/Polls/08-12-2004.pdf
RDistinguishing
nd Volunteer Sector Quarterly 29:571-592, 2000.
What Can They Be Thinking? Social Reasoning and Contributory Behaviour: A Qualitative Analysis, Ottawa: Statistics Canada ResearcReport, 2000.
R Physicia
System Change, Issue Brief No. 42, 2001.
R Above and Beyond Idealism, A
PhysiciansPractice.com, 2002.
S Necessary But Not Sufficient? Physician Volunt
Safety Net. National Health Policy Forum Background Paper. Washington, 2004.
Selbee, L. Kevin and PDistinguishing Characteristics of Above-the-Median Charitable Donors inCanada, Ottawa: Statistics Canad
Selbee, L. Kevin
olunteering in Canada: An Application of Social Resources Theory to the ikelihood of Being a Volunteer, and to the Determination of Volunteer ffort. (Ph.D Thesis) Carleton University, Ottawa, 2004.
Statistics Canada
Caring Canadians, Involved Canadians. Ottawa: Statistics Canada, C71-542-XPE.
at. No.
n Journal, Sept. 8, 1998, 525-
Sullivan, Patrick and Lynda Buske Results from CMA’s 1998 Physician Survey Point to a Dispirited Profession. Canadian Medical Associatio528, 1998.

150
Sullivan, Wm. M. dicine Under Threat: Professionalism and Professional Identity.
Toronto unicipal Voter Turnout. Vital Signs, 2001.
Wilson Social Forces, 76:251-
272, 1997.
Wilson
99-814, 1998.
MeCanadian Medical Association Journal, 162: 673, 2000.
Community Foundation M
, John, and M.A. Musick Work and Volunteering: The Long Arm of the Job.
, John and M. A. Musick The Contribution of Social Resources to Volunteering. Social Science Quarterly 79:7