pauliceia 2.0: a computational platform for collaborative...
TRANSCRIPT

Pauliceia 2.0: A Computational Platform for CollaborativeHistorical Research
Karine R. Ferreira1⇤, Luis Ferla2⇤, Gilberto R. de Queiroz1, Nandamudi L. Vijaykumar1,Carlos A. Noronha1, Rodrigo M. Mariano1, Yasmin Wassef1, Denis Taveira1,Ivan B. Dardi1, Gabriel Sansigolo1, Orlando Guarnieri2, Daniela L. Musa 2,
Thomas Rogers3, Jeffrey Lesser3, Michael Page3, Andrew G. Britt3, Fernando Atique2,Janaina Y. Santos4, Diego S. Morais4, Cristiane R. Miyasaka2, Cintia R. de Almeida2,
Luanna G. M. do Nascimento2, Jaıne A. Diniz 2 and Monaliza C. dos Santos2
1INPE - National Institute for Space Research, Sao Jose dos Campos – SP – Brazil2UNIFESP - Sao Jose dos Campos and Guarulhos – SP – Brazil
3Emory University (The Halle Institute for Global Learning, The Emory Center forDigital Scholarship, and The Department of History) – Atlanta – United States
4Arquivo do Estado de Sao Paulo – Sao Paulo – SP – Brazil
⇤{[email protected], [email protected]}
Abstract. Digital humanities research promotes the intersection between digitaltechnologies and humanities, emphasizing free knowledge sharing and collabo-rative work. Based on the digital humanities features, this paper presents the ar-chitecture of a computational platform for collaborative historical research thatis being designed and developed in an ongoing project called Pauliceia 2.0. Thisplatform uses volunteered geographical information (VGI) and crowdsourcingconcepts to produce historical geographic data and to allow historians to sharehistorical data sets resulting from their researches.
1. IntroductionDigital Humanities (DH) research takes place at the intersection of digital technologiesand humanities, producing and using applications and models that make possible newkinds of teaching and research both in humanities and in computer science [Terras 2012].The digital humanities community is interdisciplinary, linking together the humanisticand computational approaches. This community includes people with different disciplinesand methodological approaches that come together around values such as openness andcollaboration [Spiro 2012].
DH have drawn increasing institutional support and intellectual interest amongscholars working on historical research in universities throughout the world. Histo-rians working within digital humanities promote the use of Geographical InformationSystems (GIS), among other tools, to understand historical data. DeBats and Gregory[DeBats and Gregory 2011] argue that GIS has directly contributed to the advancementof knowledge in history and that the principal topic so far developed within this field isurban history.
Free knowledge sharing and collaborative work have indeed become core featuresof digital humanities [Spiro 2012]. The role of the world network of computers, in par-ticular web 2.0, has boosted these aspects of the field. It places value not only on the
Proceedings XVIII GEOINFO, December 04th to 06nd, 2017, Salvador, BA, Brazil. p 28-39.
28

broad dissemination of studies and investigations, but also on opportunities for collabo-ration and putting into practice those theoretical values. Nowadays historians can benefitfrom a wide variety of technological options to disseminate their research widely and toparticipate in collaborative investigation across boundaries of time and space.
In literature, there are a variety of terms used to represent the general subjectof collaborative work and citizen-derived geographical information, such as volunteeredgeographical information (VGI), science 2.0, crowdsourcing and collaborative mapping.See et al.[See et al. 2016] present a good review of these terms, providing some basicdefinitions and highlighting key issues in the current state of this subject. The authorscategorize these terms according to three main aspects: (1) information or process thatcan be used to generate it; (2) active or passive contributions; and (3) spatial or non-spatial user-generated information.
The term VGI was first defined by Goodchild [Goodchild 2007] as “the harness-ing of tools to create, assemble, and disseminate geographic data provided voluntarilyby individuals”. According to [Estelles-Arolas and Gonzalez-Ladron-de Guevara 2012],crowdsourcing is “a type of participative online activity in which an individual, an institu-tion, a non-profit organization or company, proposes to a group of individuals of varyingknowledge, heterogeneity and number, via a flexible open call, the voluntary undertakingof a task. The undertaking of the task, of variable complexity and modularity, and inwhich the crowd should participate bringing their work, money, knowledge and/or expe-rience, always entails mutual benefit.”.
In GIScience, many efforts have been made to propose general frameworks andprotocols that can be followed by VGI projects. Davis Jr. et al. [Davis Jr et al. 2013]propose a general framework for VGI applications, based on coordinating both web-basedtools and mobile applications. Mooney et. al. [Mooney et al. 2016] propose a protocolfor the collection of vector data in VGI projects. Besides providing a standard for datacollection, the protocol also guides users to contribute to improve the overall data qualityof the project, which positively impacts their motivation to keep on providing information.In the recent years, an increasing number of projects have used crowdsourcing and VGIconcepts to produce historical geographic data. Examples of crowdsourcing projects tocollect historical geographic information are shown in next section.
This paper presents the architecture of a computational platform for collabora-tive historical research that is being designed and developed in an ongoing project calledPauliceia 2.0. This project has two main objectives. The first is to collect, select anddigitize historical data of Sao Paulo city from 1870 to 1940. During this period the citywent through a dramatic process of urbanization, almost unique in terms of contemporaryhistory. This transformation was taken as a challenge by several historians to investigatea range of issues within this period. The second goal is to design and build a computa-tional platform that allows humanities researchers to explore, integrate and publish urbanhistorical data sets. This platform will appeal to historians to not only explore historicaldata sets provided by the project, but also to contribute by including and sharing their ownknowledge and data sets.
Proceedings XVIII GEOINFO, December 04th to 06nd, 2017, Salvador, BA, Brazil. p 28-39.
29

2. Related workIn this section, we present some projects that have similar features to Pauliceia 2.0 andhighlight differences between the computational platform proposed in this paper and theones provided by such projects.
OpenStreetMap (OSM) is the most well-known general platform that implementsVGI successfully. It allows users to edit and work with free geographical data, followingan open content license [OpenStreetMap 2017]. There are many applications that are builton top of the OSM database. Two examples of OSM applications that focus on historicaldata sets are HistOSM1 and OpenHistoricalMap2. HistOSM is a web application to visu-ally explore historic objects stored in the OpenStreetMap database, such as monuments,churches and castles. OpenHistoricalMap is an effort to use the OSM infrastructure as afoundation for creating a universal, detailed, and historical map of the world.
The Atlanta Explorer project creates historical geodatabases, geocoders and 3Dmodels of Atlanta city for post Civil War to 1940 [Page et al. 2013]. ATLMaps3 webportal allows users to explore historical maps, Atlanta Explorer geodatabases, and stu-dents generated content of Atlanta city about different subjects, such as historical events,sites and land use. The project members argue that it presents a broad potential for usingcrowdsourced information about particular sites and structures. But for now, the projectportal does not allow citizen-derived geographical information.
The New York Public Library promotes a crowdsourcing project to create polyg-onal representation of building footprints and attributes from insurance atlases from 1853to 1930 of New York city. This project provides a web-based application called BuildingInspector4 that allows citizens to extract, correct and analyze data from historical maps.The volunteered information is used in training computers to recognize building shapesand other data on digitized insurance atlases. Budig et al. [Budig et al. 2016] propose aconsensus polygon algorithm to extract a single polygon to represent each building fromall polygons provided voluntarily by citizens in this project.
The Digital Harlem website5 is based on legal records, newspapers, archives andpublished sources, to provide information on everyday life in New York City’s Harlemneighborhood in the years 1915-1930. The website enables looking for events and placesand creating interactive web maps. The Digital Harlem historical database was created bythe project members, without using crowdsourcing and VGI concepts.
The British Library has a vast collection of maps. It developed a project to em-ploy crowdsourcing to georeference most of the old maps, using an online georeferencertool6. Such tools enable overlaying historic maps with modern ones from which one maycompare the past with the present and georeference these historical maps. The Libraryoriginally turned to crowdsourcing in 2011 and since then five releases of maps have beenmade public, with extremely successful results. Participants georeferenced 8,000 mapsand after undergoing a check for accuracy they were duly approved. They also developed
1http://histosm.org2http://www.openhistoricalmap.org/3https://atlmaps.org/4http://buildinginspector.nypl.org/5http://digitalharlem.org6http://www.georeferencer.com
Proceedings XVIII GEOINFO, December 04th to 06nd, 2017, Salvador, BA, Brazil. p 28-39.
30

a portal Old Maps Online7 with a geographic search interface to identify and view historicmaps from a variety of available collections.
Perret et al. [Perret et al. 2015] describe a project that creates roads and streetsof France from the 18th century by digitization of historical maps using collabora-tive methodology. However, it is not clear in the paper whether the collaboration isfrom trained operators or from the general public and specialist in history. Cura etal. [Cura et al. 2017] present another project from France that deals with collaborativegeocoding in History. The authors propose a solution that is open source, open data andextensible for geocoding based on the building of gazetteers that have geohistorical ob-jects collected from historical topographical maps. The case study was Paris in the 19th-20th centuries. The results can be visualized over modern or historical maps and evenverified and/or edited in a collaborative manner. They store several instances of the samespace at different moments in history that can be pictured as a snapshot of a given instant.The system enables collaborative editing, but the user profiles of those who collaborateand post content into the system are not clear.
ImagineRio8 is another initiative from an American University that provides aplatform to understand the evolution, both social and urban, of Rio de Janeiro, Brazil,looking into the entire history of the city. Several views from the perspective of artists,historical maps and architectural plans, in space and time have been organized. It is anopen-access digital library. It is possible to relate elements within a web environment inwhich a streaming of data (vector, spatial and raster) is conducted. Such data can alsobe inspected, toggled, visualized and naturally queried. It is quite valuable for architects,urbanists, and scholars to consult or view some particular spatiotemporal aspects of thehistory of the city. An interesting aspect of this project is the availability of a mobile appto enable interested parties and tourists to explore the city.
Pauliceia 2.0 project has many similarities with these projects and has been influ-enced by most of them, following a strong trend towards urban history and its relationshipwith space. Several projects described in this section use crowdsourcing and VGI con-cepts to vectorize specific features from historical maps, such as building footprints andstreets, to georeference historical maps as well as to geocode historical places. The maindifference between the similar projects and Pauliceia 2.0 is that we are proposing a com-putational platform that allows historians to share historical geographic data sets resultingfrom their researches on Sao Paulo city. Using crowdsourcing and VGI concepts, thePauliceia 2.0 platform will allow citizens to vectorize streets and buildings from histor-ical maps as well as researchers to share their historical data sets, providing a properenvironment for collaborative work. Pauliceia 2.0 is a platform for digital humanities thatadheres to the field’s main features of free knowledge sharing and collaborative work.
3. Platform architectureThe Pauliceia 2.0 platform is open source, web-based and service-oriented. Its archi-tecture is shown in Figure 1. It is being implemented using the GIS library TerraLiband the web geoportal framework TerraBrasilis developed by INPE [Camara et al. 2008].Service-oriented architectures are suitable for data and functionality exchanging across
7http://www.oldmapsonline.org/8http://hrc.rice.edu/imagineRio/home
Proceedings XVIII GEOINFO, December 04th to 06nd, 2017, Salvador, BA, Brazil. p 28-39.
31

systems, promoting a better integration and interoperability among technologies. ThePauliceia 2.0 spatiotemporal vector data is stored in a PostGIS database system and rasterdata in Geotiff files.
The architecture has two groups of web services. The first group is composed ofgeographical web services defined by the Open Geospatial Consortium (OGC): Web MapService (WMS) for map images, Web Feature Service (WFS) for vector data, Web Cov-erage Service (WCS) for coverage data, and Catalogue Service Web (CSW) for metadataof spatiotemporal data, services and related objects [Open Geospatial Consortium 2017].OGC has played a crucial role in geospatial data interoperability by proposing web ser-vices standards for visualizing, disseminating and processing geospatial data.
The dissemination of the Pauliceia database through OGC web services is im-portant for interoperability, integration with other applications and data sharing. TheBrazilian National Infrastructure for Spatial Data (INDE) specification is based on OGCweb services. The purpose of INDE is to catalog, integrate and accommodate the exist-ing geospatial data produced and maintained by agencies of the Brazilian Government sothat they are easily located, explored and accessed for a wide variety of uses through theinternet. The Pauliceia 2.0 historical data sets will be disseminated according to INDEspecification.
The second group is composed of three web services that are being designed andimplemented to augment the functionalities of the OGC standard services, attending tothe specific demands of the Pauliceia 2.0 project. One of the services is aimed to han-dle volunteered historic geographical information (VGI). The second one deals with spa-tiotemporal geocoding and the third one with new means to visualize spatiotemporal data.
3.1. Web service for historical VGIIn the past decade, VGI has become an interesting area of research due to its challengesand advantages. Even though it is possible to reach high standards of data quality withVGI projects, comparable to those collected by National Mapping Agencies (NMAs) andCommercial Surveying Companies (CSC) ([Ludwig et al. 2011], [Graser et al. 2014],[Ciepłuch et al. 2010]), the lack of a rigorous protocol is often a major source of errorsand an obstacle to the wider dissemination of VGI initiatives [Mooney et al. 2016].
To ensure the collection of quality data and the reuse of VGI for applications be-yond the ones originally intended, it is necessary to establish a protocol that balancesthe need for meticulous data collection strategies and the motivation for contributors tofollow its guidelines. Given the importance of creating a VGI protocol, Pauliceia 2.0project will create its own protocol based on the guidelines proposed by Mooney et. al.[Mooney et al. 2016], that include recommendations and best practices for VGI projects.In this section, some topics stipulated by these guidelines, such as data types, data collec-tion methods, metadata, quality control mechanisms and feedback to the community aredetailed in the Pauliceia 2.0 context.
In the Pauliceia 2.0 project, we intend to use VGI and crowdsourcing to vectorizestreets and buildings from historical maps as well as to collect and share historical datasets resulting from researches. All these data sets should be restricted to the urbanizationperiod of the Sao Paulo city from 1870 to 1940, which is the historical scope of thePauliceia 2.0 project.
Proceedings XVIII GEOINFO, December 04th to 06nd, 2017, Salvador, BA, Brazil. p 28-39.
32

Figure 1. Pauliceia platform architecture
The vectorization of streets and buildings from historical maps will be done man-ually by volunteers through the Pauliceia 2.0 web portal. This data consists of lines andpolygons representing streets and buildings, respectively. In this case, the data set gath-ered by volunteers will have a set of geometries, polygons or lines, to represent the sameobject, buildings or streets. To extract the most accurate geometry to represent a singleobject from this data set, we will employ methods that compute a single geometry thatrepresents the majority opinion, as proposed by Budig et al. [Budig et al. 2016].
Using the Pauliceia 2.0 platform, historians can share historical geographic dataresulting from their researches. Such data sets can vary among different themes, for ex-ample, crimes that occurred in Sao Paulo city in 1930 and industrial sites from the period1870-1930. The platform will accept geographical vector data with different types of at-tributes, including links to photos, videos and documents that must be stored in other plat-forms such as YouTube and Dropbox. Besides the historical data sets, historians shouldvalidate the metadata extracted automatically by the platform from such data sets as wellas inform missing metadata.
To promote and motivate volunteers to vectorize streets and buildings as well ashistorians to share their historical data sets, we intend to organize events oriented to thispurpose. Such events will contain tutorials about the platform and how to contribute,following the same idea of the events called mapathons promoted by Google Maps andOpenStreetMap. These events can be organized in universities with historians and their
Proceedings XVIII GEOINFO, December 04th to 06nd, 2017, Salvador, BA, Brazil. p 28-39.
33

students to promote the mass contribution of vector data in the Pauliceia 2.0 platform.
To organize the contribution process, the Pauliceia 2.0 platform implements twomain concepts, user and project. Everyone can visualize and access the project data setsthrough the web portal, but only registered users can add contributions and edit them.Users can register in the platform using social logins from Facebook and Google, afteraccepting the project Use Policy terms. These terms specify that the data provided by theplatform is public and the platform is not responsible for any issues that may arise fromusers providing copyrighted data.
A project is a group of data sets related to a specific theme. Each project hasan administration user who created it and a group of users, called collaborators, that areable to edit its data sets. Administration users can add other users as collaborators in theproject. If a user wishes to be part of a project as collaborator, it is necessary to makea formal request to the project administration. Users can only edit data sets in projectswhere they are collaborators. Users are also able to submit reviews and comments aboutthe project data sets through the platform.
In the platform, users can contribute with a single feature or a group of features.For single feature, users will choose a location on the historical map, either clicking onthe map or by typing an address, and will inform attributes about this location. For a bulkof features, users must provide the vector data sets following a specific format defined inthe Pauliceia 2.0 guidelines. Before inserting into the Pauliceia 2.0 database, such datasets must be approved by the project administrators.
With respect to quality control, users are expected to self-assess the data, checkingfor coherence, adequate quality and correctness of the attributes, before submitting it tothe platform. Once the data is submitted to a project, its collaborators can edit it. Takinginto consideration the fact that the target audience of this platform is people with priorknowledge of the field (historians and students), it is expected that they use their ownknowledge to point out errors or inconsistencies in the project database. This also worksas a mechanism of quality control maintained by the Pauliceia 2.0 community.
A collaborative project progresses as more users participate in it. Therefore, it isimportant to improve the user experience as a means of encouraging more contributors tojoin the platform. The user will be encouraged to provide feedback about his experiencewith the platform, commenting about the positive aspects and what needs improvement,giving opinions, making observations and suggesting changes. This feedback can beprovided via mailing lists or social media, and will be used as an important base forimproving the platform.
3.2. Geocoding web service for historical data
As described in previous section, a crucial feature of the Pauliceia 2.0 platform is to pro-vide functionalities that allow historians to share historical geographic data resulting fromtheir researches. In this case, most historical data sets have textual addresses to indicatespatial locations in the past. Thus, it is necessary to provide a geocoding algorithm ableto transform historical textual addresses into geographical coordinates.
Geocoding is the process of transforming textual data into geographical informa-tion. Obtaining coordinates from textual addresses is one of the most important geocoding
Proceedings XVIII GEOINFO, December 04th to 06nd, 2017, Salvador, BA, Brazil. p 28-39.
34

methods [Martins et al. 2012]. Address geocoding has to deal with challenges related tovariations in textual addresses, such as abbreviations and missing parts. Martins et. al[Martins et al. 2012] propose a geocoding method for urban addresses whose output in-cludes a geographic certainty indicator, which informs the expected quality of the results.
In the literature, there are many proposals of efficient geocoders for current ad-dresses, but they do not deal with historical data. A geocoder for historical informationmust operate on spatiotemporal data sets, that is, spatial entities whose geometries andattributes vary over time. The challenges of creating an address geocoding system forhistorical data are mainly related to the variation of names, geometries and numerationsof streets and buildings over time. In the Pauliceia 2.0 database, every spatial entity, suchas a street segment and a place with an address, has an associated period that indicateswhen it is valid. Thus, the geocoding method for this database has to take into account allvalid periods associated to spatial entities.
Cura et al [Cura et al. 2017] argue that historical geocoding requires dedicatedapproaches and tools due to three reasons. The first is that existing geocoding services donot consider the temporal aspect of the data sets they rely on. They implicitly work on avalid time that is the present. The second reason is that traditional geocoders are based ona complete and strict hierarchy, such as city, street, and house number, which is verifiable.Historical data, however, are full of uncertainties and are not directly verifiable. Onehas to check possibly incomplete and conflicting available historical sources and, veryoften, make assumptions or hypotheses. The third is that historical sources available toconstruct a geocoding database are sparse (both spatially and temporally), heterogeneous,and complex. Based on these reasons, Cura et al [Cura et al. 2017] propose an opensource solution for geocoding that is based on gazetteers of geohistorical objects extractedfrom historical maps.
The geocoding web service that is being designed and implemented in the Pauli-ceia 2.0 project has to consider all these particularities of historical data sets. Using thisservice, historians can geocode a single address or as a set of addresses via CSV files.Each address has to contain its street name, number and year. The service computes geo-graphical coordinates associated with the addresses using the historical places and streetsegments stored in the project database. Besides the geographical coordinates, the ser-vice returns a certainty degree associated with each coordinate. This degree indicateshow confident a geographical coordinate is, based on the number of available historicalentities that were used in the geocoding process.
To populate the project database, we designed and implemented a web portal forhistorical address edition 9 shown in Figure 2. This portal provides functionalities toinsert, delete, edit and search historical addresses. Through this portal, project membersare collecting and inserting historical addresses of Sao Paulo city from 1870 to 1940, suchas houses, buildings, churches and squares, into the project database. Each address has astreet name, a location number, a period when it is valid and a geographical coordinatethat is informed by clicking on the historical map in the portal. The stored addresses canbe viewed in an intuitive and simultaneous way by several users registered in the system.
The geocoding service relies on the historical addresses and street segments stored
9http://www.pauliceia.dpi.inpe.br/edit
Proceedings XVIII GEOINFO, December 04th to 06nd, 2017, Salvador, BA, Brazil. p 28-39.
35

in the project database. So, the construction of a good quality database is crucial to thesuccess of the geocoding process. The greater the number of addresses identified, thegreater the accuracy of the resulting base. The project members are using different typesof historical sources, such as legislative documents, newspapers, license plate books andadvertisement leaflets, to collect these addresses.
Figure 2. Web portal for historical address edition
3.3. Spatiotemporal visualization
When dealing with spatiotemporal data, visualization is a key aspect. It is an importantand essential step in order to provide insights for understanding not only behavior but alsoto enable decision makers to opt for suitable actions [Mazumdar and Kauppinen 2014].Visualization enables a clear and effective communication of the presented data.
With respect to Pauliceia 2.0, spatiotemporal visualization is a natural aspect tobe envisioned or considered. We intend to create a service that provides techniques forspatiotemporal visualization. Time is an important factor in historical data sets and shouldbe considered as a filter to display the same location over different time periods.
Therefore, it seems more than natural to analyze spatiotemporal data, such asthe one being dealt with in Pauliceia 2.0, to understand certain relationships and patternsamong the events and locations duly stored. It is important that the developed service pro-vides means to visualize location and time in an integrated manner [Shrestha et al. 2013].
4. Preliminary results and final remarksThis paper presents the architecture of a computational platform that contains crucialmodules to build an environment for collaborative historical research. At the moment, thePauliceia 2.0 database contains the following data sets: (1) two mosaics of georeferencedhistorical maps of Sao Paulo city, one of 1930 and another of 1924, stored as geotiff files;(2) streets extracted by project members from such maps of 1930 and 1920 stored in thePostGIS database as vector data; (3) historical addresses, such as churches, houses andbuildings, that were collected by project members through the web portal shown in Figure2 and stored in the PostGIS database as vector data.
Proceedings XVIII GEOINFO, December 04th to 06nd, 2017, Salvador, BA, Brazil. p 28-39.
36
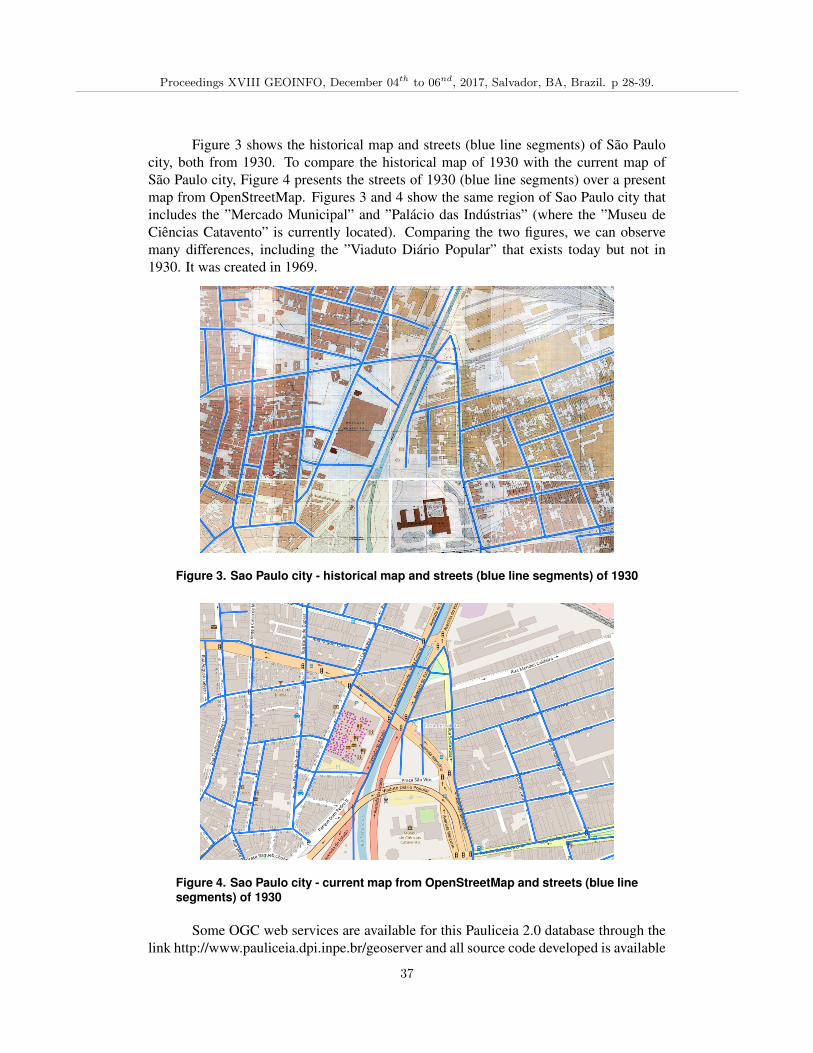
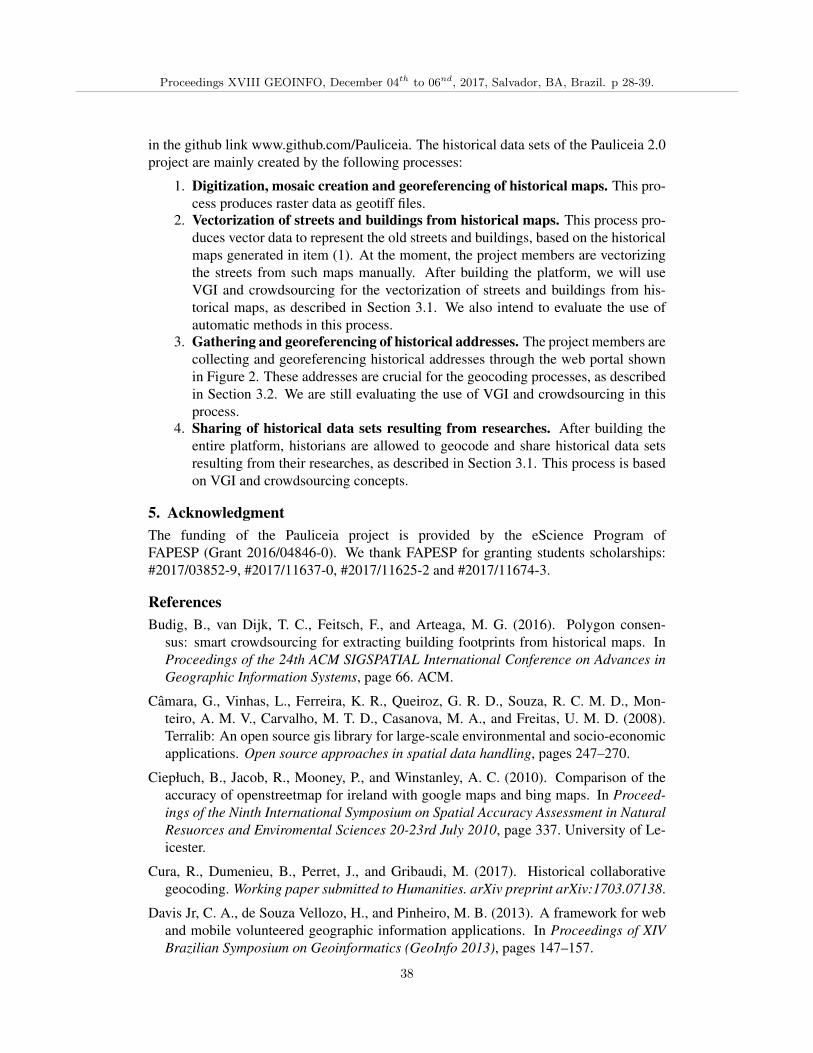
Figure 3 shows the historical map and streets (blue line segments) of Sao Paulocity, both from 1930. To compare the historical map of 1930 with the current map ofSao Paulo city, Figure 4 presents the streets of 1930 (blue line segments) over a presentmap from OpenStreetMap. Figures 3 and 4 show the same region of Sao Paulo city thatincludes the ”Mercado Municipal” and ”Palacio das Industrias” (where the ”Museu deCiencias Catavento” is currently located). Comparing the two figures, we can observemany differences, including the ”Viaduto Diario Popular” that exists today but not in1930. It was created in 1969.
Figure 3. Sao Paulo city - historical map and streets (blue line segments) of 1930
Figure 4. Sao Paulo city - current map from OpenStreetMap and streets (blue linesegments) of 1930
Some OGC web services are available for this Pauliceia 2.0 database through thelink http://www.pauliceia.dpi.inpe.br/geoserver and all source code developed is available
Proceedings XVIII GEOINFO, December 04th to 06nd, 2017, Salvador, BA, Brazil. p 28-39.
37
in the github link www.github.com/Pauliceia. The historical data sets of the Pauliceia 2.0project are mainly created by the following processes:
1. Digitization, mosaic creation and georeferencing of historical maps. This pro-cess produces raster data as geotiff files.
2. Vectorization of streets and buildings from historical maps. This process pro-duces vector data to represent the old streets and buildings, based on the historicalmaps generated in item (1). At the moment, the project members are vectorizingthe streets from such maps manually. After building the platform, we will useVGI and crowdsourcing for the vectorization of streets and buildings from his-torical maps, as described in Section 3.1. We also intend to evaluate the use ofautomatic methods in this process.
3. Gathering and georeferencing of historical addresses. The project members arecollecting and georeferencing historical addresses through the web portal shownin Figure 2. These addresses are crucial for the geocoding processes, as describedin Section 3.2. We are still evaluating the use of VGI and crowdsourcing in thisprocess.
4. Sharing of historical data sets resulting from researches. After building theentire platform, historians are allowed to geocode and share historical data setsresulting from their researches, as described in Section 3.1. This process is basedon VGI and crowdsourcing concepts.
5. AcknowledgmentThe funding of the Pauliceia project is provided by the eScience Program ofFAPESP (Grant 2016/04846-0). We thank FAPESP for granting students scholarships:#2017/03852-9, #2017/11637-0, #2017/11625-2 and #2017/11674-3.
ReferencesBudig, B., van Dijk, T. C., Feitsch, F., and Arteaga, M. G. (2016). Polygon consen-
sus: smart crowdsourcing for extracting building footprints from historical maps. InProceedings of the 24th ACM SIGSPATIAL International Conference on Advances inGeographic Information Systems, page 66. ACM.
Camara, G., Vinhas, L., Ferreira, K. R., Queiroz, G. R. D., Souza, R. C. M. D., Mon-teiro, A. M. V., Carvalho, M. T. D., Casanova, M. A., and Freitas, U. M. D. (2008).Terralib: An open source gis library for large-scale environmental and socio-economicapplications. Open source approaches in spatial data handling, pages 247–270.
Ciepłuch, B., Jacob, R., Mooney, P., and Winstanley, A. C. (2010). Comparison of theaccuracy of openstreetmap for ireland with google maps and bing maps. In Proceed-ings of the Ninth International Symposium on Spatial Accuracy Assessment in NaturalResuorces and Enviromental Sciences 20-23rd July 2010, page 337. University of Le-icester.
Cura, R., Dumenieu, B., Perret, J., and Gribaudi, M. (2017). Historical collaborativegeocoding. Working paper submitted to Humanities. arXiv preprint arXiv:1703.07138.
Davis Jr, C. A., de Souza Vellozo, H., and Pinheiro, M. B. (2013). A framework for weband mobile volunteered geographic information applications. In Proceedings of XIVBrazilian Symposium on Geoinformatics (GeoInfo 2013), pages 147–157.
Proceedings XVIII GEOINFO, December 04th to 06nd, 2017, Salvador, BA, Brazil. p 28-39.
38

DeBats, D. A. and Gregory, I. N. (2011). Introduction to historical gis and the study ofurban history. Social Science History, 35(4):455–463.
Estelles-Arolas, E. and Gonzalez-Ladron-de Guevara, F. (2012). Towards an integratedcrowdsourcing definition. Journal of Information science, 38(2):189–200.
Goodchild, M. F. (2007). Citizens as sensors: the world of volunteered geography. Geo-Journal, 69(4):211–221.
Graser, A., Straub, M., and Dragaschnig, M. (2014). Towards an open source analysistoolbox for street network comparison: Indicators, tools and results of a comparison ofosm and the official austrian reference graph. Transactions in GIS, 18(4):510–526.
Ludwig, I., Voss, A., and Krause-Traudes, M. (2011). A comparison of the street networksof navteq and osm in germany. In Advancing geoinformation science for a changingworld, pages 65–84. Springer.
Martins, D., Davis Jr, C. A., and Fonseca, F. T. (2012). Geocodificacao de enderecosurbanos com indicacao de qualidade. Proceedings of XIII Brazilian Symposium onGeoinformatics (GeoInfo 2012), pages 36–41.
Mazumdar, S. and Kauppinen, T. (2014). Visualizing and animating large-scale spa-tiotemporal data with elbar explorer. In Proceedings of the 2014 International Confer-ence on Posters & Demonstrations Track-Volume 1272, pages 161–164. CEUR-WS.org.
Mooney, P., Minghini, M., Laakso, M., Antoniou, V., Olteanu-Raimond, A.-M., andSkopeliti, A. (2016). Towards a protocol for the collection of vgi vector data. ISPRSInternational Journal of Geo-Information, 5(11):217.
Open Geospatial Consortium (2017). Ogc R� standards and supporting documents.http://www.opengeospatial.org/standards/. Accessed on 2017-09-20.
OpenStreetMap (2017). About openstreetmap. http://wiki.openstreetmap.org/wiki/About_OpenStreetMap. Accessed on 01/09/2017.
Page, M. C., Durante, K., and Gue, R. (2013). Modeling the history of the city. Journalof Map & Geography Libraries, 9(1-2):128–139.
Perret, J., Gribaudi, M., and Barthelemy, M. (2015). Roads and cities of 18th centuryfrance. Scientific Data, 2(150048):1–13.
See, L., Mooney, P., Foody, G., Bastin, L., Comber, A., Estima, J., Fritz, S., Kerle, N.,Jiang, B., Laakso, M., et al. (2016). Crowdsourcing, citizen science or volunteeredgeographic information? the current state of crowdsourced geographic information.ISPRS International Journal of Geo-Information, 5(5):55.
Shrestha, A., Zhu, Y., Miller, B., and Zhao, Y. (2013). Storygraph: Telling stories fromspatio-temporal data. In International Symposium on Visual Computing, pages 693–702. Springer.
Spiro, L. (2012). “this is why we fight”: Defining the values of the digital humanities.Debates in the digital humanities, page 16.
Terras, M. (2012). Quantifying digital humanities. Melissa Terra’s Blog.
Proceedings XVIII GEOINFO, December 04th to 06nd, 2017, Salvador, BA, Brazil. p 28-39.
39