pavement management system reviewutca.eng.ua.edu/files/2011/10/03416-final-report.pdf · ii...
TRANSCRIPT
i
By
Dr. David P. Hale, Dr. Joanne E. Hale, and Dr. R. Shane Sharpe Department of Information Systems, Statistics, and Management Science
The University of Alabama Tuscaloosa, Alabama
and
Dr. Jay K. Lindly and Dr. Daniel S. Turner
Department of Civil, Construction, and Environmental Engineering The University of Alabama
Tuscaloosa, Alabama
Prepared by
AISCE Aging Infrastructure Systems Center of Excellence
The University of Alabama
and
UUTTCCAA University Transportation Center for Alabama The University of Alabama, The University of Alabama at Birmingham,
and The University of Alabama in Huntsville
UTCA Report Number 03416 ALDOT Report Number 930-598
June 2009
Pavement Management System Review
UTCA Theme: Management and Safety of Transportation Systems
ii
Pavement Management System Review
By
Dr. David P. Hale, Dr. Joanne E. Hale, and Dr. R. Shane Sharpe
Department of Information Systems, Statistics, and Management Science The University of Alabama
Tuscaloosa, Alabama
and
Dr. Jay K. Lindly and Dr. Daniel S. Turner Department of Civil, Construction, and Environmental Engineering
The University of Alabama Tuscaloosa, Alabama
Prepared by
AISCE Aging Infrastructure Systems Center of Excellence
The University of Alabama
and
UUTTCCAA University Transportation Center for Alabama The University of Alabama, The University of Alabama at Birmingham,
and The University of Alabama in Huntsville
UTCA Report Number 03416 ALDOT Report Number 930-598
June 2009
iii
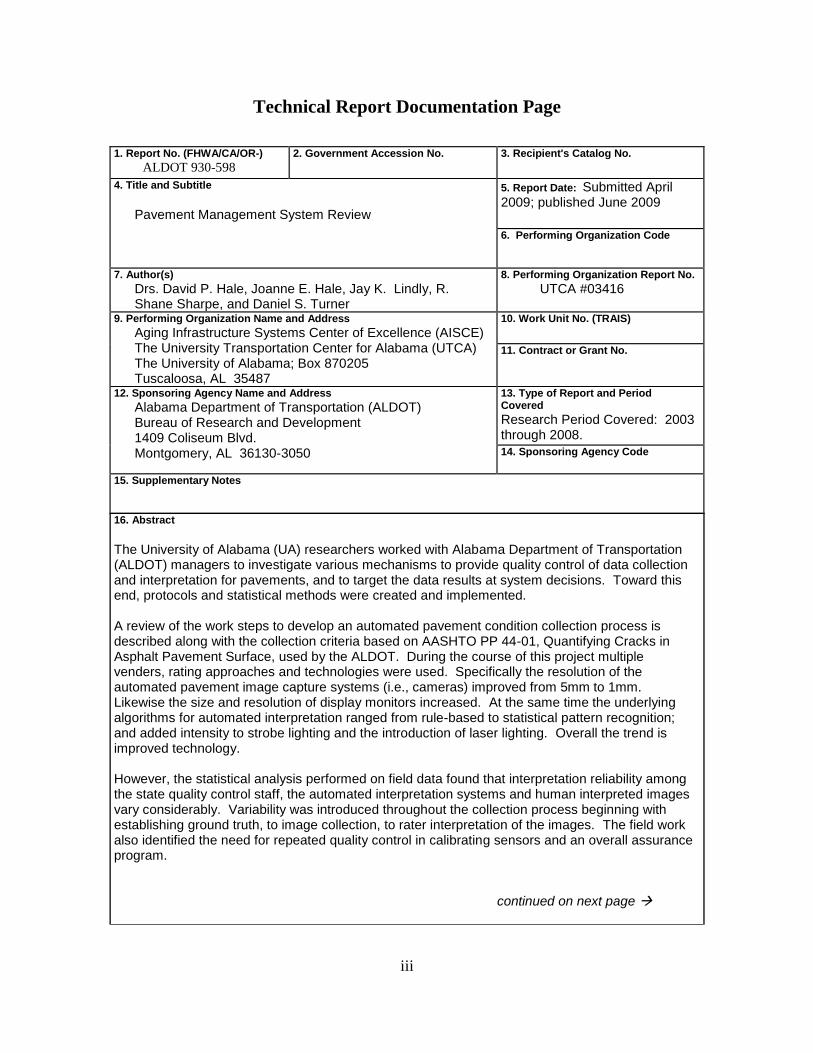
Technical Report Documentation Page
1. Report No. (FHWA/CA/OR-)
ALDOT 930-598 2. Government Accession No.
3. Recipient's Catalog No.
4. Title and Subtitle
Pavement Management System Review
5. Report Date: Submitted April 2009; published June 2009
6. Performing Organization Code
7. Author(s)
Drs. David P. Hale, Joanne E. Hale, Jay K. Lindly, R. Shane Sharpe, and Daniel S. Turner
8. Performing Organization Report No.
UTCA #03416
9. Performing Organization Name and Address
Aging Infrastructure Systems Center of Excellence (AISCE) The University Transportation Center for Alabama (UTCA) The University of Alabama; Box 870205 Tuscaloosa, AL 35487
10. Work Unit No. (TRAIS)
11. Contract or Grant No.
12. Sponsoring Agency Name and Address
Alabama Department of Transportation (ALDOT) Bureau of Research and Development 1409 Coliseum Blvd. Montgomery, AL 36130-3050
13. Type of Report and Period Covered
Research Period Covered: 2003 through 2008.
14. Sponsoring Agency Code
15. Supplementary Notes
16. Abstract
The University of Alabama (UA) researchers worked with Alabama Department of Transportation (ALDOT) managers to investigate various mechanisms to provide quality control of data collection and interpretation for pavements, and to target the data results at system decisions. Toward this end, protocols and statistical methods were created and implemented. A review of the work steps to develop an automated pavement condition collection process is described along with the collection criteria based on AASHTO PP 44-01, Quantifying Cracks in Asphalt Pavement Surface, used by the ALDOT. During the course of this project multiple venders, rating approaches and technologies were used. Specifically the resolution of the automated pavement image capture systems (i.e., cameras) improved from 5mm to 1mm. Likewise the size and resolution of display monitors increased. At the same time the underlying algorithms for automated interpretation ranged from rule-based to statistical pattern recognition; and added intensity to strobe lighting and the introduction of laser lighting. Overall the trend is improved technology. However, the statistical analysis performed on field data found that interpretation reliability among the state quality control staff, the automated interpretation systems and human interpreted images vary considerably. Variability was introduced throughout the collection process beginning with establishing ground truth, to image collection, to rater interpretation of the images. The field work also identified the need for repeated quality control in calibrating sensors and an overall assurance program.
continued on next page
iv
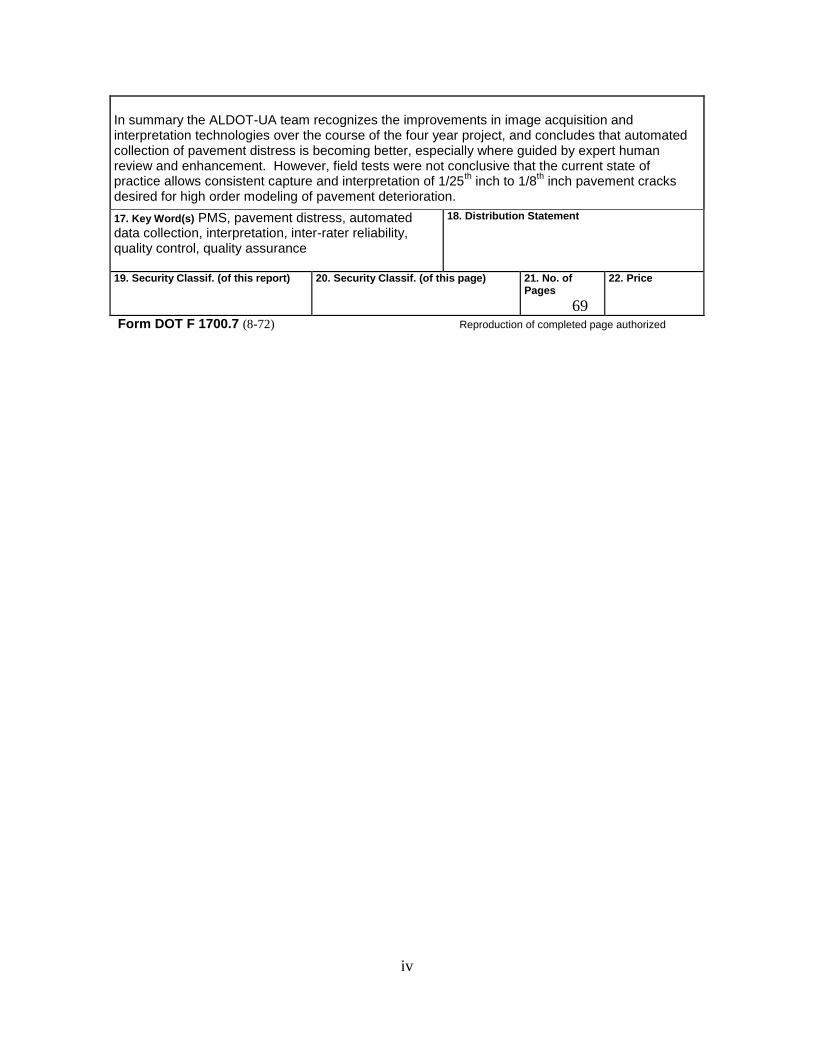
In summary the ALDOT-UA team recognizes the improvements in image acquisition and interpretation technologies over the course of the four year project, and concludes that automated collection of pavement distress is becoming better, especially where guided by expert human review and enhancement. However, field tests were not conclusive that the current state of practice allows consistent capture and interpretation of 1/25
th inch to 1/8
th inch pavement cracks
desired for high order modeling of pavement deterioration.
17. Key Word(s) PMS, pavement distress, automated data collection, interpretation, inter-rater reliability, quality control, quality assurance
18. Distribution Statement
19. Security Classif. (of this report)
20. Security Classif. (of this page)
21. No. of Pages
69
22. Price
Form DOT F 1700.7 (8-72) Reproduction of completed page authorized
v
Table of Contents
Table of Contents .............................................................................................................................v
List of Tables ................................................................................................................................ vii
List of Figures ............................................................................................................................... vii
Executive Summary ..................................................................................................................... viii
1.0 Introduction ...............................................................................................................................1
Project Objective ....................................................................................................................1
Overview ................................................................................................................................1
Transition to Automated Collection .......................................................................................2
Drivers for this Study .............................................................................................................3
2.0 Methodology .............................................................................................................................5
Initial Study Step: Benchmarking .........................................................................................5
Development of ALDOT 414-04 ...........................................................................................6
Test Frequency and Lanes to be Tested ............................................................................6
Conditions and Distresses to be Measured ........................................................................7
Other Data .......................................................................................................................10
3.0 Project Execution and Statistical Analysis .............................................................................12
Project Execution .................................................................................................................12
Statistical Analysis Used to Validate Data Collection Process ............................................14
4.0 Recommendations for Future Data Collection Process ..........................................................17
Phase 1: Establish Ground Truth .........................................................................................17
Phase 2: Pavement Data Collection ....................................................................................19
Quality Indicators ............................................................................................................20
Checkpoints .....................................................................................................................22
Roles ................................................................................................................................22
Phase 3: Image Interpretation ..............................................................................................22
Quality Indicators ............................................................................................................23
Checkpoints .....................................................................................................................24
Roles ................................................................................................................................24
5.0 General Observations and Recommendations ........................................................................25
Observations .........................................................................................................................25
Recommendations ................................................................................................................27
6.0 Acknowledgements .................................................................................................................29
vi
7.0 References ...............................................................................................................................30
Appendix A: ALDOT 414-04 Network-level Pavement Condition Data
Collection Procedure ......................................................................................................................32
Appendix B: Statistical Procedures Using Minitab ......................................................................38
Importing Data into Minitab ................................................................................................38
Measurement of Inter-rater Reliability .................................................................................39
Pearson’s Correlation Coefficient ........................................................................................40
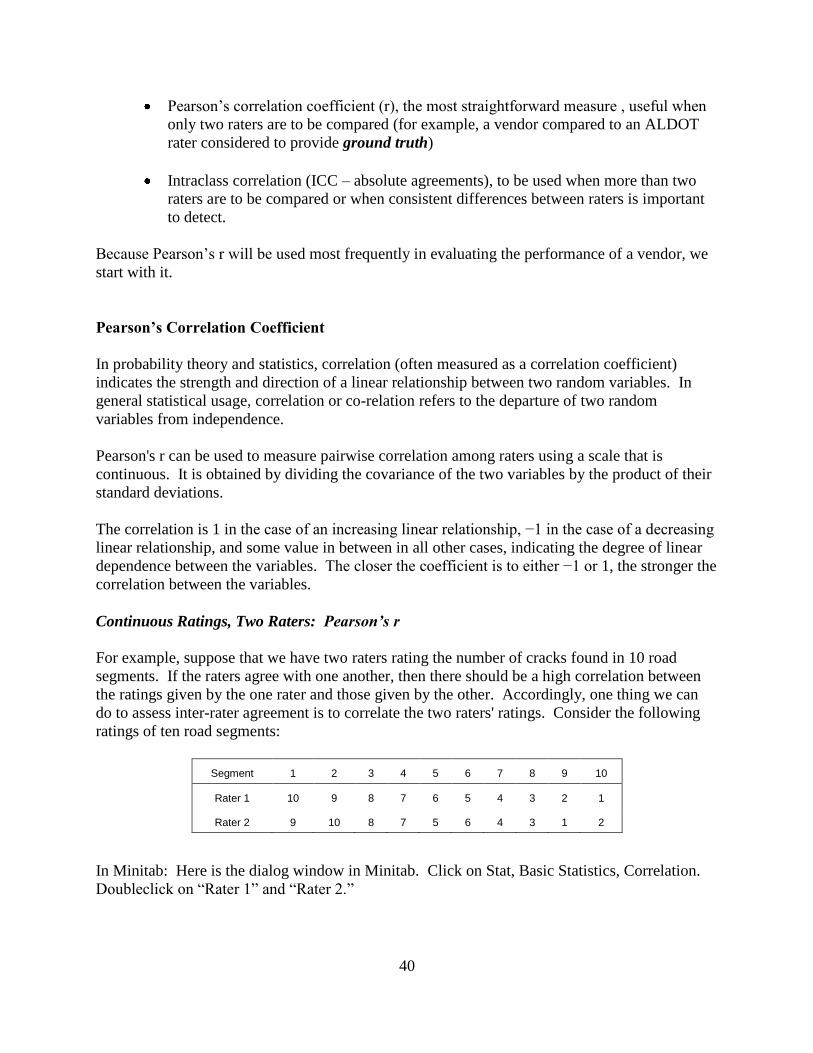
Continuous Ratings, Two Raters: Pearson’s r ................................................................40
Limitations of Pearson’s r ...............................................................................................42
Pearson’s r Example Using ALDOT Data ...........................................................................43
Intra-class Correlation Coefficient .......................................................................................44
Macro Needed to Calculate the ICC in Minitab ..............................................................46
Appendix C: Specifying Automated Pavement Condition Surveys .............................................47
vii
List of Tables
Number Page
1-1 Automated Collection Survey Results ..............................................................................3
2-1 Accuracy and Precision Requirements for ALDOT Data Elements ................................9
3-1 Summary of Activities from January 2006 through March 2008 ...................................13
3-2 Summary of Quality Control and Vendor Monitoring Tasks .........................................14
3-3 Wheel Path Cracking Example Correlational Analysis ..................................................15
List of Figures
Number Page
1-1 Pavement assessment process ...........................................................................................2
2-1 ALDOT wheel path definitions ........................................................................................8
4-1 Process phases ................................................................................................................17
4-2 Establish ground truth baseline.......................................................................................18
4-3 Pavements condition data collection ..............................................................................20
4-4 Images are interpreted ....................................................................................................23
B-1 Pairwise data patterns resulting in various Pearson’s r ..................................................42
viii
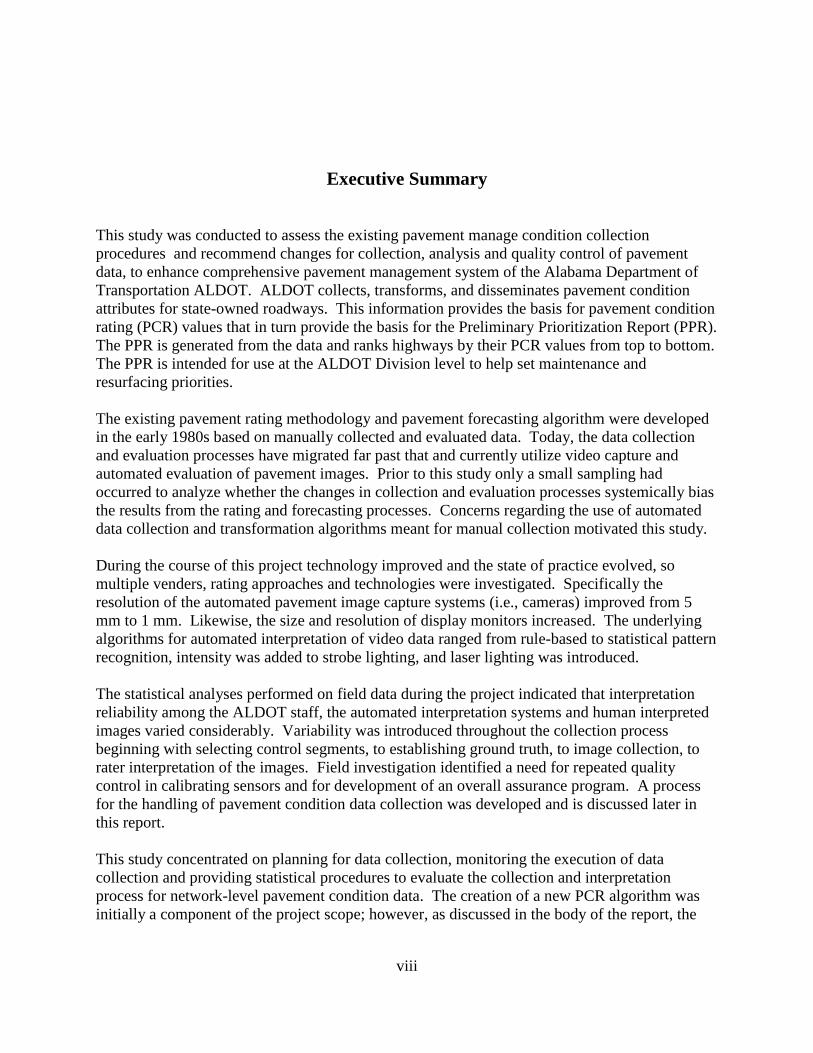
Executive Summary
This study was conducted to assess the existing pavement manage condition collection
procedures and recommend changes for collection, analysis and quality control of pavement
data, to enhance comprehensive pavement management system of the Alabama Department of
Transportation ALDOT. ALDOT collects, transforms, and disseminates pavement condition
attributes for state-owned roadways. This information provides the basis for pavement condition
rating (PCR) values that in turn provide the basis for the Preliminary Prioritization Report (PPR).
The PPR is generated from the data and ranks highways by their PCR values from top to bottom.
The PPR is intended for use at the ALDOT Division level to help set maintenance and
resurfacing priorities.
The existing pavement rating methodology and pavement forecasting algorithm were developed
in the early 1980s based on manually collected and evaluated data. Today, the data collection
and evaluation processes have migrated far past that and currently utilize video capture and
automated evaluation of pavement images. Prior to this study only a small sampling had
occurred to analyze whether the changes in collection and evaluation processes systemically bias
the results from the rating and forecasting processes. Concerns regarding the use of automated
data collection and transformation algorithms meant for manual collection motivated this study.
During the course of this project technology improved and the state of practice evolved, so
multiple venders, rating approaches and technologies were investigated. Specifically the
resolution of the automated pavement image capture systems (i.e., cameras) improved from 5
mm to 1 mm. Likewise, the size and resolution of display monitors increased. The underlying
algorithms for automated interpretation of video data ranged from rule-based to statistical pattern
recognition, intensity was added to strobe lighting, and laser lighting was introduced.
The statistical analyses performed on field data during the project indicated that interpretation
reliability among the ALDOT staff, the automated interpretation systems and human interpreted
images varied considerably. Variability was introduced throughout the collection process
beginning with selecting control segments, to establishing ground truth, to image collection, to
rater interpretation of the images. Field investigation identified a need for repeated quality
control in calibrating sensors and for development of an overall assurance program. A process
for the handling of pavement condition data collection was developed and is discussed later in
this report.
This study concentrated on planning for data collection, monitoring the execution of data
collection and providing statistical procedures to evaluate the collection and interpretation
process for network-level pavement condition data. The creation of a new PCR algorithm was
initially a component of the project scope; however, as discussed in the body of the report, the
ix
reliability of the point estimation values of the interpreted data precluded the development of a
new pavement condition index. A future project to define and validate a new PCR algorithm is
recommended.
The primary deliverables for this project are:
The ALDOT 414-04 Network-Level Pavement Condition Data Collection Procedure
Assistance in developing the Request for Proposal Statewide Vendor Data Collection
Quality Control Algorithms/Work Steps evaluating Raters Interpretation of
Automated Captured Pavement Images
Baseline Quality Assurance Program Work Steps for future Pavement Condition
Collection Projects
1
1.0 Overview
Project Objective
This project was conducted to review the practices of the Alabama Department of Transportation
(ALDOT) in collecting and using pavement condition data to estimate future pavement
conditions, and in allocating funding for maintenance, rehabilitation and replacement. Portions
of the existing system had been in place since the 1980s, data collection methods had changed,
and analysis procedures had migrated far past the original methodology for pavement condition
analysis.
This project assessed the existing system and recommend changes for collection, analysis and
quality control of pavement data, to enhance comprehensive pavement management system of
ALDOT.
Overview1
The Alabama Department of Transportation (ALDOT) is faced with a critical challenge of
managing the State’s transportation assets as it continues to moves forward on initiatives that
provide the basis for quantitative data asset management decision making. In the area of
pavement preservation, the United States Department of Transportation’s (USDOT) Federal
Highway Administration (FHWA) and the Governmental Accounting Standards Board require a
standard repeatable process for reliable pavement inspection.
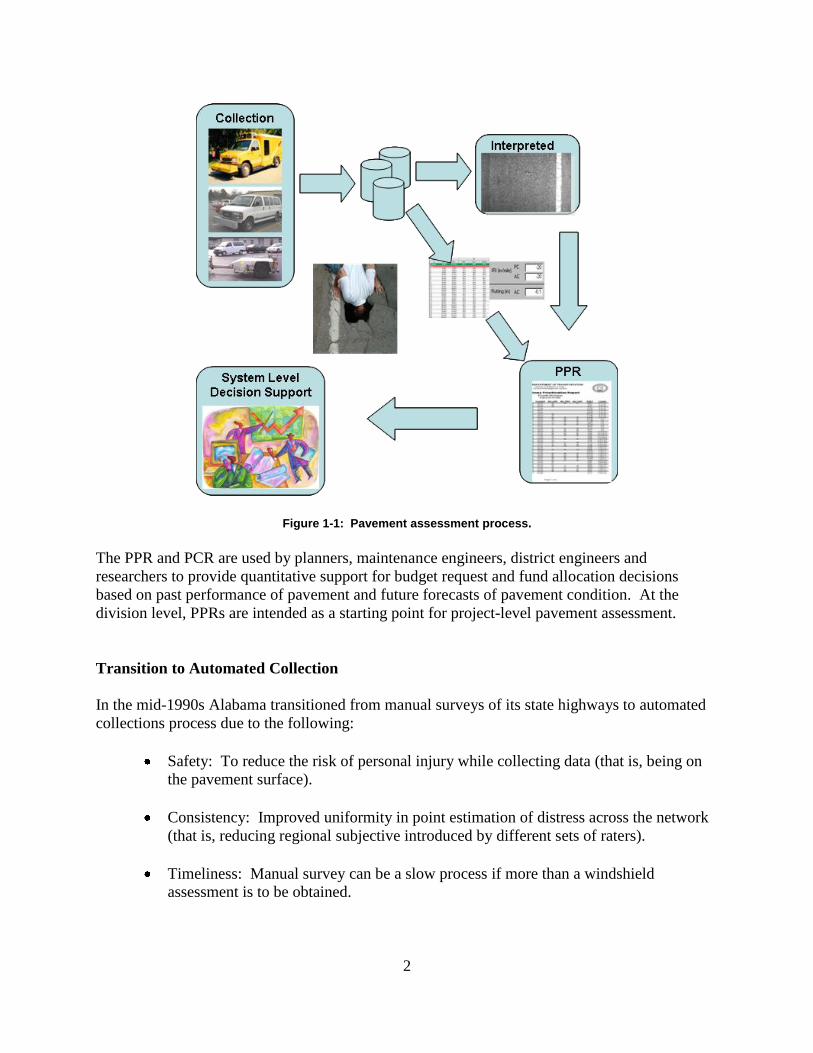
As depicted in Figure 1-1, ALDOT’s network-level pavement condition data collection process
consists of a series of steps that begins with on-road data collection using specialized vehicles
equipped with multiple sensors that collect multiple categories of distresses and indicators of
distresses (i.e., images) as the vehicle is driven on state-owned roads. The collected images are
transformed and processed together with distresses to produce the pavement condition rating
(PCR). The PCR values provide the basis for the Preliminary Prioritization Report (PPR). The
PPR provides a network-level perception using consistent methods and measurements across the
state to represent the status of ALDOT managed pavement.
1 Portions of the Background and Initial Study sections have previously appeared in Lindly, Bell, and Ullah (2005).
See Appendix C.
2
Figure 1-1: Pavement assessment process.
The PPR and PCR are used by planners, maintenance engineers, district engineers and
researchers to provide quantitative support for budget request and fund allocation decisions
based on past performance of pavement and future forecasts of pavement condition. At the
division level, PPRs are intended as a starting point for project-level pavement assessment.
Transition to Automated Collection
In the mid-1990s Alabama transitioned from manual surveys of its state highways to automated
collections process due to the following:
Safety: To reduce the risk of personal injury while collecting data (that is, being on
the pavement surface).
Consistency: Improved uniformity in point estimation of distress across the network
(that is, reducing regional subjective introduced by different sets of raters).
Timeliness: Manual survey can be a slow process if more than a windshield
assessment is to be obtained.
3
Alabama’s transition is consistent with those of more than half of the other state departments of
transportation (DOTs) that have transitioned to automated collection processes (Timm and
McQueen, 2004). This is supported by a National Cooperative Highway Research Program
(NCHRP, 2004) report that found that between 1994 and 2004, the number of North American
state/province DOTs that switched to automated collections of distress rose from seven to 30.
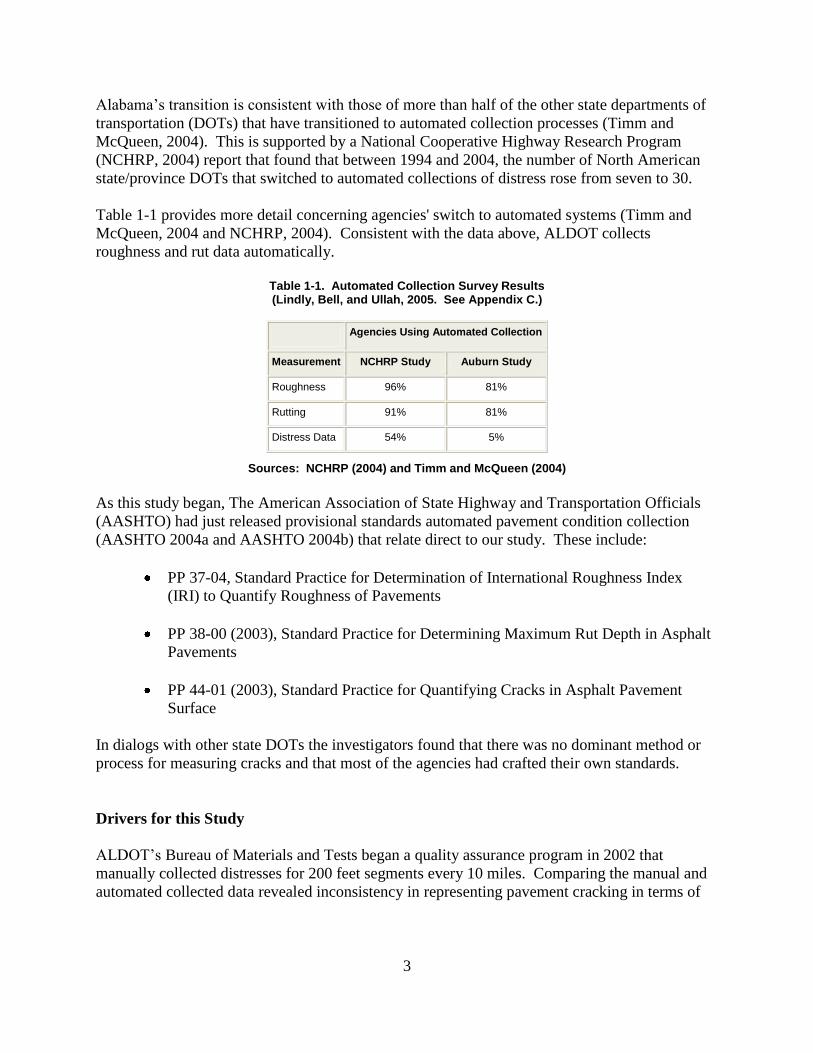
Table 1-1 provides more detail concerning agencies' switch to automated systems (Timm and
McQueen, 2004 and NCHRP, 2004). Consistent with the data above, ALDOT collects
roughness and rut data automatically.
Table 1-1. Automated Collection Survey Results (Lindly, Bell, and Ullah, 2005. See Appendix C.)
Agencies Using Automated Collection
Measurement NCHRP Study Auburn Study
Roughness 96% 81%
Rutting 91% 81%
Distress Data 54% 5%
Sources: NCHRP (2004) and Timm and McQueen (2004)
As this study began, The American Association of State Highway and Transportation Officials
(AASHTO) had just released provisional standards automated pavement condition collection
(AASHTO 2004a and AASHTO 2004b) that relate direct to our study. These include:
PP 37-04, Standard Practice for Determination of International Roughness Index
(IRI) to Quantify Roughness of Pavements
PP 38-00 (2003), Standard Practice for Determining Maximum Rut Depth in Asphalt
Pavements
PP 44-01 (2003), Standard Practice for Quantifying Cracks in Asphalt Pavement
Surface
In dialogs with other state DOTs the investigators found that there was no dominant method or
process for measuring cracks and that most of the agencies had crafted their own standards.
Drivers for this Study
ALDOT’s Bureau of Materials and Tests began a quality assurance program in 2002 that
manually collected distresses for 200 feet segments every 10 miles. Comparing the manual and
automated collected data revealed inconsistency in representing pavement cracking in terms of

4
categorization, assessed severity and calculated area. This study defines how pavement
distresses and conditions can be enhanced for network-level pavement condition data collection.
5
2.0 Methodology
Initial Study Step: Benchmarking
One of the primary reasons that ALDOT sponsored this project was to help transition from its
existing unique practices for quantifying cracks to what appeared to be the emerging national
document for such practices (AASHTO PP44-01). As a first step, the University of Alabama
(UA) investigators along with ALDOT Materials and Tests personnel developed questionnaires
to gather information from representatives of the FHWA, field and central office maintenance
personnel, and other state DOTs.
Project personnel met with a pavement management specialist from the FHWA Atlanta Resource
Center and subsequently assembled the following list of high-priority topics for investigation:
Test frequency and lanes to be tested
Conditions and distresses to be measured
Standards to follow
Crack severity level widths
Area cracking (load associated and block) reporting parameter
Reporting increments
Standard wheel path and lane dimensions
QC/QA Program
A short survey was distributed to the maintenance personnel in the ALDOT central office and
field offices, who are the primary end-users of ALDOT's pavement condition data. Thirty-seven
of 56 individuals responded. Responses to three questions were particularly specific and
provided information relevant to changing the pavement condition survey method:
Maintenance personnel most desired two pieces of information from a pavement
condition survey: (1) PCR tabulated every mile (almost all responses) and (2)
average rut depth (three-quarters of responses). Other needs cited included IRI,
amount of cracking, cross-slopes, date last resurfaced, and pavement buildup.
6
The questionnaire asked respondents to list the crack width at the point it becomes
significant to them. (They usually ignore cracks less than this width when making
maintenance decisions.) Responses of 0.25 inches and 0.125 inches predominated.
Network-survey-level digital cameras could detect cracks as small as 0.08 to 0.12
inch wide at the time of the questionnaire, which confirmed that automated condition
surveys could detect cracks of importance to maintenance personnel.
Respondents also chose from a list of 12 distresses that they suspect create a need for
maintenance or resurfacing. Load-associated cracking garnered the most responses,
followed by rutting (nearly all respondents). Patching and potholes led the second
tier of distresses.
FHWA personnel provided sample condition survey requests for proposals and specification
documents from eight states. Project team members read the documents and tabulated answers
to its list of high-priority topics for investigation. Team members also conducted extensive
telephone interviews with representatives from the DOTs of three states: Colorado, Louisiana,
and Oklahoma. Pertinent results of these activities will be described in following sections.
The next section of this report discusses the information gathered through benchmarking guided
the researchers in assembling a new document to guide pavement distress data.
Development of ALDOT 414-04
In consultation with the ALDOT project sponsors, the University of Alabama investigators
undertook the development of Alabama’s interpretation of AASHTO PP 44-01. To aid in this
development, key factors such as test frequency, lane treatment, accuracy and precision
requirements, conditions and distresses to be measured were detailed.
Test Frequency and Lanes to be Tested
The Auburn Study reports that 52% of respondents collect condition data annually; 30% collect
data biennially; 15% collect Interstate highway data annually and other road data biennially
(Timm and McQueen, 2004). The project team recommended retention of the current ALDOT
system of surveying National Highway System (NHS) roads annually and the remainder of its
road system biennially. One of the uses of pavement condition data is to predict future PCR of
roads to anticipate when they may be candidates for maintenance and resurfacing. In Alabama,
resurfaced roads, particularly those off the NHS, typically last 10+ years before requiring
significant maintenance activities, which will allow at least five data points over the life of the
overlay if data is collected biennially.
Prior to this study, pavement condition data was collected for all highway types in both
directions, up to two lanes in each direction. The rationale was to collect data that would support
differing resurfacing cycles for the truck lanes on certain routes. Reviewing documents from
other state DOTs indicated that they collect condition data on far fewer lanes. The project
7
investigators and ALDOT personnel concluded that a change to collecting data for one lane in
both directions on multi-lane highways and only one lane in the "primary" direction (north or
east) for smaller facilities should be adopted as the standard to significantly reduce data
collection costs.
A data reporting increment of 0.01 mile or 52.8 feet was chosen by ALDOT. NCHRP Synthesis
334 reports that most agencies report data in increments ranging from 50 to 1,000 feet, and that
many U.S. agencies use 0.1 mile (NCHRP, 2004.). The 0.01 mile is within the typical range
reported, and values can be aggregated easily if longer reporting increments are desired.
Conditions and Distresses to be Measured
Prior to 2005, ALDOT collected the following highway condition (distress) data types:
Load associated cracking
Longitudinal cracking
Transverse cracking
Block cracking
Patching
Raveling
Bleeding
Rut depth
Shoulder type and condition
Coded remarks about various other parameters
Considering the surveyed priorities of maintenance personnel, benchmarking results and
network-level decisions of the front-office, the research team focused on adapting ALDOT
pavement condition and distress collection processes to be aligned with AASHTO PP 44-01.
AASHTO PP44-01 simplifies crack quantification for asphalt pavements by limiting cracks to
only those found in the wheel paths (load-associated cracks) and all others found outside the
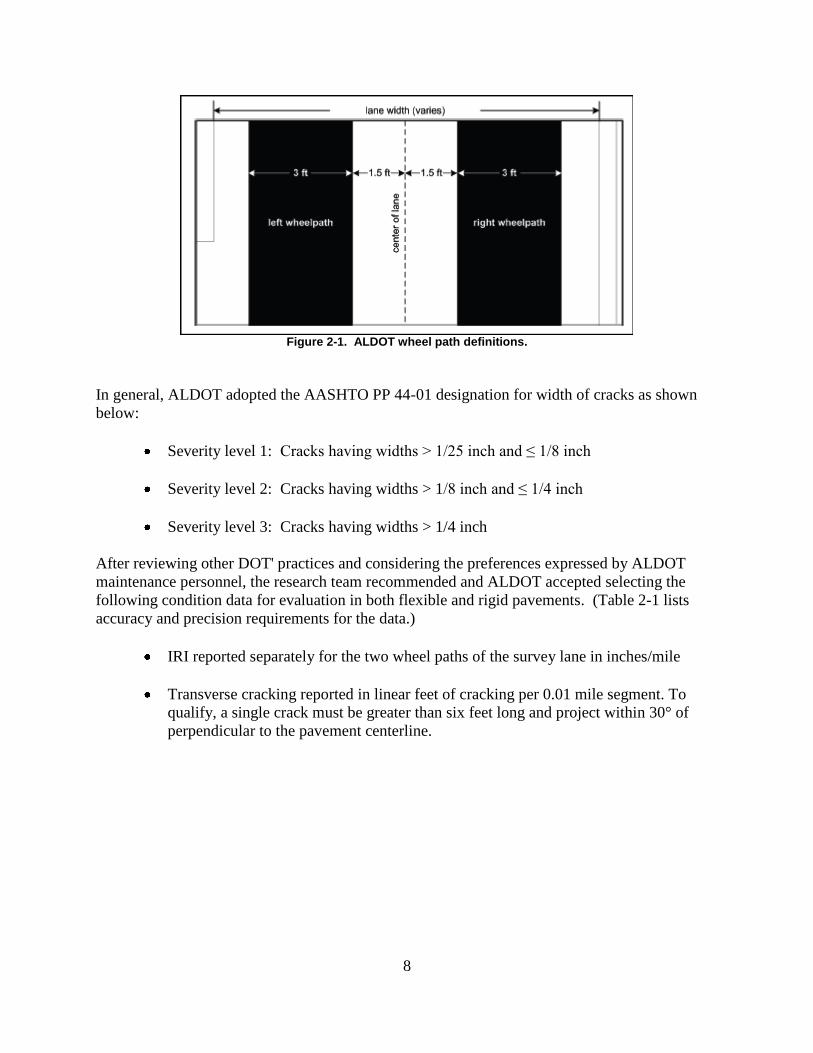
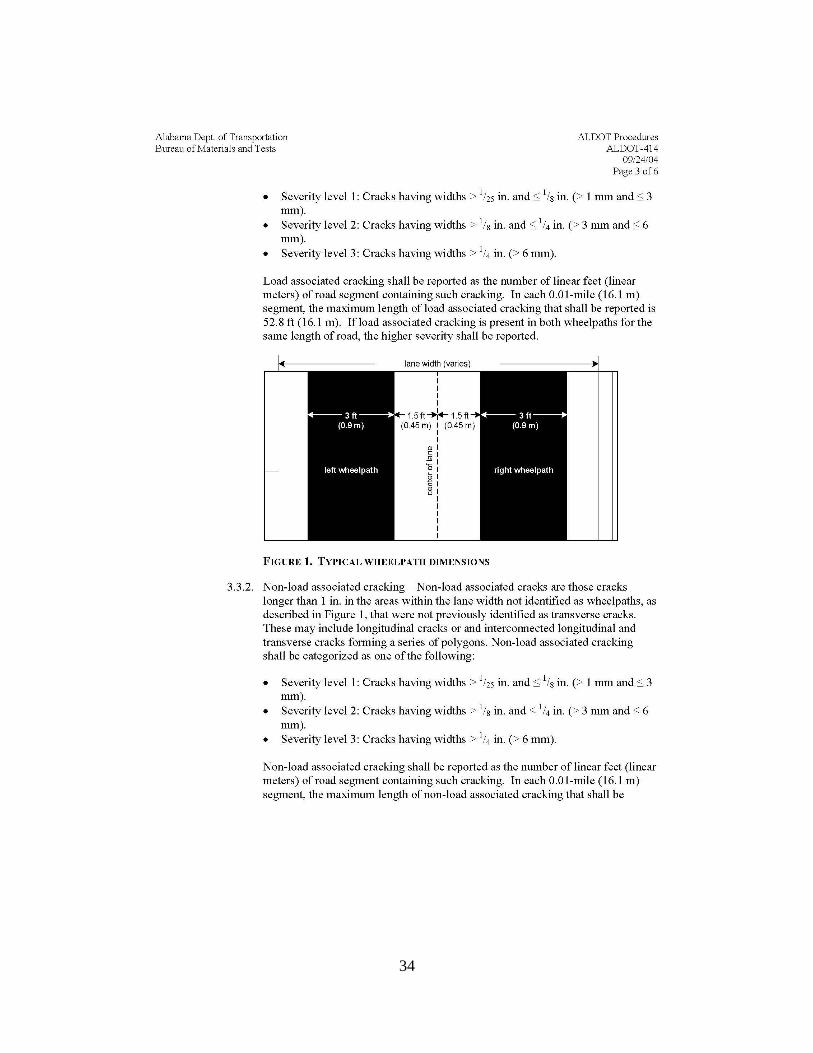
wheel paths (non-load-associated cracks). Figure 2-1 shows ALDOT's adaptation of the
AASHTO P 44-01 diagram defining wheel path and non-wheel path areas.
8
Figure 2-1. ALDOT wheel path definitions.
In general, ALDOT adopted the AASHTO PP 44-01 designation for width of cracks as shown
below:
Severity level 1: Cracks having widths > 1/25 inch and ≤ 1/8 inch
Severity level 2: Cracks having widths > 1/8 inch and ≤ 1/4 inch
Severity level 3: Cracks having widths > 1/4 inch
After reviewing other DOT' practices and considering the preferences expressed by ALDOT
maintenance personnel, the research team recommended and ALDOT accepted selecting the
following condition data for evaluation in both flexible and rigid pavements. (Table 2-1 lists
accuracy and precision requirements for the data.)
IRI reported separately for the two wheel paths of the survey lane in inches/mile
Transverse cracking reported in linear feet of cracking per 0.01 mile segment. To
qualify, a single crack must be greater than six feet long and project within 30° of
perpendicular to the pavement centerline.
9
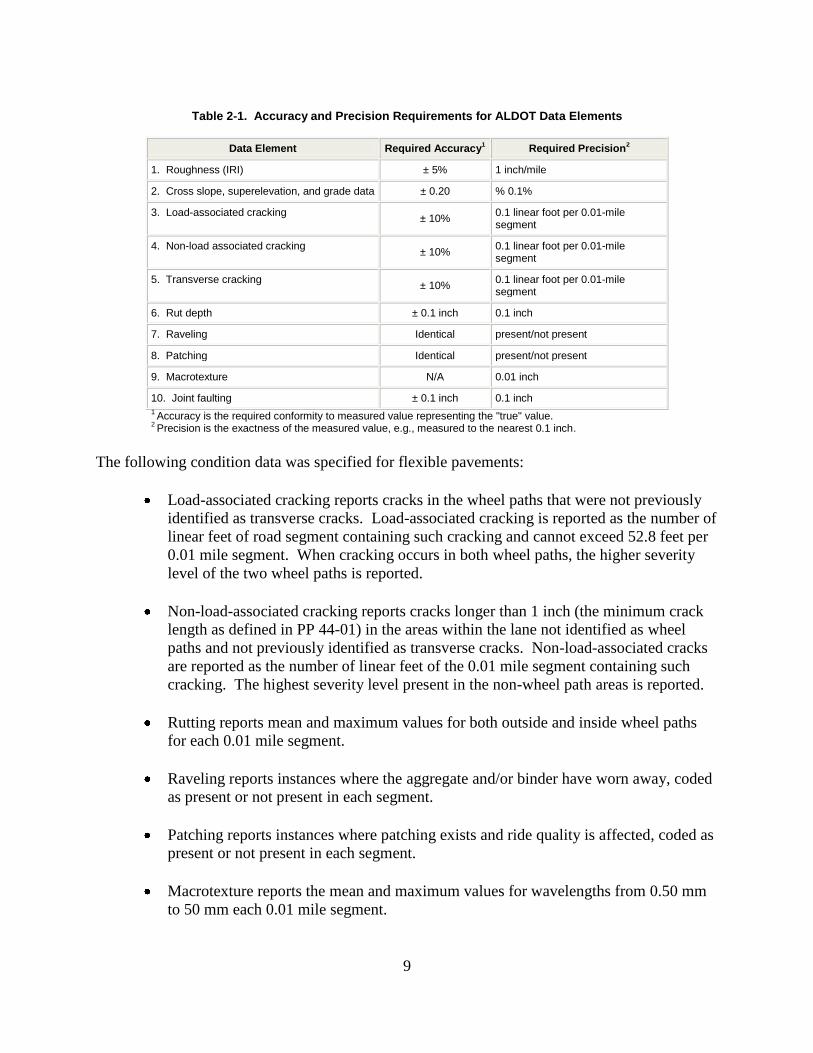
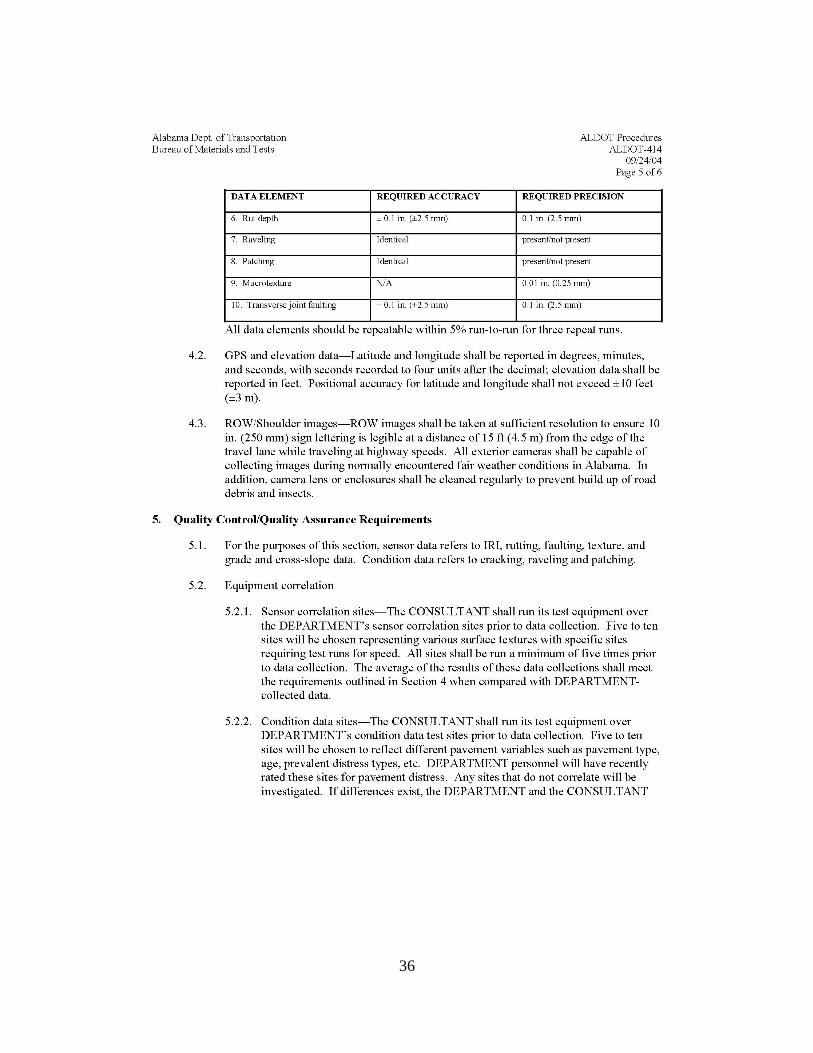
Table 2-1. Accuracy and Precision Requirements for ALDOT Data Elements
Data Element Required Accuracy1
Required Precision2
1. Roughness (IRI) ± 5% 1 inch/mile
2. Cross slope, superelevation, and grade data ± 0.20 % 0.1%
3. Load-associated cracking ± 10%
0.1 linear foot per 0.01-mile segment
4. Non-load associated cracking ± 10%
0.1 linear foot per 0.01-mile segment
5. Transverse cracking ± 10%
0.1 linear foot per 0.01-mile segment
6. Rut depth ± 0.1 inch 0.1 inch
7. Raveling Identical present/not present
8. Patching Identical present/not present
9. Macrotexture N/A 0.01 inch
10. Joint faulting ± 0.1 inch 0.1 inch
1 Accuracy is the required conformity to measured value representing the "true" value.
2 Precision is the exactness of the measured value, e.g., measured to the nearest 0.1 inch.
The following condition data was specified for flexible pavements:
Load-associated cracking reports cracks in the wheel paths that were not previously
identified as transverse cracks. Load-associated cracking is reported as the number of
linear feet of road segment containing such cracking and cannot exceed 52.8 feet per
0.01 mile segment. When cracking occurs in both wheel paths, the higher severity
level of the two wheel paths is reported.
Non-load-associated cracking reports cracks longer than 1 inch (the minimum crack
length as defined in PP 44-01) in the areas within the lane not identified as wheel
paths and not previously identified as transverse cracks. Non-load-associated cracks
are reported as the number of linear feet of the 0.01 mile segment containing such
cracking. The highest severity level present in the non-wheel path areas is reported.
Rutting reports mean and maximum values for both outside and inside wheel paths
for each 0.01 mile segment.
Raveling reports instances where the aggregate and/or binder have worn away, coded
as present or not present in each segment.
Patching reports instances where patching exists and ride quality is affected, coded as
present or not present in each segment.
Macrotexture reports the mean and maximum values for wavelengths from 0.50 mm
to 50 mm each 0.01 mile segment.

10
Though only about 2% of the state’s pavements have concrete surfaces, the following
information was specified for rigid pavements:
Transverse joint faulting reports mean and maximum values for each segment
according to AASHTO R-36(04)
Prior to this study the distress collection procedure measured fatigue cracking by area and
summarized most non-load-associated cracking by adding lengths of individual cracks. The new
procedure measured the proportion of the longitudinal extent of the road that contains fatigue or
non-load associated cracking. The decision to align with the requirements in PP 44-01 as much
as possible motivated this change. The data collection procedures also referenced PP 38-00
(2003) and R-36(04), and FHWA's Highway Performance Monitoring System Field Manual
(FHWA, 2002).
Other Data
During the study, ALDOT and the UA researchers added pavement surface geometry, GPS, and
travel events to the collected data. Specifically included in the collection are the following:
Slope data including cross-slope of the pavement lane (percentage) and longitudinal
grade (percentage). This is another example of sensor data, and accuracy and
precision requirements are shown in Table 2-1.
Global Positioning System (GPS) coordinates including longitude, latitude, elevation,
and dilution of precision measurements. Positional accuracy for latitude and
longitude must not exceed ± 10 feet. Prior to this study, it was noted that ALDOT’s
linear referencing system (LRS) mileposts and the physical location of mileposts
were found to be identifying different locations.
Travel events such as pavement surface changes, railroad crossings, changes in
number of lanes, and transitions from the lane specified for data collection. Event
information is keyed in by personnel in the survey van.
The investigators also recommended that measurements be taken at the beginning of each 0.01
mile segment. In addition to the extra data, digital right of way (ROW) images photographed
with forward-facing cameras are specified for the beginning and midpoint of each segment, such
that 10-inch lettering is visible at a distance of 15 feet from the travel lane. These images are
archived and can be used by central personnel to conduct preliminary inspections of sites without
leaving the office.
With the above information detailed, the ALDOT and University of Alabama project team
collaboratively developed, revised, and gained approval for ALDOT 414-04, Network-Level
Pavement Collection Data Collection Procedure. (See Appendix A.). Project participants

11
believed that this document contained a collection of definitions, methodologies and criteria that
reflected the best of current practices in the U.S.
12
3.0 Project Execution and Statistical Analysis
Project Execution
Once ALDOT 414-04 was adopted, it was used as part of the vendor selection for state-wide
automated pavement condition data collection. The University of Alabama assisted ALDOT
personnel in creating:
the Request for Proposal for Statewide Automated Collection conducted by an Independent
Contractor,
the Vendor Evaluation Process, and
the Contract Language.
These documents are solely the property of ALDOT and may be requested from their offices.
After receiving and evaluating proposals, ALDOT selected a vendor for collection of statewide
data. Prior to initiating full scale production of data, the vendor was required to demonstrate
calibration of its equipment to replicate human gathered distress data at test sites, provide test
data for evaluation by ALDOT (with UA researcher guidance), and provide a workstation and its
unique distress interpretation software for use by ALDOT.
As the project evolved, the state of practice in pavement data collection migrated to higher levels
of technology for both equipment and software. This led to investigations of multiple ways to
interpret video data (human subjective interpretation and machine automated interpretation), the
practices of multiple vendors, the effectiveness of multiple software interpreters, and other
situations. Throughout this process, the ALDOT-UA team attempted to identify appropriate
procedures and criteria to provide quality assurance. As a result the project lasted over four
years, with multiple extensions and variations of scope. The extent of activity may be gleaned
from Table 3-1, which included a sample of the activities that UA researchers provided to
ALDOT to support the network-level pavement condition data collection procedure.
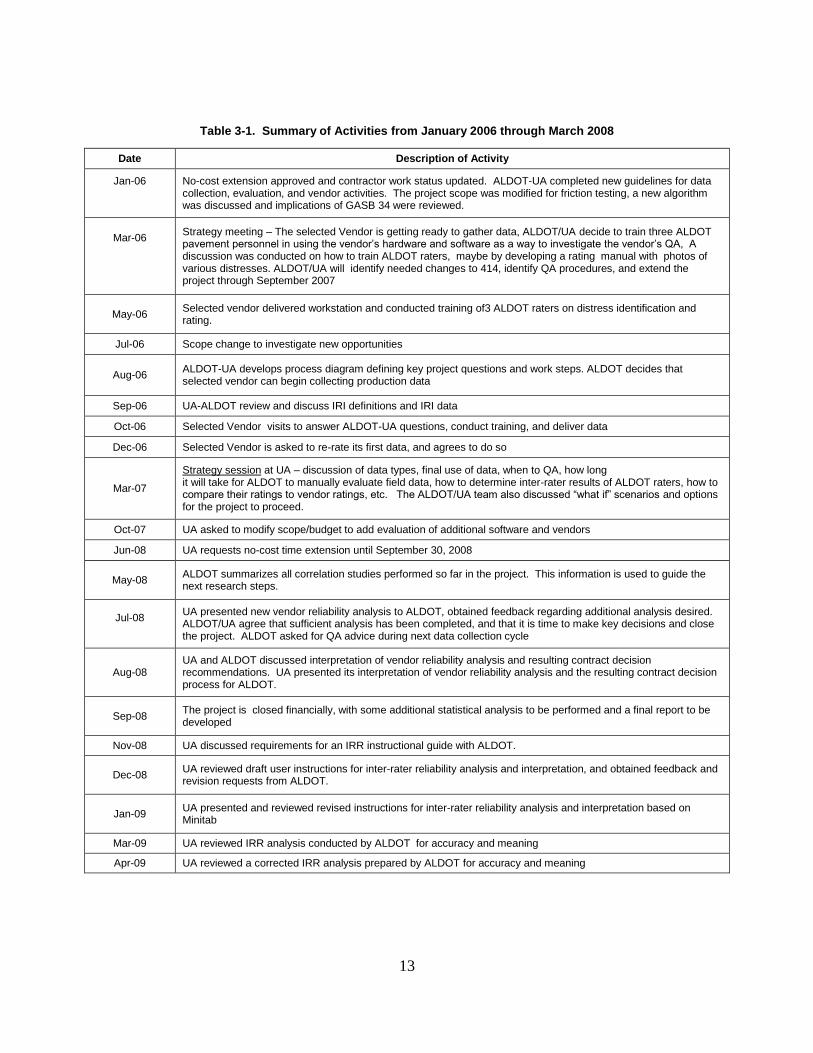
13
Table 3-1. Summary of Activities from January 2006 through March 2008
Date Description of Activity
Jan-06
No-cost extension approved and contractor work status updated. ALDOT-UA completed new guidelines for data collection, evaluation, and vendor activities. The project scope was modified for friction testing, a new algorithm was discussed and implications of GASB 34 were reviewed.
Mar-06
Strategy meeting – The selected Vendor is getting ready to gather data, ALDOT/UA decide to train three ALDOT pavement personnel in using the vendor’s hardware and software as a way to investigate the vendor’s QA, A discussion was conducted on how to train ALDOT raters, maybe by developing a rating manual with photos of various distresses. ALDOT/UA will identify needed changes to 414, identify QA procedures, and extend the project through September 2007
May-06 Selected vendor delivered workstation and conducted training of3 ALDOT raters on distress identification and rating.
Jul-06 Scope change to investigate new opportunities
Aug-06 ALDOT-UA develops process diagram defining key project questions and work steps. ALDOT decides that selected vendor can begin collecting production data
Sep-06 UA-ALDOT review and discuss IRI definitions and IRI data
Oct-06 Selected Vendor visits to answer ALDOT-UA questions, conduct training, and deliver data
Dec-06 Selected Vendor is asked to re-rate its first data, and agrees to do so
Mar-07
Strategy session at UA – discussion of data types, final use of data, when to QA, how long it will take for ALDOT to manually evaluate field data, how to determine inter-rater results of ALDOT raters, how to compare their ratings to vendor ratings, etc. The ALDOT/UA team also discussed ―what if‖ scenarios and options for the project to proceed.
Oct-07 UA asked to modify scope/budget to add evaluation of additional software and vendors
Jun-08 UA requests no-cost time extension until September 30, 2008
May-08 ALDOT summarizes all correlation studies performed so far in the project. This information is used to guide the next research steps.
Jul-08
UA presented new vendor reliability analysis to ALDOT, obtained feedback regarding additional analysis desired. ALDOT/UA agree that sufficient analysis has been completed, and that it is time to make key decisions and close the project. ALDOT asked for QA advice during next data collection cycle
Aug-08 UA and ALDOT discussed interpretation of vendor reliability analysis and resulting contract decision recommendations. UA presented its interpretation of vendor reliability analysis and the resulting contract decision process for ALDOT.
Sep-08 The project is closed financially, with some additional statistical analysis to be performed and a final report to be developed
Nov-08 UA discussed requirements for an IRR instructional guide with ALDOT.
Dec-08 UA reviewed draft user instructions for inter-rater reliability analysis and interpretation, and obtained feedback and revision requests from ALDOT.
Jan-09 UA presented and reviewed revised instructions for inter-rater reliability analysis and interpretation based on Minitab
Mar-09 UA reviewed IRR analysis conducted by ALDOT for accuracy and meaning
Apr-09 UA reviewed a corrected IRR analysis prepared by ALDOT for accuracy and meaning
14
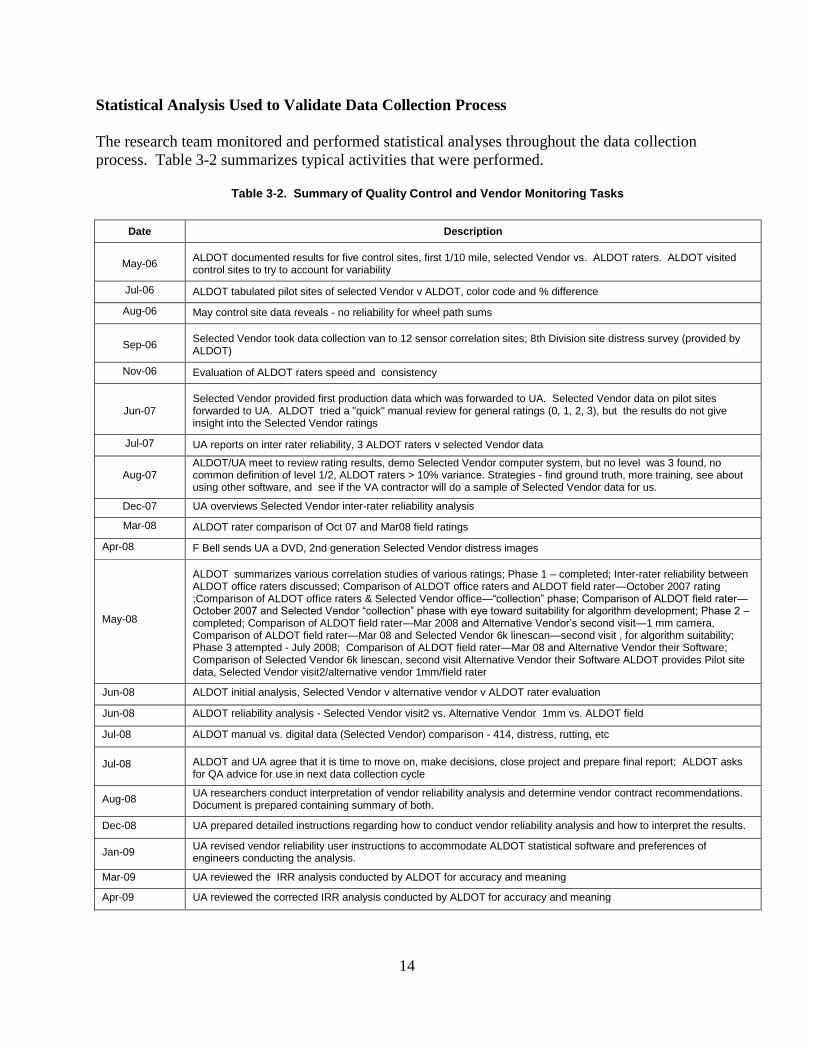
Statistical Analysis Used to Validate Data Collection Process
The research team monitored and performed statistical analyses throughout the data collection
process. Table 3-2 summarizes typical activities that were performed.
Table 3-2. Summary of Quality Control and Vendor Monitoring Tasks
Date Description
May-06 ALDOT documented results for five control sites, first 1/10 mile, selected Vendor vs. ALDOT raters. ALDOT visited control sites to try to account for variability
Jul-06 ALDOT tabulated pilot sites of selected Vendor v ALDOT, color code and % difference
Aug-06 May control site data reveals - no reliability for wheel path sums
Sep-06 Selected Vendor took data collection van to 12 sensor correlation sites; 8th Division site distress survey (provided by ALDOT)
Nov-06 Evaluation of ALDOT raters speed and consistency
Jun-07 Selected Vendor provided first production data which was forwarded to UA. Selected Vendor data on pilot sites forwarded to UA. ALDOT tried a "quick" manual review for general ratings (0, 1, 2, 3), but the results do not give insight into the Selected Vendor ratings
Jul-07 UA reports on inter rater reliability, 3 ALDOT raters v selected Vendor data
Aug-07 ALDOT/UA meet to review rating results, demo Selected Vendor computer system, but no level was 3 found, no common definition of level 1/2, ALDOT raters > 10% variance. Strategies - find ground truth, more training, see about using other software, and see if the VA contractor will do a sample of Selected Vendor data for us.
Dec-07 UA overviews Selected Vendor inter-rater reliability analysis
Mar-08 ALDOT rater comparison of Oct 07 and Mar08 field ratings
Apr-08 F Bell sends UA a DVD, 2nd generation Selected Vendor distress images
May-08
ALDOT summarizes various correlation studies of various ratings; Phase 1 – completed; Inter-rater reliability between ALDOT office raters discussed; Comparison of ALDOT office raters and ALDOT field rater—October 2007 rating ;Comparison of ALDOT office raters & Selected Vendor office—―collection‖ phase; Comparison of ALDOT field rater—October 2007 and Selected Vendor ―collection‖ phase with eye toward suitability for algorithm development; Phase 2 – completed; Comparison of ALDOT field rater—Mar 2008 and Alternative Vendor’s second visit—1 mm camera, Comparison of ALDOT field rater—Mar 08 and Selected Vendor 6k linescan—second visit , for algorithm suitability; Phase 3 attempted - July 2008; Comparison of ALDOT field rater—Mar 08 and Alternative Vendor their Software; Comparison of Selected Vendor 6k linescan, second visit Alternative Vendor their Software ALDOT provides Pilot site data, Selected Vendor visit2/alternative vendor 1mm/field rater
Jun-08 ALDOT initial analysis, Selected Vendor v alternative vendor v ALDOT rater evaluation
Jun-08 ALDOT reliability analysis - Selected Vendor visit2 vs. Alternative Vendor 1mm vs. ALDOT field
Jul-08 ALDOT manual vs. digital data (Selected Vendor) comparison - 414, distress, rutting, etc
Jul-08 ALDOT and UA agree that it is time to move on, make decisions, close project and prepare final report; ALDOT asks for QA advice for use in next data collection cycle
Aug-08 UA researchers conduct interpretation of vendor reliability analysis and determine vendor contract recommendations. Document is prepared containing summary of both.
Dec-08 UA prepared detailed instructions regarding how to conduct vendor reliability analysis and how to interpret the results.
Jan-09 UA revised vendor reliability user instructions to accommodate ALDOT statistical software and preferences of engineers conducting the analysis.
Mar-09 UA reviewed the IRR analysis conducted by ALDOT for accuracy and meaning
Apr-09 UA reviewed the corrected IRR analysis conducted by ALDOT for accuracy and meaning
15
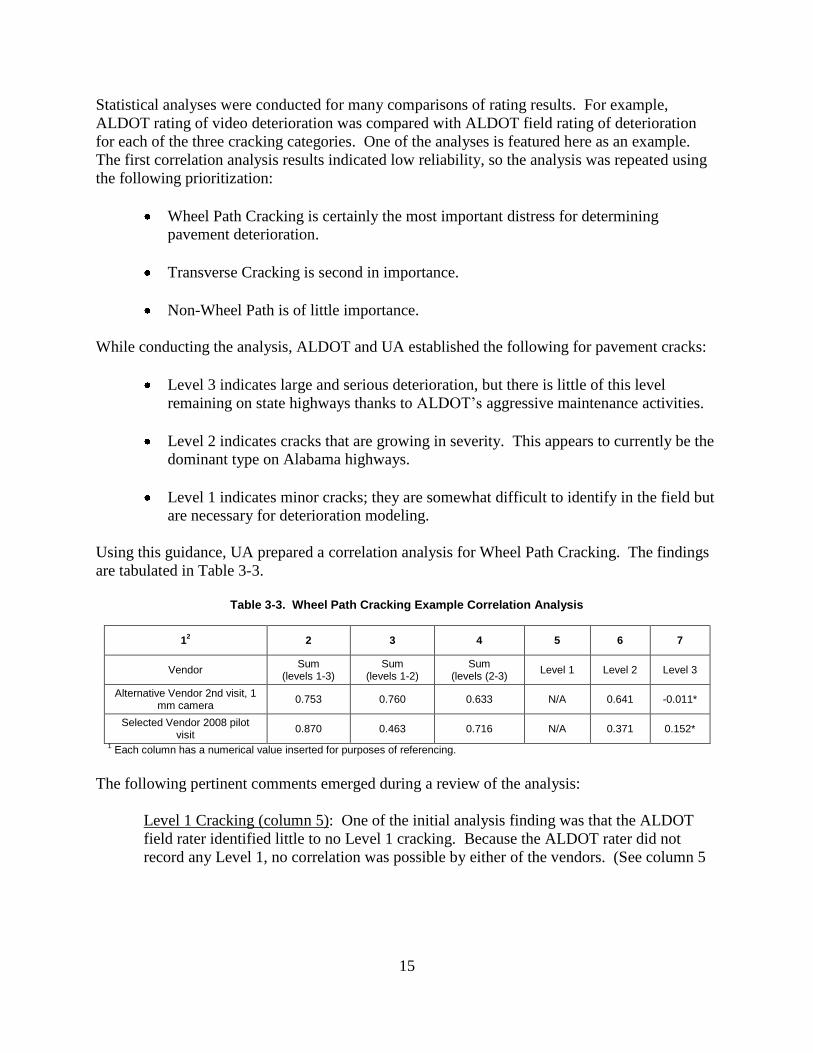
Statistical analyses were conducted for many comparisons of rating results. For example,
ALDOT rating of video deterioration was compared with ALDOT field rating of deterioration
for each of the three cracking categories. One of the analyses is featured here as an example.
The first correlation analysis results indicated low reliability, so the analysis was repeated using
the following prioritization:
Wheel Path Cracking is certainly the most important distress for determining
pavement deterioration.
Transverse Cracking is second in importance.
Non-Wheel Path is of little importance.
While conducting the analysis, ALDOT and UA established the following for pavement cracks:
Level 3 indicates large and serious deterioration, but there is little of this level
remaining on state highways thanks to ALDOT’s aggressive maintenance activities.
Level 2 indicates cracks that are growing in severity. This appears to currently be the
dominant type on Alabama highways.
Level 1 indicates minor cracks; they are somewhat difficult to identify in the field but
are necessary for deterioration modeling.
Using this guidance, UA prepared a correlation analysis for Wheel Path Cracking. The findings
are tabulated in Table 3-3.
Table 3-3. Wheel Path Cracking Example Correlation Analysis
12 2 3 4 5 6 7
Vendor Sum
(levels 1-3) Sum
(levels 1-2) Sum
(levels (2-3) Level 1 Level 2 Level 3
Alternative Vendor 2nd visit, 1 mm camera
0.753 0.760 0.633 N/A 0.641 -0.011*
Selected Vendor 2008 pilot visit
0.870 0.463 0.716 N/A 0.371 0.152*
1 Each column has a numerical value inserted for purposes of referencing.
The following pertinent comments emerged during a review of the analysis:
Level 1 Cracking (column 5): One of the initial analysis finding was that the ALDOT
field rater identified little to no Level 1 cracking. Because the ALDOT rater did not
record any Level 1, no correlation was possible by either of the vendors. (See column 5
16
of the table above.) The UA research team points out that the absence of Level 1
cracking will limit the ability to model and predict crack growth (deterioration modeling).
Level 2 Cracking (column 6): Both vendors recorded Level 2 cracking, and the
Alternative Vendor provided the best correlation with the ALDOT rater by a substantial
amount. Level 2 cracking in the Wheel Path is the most important cracking location and
the most prevalent level of cracking on Alabama highways.
Level 3 Cracking (column 7): The prevalence of zero ratings in the Level 3 observations
clouds the analysis and interpretation. However, using the column 7 correlation scores
and data in columns 1 through 3, it is clear that the Alternative Vendor detected Level 1
cracking that neither the ALDOT rater nor the Selected Vendor saw, and that the Selected
Vendor detected some minor amount of Level 3 cracking that neither the ALDOT rater
nor the Alternative Vendor saw. That is, the 1 mm camera of the Alternative Vendor
appeared to distinguish more clearly between Level 1 and Level 2, and drove the overall
Alternative Vendor rating toward smaller cracks. The opposite appeared to occur with
the Selected Vendor, which identified more Level 3 cracks than either ALDOT or the
Alternative Vendor and drove its average rating toward larger cracks.
Sum of Levels 1-3 (column 1): The Selected Vendor had the better correlation with the
ALDOT rater, which is expected since the Alternative Vendor detected Level 1 cracking
that was not observed by ALDOT.
Sum Levels 1-2 (column 2): The Alternative Vendor had a substantially better
correlation in this category. This indicates that the Level 1 + Level 2 cracking observed
by the Alternative Vendor correlated well with the Level 2 observed by the ALDOT rater
(i.e., the ALDOT rater did not see Level 1). In other words, the two raters seemed to see
the same cracking patter, but Alternative Vendor’s 1 mm camera was able to better
distinguish the difference between Level 1 and Level 2.
The Selected Vendor had a much weaker correlation for Levels 1+2. But when Level 3 was
added to the mix (i.e., column 1), the correlation was much stronger. In other words, Selected
Vendor appears to have identified less Level 2 but more Level 3 than ALDOT, so that the sum of
1-3 gave a good correlation, while the correlation of the individual levels did not.
Sum Levels 2-3 (column 3): When Levels 2 and 3 are summed, the Selected Vendor had
the highest correlation. Since neither the Selected Vendor nor the ALDOT rater observed
Level 1 cracking, it is expected that the Selected Vendor would have the highest
correlation for Levels 2-3.
A summary of the statistical processes used in the study are presented in Appendix C.
17
4.0 Recommendations Future Data Collection Process
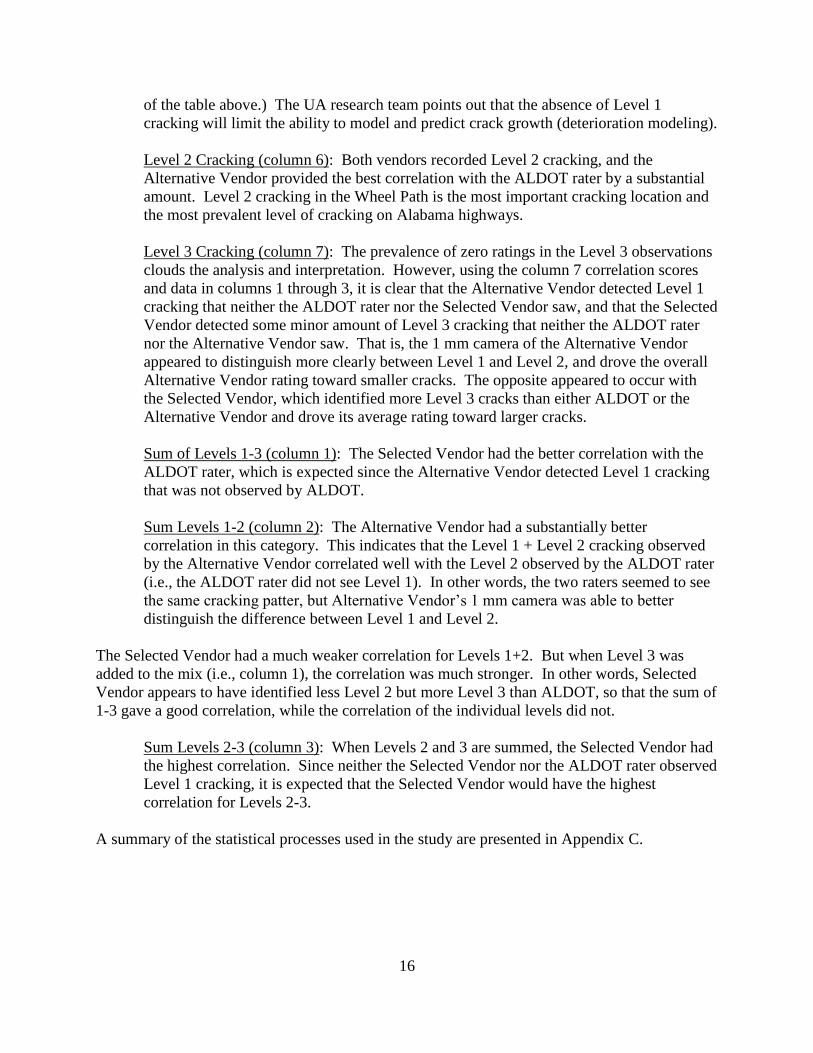
The pavement condition data collection process recommended in this project consists of three
phases. The process begins with sensor correlation and condition data site inspection to establish
ground truth. The ground truth data will be used throughout the pavement data process to assure
quality. The next process phase collects pavement data that will be interpreted in the last process
phase. The process phases are shown in Figure 4-1.
Phase 1: Establish Ground
Truth
Phase 2: Pavement Data
Collection
Phase 3: Pavement Data
Interpretation
Figure 4-1. Process phases.
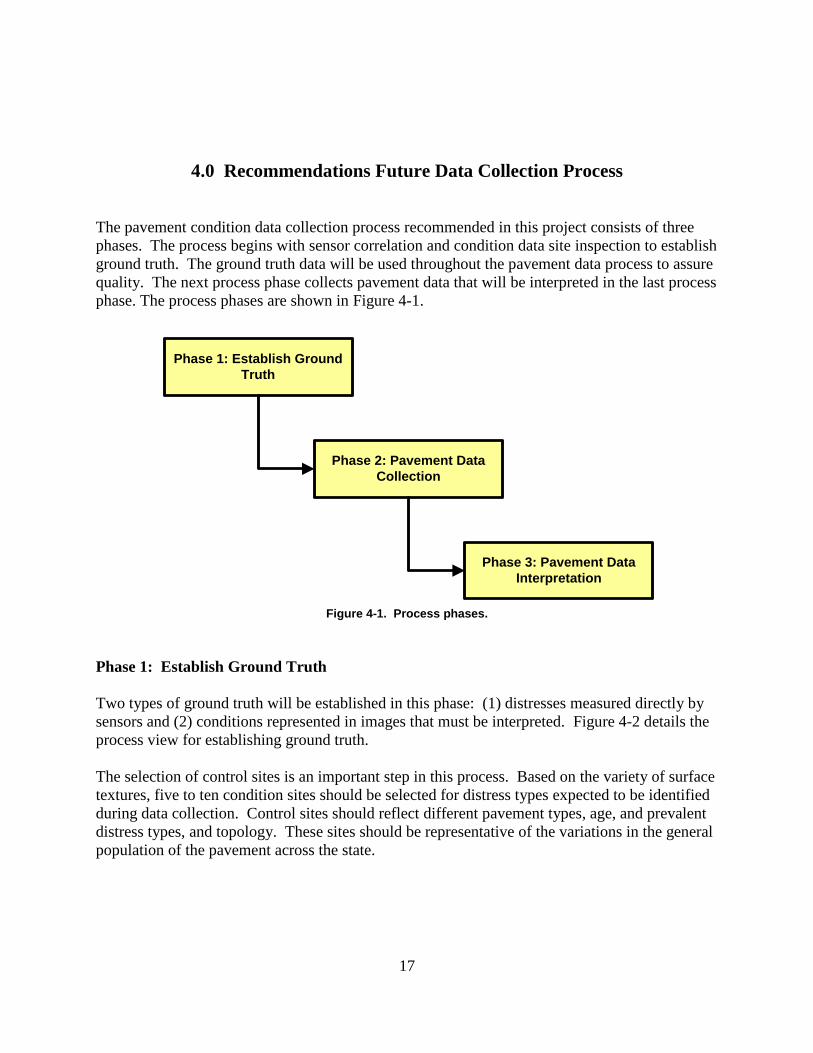
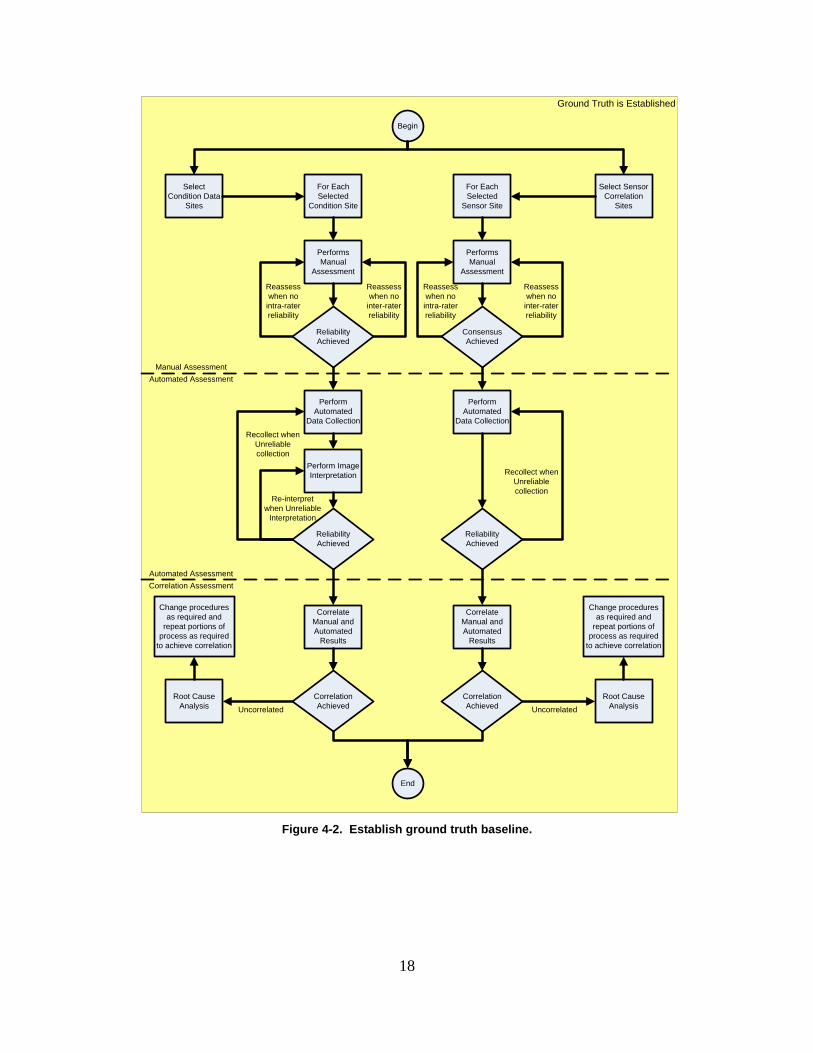
Phase 1: Establish Ground Truth
Two types of ground truth will be established in this phase: (1) distresses measured directly by
sensors and (2) conditions represented in images that must be interpreted. Figure 4-2 details the
process view for establishing ground truth.
The selection of control sites is an important step in this process. Based on the variety of surface
textures, five to ten condition sites should be selected for distress types expected to be identified
during data collection. Control sites should reflect different pavement types, age, and prevalent
distress types, and topology. These sites should be representative of the variations in the general
population of the pavement across the state.
18
Ground Truth is Established
Begin
End
Select Sensor
Correlation
Sites
Select
Condition Data
Sites
Performs
Manual
Assessment
For Each
Selected
Condition Site
Reliability
Achieved
Perform
Automated
Data Collection
Reliability
Achieved
Performs
Manual
Assessment
For Each
Selected
Sensor Site
Consensus
Achieved
Perform
Automated
Data Collection
Reliability
Achieved
Perform Image
Interpretation
Correlate
Manual and
Automated
Results
Correlation
Achieved
Correlation
Achieved
Correlate
Manual and
Automated
Results
Reassess
when no
inter-rater
reliability
Recollect when
Unreliable
collection
Re-interpret
when Unreliable
Interpretation
Uncorrelated
Recollect when
Unreliable
collection
Uncorrelated
Reassess
when no
intra-rater
reliability
Reassess
when no
inter-rater
reliability
Reassess
when no
intra-rater
reliability
Root Cause
Analysis
Root Cause
Analysis
Change procedures
as required and
repeat portions of
process as required
to achieve correlation
Change procedures
as required and
repeat portions of
process as required
to achieve correlation
Manual Assessment
Automated Assessment
Automated Assessment
Correlation Assessment
Figure 4-2. Establish ground truth baseline.
19
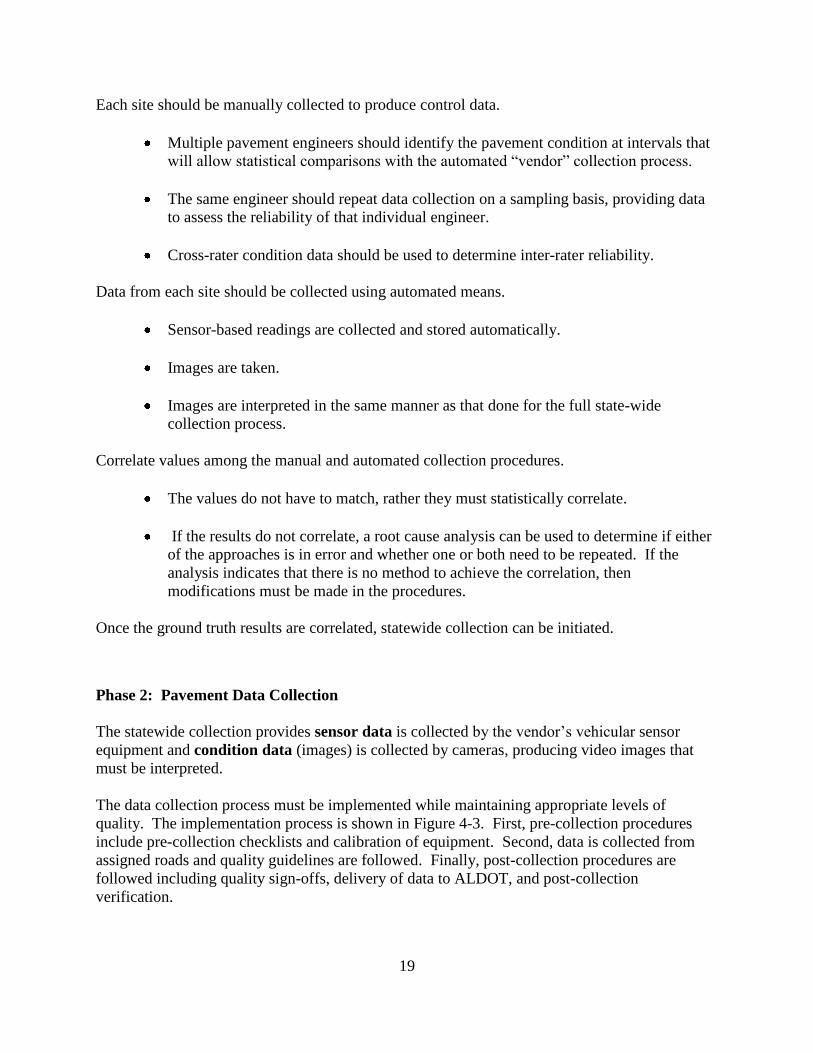
Each site should be manually collected to produce control data.
Multiple pavement engineers should identify the pavement condition at intervals that
will allow statistical comparisons with the automated “vendor” collection process.
The same engineer should repeat data collection on a sampling basis, providing data
to assess the reliability of that individual engineer.
Cross-rater condition data should be used to determine inter-rater reliability.
Data from each site should be collected using automated means.
Sensor-based readings are collected and stored automatically.
Images are taken.
Images are interpreted in the same manner as that done for the full state-wide
collection process.
Correlate values among the manual and automated collection procedures.
The values do not have to match, rather they must statistically correlate.
If the results do not correlate, a root cause analysis can be used to determine if either
of the approaches is in error and whether one or both need to be repeated. If the
analysis indicates that there is no method to achieve the correlation, then
modifications must be made in the procedures.
Once the ground truth results are correlated, statewide collection can be initiated.
Phase 2: Pavement Data Collection
The statewide collection provides sensor data is collected by the vendor’s vehicular sensor
equipment and condition data (images) is collected by cameras, producing video images that
must be interpreted.
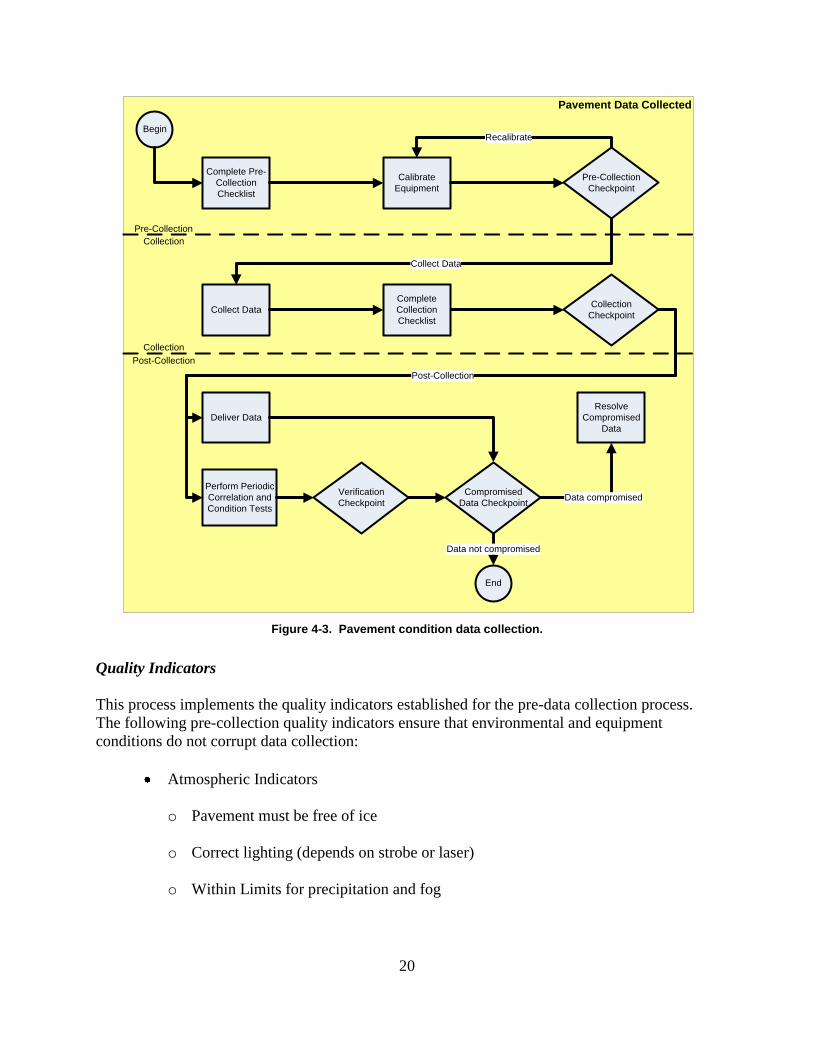
The data collection process must be implemented while maintaining appropriate levels of
quality. The implementation process is shown in Figure 4-3. First, pre-collection procedures
include pre-collection checklists and calibration of equipment. Second, data is collected from
assigned roads and quality guidelines are followed. Finally, post-collection procedures are
followed including quality sign-offs, delivery of data to ALDOT, and post-collection
verification.
20
Pavement Data Collected
Begin
Calibrate
Equipment
Collect Data
Deliver Data
End
Pre-Collection
Checkpoint
Collection
Checkpoint
Collect Data
Data not compromised
Recalibrate
Complete Pre-
Collection
Checklist
Complete
Collection
Checklist
Pre-Collection
Collection
Post-Collection
Collection
Perform Periodic
Correlation and
Condition Tests
Post-Collection
Verification
Checkpoint
Resolve
Compromised
Data
Compromised
Data CheckpointData compromised
Figure 4-3. Pavement condition data collection.
Quality Indicators
This process implements the quality indicators established for the pre-data collection process.
The following pre-collection quality indicators ensure that environmental and equipment
conditions do not corrupt data collection:
Atmospheric Indicators
o Pavement must be free of ice
o Correct lighting (depends on strobe or laser)
o Within Limits for precipitation and fog
21
Camera Indicators
o Road images must be taken at sufficient resolution to ensure 10-inch sign lettering
is legible at a distance of 15 feet from the edge of the travel lane while traveling at
highway speeds.
o All exterior cameras must be capable of collecting images during normally
encountered fair weather conditions in Alabama.
o Camera lenses must be checked prior to every pavement segment.
o Camera lenses must be cleaned if necessary.
Calibration Indicators as specified in ALDOT 414-04: Network-Level Pavement
Condition Data Collection Procedure – Section 4: Quality Control/Quality Assurance
Requirements.
o Sensor Calibration
Vendor data collection vehicles must be tested on all sensor correlation sites a
minimum of five times prior to data collection. The average of these tests
must meet the data quality requirements specified in ALDOT 414-04:
Network-Level Pavement Condition Data Collection Procedure – Section 4:
Data Quality Requirements.
o Condition Calibration
Vendor data collection vehicles must be tested on all condition data sites prior
to data collection. These tests must achieve the same result as ALDOT results.
Any differences will be investigated and resolved prior to data collection.
Multiple Vehicle Indicator
o If multiple data collection vehicles are used, all must be calibrated.
o If multiple data collection vehicles are used, the variance reported in sensor
calibration between trucks must be less than or equal to 5%.
This process implements the quality indicators established for the data collection process. The
collection quality indicators include all information required, in sufficient accuracy and precision
to permit descriptions of distresses and other items as described in ALDOT 414-04: Network-
Level Pavement Condition Data Collection Procedure. The accuracy and precision of collected
data must be sufficient to meet the data quality requirements specified in ALDOT 414-04:
Network-Level Pavement Condition Data Collection Procedure – Section 4: Data Quality
22
Requirements, any roads that are obscured by debris are flagged during the collection of data
using the data collection checklist.
This process implements the quality indicators established for post-collection verification. The
post-collection verification includes a weekly verification and a monthly correlation as described
in ALDOT 414-04: Network-Level Pavement Condition Data Collection Procedure – Section
5.3: Production. If these verifications exceed the previously described quality requirements,
then data collected since last successful verification will be considered compromised.
Compromised data may be refused by ALDOT.
Checkpoints
The pre-collection checkpoint includes completion and signoff of checklists for each
of the pre-collection quality indicators (i.e., atmospheric, lighting, camera, and
calibration). The collection checkpoint assures that all required checklists have been
completed and signed off prior to delivery of data to ALDOT. Post-collection
verification checklists assure collected data is not compromised. All checklists must
be signed and delivered to ALDOT.
Periodically the vendor is to re-run control test areas (as in phase 1) to ensure the
process is still in control.
Roles
The operator of the data collection vehicle must perform the data collection.
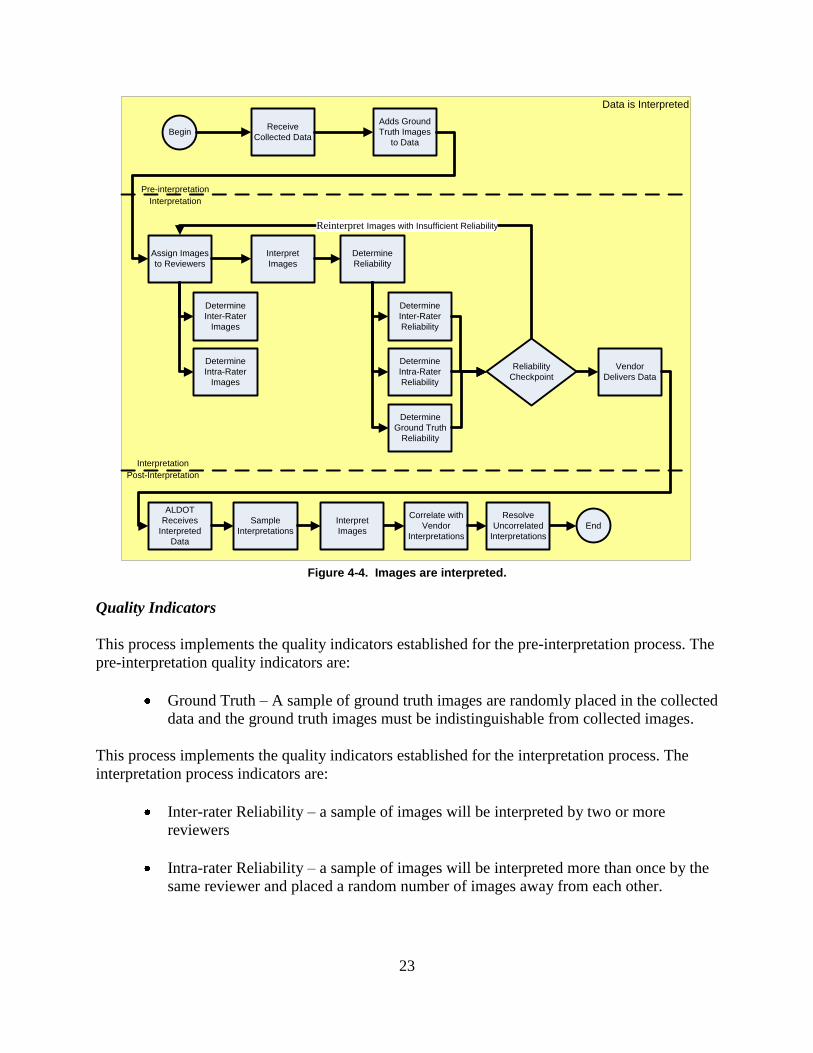
Phase 3: Image Interpretation
In this phase, a vendor interprets the images taken during the data collection process. Using the
criteria in ALDOT 414-04 the images are translated to numeric values and severity levels. To
verify that the interpretation process has integrity, the results are verified through test of inter-
rater and intra-rater reliability. (Appendix B provides the statistical processes.) The interpreted
images and numeric values are sent to ALDOT where random samples will be interpreted and
the ALDOT results will be correlated to the vendor interpretation for a second level of quality
control. The process is shown in Figure 4-4.
23
Data is Interpreted
Begin
End
Receive
Collected Data
Determine
Inter-Rater
Images
Determine
Intra-Rater
Images
Adds Ground
Truth Images
to Data
Assign Images
to Reviewers
Interpret
Images
Determine
Reliability
Determine
Inter-Rater
Reliability
Determine
Intra-Rater
Reliability
Reinterpret Images with Insufficient Reliability
Reliability
Checkpoint
Vendor
Delivers Data
ALDOT
Receives
Interpreted
Data
Sample
Interpretations
Correlate with
Vendor
Interpretations
Resolve
Uncorrelated
Interpretations
Pre-interpretation
Interpretation
Interpretation
Post-Interpretation
Determine
Ground Truth
Reliability
Interpret
Images
Figure 4-4. Images are interpreted.
Quality Indicators
This process implements the quality indicators established for the pre-interpretation process. The
pre-interpretation quality indicators are:
Ground Truth – A sample of ground truth images are randomly placed in the collected
data and the ground truth images must be indistinguishable from collected images.
This process implements the quality indicators established for the interpretation process. The
interpretation process indicators are:
Inter-rater Reliability – a sample of images will be interpreted by two or more
reviewers
Intra-rater Reliability – a sample of images will be interpreted more than once by the
same reviewer and placed a random number of images away from each other.
24
This process implements the quality indicators established to determine interpretation reliability.
The quality indicators are:
Inter-rater Reliability verified
Intra-rater Reliability verified
Ground Truth Reliability
In the post-interpretation process, ALDOT will sample images in the data returned to ALDOT
and perform interpretations that will be compared to the vendor performed interpretations should
the interpretations not correlate then the issues must be resolved.
Checkpoints
The pre-interpretation quality indicators are verified using a checklist. The interpretation quality
indicators are verified using a checklist and any reliability issues require the images in question
to be reinterpreted. Documentation must be provided describing reinterpreted images and
resolution of interpretation issue. All reinterpretation of images must be reported on the
reliability checklist. The post-interpretation quality indicators are verified using a checklist and
any reliability issues must be resolved prior to acceptance of interpretation data.
Roles
Vendor performs the pre-interpretation process and the interpretation process, including
determination quality indicators and signoff of checklists. Vendor will deliver checklists and
interpretation data to ALDOT. ALDOT QA employees perform the post-interpretation process.
25
5.0 General Observations and Recommendations
This study concentrated on planning for data collection, monitoring the execution of data
collection and providing statistical procedures to evaluate the collection and interpretation
process for network-level pavement condition data. The primary deliverables for this project are:
The ALDOT 414-04 Network-Level Pavement Condition Data Collection Procedure
Assistance in developing the Request for Proposal Statewide Vendor Data Collection
Quality Control Algorithms/Work Steps evaluating Raters Interpretation of
Automated Captured Pavement Images
Baseline Quality Assurance Program Work Steps for future Pavement Condition
Collection Projects.
This study was conducted to assess the existing pavement condition collection procedures and
recommend changes for collection, analysis and quality control of pavement data, to enhance the
comprehensive pavement management system of ALDOT. The project has enabled UA
researchers to make several observations and recommendations as a result of the investigation of
vendor capabilities.
Observations
A complete understanding of the planned use of the data should drive requirements
for the precision and accuracy of the data collection. For example
o Using the data to estimate system wide conditions is the basic use of the data and
requires consistency;
o Whereas using the data to determine budgetary allocation among divisions
requires a base level of data accuracy and precision;
o Whereas using the data to determine which pavement sections need maintenance,
rehabilitation or replacement requires a higher level (or levels) of accuracy and
precision; and
26
o Whereas using the data to determine the rate of deterioration of a section of
pavement to predict the occurrence of future distresses requires a fourth level of
accuracy and precision.
Rating of deterioration is a subjective process.
o Human beings can be trained to distinguish various types and levels of distress.
Some of ALDOT's best pavement raters did a good job of manual rating, but even
they could not consistently make fine distinctions between crack sizes and levels
of deterioration.
o Fatigue and other factors impact the consistency of these distinctions at lower
levels of detail and finer levels of distinction.
o Processes for quality assurance and quality control offer hope for moving
automated ratings toward higher accuracy and precision, but are often limited by
the procedures used for the human interpretation of data
Technology has significantly improved over the course of the project.
o The project investigated technology of multiple vendors and found camera,
lighting, and other key components to vary; however, all vendors appeared to be
continuously looking to further enhance their technology.
o Camera and interpretation software technology has improved considerably.
Camera and software technology is not yet sufficient to accurately distinguish
various types of distress without human intervention.
o For example, it is difficult to rate a crack that has been sealed with liquid asphalt
without human intervention.
o Continuing improvement in technology may allow hope of fully automated
distress ratings in the future.
Currently, it does not appear possible to accurately identify and provide deterioration
ratings for individual narrow pavement cracks (ALDOT Level 1).
ALDOT 414-04 provided a standard procedure to collect and interpret pavement
condition; without such a standard it was not possible to know whether the data
collection was or was not in control.
Consistent capture and integration of level 1 crack severity (i.e., 1/25” to 1/8”) as
defined in ALDOT 414-04 is beyond the current state-of-practice.

27
Recommendations
Define the explicit uses pavement condition and distress data in terms of system-wide
ratings, budget allocation, segment maintenance selection, and forecasting.
Refine ALDOT 414-04 to define collection so that the processes used to ensure
accuracy and precision of the data can be aligned with the purpose.
Invest as necessary to achieve high levels of quality with regard to ground truth.
o All data collection and interpretation quality determinations are dependent upon
the ability to compare results to ground truth.
o Use ground truth to test abilities of vendors prior to contracting and periodically
to maintain quality.
o Use ground truth and vendor testing to establish the boundaries of data accuracy
and precision achievable given human and technological limitations and then
adjust procedures, algorithms, and decision approaches accordingly
Require data collection and interpretation vendors to utilize the process described in
Error! Reference source not found. section of this document and periodically audit
vendor compliance with the process.
Collection of data for one lane in both directions on multi-lane highways and only
one lane in the "primary" direction (north or east) for smaller facilities should be
adopted as the standard to significantly reduce data collection costs.
Prior to the next full pavement condition data collection cycle, advances in image
collection and interpretation technologies should be benchmarked to determine state-
of-the-practice for data accuracy and precision. These practices should be
incorporated as revisions to ALDOT 414-04. This benchmarking includes:
o AASHTO and FHWA research and standards
o Processes used by other state department of transportations
o Practices offered by potential collection and interpretation vendors
As part of the quality control process for image interpretation, inter-rater reliability
(also referred to as inter-rater agreement or concordance) should be determined. This
statistic provides a score of how much consensus there is in the ratings given by
multiple raters. It is useful in refining the tools given to raters, for example by
determining if a particular measurement method is appropriate for measuring a
particular variable. If raters do not agree, either:
28
o the measurement method is defective or
o the raters need to be re-trained.
Several statistics can be used to determine inter-rater reliability. Different statistics
are appropriate for different types of measurement. Here, we recommend the use of:
o Pearson’s correlation coefficient (r), the most straightforward measure , useful
when only two raters are to be compared (for example, a vendor compared to an
ALDOT rater considered to provide ground truth)
o Intra-class correlation (ICC – absolute agreements), to be used when more than
two raters are to be compared or when it is important to detect consistent
differences between raters.
We recommend ALDOT procure a statistical package that will calculate inter-rater
reliability such as the package used in Appendix B, Statistical Procedures Using
Minitab.
In conclusion, this project has established baseline processes for automated asphalt pavement
condition and distress data collection. In addition to creating a collection procedure aligned with
AASHTO pp-44, this project created quality assurance and statistical procedures to evaluate the
collection of pavement condition and distresses. The major obstacle inhibiting data collection at
the 1/25th
inch to 1/8th
inch level of severity is technological. That is, statistical tests of data
from field data did not support the ability to consistently capture and interpret images at this
level of resolution. Measurement errors were found to be introduced throughout the process and
including obtaining ground truth, image maximum resolution and image interpretation by the
raters.
This project initially included the creation of a new PCR algorithm; however, the current
reliability of the point estimation values of the interpreted data precluded the development of a
new pavement condition index. A future project to define and validate a new PCR algorithm is
recommended.
29
6.0 Acknowledgements
THIS REPORT WAS PREPARED WITH COOPERATION
AND ASSISTANCE OF REPRESENTATIVES OF THE FOLLOWING
AGENCIES AND ORGANIZATIONS:
Alabama Department of Transportation; Federal Highway Administration-Alabama Division;
American Association of State Highway and Transportation Officials; and
The University of Alabama’s Information Technology Innovation Center,
Department of Civil, Construction, and Environmental Engineering, and
Area of Management Information Systems
The project associated with this report was funded wholly or in part by the Aging Infrastructure Systems Center of Excellence
(AISCE), and the University Transportation Center for Alabama (UTCA). The contents of this project report reflect the views of
the authors, who are responsible for the facts and the accuracy of the information presented herein. This document is
disseminated under the sponsorship of the U.S. Department of Transportation, University Transportation Centers Program, in
the interest of information exchange. The U.S. Government, AISCE, UTCA, and the three universities comprising UTCA assume
no liability for the contents or use thereof.
30
7.0 References
American Association of State Highway and Transportation Officials. Standard Specifications
for Transportation Materials and Methods of Sampling and Testing, 24th Edition.
Washington, D.C., 2004a.
American Association of State Highway and Transportation Officials. AASHTO Provisional
Standards. Washington, D.C., 2004b.
Cheng, H. D., and C. Glazier. Automated Real-Time Pavement Crack Deflection/Classification
System. NCHRP-IDEA Program Project Final Report. Washington, D.C.: Transportation
Research Board, 2002.
Federal Highway Administration. Distress Identification Manual for the Long-Term Pavement
Performance Program (Fourth Revised Edition). FHWA-RD-03-031. McLean, VA, 2003.
Federal Highway Administration. Highway Performance Monitoring System Field Manual.
OMB No. 21250028. Washington, D.C., 2002.
Groeger, J. L., Stephanos, P., Dorsey, P., and M. Chapman. Implementation of Automated
Network-Level Crack Detection Processes in Maryland. Transportation Research Record
1860. Washington, D.C.: Transportation Research Board (2003): 109-116.
Gunratne, M., Mraz, A., and I. Sokolic. Study of the Feasibility of Video-Logging with Pavement
Condition Evaluation. CEE/FDOT/168-LO. Tampa, FL: CEE Department, University of
South Florida, 2003.
Lee, B. J., and H. D. Lee. Position-Invariant Neural Network for Digital Pavement Crack
Analysis. Computer-Aided Civil and Infrastructure Engineering Vol. 19, Issue 2. Malden,
MA (March 2004): 105-118.
Lindly, J. K., Bell, F., and Ullah, S. Specifying Automated Pavement Condition Surveys.
Journal of the Transportation Research Forum Vol. 44, Issue 3 (Fall 2005): 19-32.
National Cooperative Highway Research Program. NCHRP Synthesis 334 Automated Pavement
Distress Collection Techniques. Washington, D.C.: Transportation Research Board, 2004.
31
Raman, M., Hossain, M., Miller, R. W., Cumberledge, G., Lee, H., and K. Kang. Assessment of
Image-Based Data Collection and the AASHTO Provisional Standard for Cracking on
Asphalt-Surfaced Pavements. Transportation Research Record 1889. Washington, D.C.:
Transportation Research Board (2004): 116-125.
Sokolic, I., Gunaratne, M., Mraz, A., and A. Nazef. Evaluation of Pavement Distress Imaging
Systems. Presented at the 83d Annual Meeting of the Transportation Research Board.
Washington, D.C.: Transportation Research Board, 2004.
Stoffels, S.M., Ganesan, V. P., Morian, D. A., and C. E. Antle. Quality Assurance Procedures
for Videologging and Pavement Condition Data Collection. FHWA-PA-2002-009-97-04.
Washington, D.C.: Federal Highway Administration, 2003.
Timm, D. H., and J. M. McQueen. A Study of Manual vs. Automated Pavement Condition
Surveys. IR-04-01. Auburn, AL: Highway Research Center, Auburn University, 2004.
32
Appendix A: ALDOT 414-04 Network-Level Pavement Condition Data
Collection Procedure
33
34
35
36
37
38
Appendix B: Statistical Procedures Using Minitab
Importing Data into Minitab
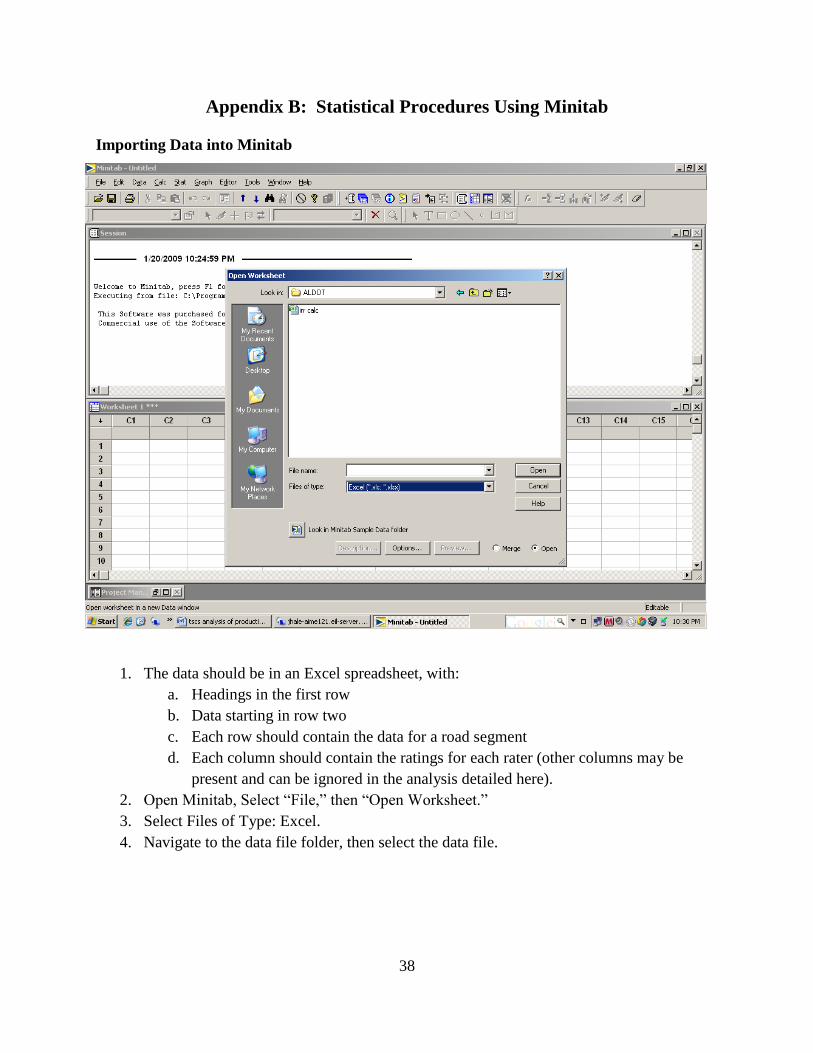
1. The data should be in an Excel spreadsheet, with:
a. Headings in the first row
b. Data starting in row two
c. Each row should contain the data for a road segment
d. Each column should contain the ratings for each rater (other columns may be
present and can be ignored in the analysis detailed here).
2. Open Minitab, Select “File,” then “Open Worksheet.”
3. Select Files of Type: Excel.
4. Navigate to the data file folder, then select the data file.
39
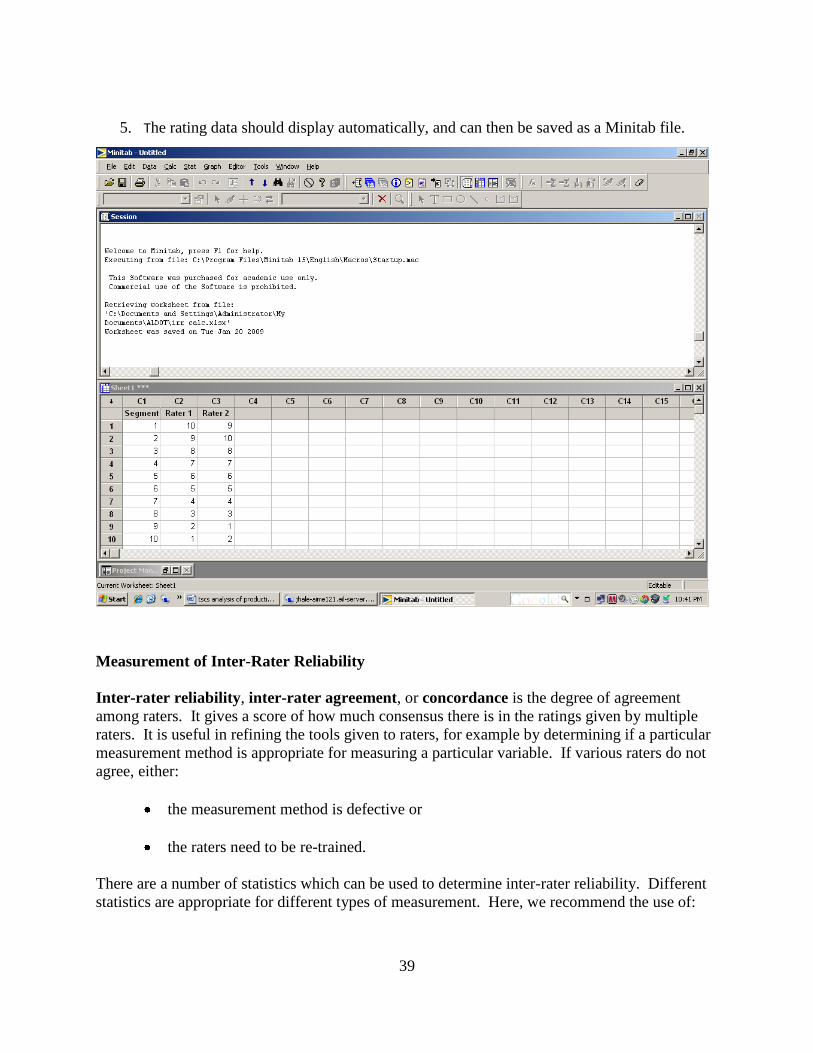
5. The rating data should display automatically, and can then be saved as a Minitab file.
Measurement of Inter-Rater Reliability
Inter-rater reliability, inter-rater agreement, or concordance is the degree of agreement
among raters. It gives a score of how much consensus there is in the ratings given by multiple
raters. It is useful in refining the tools given to raters, for example by determining if a particular
measurement method is appropriate for measuring a particular variable. If various raters do not
agree, either:
the measurement method is defective or
the raters need to be re-trained.
There are a number of statistics which can be used to determine inter-rater reliability. Different
statistics are appropriate for different types of measurement. Here, we recommend the use of:
40
Pearson’s correlation coefficient (r), the most straightforward measure , useful when
only two raters are to be compared (for example, a vendor compared to an ALDOT
rater considered to provide ground truth)
Intraclass correlation (ICC – absolute agreements), to be used when more than two
raters are to be compared or when consistent differences between raters is important
to detect.
Because Pearson’s r will be used most frequently in evaluating the performance of a vendor, we
start with it.
Pearson’s Correlation Coefficient
In probability theory and statistics, correlation (often measured as a correlation coefficient)
indicates the strength and direction of a linear relationship between two random variables. In
general statistical usage, correlation or co-relation refers to the departure of two random
variables from independence.
Pearson's r can be used to measure pairwise correlation among raters using a scale that is
continuous. It is obtained by dividing the covariance of the two variables by the product of their
standard deviations.
The correlation is 1 in the case of an increasing linear relationship, −1 in the case of a decreasing
linear relationship, and some value in between in all other cases, indicating the degree of linear
dependence between the variables. The closer the coefficient is to either −1 or 1, the stronger the
correlation between the variables.
Continuous Ratings, Two Raters: Pearson’s r
For example, suppose that we have two raters rating the number of cracks found in 10 road
segments. If the raters agree with one another, then there should be a high correlation between
the ratings given by the one rater and those given by the other. Accordingly, one thing we can
do to assess inter-rater agreement is to correlate the two raters' ratings. Consider the following
ratings of ten road segments:
Segment 1 2 3 4 5 6 7 8 9 10
Rater 1 10 9 8 7 6 5 4 3 2 1
Rater 2 9 10 8 7 5 6 4 3 1 2
In Minitab: Here is the dialog window in Minitab. Click on Stat, Basic Statistics, Correlation.
Doubleclick on “Rater 1” and “Rater 2.”
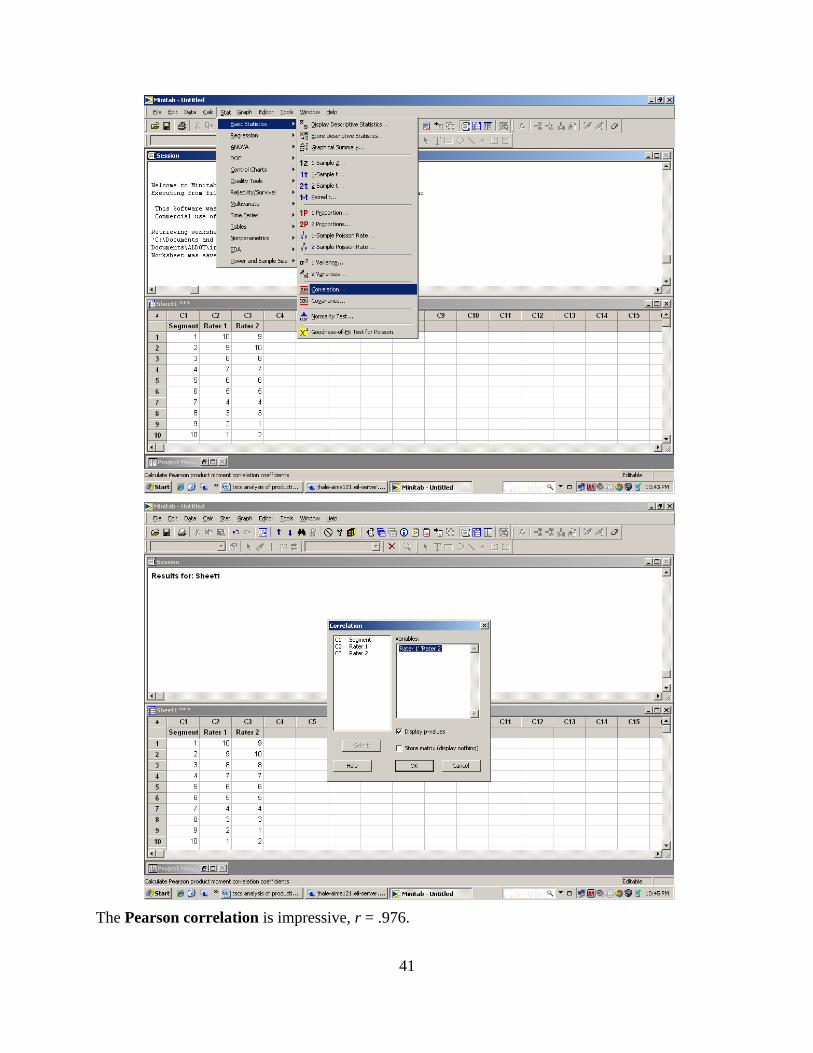
41
The Pearson correlation is impressive, r = .976.
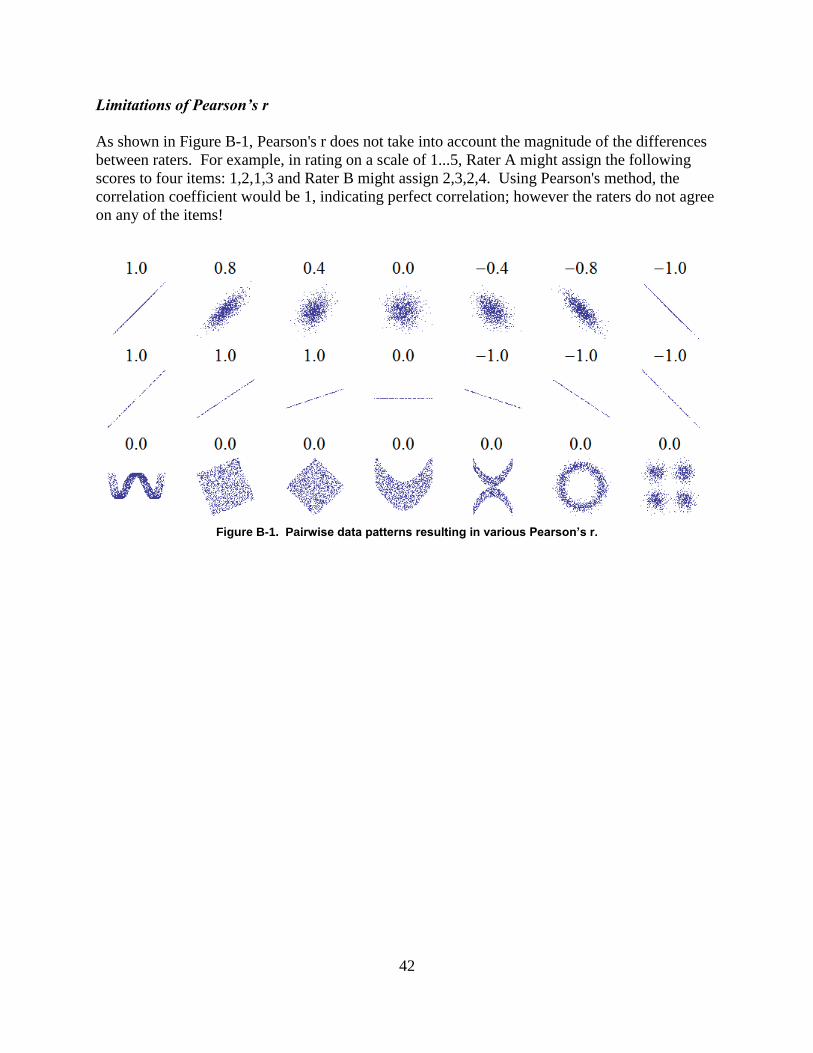
42
Limitations of Pearson’s r
As shown in Figure B-1, Pearson's r does not take into account the magnitude of the differences
between raters. For example, in rating on a scale of 1...5, Rater A might assign the following
scores to four items: 1,2,1,3 and Rater B might assign 2,3,2,4. Using Pearson's method, the
correlation coefficient would be 1, indicating perfect correlation; however the raters do not agree
on any of the items!
Figure B-1. Pairwise data patterns resulting in various Pearson’s r.
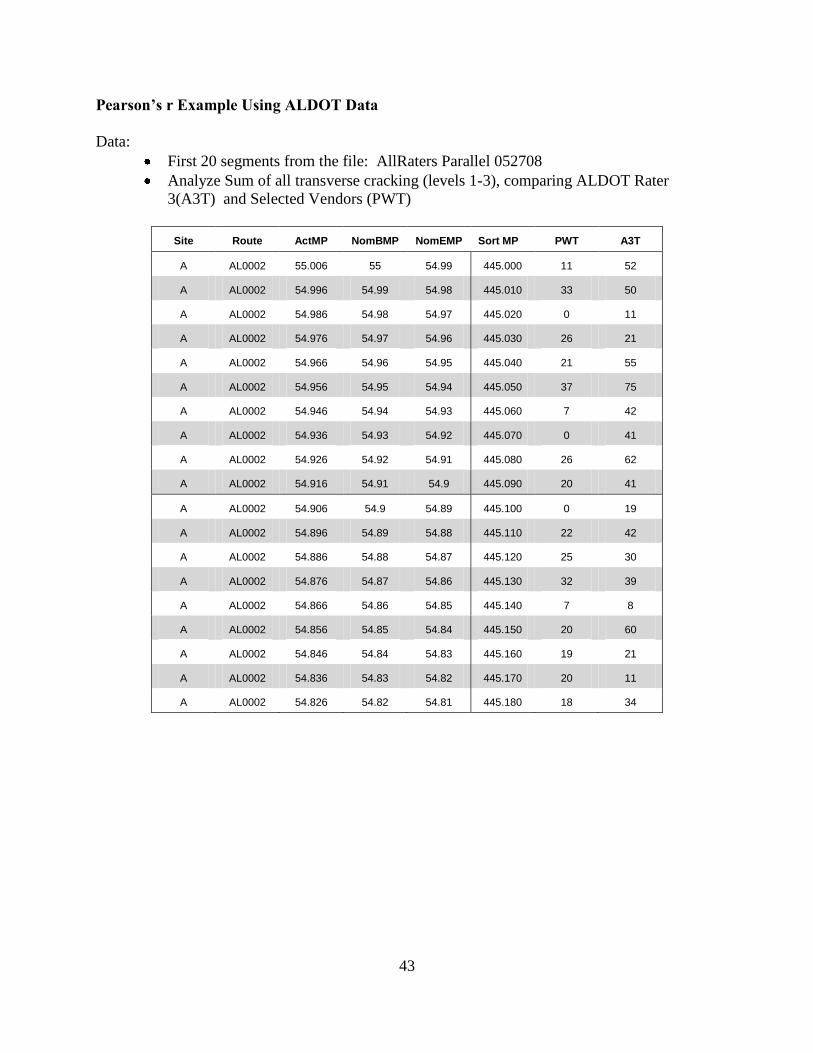
43
Pearson’s r Example Using ALDOT Data
Data:
First 20 segments from the file: AllRaters Parallel 052708
Analyze Sum of all transverse cracking (levels 1-3), comparing ALDOT Rater
3(A3T) and Selected Vendors (PWT)
Site Route ActMP NomBMP NomEMP Sort MP PWT A3T
A AL0002 55.006 55 54.99 445.000 11 52
A AL0002 54.996 54.99 54.98 445.010 33 50
A AL0002 54.986 54.98 54.97 445.020 0 11
A AL0002 54.976 54.97 54.96 445.030 26 21
A AL0002 54.966 54.96 54.95 445.040 21 55
A AL0002 54.956 54.95 54.94 445.050 37 75
A AL0002 54.946 54.94 54.93 445.060 7 42
A AL0002 54.936 54.93 54.92 445.070 0 41
A AL0002 54.926 54.92 54.91 445.080 26 62
A AL0002 54.916 54.91 54.9 445.090 20 41
A AL0002 54.906 54.9 54.89 445.100 0 19
A AL0002 54.896 54.89 54.88 445.110 22 42
A AL0002 54.886 54.88 54.87 445.120 25 30
A AL0002 54.876 54.87 54.86 445.130 32 39
A AL0002 54.866 54.86 54.85 445.140 7 8
A AL0002 54.856 54.85 54.84 445.150 20 60
A AL0002 54.846 54.84 54.83 445.160 19 21
A AL0002 54.836 54.83 54.82 445.170 20 11
A AL0002 54.826 54.82 54.81 445.180 18 34
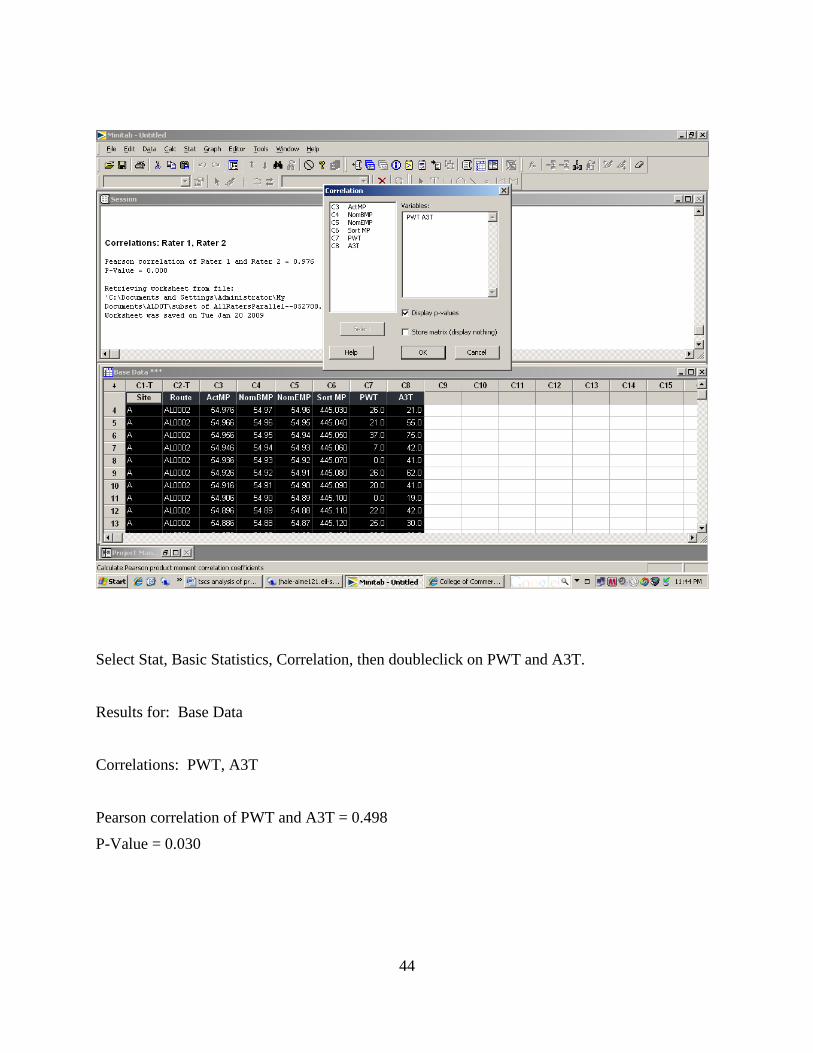
44
Select Stat, Basic Statistics, Correlation, then doubleclick on PWT and A3T.
Results for: Base Data
Correlations: PWT, A3T
Pearson correlation of PWT and A3T = 0.498
P-Value = 0.030
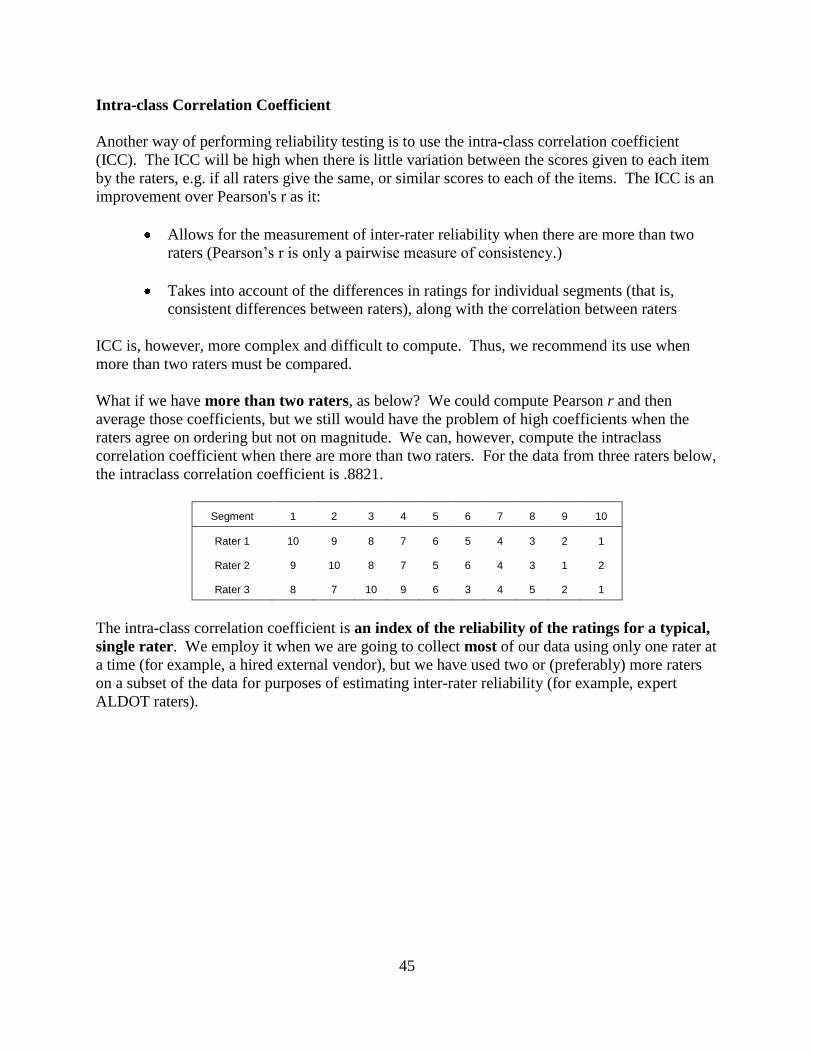
45
Intra-class Correlation Coefficient
Another way of performing reliability testing is to use the intra-class correlation coefficient
(ICC). The ICC will be high when there is little variation between the scores given to each item
by the raters, e.g. if all raters give the same, or similar scores to each of the items. The ICC is an
improvement over Pearson's r as it:
Allows for the measurement of inter-rater reliability when there are more than two
raters (Pearson’s r is only a pairwise measure of consistency.)
Takes into account of the differences in ratings for individual segments (that is,
consistent differences between raters), along with the correlation between raters
ICC is, however, more complex and difficult to compute. Thus, we recommend its use when
more than two raters must be compared.
What if we have more than two raters, as below? We could compute Pearson r and then
average those coefficients, but we still would have the problem of high coefficients when the
raters agree on ordering but not on magnitude. We can, however, compute the intraclass
correlation coefficient when there are more than two raters. For the data from three raters below,
the intraclass correlation coefficient is .8821.
Segment 1 2 3 4 5 6 7 8 9 10
Rater 1 10 9 8 7 6 5 4 3 2 1
Rater 2 9 10 8 7 5 6 4 3 1 2
Rater 3 8 7 10 9 6 3 4 5 2 1
The intra-class correlation coefficient is an index of the reliability of the ratings for a typical,
single rater. We employ it when we are going to collect most of our data using only one rater at
a time (for example, a hired external vendor), but we have used two or (preferably) more raters
on a subset of the data for purposes of estimating inter-rater reliability (for example, expert
ALDOT raters).
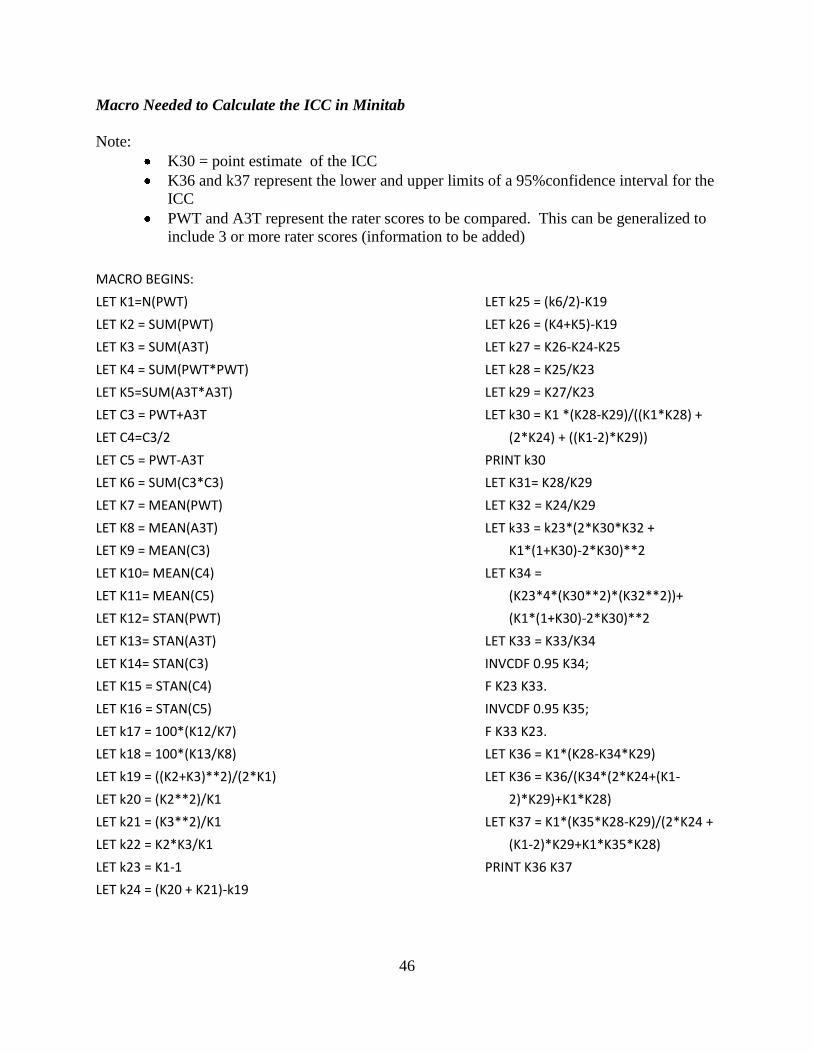
46
Macro Needed to Calculate the ICC in Minitab
Note:
K30 = point estimate of the ICC
K36 and k37 represent the lower and upper limits of a 95%confidence interval for the
ICC
PWT and A3T represent the rater scores to be compared. This can be generalized to
include 3 or more rater scores (information to be added)
MACRO BEGINS:
LET K1=N(PWT)
LET K2 = SUM(PWT)
LET K3 = SUM(A3T)
LET K4 = SUM(PWT*PWT)
LET K5=SUM(A3T*A3T)
LET C3 = PWT+A3T
LET C4=C3/2
LET C5 = PWT-A3T
LET K6 = SUM(C3*C3)
LET K7 = MEAN(PWT)
LET K8 = MEAN(A3T)
LET K9 = MEAN(C3)
LET K10= MEAN(C4)
LET K11= MEAN(C5)
LET K12= STAN(PWT)
LET K13= STAN(A3T)
LET K14= STAN(C3)
LET K15 = STAN(C4)
LET K16 = STAN(C5)
LET k17 = 100*(K12/K7)
LET k18 = 100*(K13/K8)
LET k19 = ((K2+K3)**2)/(2*K1)
LET k20 = (K2**2)/K1
LET k21 = (K3**2)/K1
LET k22 = K2*K3/K1
LET k23 = K1-1
LET k24 = (K20 + K21)-k19
LET k25 = (k6/2)-K19
LET k26 = (K4+K5)-K19
LET k27 = K26-K24-K25
LET k28 = K25/K23
LET k29 = K27/K23
LET k30 = K1 *(K28-K29)/((K1*K28) +
(2*K24) + ((K1-2)*K29))
PRINT k30
LET K31= K28/K29
LET K32 = K24/K29
LET k33 = k23*(2*K30*K32 +
K1*(1+K30)-2*K30)**2
LET K34 =
(K23*4*(K30**2)*(K32**2))+
(K1*(1+K30)-2*K30)**2
LET K33 = K33/K34
INVCDF 0.95 K34;
F K23 K33.
INVCDF 0.95 K35;
F K33 K23.
LET K36 = K1*(K28-K34*K29)
LET K36 = K36/(K34*(2*K24+(K1-
2)*K29)+K1*K28)
LET K37 = K1*(K35*K28-K29)/(2*K24 +
(K1-2)*K29+K1*K35*K28)
PRINT K36 K37
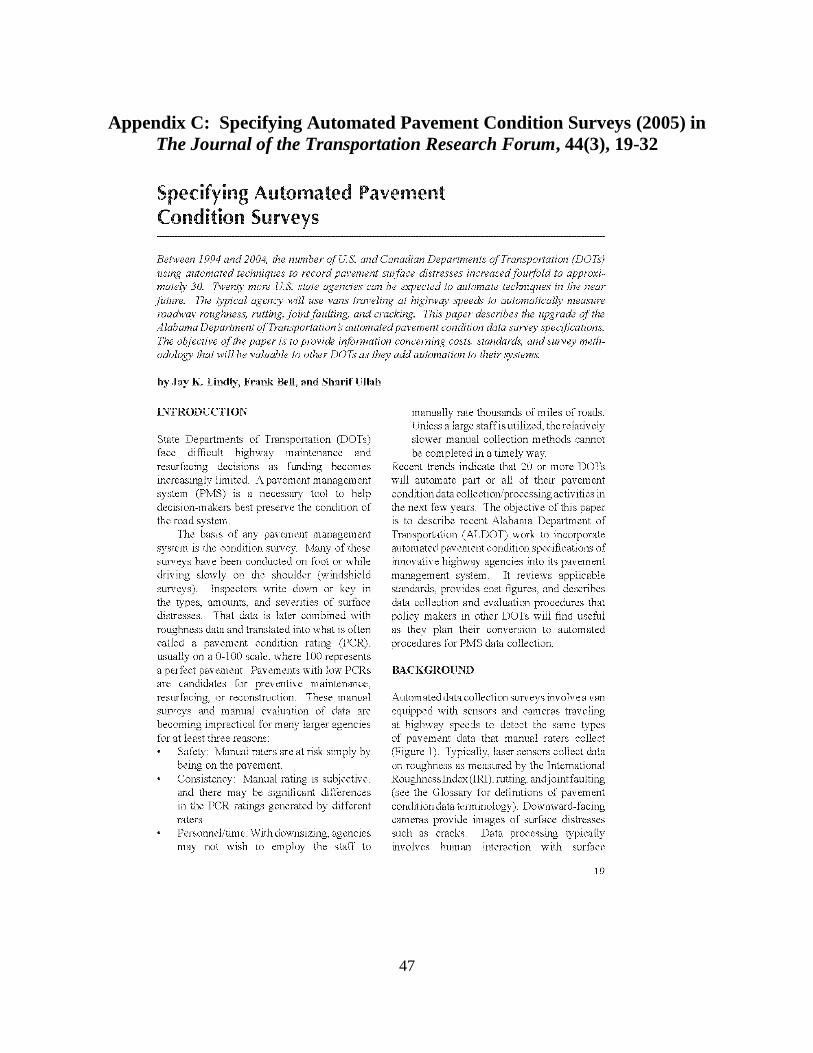
47
Appendix C: Specifying Automated Pavement Condition Surveys (2005) in
The Journal of the Transportation Research Forum, 44(3), 19-32
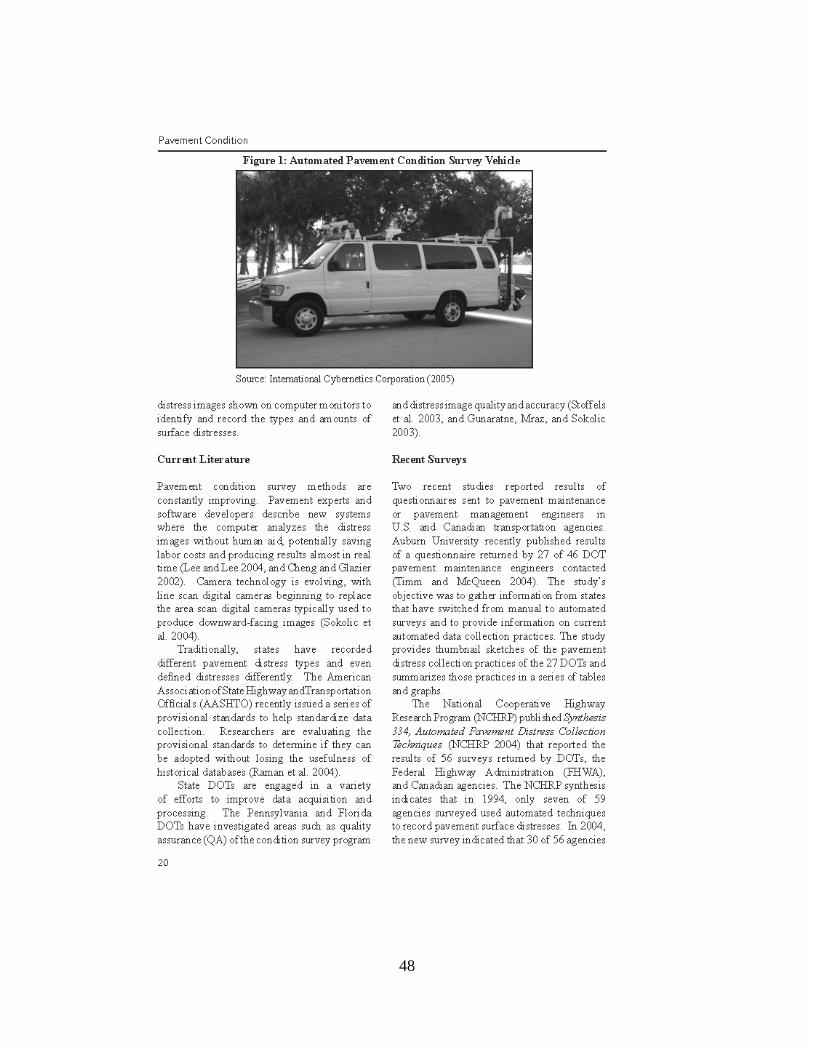
48
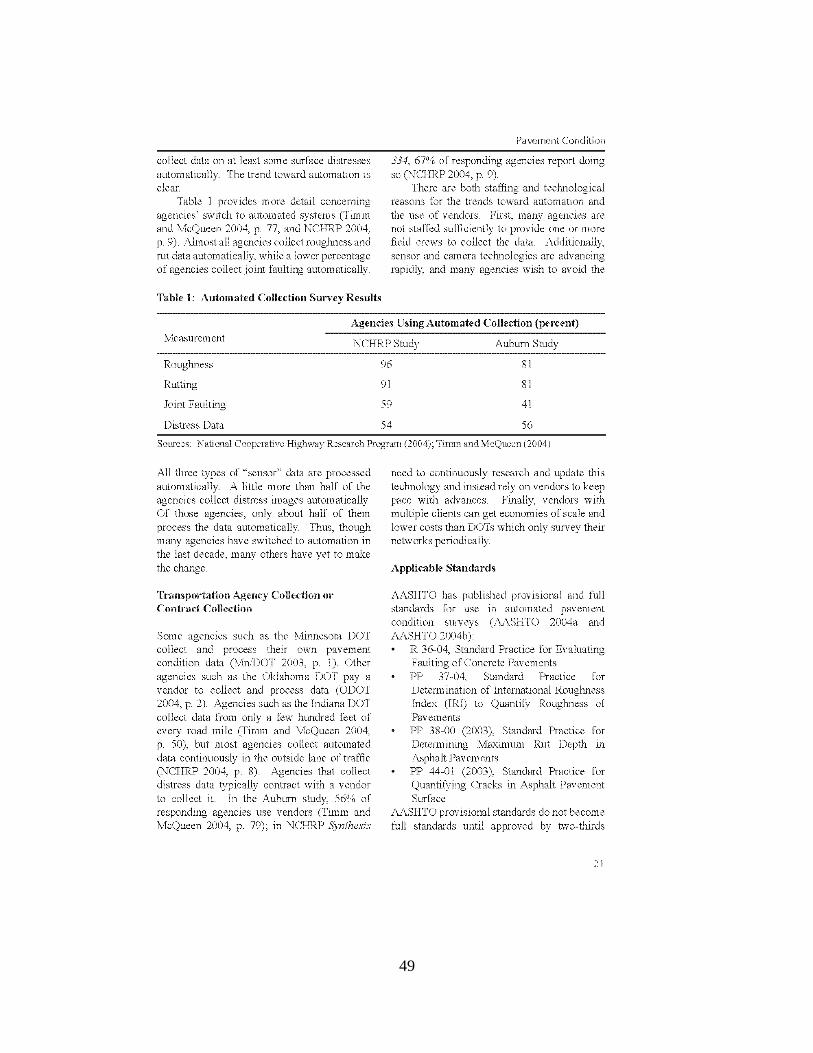
49
50
51
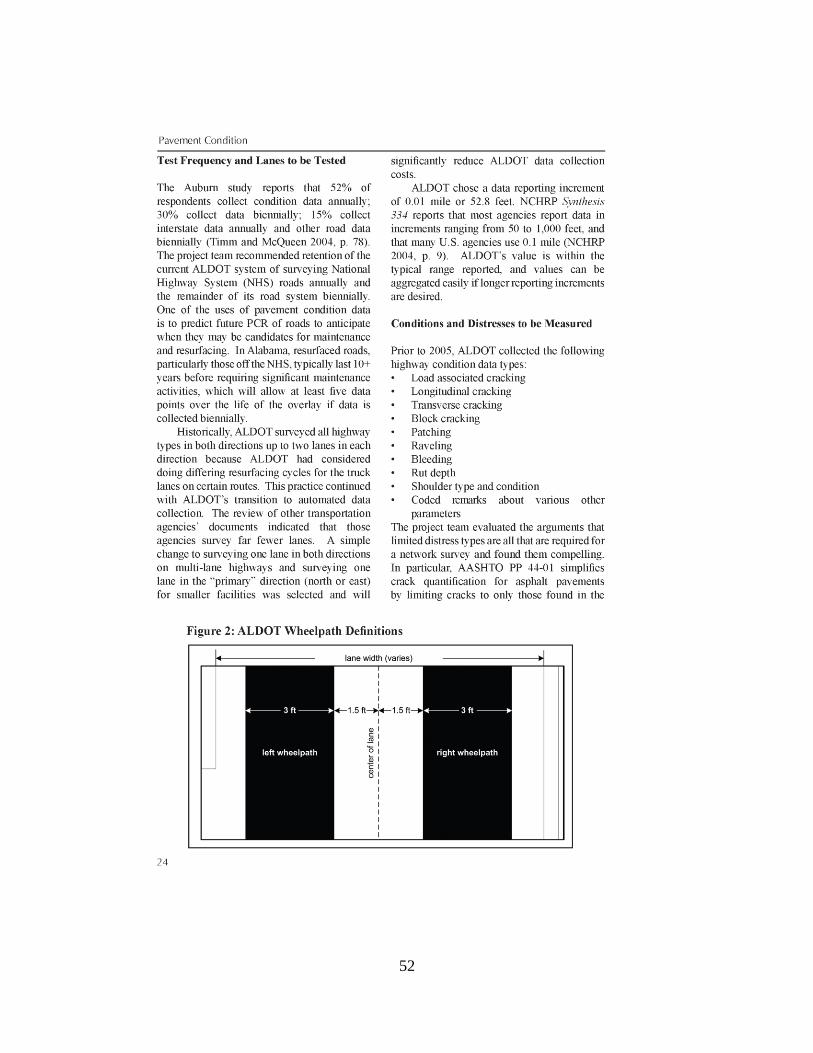
52
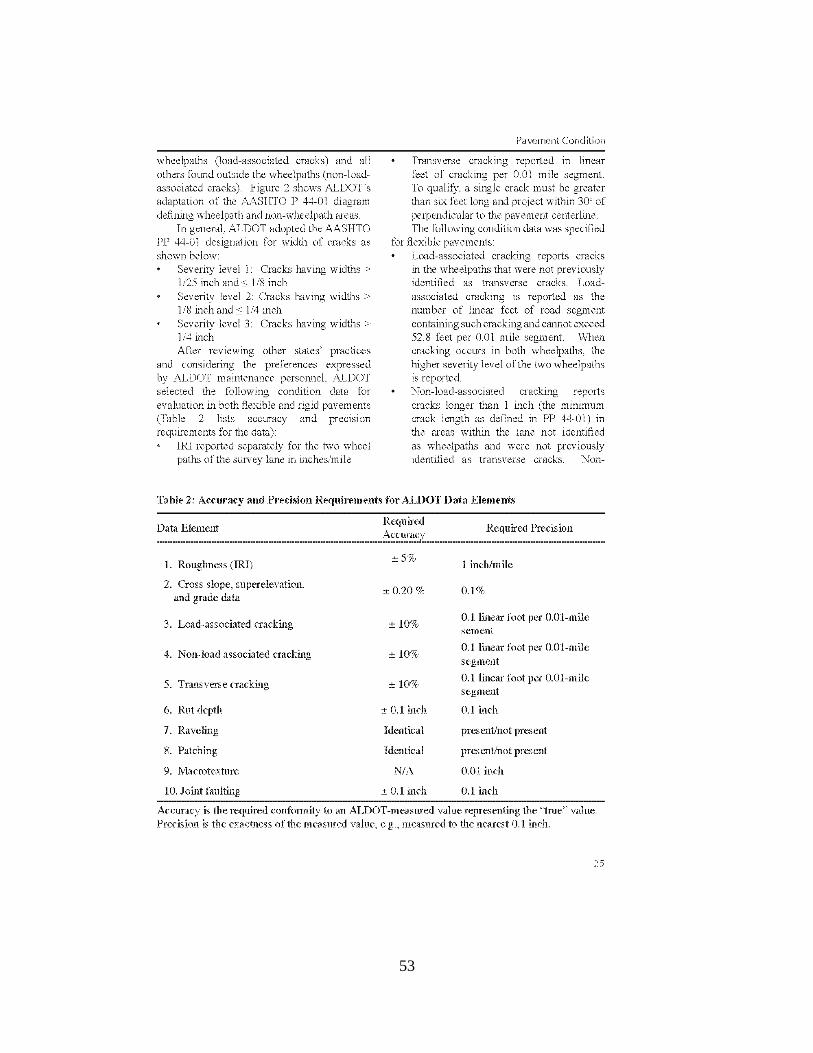
53
54
55
56

57
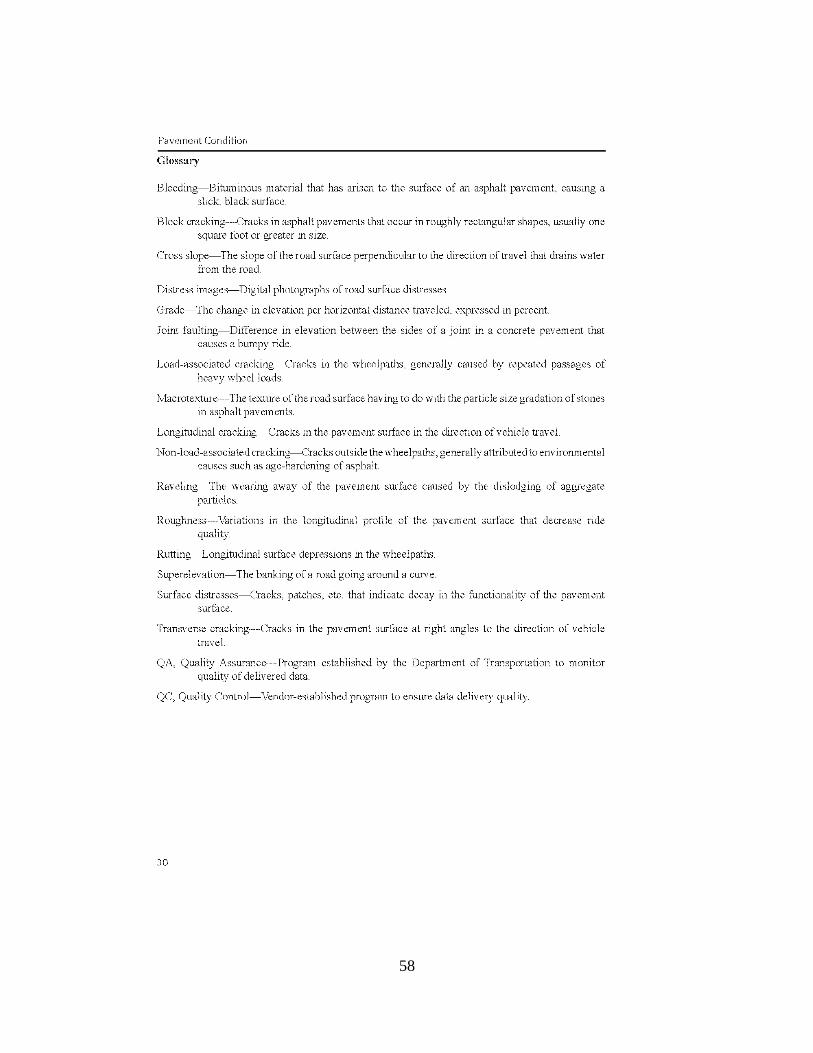
58
59
60