pcc eastern european economic migrants jsna and ccc migrant populations jsna stakeholder scoping...
TRANSCRIPT

Meeting health needs – are migrant populations disproportionately affected by infectious diseases?
Lynsey Emmett, Epidemiological Scientist14th October 2015

2 Meeting health needs – are migrant populations disproportionately affected by infectious diseases?
Background• Valuable contribution of migrant populations• Number of people migrating to the UK has been greater
than the number emigrating since 1994 (by more than 100,000 since 1998)
• East of England scoping exercise in 2008• integration dependent upon equitable access to health
care and positive health outcomes alongside employment, education and housing
• Unmet health needs
• Reports – increased burden of infection in some UK born populations

3 Meeting health needs – are migrant populations disproportionately affected by infectious diseases?
What is a migrant?
Complex – effect on data and analyses
Person who changes their usual country of residence
- Country of birth different to country of residence- Nationality is different to country of residence- Changes country of residence for a period of at least a year
Strengths and weaknesses

Understanding migration statistics
4
ONS International Passenger
Survey
ONS UK Census
DWP Migrant Workers Scan
ONS GP registrations
Home Office Asylum seekers, worker
registration scheme
Gangmaster registrations
ONS Annual Population
Survey
ONS Labour Force
Survey
DWP National
Insurance Number
registrations

5 Meeting health needs – are migrant populations disproportionately affected by infectious diseases?
Understanding migration statisticsKey points
• Before 1964No systematic attempt to measure extent of
international migration (census data – diff births/deaths)
• 1964 to 1990International Passenger Survey (IPS)
• 1991 onwardsLong term international migration series
IPS + other data sources

6 Meeting health needs – are migrant populations disproportionately affected by infectious diseases?
Migration in the UK 1991-2014• ONS long term
international migration
• Changes residence for at least a year
• Net migration:• 1991-5 –
av. 37,000• 2010-14 –
av. 234,000Source: House of Commons, Migration Statistics Briefing Paper

7 Meeting health needs – are migrant populations disproportionately affected by infectious diseases?
Migration in the UK 1964-2014
Source: House of Commons, Migration Statistics Briefing Paper

8 Meeting health needs – are migrant populations disproportionately affected by infectious diseases?
From where do people migrate to the UK?
2013 –
• 14% British nationals
• 38% nationals of other EU
• 47% nationals of non-EU countries
Nationality, country of birth, country of last residence
Source: House of Commons, Migration Statistics Briefing Paper
9 Meeting health needs – are migrant populations disproportionately affected by infectious diseases?
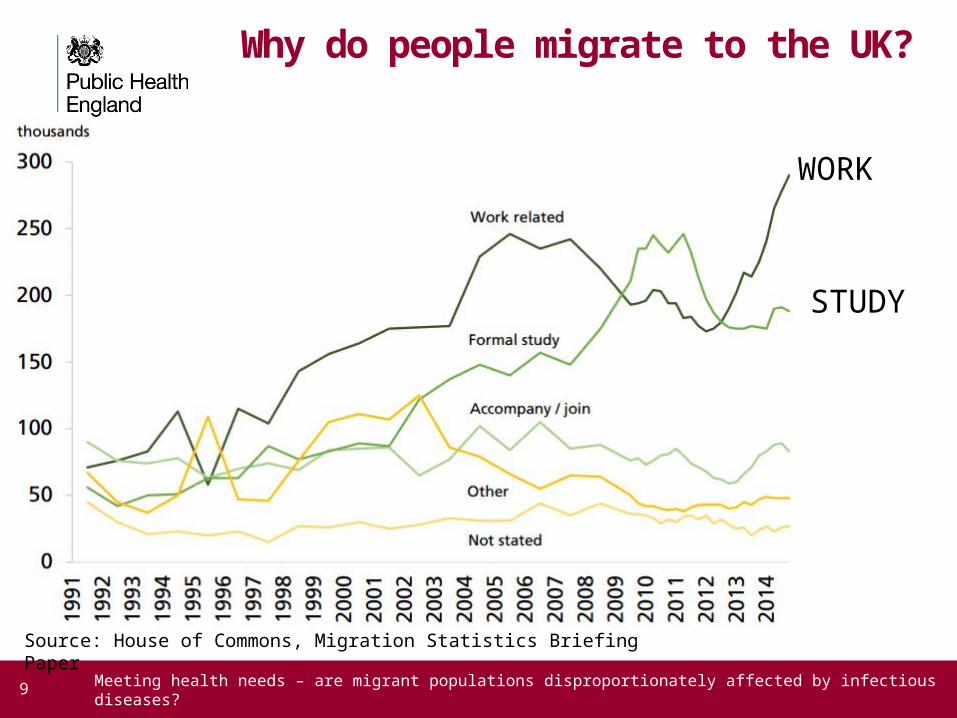
Why do people migrate to the UK?
WORK
STUDY
Source: House of Commons, Migration Statistics Briefing Paper

10 Meeting health needs – are migrant populations disproportionately affected by infectious diseases?
Migration in the East of England
• Region with 4th highest proportion of population born abroad (11%, 37% in London)
• 101% increased between 1995 (308,707) to 2013 (621,145)
• Luton highest number (62,872) as well as highest population share (31%) of non-UK born residents in the region
• Residents born in Poland represent the most numerous non-UK born group in the East of England (62,100) followed by residents born in India, Ireland, United States and Pakistan
• Cambridge had the highest number (3187) and proportion (21%) of short term residents
Source: Migration Observatory, Oxford

11 Meeting health needs – are migrant populations disproportionately affected by infectious diseases?
Migration in the East of England
Source: Migration Observatory, Oxford
• 48% male, 52% female
• 43% aged 20-39 years
• Most common 25-29 years and 30-34 years

12 Meeting health needs – are migrant populations disproportionately affected by infectious diseases?
Migration in the East of England
Fenland – 211% (2641 to 8209)
Peterborough – 148%(15,268 to 37,892)
Source: Migration Observatory, Oxford

Health needs of migrant populations
13

14 Meeting health needs – are migrant populations disproportionately affected by infectious diseases?
Health needsTB 73% of cases were born abroad Majority born in South Asian (57%), sub-Saharan Africa
(27%) 77% of non-UK born cases in 2010 were diagnosed two or
more years after arrival in the UK Higher proportion of non-UK born cases present with extra-
pulmonary cases (54% to 31%) Highest rates of TB in the UK are in ethnic minority groups

15 Meeting health needs – are migrant populations disproportionately affected by infectious diseases?
Health needsHIV 65% new HIV diagnoses between 2001 and 2010 were
among those born abroad Majority from Africa (87%) 80% acquired their infection heterosexually 22-30% of MSM diagnosed 2001-2010 were born abroad
(majority Europe excluding UK) Heterosexuals who were born outside of the UK were more
likely to be diagnosed late than those born in the UK (63% vs. 50%)

Project aims
16
- Background information on migration trends in and characteristics within the region
1. To map the migrant population within the EoE and how this has changed over time
2. To describe the characteristics of the migrant population within the EoE
Project aims
17
3. To estimate the burden of infection (HIV, TB, STI(?)) within the migration population within the
East of England
4. To undertake a comparison of the burden of infectious diseases in the migrant population versus
UK born residents
- Provide a resource on burden of infectious diseases in migrant populations in the East of England

What is the rate of TB in migrants in the East of England?
18 Migrant health - TB
Average rate of TB in Migrants = 53.3 per 100,000
Average rate of TB in Anglia and Essex: 6.7 per 100,000
Average rate of TB in South Midlands and Hertfordshire:13.0 per 100,000
England rate of TB :14.1 per 100,000

Age and gender of migrants with TB in the East of England in 2013
19 Migrant health - TB
0-19
20-39
40-59
60-79
80-99
120 70 20 30 80
Female Male
Count
Age
gro
up

Country of birth of migrants with TB in the East of England
20 Migrant health - TB
2002 2003 2004 2005 2006 2007 2008 2009 2010 2011 2012 20130%
10%
20%
30%
40%
50%
60%
Pakistan, Bangladesh and India
Year
Per
cent
age
of n
on-U
K b
orn
peop
le
(%)
2002 2003 2004 2005 2006 2007 2008 2009 2010 2011 2012 20130%
1%
2%
3%
4%
5%
6%
7%
8%
9%
North-Eastern Eu-ropean countries
Year
Per
cent
age
of n
on-U
K b
orn
peop
le
(%)
Estonia, Latvia and Lithuania joined the
EU in 2004

HIV and STIs
21
0
50
100
150
200
250
2004 2005 2006 2007 2008 2009 2010 2011 2012 2013
Num
ber o
f new
HIV
dia
gnos
es
UK
Africa
All other countries
New HIV diagnoses by world region of birth

HIV and STIs
22
Gonorrhoea diagnoses by world region of birth
0
20
40
60
80
100
120
140
2010 2011 2012 2013 2014
Europe (excluding UK)CaribbeanSub-saharan Africaother world regionUnknown

23 Meeting health needs – are migrant populations disproportionately affected by infectious diseases?
Thank you….