pdd for gtcc
DESCRIPTION
CDM registered for torrent 1147.5 mw gtccTRANSCRIPT

PROJECT DESIGN DOCUMENT FORM (CDM PDD) - Version 03.1. CDM – Executive Board page 1
CLEAN DEVELOPMENT MECHANISM PROJECT DESIGN DOCUMENT FORM (CDM-PDD)
Version 03 - in effect as of: 28 July 2006
CONTENTS A. General description of project activity B. Application of a baseline and monitoring methodology C. Duration of the project activity / crediting period D. Environmental impacts E. Stakeholders’ comments
Annexes Annex 1: Contact information on participants in the project activity Annex 2: Information regarding public funding Annex 3: Baseline information
Annex 4: Monitoring plan
Appendix 1: Fuel Availability Appendix 2: Natural Gas and Oil prices. Appendix 3: Environmental Impact Assessment Report.
Appendix 4: Investment Analyses Calculations in Spread Sheet (Treated as confidential and hence part of the Confidential Version of the Project Design Document). Appendix 5: Benchmark Investment Analyses Calculations in Spread Sheets (Treated as confidential and hence part of the Confidential Version of the Project Design Document).

PROJECT DESIGN DOCUMENT FORM (CDM PDD) - Version 03.1. CDM – Executive Board page 2 SECTION A. General description of project activity A.1 Title of the project activity: “1147.5 MW Natural gas based grid connected Combined cycle power generation project”. Version: 2. Date: 18th April, 2007. A.2. Description of the project activity: Purpose of the Project Activity Due to the electricity supply deficit in the Western Regional Electricity Grid of India, Torrent Power Generation Limited (since amalgamated with Torrent Power Limited) (Torrent) proceeded to set up a new (i.e. Greenfield) grid connected power plant (comprising three blocks with a total capacity of 1147.5 MW). The plant is based on efficient combined cycle technology and can use natural gas or Re-gasified Liquefied Natural Gas (LNG) as fuel. The Gas Turbines, Siemens V94.3A (lately renamed SGT5-4000F- equivalent to “F” Class) use several advanced technologies namely: 1) Special metallurgy of buckets and blades – capable of withstanding much higher Turbine Inlet
Temperature (TIT around 1200 Celsius) of combusted gas at inlet to gas turbines as compared with those of matured class gas turbine (about 1060 Celsius), due to which the gas turbine requires relatively much stringent level of surveillance and very strict regime of inspections by OEM’s specialists at regular intervals based on operating and loading pattern-unlike matured class gas turbines that can be inspected by third party service providers. Moreover due to this reason spare buckets and blades of the gas turbine are not available from third party manufacturers and one has to enter into a long term service agreement with the OEM (Siemens), at a substantial cost, for refurbishment of these parts and for providing the services for their repairs.
2) The Fuel Burners are of special advanced design due to which the fuel gas combustion takes
place in “pre-mix” mode right from beginning rather than first combusting in “diffusion” mode (upto about 30-40% load) and then changing over to “pre-mix” mode thus helping the environment by limiting the NOx emission right from initial combustion unlike conventional DLN Burner technology that results into higher NOx emission upto 30-40% load and limits NOx only after the load increases above this threshold limit. These special technology gas burners have to be covered with OEM (Siemens) for necessary inspection and servicing since such services are not available from any third party provider due to technology restrictions.
3) The gas turbines are equipped with a special hydraulically controlled axial positioning device
for axially positioning the gas turbine rotor so as to optimize radial clearances of rotor blades for the purpose of minimizing fuel gas consumption and CO2 emissions for protecting environment – however, this advancement in technology has to be separately paid for and one

PROJECT DESIGN DOCUMENT FORM (CDM PDD) - Version 03.1. CDM – Executive Board page 3
has to obtain the services of the OEM for its servicing and repairs since this technology is of proprietary nature and is not available from any third party.
The plant will predominantly operate in base load mode. The power generated from the project activity can be delivered to any utility in India subject to certain quantum being supplied on inter-state basis in accordance with the mega power project policy of the Government of India. 75% of the power generated is proposed to be supplied to the cities of Ahmedabad and Surat, which form part of the Western Regional Electricity Grid. The status and schedule of the project activity is as follows: • Host Country Approval has been obtained on 28th November, 2006. • Main plant construction, i.e. project activity started on 17th June 2005 (i.e. project start date, on
which date the Engineering Procurement and Construction contract for main plant construction was placed).
• The first block is expected to be installed and commissioned in fourth quarter of 2007. • The commissioning of second and third blocks is expected in first quarter of 2008 . • The entire project construction is expected to be completed by March 2008. While planning to put up this project activity, Torrent faced substantial investment, technological and regulatory barriers in electricity generation using natural gas, e.g. due to higher cost of natural gas and unfamiliarity with the operation of highly advanced combined cycle power plant. Despite these barriers, the Board Members of Torrent decided to take up the project activity in view of the risk mitigation cover provided by revenues expected from Clean Development Mechanism (CDM) registration of the project activity. How the project activity reduces greenhouse gas emissions As per the baseline scenario analysis described under section B.4, in the absence of the project activity similar power would have been generated through a pit-head coal (non-coking) based power plant. As the typical new coal based power plant in India uses coal of a low quality and has sub-critical steam parameters, the project leads to substantial greenhouse gas emissions reductions due to the use of a less carbon intensive fuel and a much higher efficient power generation plant. Views of the project participant on the contribution of the project activity to sustainable development Ministry of Environment and Forests, Government of India has stipulated the four indicators - social well being, economic well being, environmental well being and technological well being - for assessment of the sustainable development benefits in the interim guidelines for CDM projects. The designated national authority (DNA) after examining the sustainable development contributions of this project activity has accorded it Host Country Approval. In brief, the project activity fulfils these indicators as follows: Social Well Being: • The power plant contributes to empowerment of the vulnerable sections of the society
including the scheduled caste and scheduled tribes through direct and indirect employment opportunities.
PROJECT DESIGN DOCUMENT FORM (CDM PDD) - Version 03.1. CDM – Executive Board page 4 • Increased availability of electrical energy will in the long run reduce dependence on bio-mass
based energy sources for domestic consumption. This improves the health of women in particular through reduction of indoor air pollution which currently kills 150,000 women in India every year.
• The development of a region from the Human Development perspective would result from
improvements in life expectancy at birth, infant mortality, literacy/education, health, infrastructure, ability to cope with shocks and empowerment / having a voice in the institutions of state and society. It has been the experience of this country that industrial activity and income security often brings with it empowerment and allied infrastructure that benefit the peripheral areas. Increase in such industrial activity is facilitated by the electricity generated by the project activity.
• Promotes local skills, local entrepreneurship and community development. Environmental Well Being: • Adoption of combined cycle, an efficient technology as well as natural gas as a fuel with no
ash and low sulphur content reduces local air pollution, water usage and generation of solid waste (fly ash) compared to the typical coal power plants in India. Usage of coal for power generation is not constrained by law but whose use is rather encouraged by the government policies in view of its availability and affordable prices is of particular importance.
• The dry low NOx type burner used in project activity reduces not only the NOx emissions but
also water consumption. • About 25 hectares of the total land area available (approximately 150 ha) for the project will
be developed as greenbelt, lawns, horticulture and other forms of greenery, which is beyond statutory stipulation. The main objective of the green belt is not only to provide a barrier between the plant and the surrounding areas, but also be beneficial in many ways, such as retention of soil moisture, prevention of soil erosion, recharge of ground water and moderation of micro climate. Besides acting as a carbon sink, certain species of plant even absorb the pollutants while others can thrive in polluted atmosphere. A good part of the waste water shall be used in the project site for development and maintenance of this greenery. The trees that were uprooted while constructing the approach road etc were replanted in the green belt area.
• Drainage system of the project has been developed after considering the contour of the site and natural water courses. Hence, there is negligible impact on the natural drainage pattern in and around the project site.
Economic well being: • Reduction of the electricity supply-deficit in the western region will inter-alia improve
productivity of industry that is currently suffering from frequent power cuts and thereby enhance economic growth.
• Encourages developments in the local economy.

PROJECT DESIGN DOCUMENT FORM (CDM PDD) - Version 03.1. CDM – Executive Board page 5 Technology well being: • The combined cycle gas turbine applied is new, highly efficient (i.e. High temperature F class
gas turbine having a higher fuel efficiency (i.e. 57% at 100% load) and less polluting and the demonstration effect could be important for diffusion of this technology in India (particularly in the context of high gas prices) instead of projects using higher GHG intensive fuels such as coal.
• Further the project activity has many features which increases the fuel efficiency (for details refer to section A.2 and A.4.3).
A.3. Project participants:
Name of Party involved ((host) indicates a host
Party)
Private and/or public entity(ies) project participants
(as applicable)
Kindly indicate if the Party involved wishes to be considered as project participant
(Yes/No) Government of India (Host) Torrent Power Limited No
Torrent Power Limited shall be the lead and nodal entity for all communication with CDM – Executive Board and Secretariat. The contact information has been provided in Annex I. This project activity has been developed as a CDM project and would have other entities from Annex I countries to join as project participants at a later stage. The list of such participants shall be provided as and when identified. A.4. Technical description of the project activity: A.4.1. Location of the project activity: A.4.1.1. Host Party(ies): India. A.4.1.2. Region/State/Province etc.: Gujarat. A.4.1.3. City/Town/Community etc: Akhakhol (village) in Kamrej Taluka, Surat district. A.4.1.4. Detail of physical location, including information allowing the unique identification of this project activity (maximum one page):

PROJECT DESIGN DOCUMENT FORM (CDM PDD) - Version 03.1. CDM – Executive Board page 6 The physical location for the power plant to be operated and constructed is at Akhakhol village in Kamrej taluka, which is about 28 km northeast of Surat city. The project site is located approximately at 72o59’E longitude and 21o21’N latitude. The approximate location of the site is shown below.
The land for the project including its approach road, housing colony and intake well comprises approximately 344.83 acres of land. The terrain of the proposed plant site is fairly flat and requires minimum grading. A.4.2. Category(ies) of project activity: The project activity falls in Scope Number 1; Sectoral Scope – Energy Industries (renewable - / non-renewable sources). A.4.3. Technology to be employed by the project activity: The natural gas-fired power plant consists of three blocks of 382.5 MW each. A block consists of advance class (F Class) gas turbine (GT), matching triple pressure heat recovery steam generator, steam turbine and generator. The hot exhaust from the gas combusted in the gas turbine enters the heat recovery steam generator (HRSG) and generates steam in the boiler pipes using demineralised water. The steam thus produced will be introduced into the steam turbine (ST) for
PROJECT DESIGN DOCUMENT FORM (CDM PDD) - Version 03.1. CDM – Executive Board page 7 driving the electrical generator which will also simultaneously be driven by the GT for electricity generation. The generator’s electrical output is at 20 kV. The evacuation to grid will be at the 220 and 400 kV switch-yard of the project activity. The auxiliary consumption for the plant is estimated to be around 2-3%. The EPC contract for implementing the project activity has been awarded to a consortium of Siemens AG and Siemens India Ltd through an international competitive bidding process, which will be sourcing the technology as well as the main equipment i.e. the Gas Turbine, Steam Turbine and Generator from Europe and the USA, while supporting equipments viz. Heat Recovery Steam Generator and Transformer will be imported from Korea. The project activity will adhere to many of the norms practiced in Europe which are more stringent than those in the host country, particularly as regards NOx emissions and thus requires higher investments. Natural Gas (including LNG, the share of which is estimated to be 50% in energy terms for the purpose of this PDD) will be transported to the project site including through a spur pipeline tapped from the trunk gas line owned and operated by Gujarat State Petronet Ltd. (GSPL) currently. The Natural Gas from domestic sources is expected to have an average net calorific value of 8500 kCal/SCM (0.03558 Giga Joules/ SCM)1 and LNG is expected to have an average calorific value of 8981 kCal/SCM (0.03759 Giga Joules/SCM) 1. The plant contains several efficiency increasing properties: • The plant will have a single shaft configuration which is more efficient than the multi shaft
configuration due to lesser length of steam cycle piping and lesser number of major operating equipments.
• The project activity provides for usage of only clean fuel i.e. natural gas (including LNG). The project activity is not technically equipped to use naphtha or any other liquid fuel (as is commonly not the case in the case of other Combined Cycle Power Plants in India , who provide for the firing of such liquid fuel as a backup fuel or a main fuel), which feature is expected to increase the efficiency of the project activity.
• Also the project activity shall have two stage burner with diffusion plot instead of conventional
burners (i.e. pre mix operation through out the entire load range), which reduces the NOx level right from start load instead of from 45% load. Also the efficiency of the gas turbine is also increased due to high combustion stability achieved by such burners. Also due to such burners the NOx emissions from project activity is 25ppm when loads are greater than 50% against the Euro norms being 26.6ppm (50Mg/NM3) for loads greater than 70% and the Indian norm being 50ppm.
• Again the project activity shall have a device called “GT Rotor Axial Positioning Device”,
which is a hydraulic device for fixing the axial position of Gas Turbine Rotor. This device by 1 NCV for ONGC is collected from agreement between ONGC and Gail. NCV of Petronet LNG Limited is collected from Petronet’s “Price of R-LNG for year 2004- Tariff levelized over five years” document.- www.infraline.com

PROJECT DESIGN DOCUMENT FORM (CDM PDD) - Version 03.1. CDM – Executive Board page 8
minimising the leakages of air between various stages of air compressor and by also minimising the leakage of gas combustion products from gas turbine blade tips, improves the efficiency of the gas turbine.
Due to above features of the project activity including transfer of advanced class power generation technology, the project activity causes use of an environmentally safe and sound technology that would reduce additional GHG emissions as well as mitigate to a great extent regulated emissions such as SPM, NOx and SO2 from power generation.
A.4.4 Estimated amount of emission reductions over the chosen crediting period:
Years Annual estimation of emission reductions in tonnes
of CO2e 2008 (From 1st April) 2392278
2009 3189704
2010 3189704
2011 3189704
2012 3189704
2013 3189704
2014 3189704
2015 3189704
2016 3189704
2017 3189704
2018 (Until 31st March) 797426 Total estimated reductions (tonnes of CO2e)
31897040
Total number of crediting years 10 years Annual average over the crediting period of estimated reductions (tonnes of CO2e) 3189704 A.4.5. Public funding of the project activity: No public funding or Official Development Assistance will be used for the project activity.

PROJECT DESIGN DOCUMENT FORM (CDM PDD) - Version 03.1. CDM – Executive Board page 9 SECTION B. Application of a baseline and monitoring methodology B.1. Title and reference of the approved baseline and monitoring methodology applied to the project activity: Title: “Baseline Methodology for Grid Connected Electricity Generation Plants using Natural Gas” (based on new methodology NM 0080rev submitted by the project participant.) Reference: AM0029 Version 01.1; Sectoral Scope: 01, 19th May 2006 Reference to other methodologies or tools: • Version 02 of the “Tools for the demonstration and assessment of additionality”. • Version 06 of ACM0002. B.2 Justification of the choice of the methodology and why it is applicable to the project activity: The choice of AM0029 for application to this project activity has been justified below.
Sr. No. Requirements as per Baseline Methodology
Why applicable to this Project Activity
Main Condition No.1.
The project activity is the construction and operation of a new natural gas fired grid–connected electricity generation plant.
• The project activity involves the construction and operation of a new natural gas (including LNG) fired combined cycle power plant (CCPP), of 1147.5 MW (i.e three blocks of 382.5MW each) for electricity generation.
• The project activity will be connected to the Gujarat
state grid at 220 kV Kim sub-station, which is ~6 km from the project site through two lines of 220 kV each having an evacuation capacity of 267 MVA each. It is also to be connected to the 400 kV national grid of Power Grid Corporation of India (PGCIL) through two LILO lines each having an evacuation capacity of 1,178 MVA, viz (i) Jhanor-Dahegam and (ii) Jhanor-Vapi lines. It shall also have connectivity with Surat city network (part of Western Regional Electricity Grid) through 3 nos 220kV double circuit lines (each having evacuation capacity of 534 MVA).
Main Condition No.2.
The geographical/ physical boundaries of the baseline grid can be clearly identified and information pertaining to the grid and
• As the project activity is expected to supply power to the states (including its various demand centers) forming part of the Western Regional Electricity Grid, the same has been chosen as the Baseline Grid. This choice on baseline grid selection is also in

PROJECT DESIGN DOCUMENT FORM (CDM PDD) - Version 03.1. CDM – Executive Board page 10
Sr. No. Requirements as per Baseline Methodology
Why applicable to this Project Activity
estimating baseline emissions is publicly available.
compliance with the clarification on baseline grid determination provided by the CDM EB. Power transmission within the Western Regional Electricity Grid is made without significant transmission constraints, as Power Grid Corporation of India ltd. (State owned power transmission company) as well as the state transmission utilities operate a well connected power transmission system within the baseline grid.
• The geographical/ physical boundaries of the
Western Regional Electricity Grid are the boundaries of Gujarat, Madhya Pradesh, Maharashtra, Goa and Chattisgarh states and union territories of Daman & Diu and Dadra & Nagar Haveli. Information relating to the baseline grid is publicly available from Ministry of Power and its website (www.powermin.nic.in), Central Electricity Authority (Ministry of Power, Government of India) and its web site (www.cea.nic.in), infraline website (www.infraline.com-access available on subscription), western regional electricity grid load dispatch centre and its website (www.wrldc.com), Central electricity regulatory commission (www.cercind.org), etc.
• Official information related to the baseline grid
carbon emission factor are publicly available with CEA, Ministry of Power, Government of India (http://www.cea.nic.in/planning/c%20and%20e/Government%20of%20India%20website.htm). This information compiled by CEA, Ministry of Power, Government of India in technical cooperation with Indo-German Energy programme (GTZ) was presented and explained in a side event of COP/MOP2 recently held in Nigeria and was well received.
Main Condition No.3.
Natural gas is sufficiently available in the region or country, e.g. future natural gas based power capacity additions, comparable in size to the project activity, are not constrained by the use of Natural Gas in the project activity.
• As gas imports are permitted freely and without restrictions from any part of the world, and as there are no restraints generally in the establishment and expansion of regasification terminals for processing such imports and as new explorers and developers are permitted to sell gas at market determined price, availability of natural gas (including LNG) in India by 2010/11 (i.e., within the first three/four years of the start of the crediting period of the project activity-
PROJECT DESIGN DOCUMENT FORM (CDM PDD) - Version 03.1. CDM – Executive Board page 11
Sr. No. Requirements as per Baseline Methodology
Why applicable to this Project Activity
generally the time required for the establishment of necessary gas supply infrastructure) is expected to be sufficient (i.e., capable of firing more than 40 times the capacity of the project activity) as indicated in Appendix 1 to this PDD. A major part of this gas is expected to be available in the states of Maharashtra and Gujarat (as stated in Appendix I), which form part of the baseline grid and in which (i.e. in Gujarat) the project activity is located.
• At the time of initiation of real action on the project activity i.e. award of the EPC Contract in June 2005, natural gas was available for procurement and there have been no evidenced restrictions caused by the project activity’s choice of natural gas as the fuel, on significant future capacity additions to the baseline grid comparable in size to the project activity, in choosing natural gas as fuel. There are several examples2 of sufficient availability of natural gas in the open market in Gujarat, in which state the project activity is located.
• Any new gas fired combined cycle power plant comparable in size to the project activity can catalyze the development of gas supply infrastructure (such as a re-gasification terminal and necessary pipeline connections without significant constraints) from the infrastructure planning perspective. Hence, gas sourcing for significant future power plants comparable in size to the project activity is generally sourced well in time to enable development of gas supply infrastructure before the commissioning of such large sized plants.– be it domestic or imported LNG (as Gas sourcing requires a long lead time). This supply infrastructure would be able to cover its costs through the revenues from
2 In May 2004, NTPC was successful in sourcing Natural Gas for its 2,600 MW proposed gas based power capacity additions at Kawas and Gandhar in Gujarat through a global tender from two different sources, viz., Reliance Industries Ltd which won the bid and Petronas which lost out after providing a compliant bid. NTPC and Reliance Industries Ltd are in the process of negotiating and finalizing the definitive Gas Sales Agreement. In April-05, Shell commissioned its receipt and re-gasification terminal at Hazira in Gujarat with estimated capacity of 2.5 million tones per annum which is sufficient to support the generation of ~2,500MW. This terminal of Shell Hazira was not being utilized at high capacity due to the high gas prices, which are unaffordable in India in respect of new users of such gas. Therefore it can be said that a capacity of ~5,000 MW which is more than four times the capacity of the project activity has sourced gas/ could have sourced gas in Gujarat in the period before and immediately following the start of real action on the project activity.

PROJECT DESIGN DOCUMENT FORM (CDM PDD) - Version 03.1. CDM – Executive Board page 12
Sr. No. Requirements as per Baseline Methodology
Why applicable to this Project Activity
the electricity generated using such infrastructure’s natural gas (including LNG) supplies3.
• Kogas (South Korea) has been successful in sourcing 17.2 mmscmd of gas in the last few years (6 mmcmd from Petronas, 5.2 mmcmd from Yemen LNG project and 6 mmscmd from Shell’s East Russian Sakhalin Island Venture.4 Recently the Shanghai (China) LNG regasification terminal has sourced three million tonnes per annum (approx. 12 mmscmd) of LNG from Petronas Malaysia 5. The above sourcing in South East Asia (in the neighborhood of India) are capable of firing more than 7000 MW of gas based combined cycle power plants.
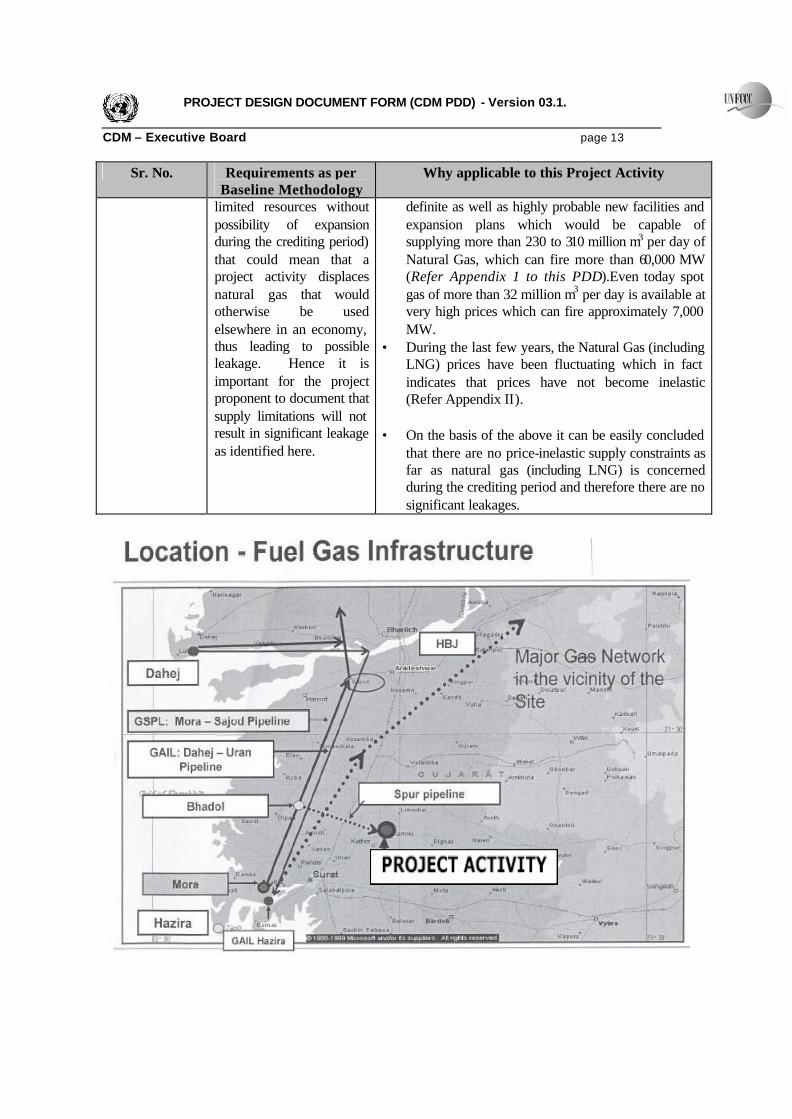
• The project activity is located in the state of Gujarat where sufficient gas grid is available ( see map at the end of this section B.2).
In the context of the above, it can be concluded beyond any reasonable doubt that the availability of natural gas to any future gas based power capacity additions comparable in size to the project activity is not constrained by the use of natural gas (including LNG) in the project activity. The constraint that is currently being faced by such projects is not the lack of natural gas availability but high prices of natural gas.
Sub Condition No.1.
Natural gas should be primary fuel. Small amounts of other startup or auxiliary fuels should be used, but can comprise no more than 1% of total fuel use.
The project activity is designed for exclusive firing by Natural Gas (including LNG).
Sub Condition No.2.
In some situations, there could be price-inelastic supply constraints (e.g.,
• During the period 2008 (the beginning of the crediting period) to 2010/2011 and thereafter (during the balance period of the crediting period) there are
3 For example, the cost of such gas supply infrastructure comprising the re-gasification terminal and the permissible 100 km pipeline connecting it to a power plant comparable in size to the project activity (allocable for such project activity based on re-gasification capacity required for the project activity) would be approximately 16% of the cost of such new gas fired combined cycle power plant. 4 www.petroleumnews.net News dated 18th May, 2005, Nell Ritchie, New Zealand. 5 http://thestar.com.my/news/story.asp?file=/2006/10/31/nation/15868615&sec=nation
PROJECT DESIGN DOCUMENT FORM (CDM PDD) - Version 03.1. CDM – Executive Board page 13
Sr. No. Requirements as per Baseline Methodology
Why applicable to this Project Activity
limited resources without possibility of expansion during the crediting period) that could mean that a project activity displaces natural gas that would otherwise be used elsewhere in an economy, thus leading to possible leakage. Hence it is important for the project proponent to document that supply limitations will not result in significant leakage as identified here.
definite as well as highly probable new facilities and expansion plans which would be capable of supplying more than 230 to 310 million m3 per day of Natural Gas, which can fire more than 60,000 MW (Refer Appendix 1 to this PDD).Even today spot gas of more than 32 million m3 per day is available at very high prices which can fire approximately 7,000 MW.
• During the last few years, the Natural Gas (including LNG) prices have been fluctuating which in fact indicates that prices have not become inelastic (Refer Appendix II).
• On the basis of the above it can be easily concluded
that there are no price-inelastic supply constraints as far as natural gas (including LNG) is concerned during the crediting period and therefore there are no significant leakages.

PROJECT DESIGN DOCUMENT FORM (CDM PDD) - Version 03.1. CDM – Executive Board page 14 B.3. Description of the sources and gases included in the project boundary The spatial extent of the project boundary as indicated below comprise the project site (including its intake well site and approach road) and all power plants connected physically to the baseline grid that the CDM project power plant is connected to.
Power generation by project activity
Power generation by existing
capacities and capacity additions in the baseline grid (i.e., Western
Regional Electricity Grid of India)
Project Boundary
The GHG emission sources applicable to this project activity that are within the project boundary are mentioned below. Source Gas Included? Justification / Explanation
CO2 Yes Main emission source. CH4 No Excluded for simplification in
accordance with AM0029. This is conservative.
Baseline Power Generation in the Build Margin in the Western Regional Electricity Grid
N2O No Excluded for simplification in accordance with AM0029. This is conservative.
CO2 Yes Main emission source. CH4 No Excluded for simplification in
accordance with AM0029.
Project Activity On-site natural gas combustion in the three Blocks
N2O No Excluded for simplification in accordance with AM0029.
Gas transportation facility are not included within the project boundary and is covered under leakage calculations.
PROJECT DESIGN DOCUMENT FORM (CDM PDD) - Version 03.1. CDM – Executive Board page 15 B.4. Description of how the baseline scenario is identified and description of the identified baseline scenario:
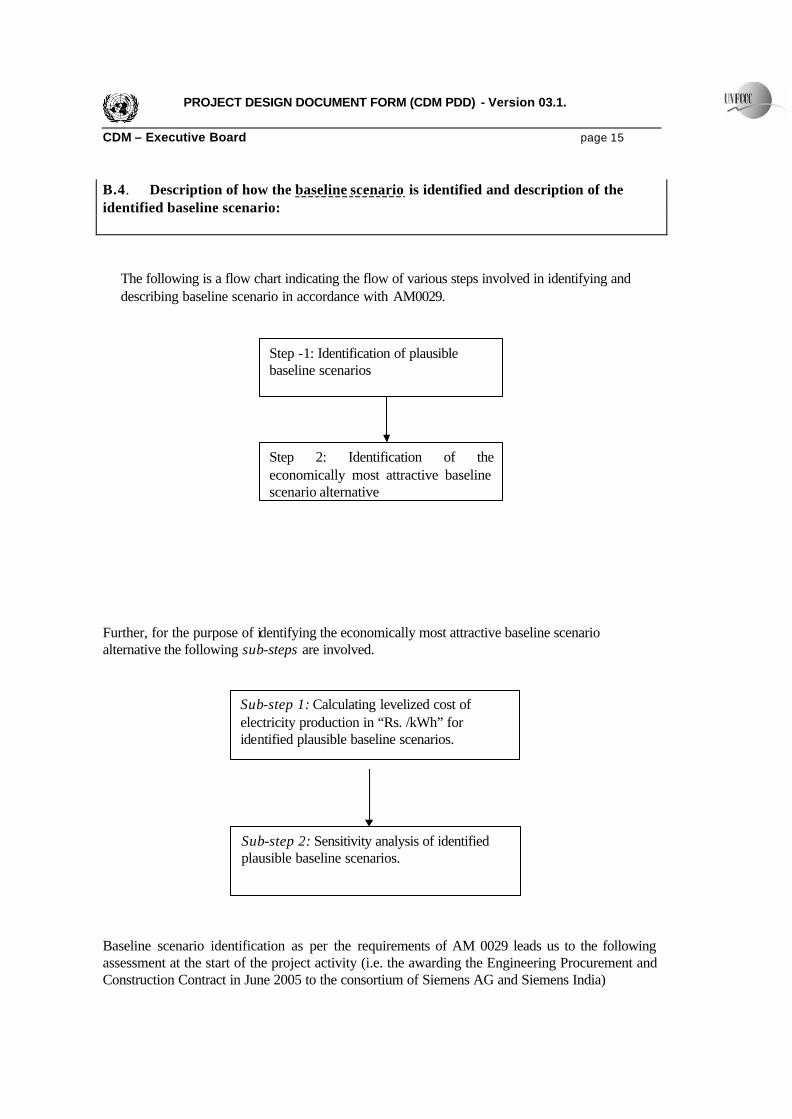
The following is a flow chart indicating the flow of various steps involved in identifying and describing baseline scenario in accordance with AM0029.
Further, for the purpose of identifying the economically most attractive baseline scenario alternative the following sub-steps are involved. Baseline scenario identification as per the requirements of AM 0029 leads us to the following assessment at the start of the project activity (i.e. the awarding the Engineering Procurement and Construction Contract in June 2005 to the consortium of Siemens AG and Siemens India)
Step -1: Identification of plausible baseline scenarios
Step 2: Identification of the economically most attractive baseline scenario alternative
Sub-step 1: Calculating levelized cost of electricity production in “Rs. /kWh” for identified plausible baseline scenarios.
Sub-step 2: Sensitivity analysis of identified plausible baseline scenarios.

PROJECT DESIGN DOCUMENT FORM (CDM PDD) - Version 03.1. CDM – Executive Board page 16 Step 1: Identification of plausible baseline scenarios Table-1
Potential Baseline Scenario
Does it deliver outputs and
services comparable to
project activity?
Is it permitted by applicable regulations?
Is the alternative ‘Realistic and
Credible’?
Conclusion
A) Project activity not implemented as a CDM project, activity i.e., 1,147.5 MW gas based CCPP with 57% efficiency at 100% load under standard operating conditions) and lifetime of 15 years6
Yes Yes Yes Plausible baseline scenario
B) Power generation using Natural Gas but technologies other than the project activity. i.e. 1050 MW gas based based combined cycle power plant with 52.5% efficiency (at 100% load factor under standard operating conditions) and lifetime of 15 years (Sources: Same as above) .
Yes Yes Yes Plausible baseline scenario
C) Power generation technologies using energy sources other than Natural gas
6 Sources: 2004-05 GTW handbook and Appendix-II CERC guidelines for tariff calculations- www.cercind.org.

PROJECT DESIGN DOCUMENT FORM (CDM PDD) - Version 03.1. CDM – Executive Board page 17
Potential Baseline Scenario
Does it deliver outputs and
services comparable to
project activity?
Is it permitted by applicable regulations?
Is the alternative ‘Realistic and
Credible’?
Conclusion
(1) Wind source (750 Nos. 1.5 MW wind turbines with a life of 20 years) - (Source: “Research made by the Canadian Energy Research Institute-Augest2005.”
No
• Cannot deliver base load power throughout the year on a continuous basis.
• Capacity factor is very low.
• Wind power delivers only 17% capacity factor on an average.
Yes
No
• Wind flow is not available throughout the year.
• Also wind based generation is possible only in a few places with wind potential.
• Due to low and unpredictable capacity factor, wind based power is not a realistic and credible baseline scenario
Not a plausible baseline scenario.
C) Power generation technologie s using energy sources other than Natural gas (2) 1147.5 MW solar thermal parabolic trough power plant
No • Cannot provide
base load power throughout the year on continuous basis
Yes
No • Solar energy not
available throughout the year
• Cannot provide the quantum of power contemplated
• Solar thermal plant construction in Rajasthan has been discussed for over 20 years without any outcome despite availability of concessional funds (www.infraline.com)
Not a plausible baseline scenario
C) Power generation technologies using
PROJECT DESIGN DOCUMENT FORM (CDM PDD) - Version 03.1. CDM – Executive Board page 18
Potential Baseline Scenario
Does it deliver outputs and
services comparable to
project activity?
Is it permitted by applicable regulations?
Is the alternative ‘Realistic and
Credible’?
Conclusion
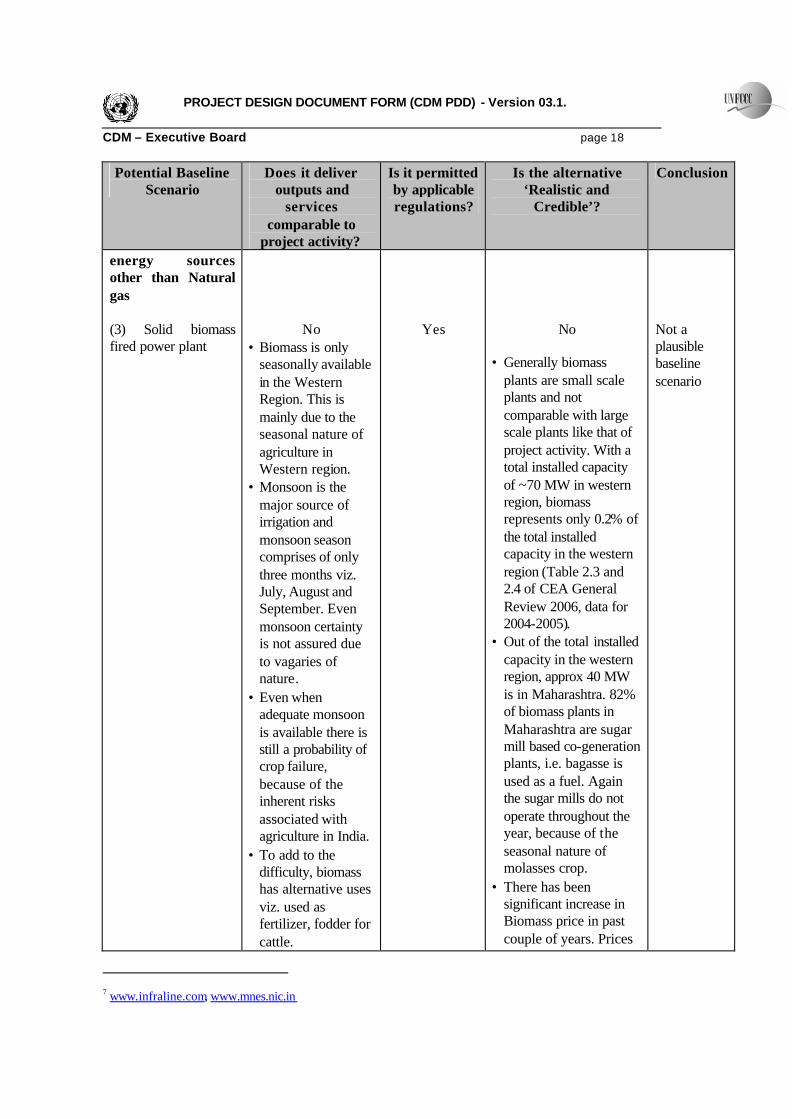
energy sources other than Natural gas (3) Solid biomass fired power plant
No • Biomass is only
seasonally available in the Western Region. This is mainly due to the seasonal nature of agriculture in Western region.
• Monsoon is the major source of irrigation and monsoon season comprises of only three months viz. July, August and September. Even monsoon certainty is not assured due to vagaries of nature.
• Even when adequate monsoon is available there is still a probability of crop failure, because of the inherent risks associated with agriculture in India.
• To add to the difficulty, biomass has alternative uses viz. used as fertilizer, fodder for cattle.
Yes
No
• Generally biomass plants are small scale plants and not comparable with large scale plants like that of project activity. With a total installed capacity of ~70 MW in western region, biomass represents only 0.2% of the total installed capacity in the western region (Table 2.3 and 2.4 of CEA General Review 2006, data for 2004-2005).
• Out of the total installed capacity in the western region, approx 40 MW is in Maharashtra. 82% of biomass plants in Maharashtra are sugar mill based co-generation plants, i.e. bagasse is used as a fuel. Again the sugar mills do not operate throughout the year, because of the seasonal nature of molasses crop.
• There has been significant increase in Biomass price in past couple of years. Prices
Not a plausible baseline scenario
7 www.infraline.com, www.mnes.nic.in

PROJECT DESIGN DOCUMENT FORM (CDM PDD) - Version 03.1. CDM – Executive Board page 19
Potential Baseline Scenario
Does it deliver outputs and
services comparable to
project activity?
Is it permitted by applicable regulations?
Is the alternative ‘Realistic and
Credible’?
Conclusion
(www.teri.res.in/teriin/terragreen/issue14/essay.htm )
• Also there doesn’t exist any organised market like that of coal or gas, from where biomass can be sourced.
• Biomass can not be stored for long time due to CH4 generation and therefore it’s not possible to hold ample stock of biomass.
Hence on the basis of the above analysis it is crystal clear that basic availability and in particular continued availability of bio-mass is in question and power generation based on biomass cannot provide base load power throughout the year and therefore, the bio-mass scenario does not offer outputs and services comparable to the project activity
have risen from Rs.350/MT in 2004 to Rs.1150/MT in 2006. Such increase in prices indicates that supply is limited and there are competing uses for the biomass. With the price of Bio-mass touching heights, further fuel supply can only come from non-renewable source such as forests which raises the threats of deforestation, and loss of habitat and biodiversity.
As biomass scenario cannot deliver outputs and services similar to the project activity neither in terms of baseload power nor in terms of size and as further supply can cause destruction of precious forests and due to reasons contained under this column as well as preceding column this scenario is not realistic and credible.7
PROJECT DESIGN DOCUMENT FORM (CDM PDD) - Version 03.1. CDM – Executive Board page 20
Potential Baseline Scenario
Does it deliver outputs and
services comparable to
project activity?
Is it permitted by applicable regulations?
Is the alternative ‘Realistic and
Credible’?
Conclusion
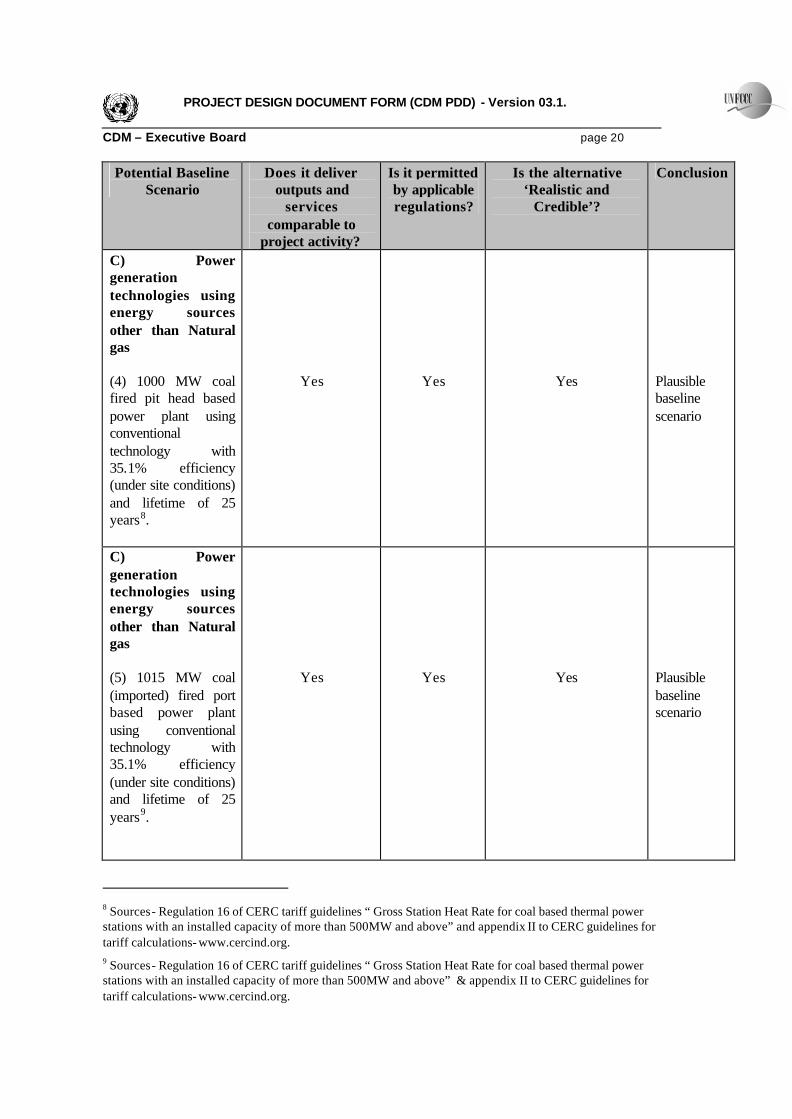
C) Power generation technologies using energy sources other than Natural gas (4) 1000 MW coal fired pit head based power plant using conventional technology with 35.1% efficiency (under site conditions) and lifetime of 25 years8.
Yes
Yes
Yes
Plausible baseline scenario
C) Power generation technologies using energy sources other than Natural gas (5) 1015 MW coal (imported) fired port based power plant using conventional technology with 35.1% efficiency (under site conditions) and lifetime of 25 years9.
Yes
Yes
Yes
Plausible baseline scenario
8 Sources- Regulation 16 of CERC tariff guidelines “ Gross Station Heat Rate for coal based thermal power stations with an installed capacity of more than 500MW and above” and appendix II to CERC guidelines for tariff calculations- www.cercind.org. 9 Sources- Regulation 16 of CERC tariff guidelines “ Gross Station Heat Rate for coal based thermal power stations with an installed capacity of more than 500MW and above” & appendix II to CERC guidelines for tariff calculations- www.cercind.org.

PROJECT DESIGN DOCUMENT FORM (CDM PDD) - Version 03.1. CDM – Executive Board page 21
Potential Baseline Scenario
Does it deliver outputs and
services comparable to
project activity?
Is it permitted by applicable regulations?
Is the alternative ‘Realistic and
Credible’?
Conclusion
C) Power generation technologies using energy sources other than Natural gas (6) 1320 MW coal fired pit head based power plant using super critical boiler technology with 40% efficiency (at 100% load factor under standard operating conditions) and lifetime of 25 years10.
Yes
Yes
Yes
Plausible baseline scenario
C) Power generation technologies using energy sources other than Natural gas (7) 1320 MW coal (imported) fired port based power plant using super critical boiler technology with 40% efficiency (at 100% load factor under standard operating conditions) and lifetime of 25 years11.
Yes
Yes
Yes
Plausible baseline scenario
10 Sources- Collected from the report of the committee to recommend next higher size of coal fired thermal power plant- issued by CEA, Ministry of Power, Government of India - www.cea.nic.in & appendix II to CERC guidelines – www.cercind.org. 11 Sources- Collected from the report of the committee to recommend next higher size of coal fired thermal power plant- issued by CEA, Ministry of Power, Government of India - www.cea.nic.in & appendix II to CERC guidelines – www.cercind.org.

PROJECT DESIGN DOCUMENT FORM (CDM PDD) - Version 03.1. CDM – Executive Board page 22
Potential Baseline Scenario
Does it deliver outputs and
services comparable to
project activity?
Is it permitted by applicable regulations?
Is the alternative ‘Realistic and
Credible’?
Conclusion
C) Power generation technologies using energy sources other than Natural gas (8) 1000 MW Lignite fired power generation plant with 32.80% efficiency (under site conditions) and life time of 25 years.12
Yes
Yes
Yes
Plausible baseline scenario.
C) Power generation technologies using energy sources other than Natural gas (9) 1147.5 MW reservoir based hydro power plant with a lifetime of 35 years13.
No • Does not deliver
base load power due to seasonal monsoon rainfall regime (See also note 1)
Yes
No • In the baseline grid
almost all available sites for large scale reservoir based power plant have been taken up. Further site development is not possible due to public resistance mainly on account of rehabilitation and the resettlement of the affected people (e.g. Sardar Sarovar, Indrasagar, Bansagar dams, as per www.infraline.com).
Not a plausible baseline scenario.
12 Note two to Regulation 16(iii) of the CERC tariff guidelines and Appendix II to CERC tariff guidelines. 13 Ministry of Power- http://powermin.nic.in/generation/renovation_mordernization_hydel.htm. 14 Hydro Sector Development in India (Growth & Investment Opportunities) –By R.V. Shahi, Secretary, Ministry of Power, Government of India.

PROJECT DESIGN DOCUMENT FORM (CDM PDD) - Version 03.1. CDM – Executive Board page 23
Potential Baseline Scenario
Does it deliver outputs and
services comparable to
project activity?
Is it permitted by applicable regulations?
Is the alternative ‘Realistic and
Credible’?
Conclusion
• Also repeated silt formation leads to reduced or nil power generation even in monsoon, where water supply is copious (www.infraline.com)
• Hydro power is for meeting peak load requirement14.
• Only 816MW of capacity were ranked under “A” category for development in the baseline grid by Ministry of Power, Govt. of India based on various parameters.(Source: http://www.powermin.nic.in/informationcenter/pdf/50000MWHydroelectricInitiatives.pdf)

PROJECT DESIGN DOCUMENT FORM (CDM PDD) - Version 03.1. CDM – Executive Board page 24
Potential Baseline Scenario
Does it deliver outputs and
services comparable to
project activity?
Is it permitted by applicable regulations?
Is the alternative ‘Realistic and
Credible’?
Conclusion
C) Power generation technologies using energy sources other than Natural gas (10) Cluster of 20 MW of run of river (ROR) hydro power plants with a lifetime of 35 years (Ministry of Power- http://powermin.nic.in/generation/renovation_mordernization_hydel.htm).
No • Does not generally
deliver base load power due to seasonal monsoon rainfall regime (See note 1)
Yes
No • Hydro power is for
meeting peak load requirement 15.
• Only 816MW of capacity were ranked under “A” category for development in the baseline grid by Ministry of Power, Govt. of India based on various parameters.(Source: http://www.powermin.nic.in/informationcenter/pdf/50000MWHydroelectricInitiatives.pdf)
Not a plausible baseline scenario
C) Power generation technologies using energy sources other than Natural gas (11) 2*540 MW Nuclear reactor based power plant with a lifetime of 40 years16.
Yes
No for all
Stakeholders including the
Project Activity
No Due to almost full exhaustion of indigenous uranium sources and the impossibility of imports,
Not a plausible baseline scenario
15 Hydro Sector Development in India (Growth & Investment Opportunities ) – By R.V.Shahi, Secretary, Ministry of Power, Government of India July, 2003. 16 Uranium Information Centre –http://www.uic.au/nip19.htm 17 (Atomic Energy Act, 1962 & news letter issued by Business Line-http://www.blonnet.com/2006/05/22/ stories/2006052202930300.hmt)

PROJECT DESIGN DOCUMENT FORM (CDM PDD) - Version 03.1. CDM – Executive Board page 25
Potential Baseline Scenario
Does it deliver outputs and
services comparable to
project activity?
Is it permitted by applicable regulations?
Is the alternative ‘Realistic and
Credible’?
Conclusion
except for Nuclear Power Corporation of India, an 100%
Government owned
company This scenario is available only to Nuclear Power Corporation of India Limited, a 100% Government of India owned Company17. whose capacity additions are driven by the Government of India initiatives based on its long term strategic programmes and not by the project activity. It may be pertinent to note here that Nuclear Power Corporation of India is under the administrative control of
expansion of nuclear power generation is not possible18 and hence this scenario is not realistic and credible. The lead time for a nuclear power plant is very high at 8-10 years as against 3-4 years for a gas based or a coal based plant. Also such lead times face the risk of getting stretched due to possible public protests against the harm that may be caused by radiations. The lead times of a Nuclear Plant is almost more than double than that of gas based plants Hence for above reasons this alternative baseline scenario is not realistic and credible.
18 1) www.uic.com ,2) www.science.org.au/nova/002/002key.htm, 3) http://news.softpedia.com/news/australia-not-to-sell-uranium-to-india-19090.shtml, 4) www.hinduonnet.com, 5) www.wisconsinproject.org,6) www.npcil.nic.in

PROJECT DESIGN DOCUMENT FORM (CDM PDD) - Version 03.1. CDM – Executive Board page 26
Potential Baseline Scenario
Does it deliver outputs and
services comparable to
project activity?
Is it permitted by applicable regulations?
Is the alternative ‘Realistic and
Credible’?
Conclusion
Department of Atomic Energy, whereas the other Government of India owned companies in power sector are under the administrative control of Ministry of Power. Also Nuclear Power Corporation is not governed by the Indian Electricity Act, 2003 and is not subject to jurisdiction of Indian Electricity Regulatory Commissions. Hence the scenario is not legally available to any stakeholder including the project participant except for Nuclear Power Corporation of India
C) Power generation technologies using

PROJECT DESIGN DOCUMENT FORM (CDM PDD) - Version 03.1. CDM – Executive Board page 27
Potential Baseline Scenario
Does it deliver outputs and
services comparable to
project activity?
Is it permitted by applicable regulations?
Is the alternative ‘Realistic and
Credible’?
Conclusion
energy sources other than Natural gas (12) Cluster of 20 power plants of 50 MW using diesel with 42% efficiency and lifetime of 15 years19.
Yes
Yes
Yes
Plausible baseline scenario
C) Power generation technologies using energy sources other than Natural gas (13) Electricity Imports from Pakistan
Yes
No
No • Political conflict
between India and Pakistan
• Power shortage in Pakistan (Pakistan Business News- Pak Tribune-www.paktribune.com).
Not a plausible baseline scenario
C) Power generation technologies using energy sources other than Natural gas (14) Electricity Imports from other Indian grids
No • Electricity Import
from other regional grids in India is not possible at all times as these grids are
Yes
No As this scenario does not deliver output and services comparable to the project activity and as there are significant
Not a plausible baseline scenario.
19 Appendix –II CERC guidelines for tariff calculations and http://mnes.nic.in/baselinepdfs/annexure2c.pdf
.

PROJECT DESIGN DOCUMENT FORM (CDM PDD) - Version 03.1. CDM – Executive Board page 28
Potential Baseline Scenario
Does it deliver outputs and
services comparable to
project activity?
Is it permitted by applicable regulations?
Is the alternative ‘Realistic and
Credible’?
Conclusion
suffering from shortages to meet their energy demand and in particular the peak demand. The monthly average peak deficit for the year 2004-05 being (as contained in Note-2): Northern Region – 9.1% deficit; Eastern Region – 2.5% deficit; North-Eastern Region –13.6% deficit; Southern Region – 2.5% deficit and Western Region – 20.3 % deficit
• Such peak deficits occur in all months of the year as is demonstrated in Note-2 below.
• Electricity Imports are possible only in periods of temporary surplus from these other regional grids and in particular from the Eastern Regional grid.
• It can be concluded from the above that Imports do not deliver base-load power and therefore there is no denying the fact
transmission constraints, this scenario is not realistic and credible.

PROJECT DESIGN DOCUMENT FORM (CDM PDD) - Version 03.1. CDM – Executive Board page 29
Potential Baseline Scenario
Does it deliver outputs and
services comparable to
project activity?
Is it permitted by applicable regulations?
Is the alternative ‘Realistic and
Credible’?
Conclusion
that Imports do not deliver the output and services comparable to the project activity.
Note 1: The details of hydro power projects and their Plant Load Factor are as follows:
Particulars 2002-03 2003-04 2004-05 No. of projects in western region (Annex- 2.1 to “Performance Review of Hydro Power stations in 2004-05 and 2003-04, & www.infraline.com)
40 42 46
Installed capacity.(Annex- 2.1 to “Performance Review of Hydro Power stations in 2004-05 and 2003-04, & www.infraline.com)
4386.30 4899.80 5757.80
Avg. Plant Load Factor (%) (Annex- 2.1 to “Performance Review of Hydro Power stations in 2004-05 and 2003-04, &www.Infraline.com).
22 22 21
Projects having Plant Load Factor>50% 2 (99 MW) 1 (90 MW) 1 (90 MW) The hydro plants cannot be considered as base load plants for the following reasons:- a) The average Plant Load Factor of the hydro plants in western region in 2002-03, 2003-04 and
2004-05 was only 22%, 22% and 21% respectively. b) The installed capacity of projects achieving at least 50% Plant Load Factor in a year (base
load plants are expected to achieve a Plant Load Factor of above 60%) is only approx. 2 % of the entire hydro capacity in western region.
c) An analysis of the projects having over 50% Plant Load Factor in either of the three years
i.e.2002-03, 2003-04 and 2004-05 (which are two projects having an aggregate capacity of 99MW), shows that there is a wide divergence in the monthly plant load factor over different months of the same year i.e. around 50%. This shows that monthly Plant Load Factor in hydro projects depends on seasonal factors viz. monsoon during which time there are copious

PROJECT DESIGN DOCUMENT FORM (CDM PDD) - Version 03.1. CDM – Executive Board page 30
water flows. The logical inference is that even those hydro projects having average Plant Load Factor above 50% cannot be considered as those providing base load electricity.

PROJECT DESIGN DOCUMENT FORM (CDM PDD) - Version 03.1.
CDM – Executive Board page 31
Note 2 - Peak Demand / Peak Met by Different Regions during the year 2004-05 Month Apr-04 May-04 Jun-04 Jul-04 Aug-04 Sep-04 Oct-04 Nov-04 Dec-04 Jan-05 Feb-05 Mar-05 Average
Region Northern Region Peak Demand 23466 24247 25654 26834 24757 26829 24457 25015 25373 25095 24407 23180 24943 Peak Met 22014 22729 23952 24125 22971 23752 21325 22890 22764 22316 21731 21583 22679 Surplus/(Deficit) (MW) (1452) (1518) (1702) (2709) (1786) (3077) (3132) (2125) (2609) (2779) (2676) (1597) (2264) Surplus/(Deficit) (%) (6.2) (6.3) (6.6) (10.1) (7.2) (11.5) (12.8) (8.5) (10.3) (11.1) (11.0) (6.9) (9.1) Western Region Peak Demand 29859 27835 26589 26650 25090 28904 28834 30414 31085 30084 30361 30732 28870 Peak Met 23380 22681 21316 21560 20809 24049 23834 24005 23400 23096 23868 24128 23011 Surplus/(Deficit) (MW) (6479) (5154) (5273) (5090) (4281) (4855) (5000) (6409) (7685) (6988) (6493) (6604) (5859) Surplus/(Deficit) (%) (21.7) (18.5) (19.8) (19.1) (17.1) (16.8) (17.3) (21.1) (24.7) (23.2) (21.4) (21.5) (20.3) Southern Region Peak Demand 23075 19236 21607 20934 21026 20564 20577 20431 21842 21506 22528 22809 21345 Peak Met 21928 18904 20483 20861 20673 20299 20331 20184 20622 20954 22051 22364 20805 Surplus/(Deficit) (MW) (1147) (332) (1124) (73) (353) (265) (246) (247) (1220) (552) (477) (445) (540) Surplus/(Deficit) (%) (5.0) (1.7) (5.2) (0.3) (1.7) (1.3) (1.2) (1.2) (5.6) (2.6) (2.1) (2.0) (2.5) Eastern Region Peak Demand 8286 8224 8027 7993 8148 8123 8340 8231 8445 8489 8480 8816 8300 Peak Met 7895 7606 7765 7837 8071 8099 8320 8046 8250 8371 8310 8533 8092 Surplus/(Deficit) (MW) (391) (618) (262) (156) (77) (24) (20) (185) (195) (118) (170) (283) (208) Surplus/(Deficit) (%) (4.7) (7.5) (3.3) (2.0) (0.9) (0.3) (0.2) (2.2) (2.3) (1.4) (2.0) (3.2) (2.5) North-Eastern Region Peak Demand 1225 1211 1231 1247 1221 1195 1211 1221 1161 1272 1226 1263 1224 Peak Met 1029 1022 1082 1068 1104 1082 1128 1087 1045 995 995 1044 1057 Surplus/(Deficit) (MW) (196) (189) (149) (179) (117) (113) (83) (134) (116) (277) (231) (219) (167) Surplus/(Deficit) (%) (16.0) (15.6) (12.1) (14.4) (9.6) (9.5) (6.9) (11.0) (10.0) (21.8) (18.8) (17.3) (13.6)

PROJECT DESIGN DOCUMENT FORM (CDM PDD) - Version 03.1.
CDM – Executive Board page 32
Month Apr-04 May-04 Jun-04 Jul-04 Aug-04 Sep-04 Oct-04 Nov-04 Dec-04 Jan-05 Feb-05 Mar-05 Average Region All India Peak Demand 85911 80753 83108 83658 80242 85615 83419 85312 87906 86446 87002 86800 84681 Peak Met 76246 72942 74598 75451 73628 77281 74938 76212 76081 75732 76955 77652 75643 Surplus/(Deficit) (MW) (9665) (7811) (8510) (8207) (6614) (8334) (8481) (9100) (11825) (10714) (10047) (9148) (9038) Surplus / (Deficit) (%) (11.3) (9.7) (10.2) (9.8) (8.2) (9.7) (10.2) (10.7) (13.5) (12.4) (11.5) (10.5) (10.7) (Source: Central Electricity Authority India)

PROJECT DESIGN DOCUMENT FORM (CDM PDD) - Version 03.1. CDM – Executive Board page 33 Step 2: Identify the economically most attractive baseline scenario alternative Sub Step -1: Calculating levelized cost of electricity production in “Rs./kWh” for identified plausible baseline scenarios. From the discussions above it is found that the following are the plausible baseline scenarios. A. Project activity not implemented as a CDM project, i.e. 1147.5 MW gas based combined cycle power plant with advance class gas turbine. B. Power Generation using natural gas but technology other than the project activity (i.e. 1050 MW gas based CCPP) C. Power generation technologies using energy sources other than Natural Gas: 1. 1,000MW coal fired pit head based power plant using conventional technology. 2. 1015 MW coal (imported) fired port based power plant using conventional technology. 3. 1,320 MW coal fired pit based power plant using super critical boiler technology. 4. 1,320 MW coal (imported) fired port based power plant using super critical boiler technology. 5. Cluster of 20 power plants of 50 MW each, using diesel. 6. 1000 MW Lignite fired power generation plant. These plausible baseline scenarios are evaluated on the basis of economic attractiveness using levelized cost of electricity production in Rs./kWh. Table 2 below shows the assumptions for calculating levelized cost of the identified plausible baseline options:
Table 2: A. General Assumptions for all types of projects: Sr.No. Particulars Detail Source 1 Debt : Equity ratio 70:30 2 Plant Load Factor 80% 3 Incentive payable for
generation above normative level
0.25 Rs./ kWh
4 Permissible increase in O & M
4% p.a.
5 Return on Equity allowed 14% p.a. 6 Advance against
Depreciation limited to years
10
7 Deprecation limited to 90%
Central Electricity Regulatory Commission (Terms & conditions of Tariff) Regulations, 2004 (www.cerc ind.org)

PROJECT DESIGN DOCUMENT FORM (CDM PDD) - Version 03.1. CDM – Executive Board page 34 Sr.No. Particulars Detail Source 8 Depreciation Rate Straight line method of
depreciation, 6% for gas and diesel and 3.6% for coal.
9 Rate of interest on working capital borrowing
10.25% Central Electricity Regulatory Commission (Terms & conditions of Tariff) Regulations, 2004 (www.cerc ind.org)
10 Corporate Tax Rate (including surcharge)
33.66%
11 Minimum Alternate Tax (including surcharge)
8.415%
12 Tax Holiday benefits (Sec.80 IA)
100% deduction of profits derived for any consecutive 10 years out of first 15 year period.
13 Tax Depreciation Rate 35% for 1st year & 15 % thereafter (WDV Basis)
Income Tax Act, 1961 for assessment year 2006-07 (as stipulated for the accounting year
2005-06)
14 Tenure and Interest rate on long term loan
Project period +12 years, 7.25 % Interest Rate
As offered by Power Finance Corporation
15 USD Exchange rate on 8th June, 2005.
43.53 Rs/USD RBI website (http://www.rbi.org.in/scripts/ReferenceRateArchive.aspx)
16 Rate of Depreciation of Rupees against USD
3.0% p.a. Based on period over 10 years (http://www.oanda.com/convert/fxhistory)
B General assumptions for Gas Based Projects Sr.No
. Particulars Detail Source
1 Auxiliary consumption 3%
2 Heat Rate 1,850 kCal (7.7441 Mega Joules) /kWh- for combined cycle (Advance class) 1,950 kCal (8.163 Mega Joules)/kWh- for combined cycle (E class etc)
3 O & M charges 0.877 million Rs/ MW for year 2007-08 with 4 % p.a. escalation
Central Electricity Regulatory Commission (Terms & conditions of Tariff) Regulations, 2004 (www.cercind.org)
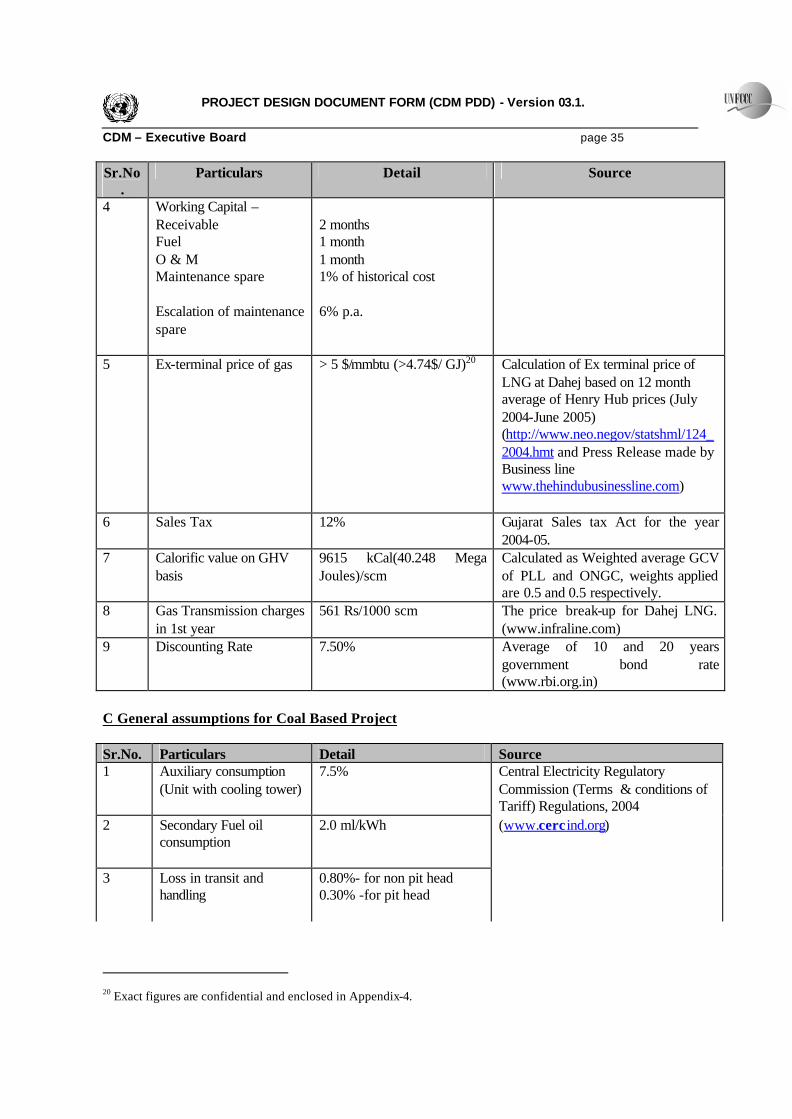
PROJECT DESIGN DOCUMENT FORM (CDM PDD) - Version 03.1. CDM – Executive Board page 35 Sr.No
. Particulars Detail Source
4 Working Capital – Receivable Fuel O & M Maintenance spare Escalation of maintenance spare
2 months 1 month 1 month 1% of historical cost 6% p.a.
5 Ex-terminal price of gas > 5 $/mmbtu (>4.74$/ GJ)20 Calculation of Ex terminal price of LNG at Dahej based on 12 month average of Henry Hub prices (July 2004-June 2005) (http://www.neo.negov/statshml/124_2004.hmt and Press Release made by Business line www.thehindubusinessline.com)
6 Sales Tax 12% Gujarat Sales tax Act for the year 2004-05.
7 Calorific value on GHV basis
9615 kCal(40.248 Mega Joules)/scm
Calculated as Weighted average GCV of PLL and ONGC, weights applied are 0.5 and 0.5 respectively.
8 Gas Transmission charges in 1st year
561 Rs/1000 scm The price break-up for Dahej LNG. (www.infraline.com)
9 Discounting Rate 7.50% Average of 10 and 20 years government bond rate (www.rbi.org.in)
C General assumptions for Coal Based Project Sr.No. Particulars Detail Source 1 Auxiliary consumption
(Unit with cooling tower) 7.5%
2 Secondary Fuel oil consumption
2.0 ml/kWh
3 Loss in transit and handling
0.80%- for non pit head 0.30% -for pit head
Central Electricity Regulatory Commission (Terms & conditions of Tariff) Regulations, 2004 (www.cerc ind.org)
20 Exact figures are confidential and enclosed in Appendix-4.

PROJECT DESIGN DOCUMENT FORM (CDM PDD) - Version 03.1. CDM – Executive Board page 36 Sr.No. Particulars Detail Source 4 O & M charges
(applicable to units with installed capacity of more than 500MW)
Rs. 1.052 million/ MW- for year 2007-08 with 4 % p.a. escalation
5 Working Capital - Receivable Fuel O & M Maintenance spare Escalation of maintenance spare Secondary fuel
2 months 1.5 month 1 month 1% of historical cost 6% p.a. 2 months
6 Heat Rate 2450 kCal (10.255 Mega Joules) /kWh- for coal based thermal plant with installed capacity of more than 500MW 2155 kCal (9.020 Mega Joules)/kWh for supercritical technology based plant
Central Electricity Regulatory Commission (Terms & conditions of Tariff) Regulations, 2004 (www.cerc ind.org) Based on efficiency (39.91%) given in “Report of the Committee to Recommend Next Higher Size of Coal Fired Thermal Power Stations” by CEA (Ministry of Power, Government of India), in November 2003. (Table -3)
7 Landed cost of diesel 32.83Rs./ litre IOC website: Diesel prices in Mumbai (http://www.iocl.com/Diesel_prices.aspx)
8 Gross Calorific value of fuel oil
10100 kCal (42.28 Mega Joules)/kg
C02 baseline Database for Indian Power Sector, December 2006. issued by Central Electricity Authority, Ministry of Power, Government of India.
9 Discounting Rate 7.64% Average of 20 years and 30 years Government Bond Rate (www.rbi.org.in)

PROJECT DESIGN DOCUMENT FORM (CDM PDD) - Version 03.1. CDM – Executive Board page 37 D Specific assumptions for CCPP comprising advance class gas turbine: Sr.No. Particulars Detail Source 1. Project Capacity 1147.50 MW EPC Contract placed in June, 2005 for
the project activity. 2. Project cost Rs. 30960 million Press Release during securitisation
dated 23rd September, 2004. 3. Cost/MW Rs.27 million /MW Derived based on Sr.No. 1 & 2 of this
table E Specific assumptions for Imported Coal using conventional technology: Sr.No. Particulars Detail Source 1. Project Capacity 1,015 MW 2 Project cost Rs. 43036 million 3 Cost/MW Rs. 42.4 million /MW 4 Landed cost of coal
per mt Dollar component: $ 47.63 INR component: Ø custom duty @5.2% Ø other charges -210
Rs/mt
5 Gross Calorific value 6200 kCal (25.95 Mega Joules)/kg
Tariff petition for Nagarjuna power project dated 11th April, 2005. Thermal project of over 1,000 MWh, as mega projects, have to approach to the Central electricity Regulatory Commission (CERC) for project cost approval. In compliance with this requirement Nagarjuna Power Project has filed a tariff petition on 11 April 2005 with CERC.
F Specific assumptions for Indigenous Coal using conventional technology Sr.No. Particulars Detail Source 1 Project Capacity 1000 MW 2 Project cost Rs. 42015 million 3 Cost/MW Rs. 42 million /MW
Project Monitoring Report of CEA(Ministry of Power, Government Of India)-NTPC- Vindhyachal Plant
4 Landed cost of coal per mt
Rs.1150 per MT (Break Up- Ex-terminal price of ROM coal : 720Rs/Mt Additional charges to make it steam coal : 165 Rs/Mt Royalty and Excise duty: 125Rs/Mt Sales tax @ 4% on above: 40 Rs/Mt Transmission cost: 100Rs/Mt)
Price Notification No. CIL: GM (F): Pricing: 289 dated 15.06.04 by Coal India Limited ( ‘E’ grade coal) plus royalty, transmission cost & Taxes
5 Gross Calorific value 3755 kCal (15.71Mega Joules)/kg
CO2 Baseline Database for the Indian Power Sector, December 2006, issued by Central Electricity Authority, Ministry of Power, Government of India

PROJECT DESIGN DOCUMENT FORM (CDM PDD) - Version 03.1. CDM – Executive Board page 38 Sr.No. Particulars Detail Source
(http://www.cea.nic.in/planning/c%20and%20e/Government%20of%20India%20website.htm).
G Specific assumptions for Indigenous Coal using Super critical boiler technology: Sr.No. Particulars Detail Source 1 Project Capacity 1320 MW Standard sizes 2 Project cost Rs.73920 million
Derived based on Sr. No. (1) and (3)
3 Cost/MW 56 million Rs./MW Vijayawada Stage IV quoted cost per MW (Online edition of Indian National papers including the Hindu, 2005).
4 Landed cost of coal Rs.1150/MT (Break Up- Ex-terminal price of ROM coal : 720 Rs/Mt Additional charges to make it steam coal : 165 Rs/Mt Royalty and Excise duty : 125Rs/Mt Sales tax @ 4% on above: 40 Rs/Mt Transmission cost : 100Rs/Mt)
Price Notification No. CIL: GM (F): Pricing: 289 dated 15.06.04 by Coal India Limited ( ‘E’ grade coal) plus royalty, transmission cost & Taxes.
5 Gross Calorific value 3755 kCal (15.72Mega Joules)/kg
CO2 Baseline Database for the Indian Power Sector, December 2006, issued by Central Electricity Authority, Ministry of Power, Government of India (http://www.cea.nic.in/planning/c%20and%20e/Government%20of%20India%20website.htm).
H Specific assumptions for Imported Coal using Super critical boiler technology: Sr.No. Particulars Detail Source 1 Project Capacity
1320 MW To make it comparable with project
activity 2 Project cost Rs.73920 million Derived based on Sr. No. (1) and (3) 3 Cost/MW Rs.56 million /MW Vijayawada Stage IV quoted cost per
MW (Online edition of Indian National papers including the Hindu, 2005).
4 Landed cost of coal/ mt Dollar component: $ 47.63 Tariff petition for Nagarjuna power
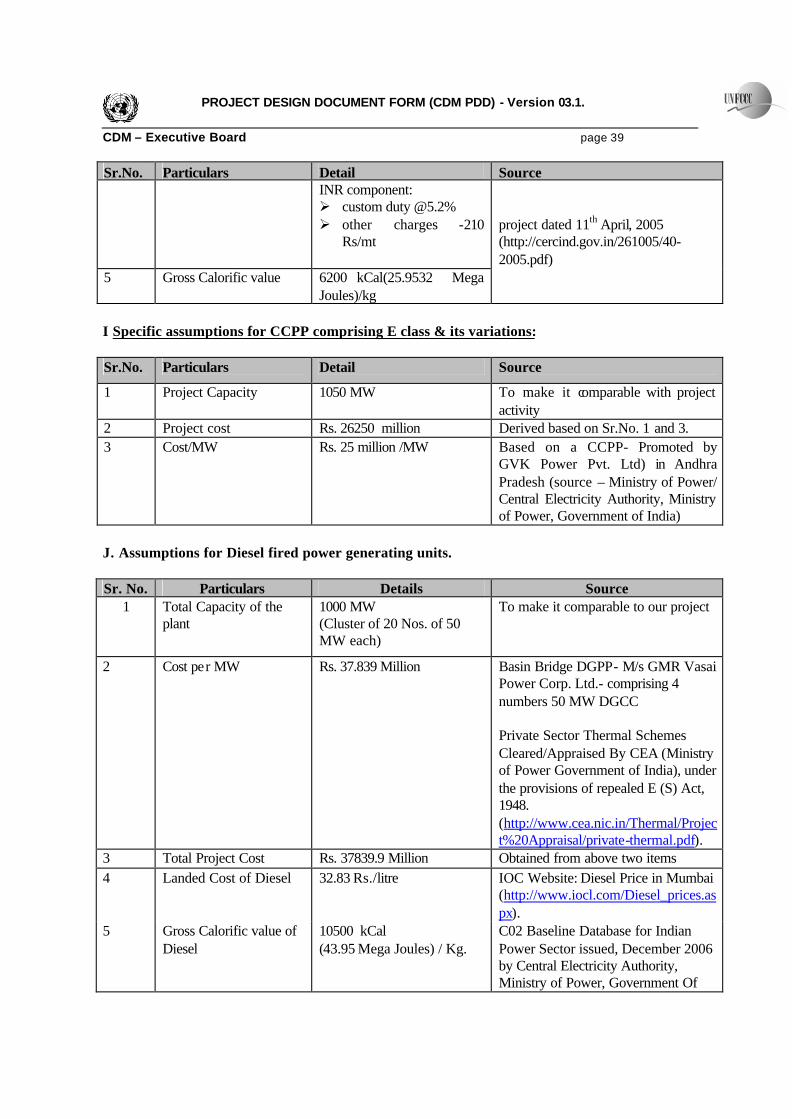
PROJECT DESIGN DOCUMENT FORM (CDM PDD) - Version 03.1. CDM – Executive Board page 39 Sr.No. Particulars Detail Source
INR component: Ø custom duty @5.2% Ø other charges -210
Rs/mt
5 Gross Calorific value 6200 kCal(25.9532 Mega Joules)/kg
project dated 11th April, 2005 (http://cercind.gov.in/261005/40-2005.pdf)
I Specific assumptions for CCPP comprising E class & its variations: Sr.No. Particulars Detail Source
1 Project Capacity 1050 MW To make it comparable with project activity
2 Project cost Rs. 26250 million Derived based on Sr.No. 1 and 3. 3 Cost/MW Rs. 25 million /MW Based on a CCPP- Promoted by
GVK Power Pvt. Ltd) in Andhra Pradesh (source – Ministry of Power/ Central Electricity Authority, Ministry of Power, Government of India)
J. Assumptions for Diesel fired power generating units. Sr. No. Particulars Details Source
1 Total Capacity of the plant
1000 MW (Cluster of 20 Nos. of 50 MW each)
To make it comparable to our project
2 Cost per MW
Rs. 37.839 Million
Basin Bridge DGPP- M/s GMR Vasai Power Corp. Ltd.- comprising 4 numbers 50 MW DGCC Private Sector Thermal Schemes Cleared/Appraised By CEA (Ministry of Power Government of India), under the provisions of repealed E (S) Act, 1948. (http://www.cea.nic.in/Thermal/Project%20Appraisal/private-thermal.pdf).
3 Total Project Cost Rs. 37839.9 Million Obtained from above two items 4 Landed Cost of Diesel 32.83 Rs./litre IOC Website: Diesel Price in Mumbai
(http://www.iocl.com/Diesel_prices.aspx).
5 Gross Calorific value of Diesel
10500 kCal (43.95 Mega Joules) / Kg.
C02 Baseline Database for Indian Power Sector issued, December 2006 by Central Electricity Authority, Ministry of Power, Government Of

PROJECT DESIGN DOCUMENT FORM (CDM PDD) - Version 03.1. CDM – Executive Board page 40 Sr. No. Particulars Details Source
India 6 Gross Heat Rate 2165.1 kCal (9.063 Mega
Joules)/KWh Ministry of Non-Conventional Energy Sources. (based on 1.05 * net heat rate) http://mnes.nic.in/baselinepdfs/annexure2c.pdf Grossing factor provided by:CO2 Baseline Database for Indian Power Sector, December 2006, issued by Central Electricity Authority, Ministry of Power Government of India,
7 Operating and Maintenance exp.
2.5% of the Project Cost. As per earlier norms stipulated by the Government of India in 1990.
8 Expected Life of the Project
15 years Appendix II to CERC guidelines for Tariff calculations, 2004 (www.cercind.org)
9 Working Capital Information.
a) Receivables: 2 Months. b) Fuel: 1 Month. c) O& M Exp.: 1 Month d) Maintenance Exp: 1 % of the historical cost, to be appreciated @6% p.a.
CERC Guidelines for Tariff calculations as is applicable in case of Gas Fired Power Generating Units. (www.cercind.org)
10 Auxiliary consumption 2% Based on expert opinion. 11 Discounting rate 7.5 Average of 10 and 20 years
government bond rate (www.rbi.org.in)
K. Specific assumptions for Lignite fired power generation plant Sr. No. Particulars Details Source 1 Project capacity 1000MW To make it comparable with the
project activity. 2 Cost Per Mega Watt Rupees 50 Million per MW Akrimota Lignite based TPP, Kutch
(www.infraline.com) 3 Lignite cost Rs.678/mt Weighted average price (weight
applied is the quantity supplied from different lignite extraction sites by Gujarat Minerals Development Corporation) at which Gujarat Minerals Development Corporation sold lignite in 2004-05 (www.gmdc.com)
4 Gross calorific value of Lignite
2724 Kcal/Kg ( 11.402 Mega joules per Kg)
General Review 2006, for year 2004-05 by Central Electricity Authority,

PROJECT DESIGN DOCUMENT FORM (CDM PDD) - Version 03.1. CDM – Executive Board page 41 Sr. No. Particulars Details Source
Ministry of Power, Government of India (table 6.3).
5 Loss in transit and handling
0.80%- for non pit head 0.30% -for pit head
Central Electricity Regulatory Commission (Terms & conditions of Tariff) Regulations, 2004 (www.cercind.org) Assumed similar to that of Coal based plant.
6 O&M cost for lignite based plants of capacity more than 500MW
For the year 2008-09: Rs.10.95 lacs ( Rs.1.095 Million) per MW escalated @ 4% per annum there after.
Central Electricity Regulatory Commission (Terms & conditions of Tariff) Regulations, 2004 (www.cercind.org ) Assumed similar to that of coal as CERC guidelines don’t provide for “allowable O&M expenditure” for lignite plants exceeding 250MW.
7 Rate of Depreciation 3.6% 8 Oil consumption 3 ml/kWh 9 Gross heat rate. 2621.5 Kcal/kWh ( i.e
2450Kcal/kWh for coal multiply by factor of 1.07)
10 Auxiliary consumption 8% 11 Working Capital -
Receivable Fuel O & M Maintenance spare Escalation of maintenance spare Secondary fuel
2 months 1.5 month 1 month 1% of historical cost 6% p.a. 2 months
Central Electricity Regulatory Commission (Terms & conditions of Tariff) Regulations, 2004 (www.cerc ind.org )
12 Landed cost of diesel 32.83Rs./ litre IOC website: Diesel prices in Mumbai (http://www.iocl.com/Diesel_prices.aspx)
13 Gross Calorific value of fuel oil
10100 kCal (42.28 Mega Joules)/kg
CO2 Baseline Database for Indian Power Sector, December,2006 issued by Central Electricity Authority, Ministry of Power, Government Of India.
14 Discounting Rate 7.64% Average of 20 years and 30 years Government Bond Rate (www.rbi.org.in)
On the basis of plausible baseline scenarios identified in table 1 and assumptions detailed in table 2, table 3 represents evaluation of alternatives based on economic attractiveness:

PROJECT DESIGN DOCUMENT FORM (CDM PDD) - Version 03.1. CDM – Executive Board page 42 Table 3: Sr.No
. Alternative Levelised Cost
(Rs/kWh)21 A Project activity not implemented as a CDM project, i.e. 1147.5 MW gas
based combined cycle power plant with advance class gas turbine. >Rs.3
B Power Generation using natural gas but technology other than the project activity (i.e. 1050 MW gas based CCPP)
>Rs.3
C Power generation technologies using energy sources other than Natural gas.
1. 1000MW coal fired pit head based power plant using conventional technology
1.94
2. 1015 MW coal (imported) fired port based power plant using conventional technology.
2.60
3. 1320 MW coal fired pit based power plant using super critical boiler technology.
2.11
4. 1320 MW coal (imported) fired port based power plant using super critical boiler technology.
2.68
5. Cluster of 20 diesel fired power plants of 50 MW. More than Rs. 7** 6. 1000 MW Lignite fired power generation plant 2.14 ** as the cost per unit of power is very high in diesel fired power plants, no sensitivity analysis has been carried out for such power plant. Thus, it can be seen that coal fired pit head based power plant using conventional i.e. sub-critical technology is economically the most attractive baseline scenario. Sub Step -2: Sensitivity analysis of identified plausible baseline scenarios. The sensitivity analysis was conducted for the above alternatives to confirm that the conclusion regarding the financial attractiveness is robust to reasonable variations in the critical assumptions i.e. fuel prices and the load factor. Table 4 below shows the economic evaluation of the sensitivity analysis on identified plausible baseline options: Table-4: Parameter Alternative Variation Levelised cost
(Rs/kWh)22
21 Exact figures of levelized cost (where not indicated) and excel sheets containing the workings for arriving at the levelized cost are confidential and enclosed as Appendix-4. 22 Exact figures of levelized cost (where not indicated) are confidential and enclosed as part of Appendix 4.
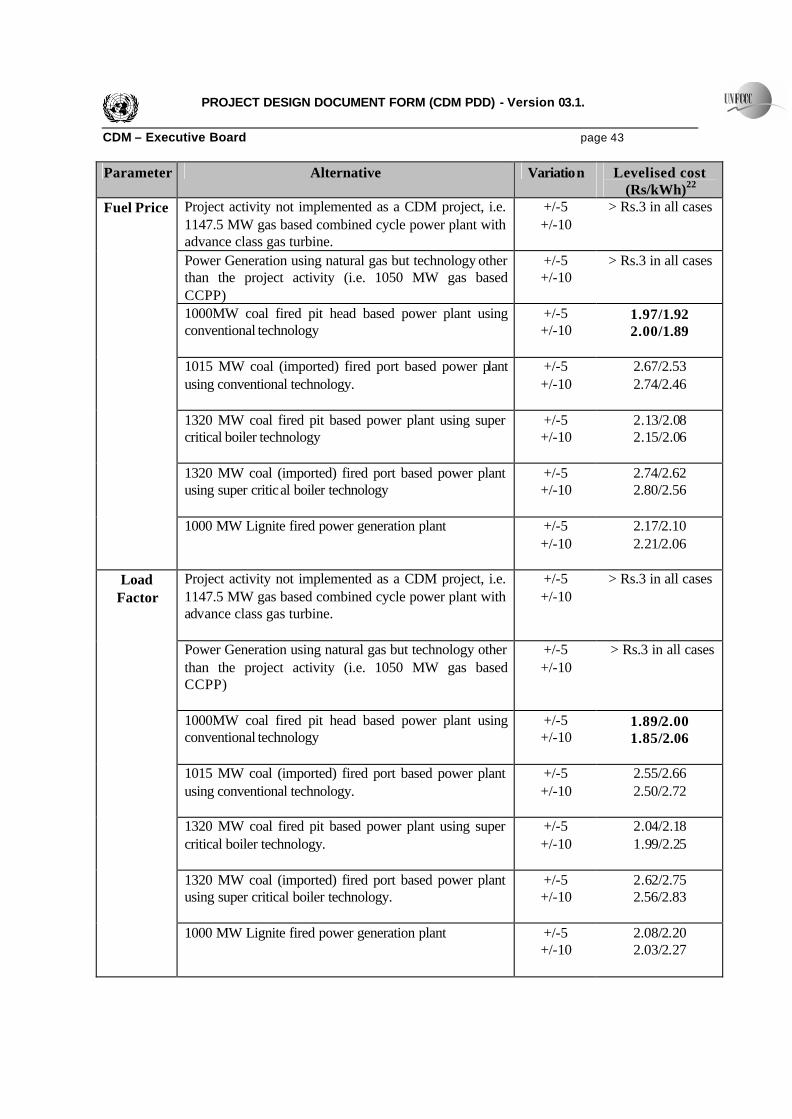
PROJECT DESIGN DOCUMENT FORM (CDM PDD) - Version 03.1. CDM – Executive Board page 43 Parameter Alternative Variation Levelised cost
(Rs/kWh)22 Project activity not implemented as a CDM project, i.e. 1147.5 MW gas based combined cycle power plant with advance class gas turbine.
+/-5 +/-10
> Rs.3 in all cases
Power Generation using natural gas but technology other than the project activity (i.e. 1050 MW gas based CCPP)
+/-5 +/-10
> Rs.3 in all cases
1000MW coal fired pit head based power plant using conventional technology
+/-5 +/-10
1.97/1.92 2.00/1.89
1015 MW coal (imported) fired port based power plant using conventional technology.
+/-5 +/-10
2.67/2.53 2.74/2.46
1320 MW coal fired pit based power plant using super critical boiler technology
+/-5 +/-10
2.13/2.08 2.15/2.06
1320 MW coal (imported) fired port based power plant using super critical boiler technology
+/-5 +/-10
2.74/2.62 2.80/2.56
Fuel Price
1000 MW Lignite fired power generation plant +/-5 +/-10
2.17/2.10 2.21/2.06
Project activity not implemented as a CDM project, i.e. 1147.5 MW gas based combined cycle power plant with advance class gas turbine.
+/-5 +/-10
> Rs.3 in all cases
Power Generation using natural gas but technology other than the project activity (i.e. 1050 MW gas based CCPP)
+/-5 +/-10
> Rs.3 in all cases
1000MW coal fired pit head based power plant using conventional technology
+/-5 +/-10
1.89/2.00 1.85/2.06
1015 MW coal (imported) fired port based power plant using conventional technology.
+/-5 +/-10
2.55/2.66 2.50/2.72
1320 MW coal fired pit based power plant using super critical boiler technology.
+/-5 +/-10
2.04/2.18 1.99/2.25
1320 MW coal (imported) fired port based power plant using super critical boiler technology.
+/-5 +/-10
2.62/2.75 2.56/2.83
Load Factor
1000 MW Lignite fired power generation plant +/-5 +/-10
2.08/2.20 2.03/2.27
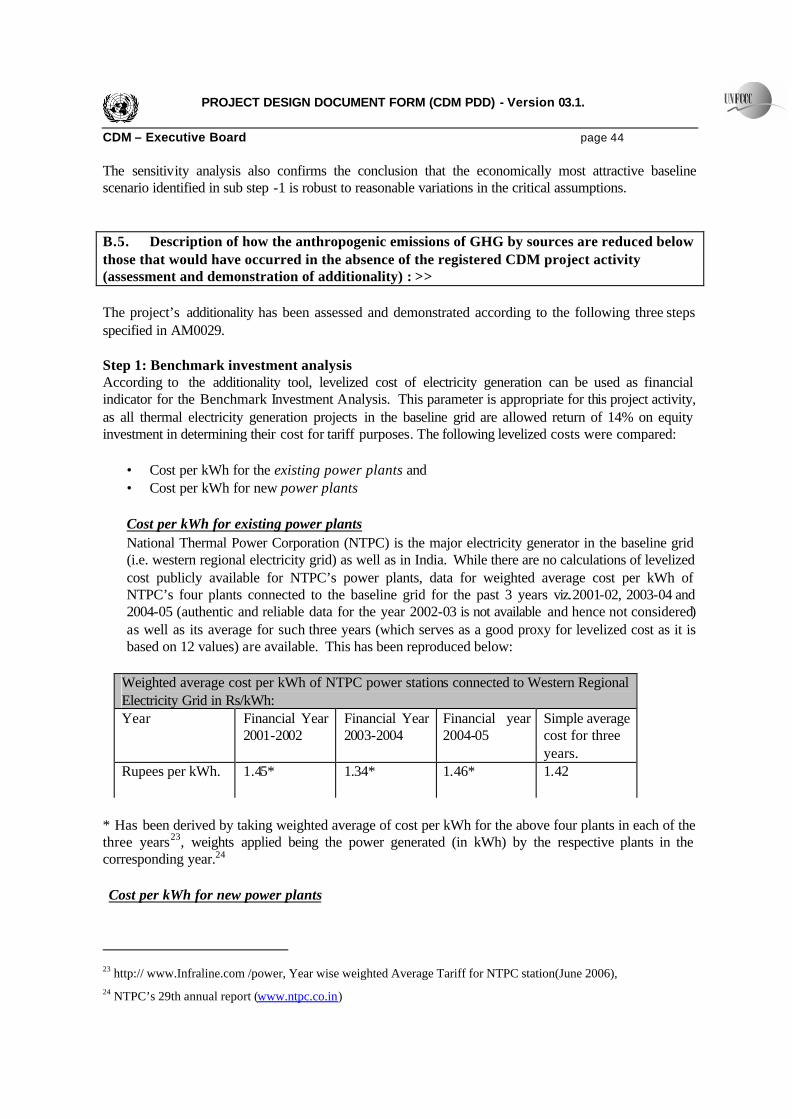
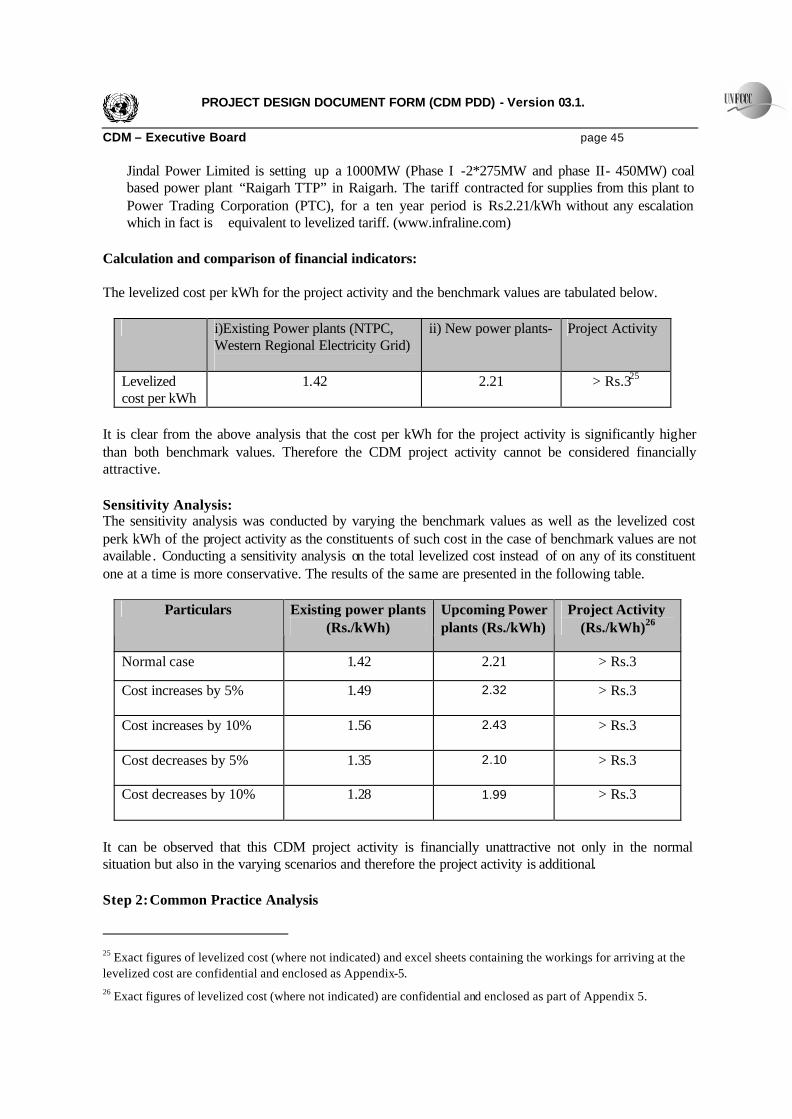
PROJECT DESIGN DOCUMENT FORM (CDM PDD) - Version 03.1. CDM – Executive Board page 44 The sensitivity analysis also confirms the conclusion that the economically most attractive baseline scenario identified in sub step -1 is robust to reasonable variations in the critical assumptions. B.5. Description of how the anthropogenic emissions of GHG by sources are reduced below those that would have occurred in the absence of the registered CDM project activity (assessment and demonstration of additionality) : >> The project’s additionality has been assessed and demonstrated according to the following three steps specified in AM0029. Step 1: Benchmark investment analysis According to the additionality tool, levelized cost of electricity generation can be used as financial indicator for the Benchmark Investment Analysis. This parameter is appropriate for this project activity, as all thermal electricity generation projects in the baseline grid are allowed return of 14% on equity investment in determining their cost for tariff purposes. The following levelized costs were compared:
• Cost per kWh for the existing power plants and • Cost per kWh for new power plants Cost per kWh for existing power plants National Thermal Power Corporation (NTPC) is the major electricity generator in the baseline grid (i.e. western regional electricity grid) as well as in India. While there are no calculations of levelized cost publicly available for NTPC’s power plants, data for weighted average cost per kWh of NTPC’s four plants connected to the baseline grid for the past 3 years viz.2001-02, 2003-04 and 2004-05 (authentic and reliable data for the year 2002-03 is not available and hence not considered) as well as its average for such three years (which serves as a good proxy for levelized cost as it is based on 12 values) are available. This has been reproduced below:
Weighted average cost per kWh of NTPC power stations connected to Western Regional Electricity Grid in Rs/kWh: Year Financial Year
2001-2002 Financial Year 2003-2004
Financial year 2004-05
Simple average cost for three years.
Rupees per kWh.
1.45* 1.34* 1.46* 1.42
* Has been derived by taking weighted average of cost per kWh for the above four plants in each of the three years23, weights applied being the power generated (in kWh) by the respective plants in the corresponding year.24 Cost per kWh for new power plants
23 http:// www.Infraline.com /power, Year wise weighted Average Tariff for NTPC station(June 2006), 24 NTPC’s 29th annual report (www.ntpc.co.in)
PROJECT DESIGN DOCUMENT FORM (CDM PDD) - Version 03.1. CDM – Executive Board page 45
Jindal Power Limited is setting up a 1000MW (Phase I -2*275MW and phase II- 450MW) coal based power plant “Raigarh TTP” in Raigarh. The tariff contracted for supplies from this plant to Power Trading Corporation (PTC), for a ten year period is Rs.2.21/kWh without any escalation which in fact is equivalent to levelized tariff. (www.infraline.com)
Calculation and comparison of financial indicators: The levelized cost per kWh for the project activity and the benchmark values are tabulated below.
i)Existing Power plants (NTPC, Western Regional Electricity Grid)
ii) New power plants- Project Activity
Levelized cost per kWh
1.42 2.21 > Rs.325
It is clear from the above analysis that the cost per kWh for the project activity is significantly higher than both benchmark values. Therefore the CDM project activity cannot be considered financially attractive. Sensitivity Analysis: The sensitivity analysis was conducted by varying the benchmark values as well as the levelized cost perk kWh of the project activity as the constituents of such cost in the case of benchmark values are not available . Conducting a sensitivity analysis on the total levelized cost instead of on any of its constituent one at a time is more conservative. The results of the same are presented in the following table.
Particulars Existing power plants (Rs./kWh)
Upcoming Power plants (Rs./kWh)
Project Activity (Rs./kWh)26
Normal case 1.42 2.21 > Rs.3
Cost increases by 5% 1.49 2.32
> Rs.3
Cost increases by 10% 1.56 2.43
> Rs.3
Cost decreases by 5% 1.35 2.10
> Rs.3
Cost decreases by 10% 1.28 1.99
> Rs.3
It can be observed that this CDM project activity is financially unattractive not only in the normal situation but also in the varying scenarios and therefore the project activity is additional. Step 2: Common Practice Analysis
25 Exact figures of levelized cost (where not indicated) and excel sheets containing the workings for arriving at the levelized cost are confidential and enclosed as Appendix-5. 26 Exact figures of levelized cost (where not indicated) are confidential and enclosed as part of Appendix 5.

PROJECT DESIGN DOCUMENT FORM (CDM PDD) - Version 03.1. CDM – Executive Board page 46 Under this step, it is being demonstrated that the project activity is not a common practice27 in India by applying Step 4 of the latest version of the “Tool for demonstration assessment and of additionality” (Additionality Tool) agreed by the CDM Executive Board at the time of start of the project activity. As per Sub-step 4a of this Additionality Tool, an analysis of other activities similar to the proposed project activity is presented below. ü In terms of scale, there are no combined cycle power plants of a similar scale (i.e. 1,000 MW and
above in a single location) implemented previously or currently underway at the time of start of this project activity.
ü In terms of technology, the project activity is the first combined cycle power plant in India possessing
a combination of environment friendly features hitherto not used in any other combined cycle power plant in India (though a few out of 38 combined cycle power plants have one or other such feature) (source CEA 2003-04, Ministry of Power, Government of India & www.infraline.com). Such features include:
(a). The project activity is the first and the only project amongst those in operation and in construction to have a single shaft configuration instead of a multiple shaft configuration. In view of better fuel efficiency in a single shaft configuration, the project proponent has gone for this in compliance with its objective of reducing GHG emissions per GWh. (b). Also the project activity is the first and the only project in India to have two stage burner with diffusion pilot (i.e. pre mix operation through out the entire load range) instead of conventional burners , which reduces the NOx level right from start load instead of from around 45% load. Further the efficiency of the gas turbine is also increased due to high combustion stability achieved by such burners. Also due to such burners the NOx emissions from project activity is 25ppm when loads are greater than 50% against a Euro norm of 26.6ppm (50Mg/NM3) for loads greater than 70% and the Indian norm of 50ppm. (c) Again the project activity is the first and the only project in India to have a device called “ GT Rotor Axial Positioning Device” , which is a hydraulic device for fixing the axial position of Gas Turbine Rotor. This device by minimising the leakages of air between various stages of air compressor and by also minimising the leakage of gas combustion products from gas turbine blade tips, improves the efficiency of the gas turbine. (d) A normal feature in most of the combined cycle gas based plants in India and in all the combined cycle gas based plants in the western region is that, there is a special provision of bypass stack which enables these plants to operate in open cycle mode. However no such special provision has been made by the project activity, thus substantiating the fact that the project activity is not common practice. The operations when in open cycle mode leads to more t CO2 emissions per GWh”.
27 Dabhol power plant comprising three phase of 714 MW each has been abandoned and not revived as of project start date and hence not considered for this analysis. Attempts have been made subsequently by Government of India to revive this project by various means including provision of tax concessions specifically for this project activity.

PROJECT DESIGN DOCUMENT FORM (CDM PDD) - Version 03.1. CDM – Executive Board page 47
(e) High temperature F class gas turbines have higher fuel efficiency (i.e. 57% at 100% load) than the standard E class turbines. Only three out of 38 combined cycle power plants (i.e. 8%) in India use such advanced class gas turbines.
ü The project activity is among the few gas based combined cycle plants in India (i.e. two out of thirty four gas fired combined cycle power plants-5.88%) to be conceived on the basis of Natural Gas to be sourced from the market (including thru imports) at market determined price. Most of the other gas based combined cycle plants were allotted Natural Gas by the “Gas Linkage Committee” under the Administered Price Mechanism, which enabled the implementation of such projects. Such allocated gas is priced under the Administered Pricing Mechanism at a lower level i.e. around 3.3$ per mmbtu as against the market determined price of over $6 per mmbtu.
ü Also of the recent capacity additions contributing to 20% of the generation in 2004-05, there is
no power plant in operation comparable to the project activity in terms of size, scale, fuel and technology.
ü Also the National Electricity policy favours coal and lignite based projects and states that “Gas a
source for Power Generation is dependent on its price”. As there are no similar activities observed, Sub step 4(b) of “Tools for Demonstration and Assessment of additionality” needs no detailed elaboration. Thus the above substantiate the claim that the project activity is not a widely observed and commonly carried out practice. Therefore, this project is additional. Step 3 Impact of CDM registration The approval and registration of the project activity as a CDM activity besides reducing anthropogenic greenhouse gas emissions would have the following impacts on the project activity, which were envisaged at the time of start of the project activity. • Revenue from the CDM funds are important for the project activity’s success. Amongst many risks
facing the project activity, the high cost of Natural gas is a significant risk. In many situations such high cost can result in nil or reduced deliveries of power from the project activity exposing it to the risk of paying for natural gas not taken pursuant to stringent take or pay clauses in the gas purchase contracts.
• The registration of the project activity would encourage other prospective developers to develop gas
based advance class combined cycle power plants, which in effect would lead to further reduction in GHG emissions from power generation through adoption of a new and fuel efficient technology.
It can, thus, be seen that the project activity satisfies each of the steps 1 to 3 and therefore the project activity is not the base line scenario and is additional. The starting date of the project activity (i.e., awarding of EPC contract) was on 17th June 2005, which is before the date of starting the validation process. The evidence that the incentive from CDM was

PROJECT DESIGN DOCUMENT FORM (CDM PDD) - Version 03.1. CDM – Executive Board page 48 seriously considered in the decisions to proceed with the project activity are available and include inter-alia, the decision of the Board of Directors and submission of new methodology “NM0080”.
B.6. Emission reductions:
B.6.1. Explanation of methodological choices: >>
The procedure followed for estimating the emissions reductions from this project activity during the crediting period are as per the following four steps which correspond with AM0029.
Steps Description Equation Used Methodological choices A. Procedure
followed for estimating emissions in the project scenario (PE y)
The CO2 emissions from on site combustion of natural gas in the project activity (PEy) are calculated in accordance with and as per equation no 2 of AM0029.The sub variable COEF f,y to be calculated in accordance with and as per equation no. (2a) of AM0029
The design of the project power plant is to use gas as the primary and only fuel for power generation.
B Procedure followed for estimating emissions in the baseline scenario (BE y)
Baseline emissions are calculated in accordance with and as per equation no 3 of AM 0029
The ex ante assessment in accordance with and as per AM0029 under options 1, 2 & 3 of AM0029 in section B.6.3 results in lowest emission factor for option 1 (i.e. The Build Margin calculated according to ACM0002), and therefore the Build Margin as per ACM0002 define EF BL, CO2,y . As Option 1 is selected, it will be estimated ex-post as described in ACM0002 during the crediting period.
Under option 1 for calculating baseline emissions (i.e. the build margin), the sample group for the purpose of Section B.6.3 shall be the recently built power plant capacity additions (75 Nos.) in the baseline grid in accordance with ACM0002 (i.e. the western regional electricity grid) that comprise 20% of the generation in the baseline grid as in the context of the baseline grid the most recent five power plants have a smaller annual generation (i.e. 1.47% of the generation in baseline grid).
Under option 2, (a) the simple OM methodology as

PROJECT DESIGN DOCUMENT FORM (CDM PDD) - Version 03.1. CDM – Executive Board page 49 Steps Description Equation Used Methodological choices
per ACM0002 has been used as the low cost and must run resources has a share lower than 50% as demonstrated in Annex 3 and as the baseline grid is not operated through a merit order-despatch system
For option 3, coal fired pit head based 1000MW power plant using conventional i.e. sub-critical technology has been identified in section B.4. as the economically most attractive baseline scenario alternative due to its lowest levelized electricity generation cost, whose emission factor are calculated in accordance with and as per equation no 4 of AM0029.
C Procedure
followed for estimating leakages (LE y)
Leakage emissions are calculated in accordance with and as per equation no 5 of AM0029
C.1 Procedure followed for estimating fugitive methane emissions (LE CH4, y)
Fugitive methane emissions are to be calculated in accordance with and as per equation no 6 of AM0029.
As the baseline emissions are calculated based on option 1, the emission factor for upstream fugitive CH4 emissions occurring in the absence of the project activity is derived using the equation given at the end of page 6 of AM0029. Thus, the emission factor for upstream fugitive CH4 emissions is consistent with the baseline emission factor calculation as per option-1.
During the crediting period for fugitive CH4 emissions associated with NG, default values provided in Table 2 are to be used, as reliable and accurate national data are not available. The default values to be used in relation to NG production, processing, transport and distribution from Table 2 of AM0029 is US/Canada values for NG as (a) gas processing facilities in Rasgas (Qatar) , Petronet LNG (India), Hazira LNG (India) and Panna-Mukta and Tapti (India) etc and (b) gas transportation and distribution facilities of Gujarat State Petronet Ltd. are predominantly of recent vintage and are built and operated to international standards such as API, ASMI, ASTM (supporting proof has been provided to the validation team).
The details justifying such a claim include the

PROJECT DESIGN DOCUMENT FORM (CDM PDD) - Version 03.1. CDM – Executive Board page 50 Steps Description Equation Used Methodological choices
following:
Gas Processing system RasGas (Qatar): The LNG that is sourced by Petronet LNG Ltd. from Rasgas comes from its Liquefaction Trains No. 3 and 4. These trains are owned by Ras Laffan Liquefied Natural Gas Company Limited (II) (RasGas II), a joint venture company established in 2001 by Qatar Petroleum and an Oil Major, Exxon Mobil. ExxonMobil holds 29% of shareholding in Train No. 3 and 30% of shareholding in Train No. 4. The commercially proven technology for construction of liquefaction of terminals is currently of US origin and as these trains have been built recently under the guidance of this leading Oil Major located in United States, it can be concluded that these liquefaction trains are of recent vintage and are built and operated to international standards. Petronet LNG Ltd. – Dahej LNG Terminal: GAZ de France (GdF), the French national company that has been the largest importer of LNG in Europe for the last 30 years is Petronet LNG Ltd's strategic partner and holds 10% equity in Petronet LNG Ltd. GdF, whose business covers every aspect of the gas supply chain, is recognized as a world leader. It has developed expertise in natural gas production, supply, transmission, liquefied natural gas (LNG), storage and distribution, and other applications. GdF's vast experience has been of immense value while setting up Dahej LNG Terminal. Petronet LNG Ltd. – Dahej Terminal had awarded the Engineering Procurement and Construction Contract in respect of the subject Terminal to the Consortium led by M/s Ishikawajima Harima Heavy Industries Company Ltd. (IHI), Japan. The other members of the consortium were M/s Ballast Nedam International BV-Netherlands, M/s Toyo Engineering India Limited, M/s Itochu Corporation, M/s Mitsui Company Limited, Japan and M/s Toyo Engineering Corporation. The Consortium Leader M/s IHI is one of the most reputed construction companies in the field of LNG regasification terminals. This terminal was commissioned in the first quarter of 2004. Thus it can be seen that the Dahej LNG Terminal of

PROJECT DESIGN DOCUMENT FORM (CDM PDD) - Version 03.1. CDM – Executive Board page 51 Steps Description Equation Used Methodological choices
Petronet LNG Ltd. is of recent vintage and is built and operated to international standards. ONGC: ONGC Hazira Plant is processing around 42 MMSCMD of gas and associated condensate. The processing includes sweetening (H2S removal), dehydration, hydrocarbon dew point depression, and condensate fractionation and sulphur recovery. The plant is built and commissioned by builders of international fame like KIT USA, KHIC South Korea and HYUNDAI South Korea which are considered to be one of the best in the world. The technology adopted for processing has been provided by the reputed international technology provider like SNEA (P) France, (Now called Prosernat) and ARI (Now called Merrichem). The process control is carried out with DIDC (Distributed Digital Control System) system, which has been, further upgraded to latest state of art with full redundant feature based on industrial IT technology by ABB. Advance process control (APC) technology is also being implemented for the finest control of the system. The Digital Control System (DCS) is based on open standard protocol for ease of integration. The process operation and control at ONGC Hazira is unique in India with integrated safety system; such as H2S detection and hydrocarbon detection. ONGC Gas Processing Complex - Hazira where Bombay High Gas and Panna-Mukta Tapti Gas are processed is working on various schemes to achieve zero hydrocarbon emissions including zero flares. Such schemes include the following: a) Flare gas recovery project at Hazira Gas Processing Complex (HGPC), Hazira Plant, ONGC Ltd. (for which PDD has been submitted on 2nd June, 2006 using AM0009 version 2) b) Flare gas recovery project at Hazira Gas Processing Complex (HGPC), Hazira Plant, ONGC Ltd. (for which PDD has been submitted on 21st February, 2007 using AMS-III D version 9). c) Zero hydrocarbon (HC) emission from Glycol Dehydrating Unit (GDU) at Hazira Gas Processing Complex of ONGC (for which PDD has been submitted on 16th June, 2006 using AM0037).

PROJECT DESIGN DOCUMENT FORM (CDM PDD) - Version 03.1. CDM – Executive Board page 52 Steps Description Equation Used Methodological choices
Thus it can be observed that the Gas Processing Complex of ONGC at Hazira has been built by leaders of international fame and is currently being modernized through latest technology and are therefore is predominantly of recent vintage and built and operated to international standards. Gas Transportation and Distribution Gas Transportation and Distribution facilities of Gujarat State Petronet Ltd. for transportation of Gas to the site of the project activity are predominantly of recent vintage and are built and operated to international standard. This has been demonstrated in the letter (vide reference GSPL/TS/Torrent/513 dated 2nd February 2007) addressed by Gujarat State Petronet Ltd. The emission factor for fugitive upstream emissions of coal is based on surface mining which is currently predominant in India.. Fugitive upstream emissions occurring in Annex 1 countries shall be excluded in leakage calculations in accordance with AM0029.
C.2 Procedure followed for estimating CO2 emissions from LNG (LE LNG, CO2,y)
CO2 emissions from LNG are calculated in accordance with and as per the equation contained in AM0029.
In relation to the emission factor for such emissions the default factor of 6 tCO2 /TJ shall be used.
D Estimation of emissions reduction (ER y)
The emissions reduction ER y due to project activity during a given year “y” is calculated in accordance with and as per equation no 8 of AM0029.
The data choices, where applicable, in relation to parameters not covered above are dealt with in Sections 6.2 and 7.1
B.6.2. Data and parameters that are available at validation: A. Margin Emission Factors (ex-ante)

PROJECT DESIGN DOCUMENT FORM (CDM PDD) - Version 03.1. CDM – Executive Board page 53 A.1 Data / Parameter:
EF BM,y
Data unit: tCO2/ GWh Description: Build margin emission factor of the baseline grid (Western Regional Electricity grid) in
tonnes of CO2 per GWh. Source of data used:
Table S-1 of “CO2 Baseline Database” for the “Indian Power Sector” provided by Central Electricity Authority (CEA) Ministry of Power ,Government of India, (http://www.cea.nic.in/planning/c%20and%20e/Government%20of%20India%20website.htm)
Value applied: 780 Justification of the choice of data or description of measurement methods and procedures actually applied:
The data used is from a national level and publicly accessible source and has a high level of reliability.
Any comment: Nil A.2 Data / Parameter:
EF CM,y
Data unit: t CO2/ GWh Description: Combined margin emission factor of the baseline grid is (Western regional electricity
grid)in tonnes of CO2 per GWh. Source of data used:
Table S-1 of “CO2 Baseline Database” for the “Indian Power Sector” provided by Central Electricity Authority (CEA, Ministry of Power ,Government of India) http://www.cea.nic.in/planning/c%20and%20e/Government%20of%20India%20website.htm
Value applied: 890 t CO2/GWh Justification of the choice of data or description of measurement methods and procedures actually applied :
The data used is from a national level and publicly accessible source and has a high level of reliability.
Any comment: Nil B. Emission factor of the most likely baseline scenario (EF BL, CO2) B.1 Data / Parameter:
NCV coal
Data unit: KCal/ Kg (to be converted into GJ/tonne) Description: Net calorific value for non-coking coal for pit-head power generation. Source of data GCV and conversion factor ( GCV to NCV) sourced from “CO2 Baseline Database

PROJECT DESIGN DOCUMENT FORM (CDM PDD) - Version 03.1. CDM – Executive Board page 54 used: of the Indian Power Sector, December 2006, issued by Central Electricity Authority,
Ministry of Power, Government of India” (http://www.cea.nic.in/planning/c%20and%20e/Government%20of%20India%20website.htm).
Value applied: 3624.5
Justification of the choice of data or description of measurement methods and procedures actually applied :
The data used is from a national level and publicly accessible source and has a high level of reliability.
Any comment: Nil B.2 Data / Parameter:
EFCO2,coal
Data unit: gCO2/MJ to be converted to t CO2 /TJ
Description: Carbon emission factor of coal.
Source of data used:
CO2 Baseline Database of the Indian Power Sector, December 2006, issued by Central Electricity Authority, Ministry of Power, Government of India (http://www.cea.nic.in/planning/c%20and%20e/Government%20of%20India%20website.htm)
Value applied: 95.8 gCO2/MJ * 10^6 / 10^6 = 95.8 tCO2/TJ
Justification of the choice of data or description of measurement methods and procedures actually applied :
The data used is from a national level and publicly accessible source and has a high level of reliability.
Any comment: Nil B.3 Data / Parameter:
OXIDcoal
Data unit: Nil
Description: Oxidation factor of coal.

PROJECT DESIGN DOCUMENT FORM (CDM PDD) - Version 03.1. CDM – Executive Board page 55 Source of data used:
CO2 Baseline Database of the Indian Power Sector, December 2006, issued by Central Electricity Authority, Ministry of Power, Government of India (http://www.cea.nic.in/planning/c%20and%20e/Government%20of%20India%20website.htm)
Value applied: 0.98.
Justification of the choice of data or description of measurement methods and procedures actually applied :
The data used is from a national level and publicly accessible source and has a high level of reliability.
Any comment: Nil B.4 Data / Parameter:
ηBL
Data unit: % (expressed in decimals e.g. 40% is expressed as 0.40) Description: The energy efficiency of technology in the most likely baseline scenario. Source of data used:
Specification of sub critical coal-fired power plant according to the heat rate (10.255 MJ/kWh) applied by Central Electricity Regulatory Commission (Terms & conditions of Tariff) Regulations, 2004 (www.cercind.org)
Value applied: 35.1% Justification of the choice of data or description of measurement methods and procedures actually applied :
Data has been collected from official source.
Any comment: Nil. C. Leakages C.1 Data / Parameter:
EF NG, upstream, CH4
Data unit: t CH4 / GJ Description: Emission factor for upstream fugitive methane emissions of natural gas from
production, transportation, distribution, and, in the case of LNG, liquefaction, transportation, re-gasification and compression into a transmission or distribution system, in tCH4 per GJ fuel supplied to final consumers.
Source of data used:
Table- 2 of AM0029.
Value applied: 0.00016 t CH4/ GJ Justification of Data has been collected from official sources. US/Canada values have been chosen.

PROJECT DESIGN DOCUMENT FORM (CDM PDD) - Version 03.1. CDM – Executive Board page 56 the choice of data or description of measurement methods and procedures actually applied :
The justification for the same in given in section 6.1 (C-1).
Any comment: Nil. C.2 Data / Parameter:
EF BL,upstream,CH4
Data unit: tCH4/MWh Description: Emission factor for upstream fugitive methane emissions occurring in the absence of
the project activity in terms of tonnes of methane per MWh. Source of data used:
Calculated as: ΣFF j,k *EF k,upstream,CH4 j Σ EG j j ΣFFj,k : Refer to table A.2 “Fuel consumed by power sources” under sub section A “
Monitoring parameters for Build Margin emission factor” of section B.7.1. EF k,upstream,CH4 : Table 2 of AM0029. Σ EG j : Refer to table A.3 “Electricity delivered to grid ” under sub section A “ Monitoring parameters for Build Margin emission factor” of section B.7.1
Value applied: 0.000647141 t CH4/ MWh Justification of the choice of data or description of measurement methods and procedures actually applied :
Data has been collected from official sources.
Any comment: Default emission factor for fugitive upstream CH4 emissions for coal has been considered as 0.8 t CH4 / Kt Coal, as surface mining is predominant in India. This leads to conservative estimation of leakages.
B.6.3 Ex-ante calculation of emission reductions: >>
The following section presents the ex-ante emission estimations up to the calculation of emission reductions by applying the procedures and data mentioned under sections B.6.1 and B.6.2.

PROJECT DESIGN DOCUMENT FORM (CDM PDD) - Version 03.1. CDM – Executive Board page 57 (Note: m3 i.e. Standard Cubic Metre or “SCM” in this PDD means one (1) standard cubic meter of Gas, at a temperature of fifteen decimal five six (15.56) degrees Celsius and at an absolute pressure of one decimal zero one three two five (1.01325) Bar(a)). 1. Calculation of baseline emissions The elements of the baseline emission calculation are described below. First, for determination of the baseline emission factor EF BL,CO2,y three emissions factors are calculated, of which the lowest is chosen: A.) Build margin Source: Table S-1 under CEA report (Ministry of Power, Government of India) called “CO2 Baseline Database for the Indian Power Sector” for Western Regional Electricity Grid Result: 780 t CO2/GWh (for the year 2004-05) B. Combined margin Source: Table S-1 under CEA report (Ministry of Power, Government of India) called “CO2 Baseline Database for the Indian Power Sector” for Western Regional Electricity Grid Result: 890 t CO2/GWh (For the year, 2004-05) C) Emission factor of the most likely baseline scenario. Calculated as per equation number- 4 of AM 0029 as contained in part B (Procedure followed for estimating emissions in the baseline scenario) of section B.6.1 “Explanation of Methodological Choices”. Sources: See B.6.2. and table M.1 “Calculation of emission factor of the most likely baseline scenario” as contained in annexure-3 “Baseline Information”. Values of sub-variables: Fuel CO2 emission co-efficient (COEF BL): 0.093884 t CO2e/GJ Energy Efficiency of technology (η BL): 35.10% = 0.093884 t CO2e/GJ* 3.6 GJ/MWh *1000 = 962.91 t CO2/GWh 0.3510 Therefore, according to AM 0029, 780 t CO2/GWh (i.e. Build Margin) is chosen as baseline emissions factor EF BL,CO2,y. Project electricity generation (i.e. net evacuation to the grid) EGy is estimated as 9067.9994 GWh per year.

PROJECT DESIGN DOCUMENT FORM (CDM PDD) - Version 03.1. CDM – Executive Board page 58 Therefore, the estimated annual baseline emissions (BEy) will be (as per equation 3 of AM0029) = 9067.9994 GWh * 780 tCO2/GWh = 7073039.54 tCO2. 2. Calculation of Project Emissions (PE y) Calculated as per equation number-2 of AM 0029 as contained in part A (Procedure followed for estimating emissions in the project scenario) of section B.6.1 “Explanation of Methodological Choices”. The value of project emissions is 3581398.206 t CO2 Values of sub-variables: Volume of fuel combusted in project plant (FC f,y) : 1744834538.12 m3 CO2 emission coefficient of fuel (COEF f,y) : 0.00205257 t CO2/ m
3 of natural gas Data Sources: Refer to table P.1 “Calculation of Project Emissions” as contained in annexure-3 “Baseline Information”. Based on the above, the estimated annual project emissions (PE y) will be = 0.00205257 tCO2/m3 * 1744834538.12 m3= 3581398.206 tCO2. Sub-variables are calculated as follows 2A) Calculation of CO2 Emission Co-efficient of natural gas (COEF f,y) Calculated as: CO2 Emission Co-efficient of natural gas is calculated as per equation number-2a of AM 0029 as contained in part A (Procedure followed for estimating emissions in the project scenario) of section B.6.1 “Explanation of Methodological Choices”. Values of sub-variables: 1) Net Calorific Value of gas (NCV y): 0.037 GJ/ m3 2) CO2 emission factor (EF CO2,f,y): 0.0561 t CO2/GJ 3) Oxidation factor of gas (OXID f): 1 0.037 GJ/ m3 * 0.0561 t CO2 / GJ* 1 = 0.00205257 t CO2/ m
3 Data Sources: Refer to table P.1 “Calculation of Project Emissions” as contained in annexure-3 “Baseline Information”. 3) Calculation of Leakages (LE y) Calculated as:

PROJECT DESIGN DOCUMENT FORM (CDM PDD) - Version 03.1. CDM – Executive Board page 59 Leakages are calculated as per equation number-5 of AM 0029 as contained in part C (Procedure followed for estimating Leakages) of section B.6.1 “Explanation of Methodological Choices”, which is 301937.6101 t CO2e Values of sub-variables: 1) Leakage emission due to fugitive upstream CH 4 emissions (LE CH4,y): 91267.1274t CO2 e. 2) Leakage emissions due to fossil fuel combustion/electricity consumption associated with the liquefaction, transportation, re-gasification and compression of LNG into a natural gas transmission or distribution system (LE LNG,CO2,y) : 210670.4827 t CO2 e Data Sources: Refer to table L.1 “Calculation of Leakages” as contained in annexure-3 “Baseline Information”. Based on the above, the estimated annual leakages (LEy) will be = 91267.1274 t CO2 e + 210670.4827 t CO2 e = 301937.6101 t CO2 e 3A) Calculation of leakage emissions due to fugitive upstream CH4 emissions (LE CH4,y) Calculated as: Leakage emissions due to fugitive upstream CH4 emissions are calculated as per equation number-6 of AM 0029 as contained in part C (Procedure followed for estimating Leakages) of section B.6.1 “Explanation of Methodological Choices”. Values of sub-variables: Quantity of natural gas combusted in the project plant (FC y): 1744834538.12 m3 Average net calorific value of natural gas (NCV NG,y): 0.036587733 GJ/m3 Emission factor for upstream fugitive methane emissions of natural gas from production, transportation, distribution, and, in the case of LNG, liquefaction, transportation, re-gasification and compression into a transmission or distribution system, in t CH4 per GJ fuel supplied to final consumers (EF NG, upstream,CH4) : 0.00016 t CH4/ GJ Electricity generated in the project plant (EG PJ,y) : 9067999.4 MWh Emission factor for upstream fugitive methane emissions occurring in the absence of the project activity in t CH4 per MWh electricity generation in the project plant (EF BL, upstream, CH4) : 0.00064714 t CH4/ MWh (Refer note below) Global warming potential of methane valid for the relevant commitment Period (GWP CH4) :21 Data Sources: Refer to table L.1 “Calculation of Leakages” as contained in annexure-3 “Baseline Information”. Based on the above, the estimated leakage emissions due to fugitive upstream CH4 emissions (LE CH4,y) will be:

PROJECT DESIGN DOCUMENT FORM (CDM PDD) - Version 03.1. CDM – Executive Board page 60 = [(1744834538.12 m3 * 0.036587733 GJ/m3 * 0.00016 tCH4/GJ) – (9067999.4 MWh * .00064714 tCH4/MWh)] * 21 = 91267.1274 tCO 2e. Note: Calculation of emission factor for upstream fugitive methane emissions occurring in the absence of the project activity in t CH4 per MWh electricity generation in the project plant (EF BL,upstream,CH4) Calculated as per equation at the end of page 6 of AM 0029 as contained in part C (Procedure followed for estimating Leakages) of section B.6.1 “Explanation of Methodological Choices”. Value of sub-variables: Refer to annexure-3 “Baseline Information” Data Sources: Refer to table L.1 “Calculation of Leakages” as contained in annexure-3 “Baseline Information”). 3B) Leakage emissions due to fossil fuel combustion / electricity consumption associated with the liquefaction, transportation, re -gasification and compression of LNG into a natural gas transmission or distribution system (LE LNG,CO2,y) Calculated as per the methodology, AM 0029 as contained in part C (Procedure followed for estimating Leakages) of section B.6.1 “Explanation of Methodological Choices”. Value of sub-variables: Quantity of natural gas combusted in the project plant (FC LNG y) ( For CO2 emissions from LNG): 35111.74712 TJ Emission factor for upstream CO2 emissions due to fossil fuel combustion / electricity consumption associated with the liquefaction, transportation, re-gasification and compression of LNG into a natural gas transmission or distribution system (EF CO2, upstream,LNG) : 6 t CO2/ TJ Data Sources: Refer to table L.1 “Calculation of Leakages” as contained in annexure-3 “Baseline Information”. Based on the above, the estimated Leakage emissions due to fossil fuel combustion / electricity consumption associated with the liquefaction, transportation, re-gasification and compression of LNG into a natural gas transmission or distribution system (LE LNG,CO2,y) will be: = 35111.74712 TJ * 6 t CO2/ TJ = 210670.4827 t CO2 4. Emissions Reduction (ER y) Calculated as: Emissions reduction are calculated as per equation number-8 of AM 0029 as contained in section B.6.1 “Explanation of Methodological Choices”

PROJECT DESIGN DOCUMENT FORM (CDM PDD) - Version 03.1. CDM – Executive Board page 61 Values of sub-variables: 1) Emissions in the baseline scenario (BE y): 7073039.54 t CO2 e. 2) Emissions in the project scenario (PE y): 3581398.206 t CO2 e 3) Leakages (LE y): 301937.6101 t CO2 e Data Sources: Refer to table E.1 “Calculation of Emissions reduction” as contained in annexure-3 “Baseline Information”. Based on the above, the estimated emissions reduction will be: = 7073040 t CO2 e.- 3581398 t CO2 e - 301938 t CO2 e = 3189704 t CO2 e
B.6.4 Summary of the ex-ante estimation of emission reductions: >>
Year Estimation of Estimation of Estimations of Estimation of
project activity Baseline emissions Leakages overall emissions
emissions (tonnes CO2e) (tonnes CO2e) reductions
(tonnes CO2e) (tonnes CO2e) 2008 (From 1st April, 2008) 2686049 5304780 226454 2392278 2009 3581398 7073040 301938 3189704 2010 3581398 7073040 301938 3189704 2011 3581398 7073040 301938 3189704 2012 3581398 7073040 301938 3189704 2013 3581398 7073040 301938 3189704 2014 3581398 7073040 301938 3189704 2015 3581398 7073040 301938 3189704 2016 3581398 7073040 301938 3189704 2017 3581398 7073040 301938 3189704 2018 (Until 31st March, 2018) 895349 1768260 75484 797426 Total 35813980 70730400 3019380 31897040 (tonnes of
CO2e) B.7 Application of the monitoring methodology and description of the monitoring plan: The following two sections (B.7.1 and B.7.2) provides a detailed description of the application of the monitoring methodology and description of the monitoring plan, including an identification of the data to be monitored and the procedures that will be applied during monitoring.

PROJECT DESIGN DOCUMENT FORM (CDM PDD) - Version 03.1. CDM – Executive Board page 62 Please note that data monitored and required for verification and issuance are to be kept for two years after the end of the crediting period or the last issuance of CERs for this project activity, which ever occurs later.
B.7.1 Data and parameters monitored:
A - Monitoring parameters for the Build margin emission factor: A1: Data / Parameter: Build Margin emission factor (EF BM,y or EF BL,CO2,Y) Data unit: t CO2/ GWh Description: Build Margin emission factor of the grid in tonnes of CO2 per GWh. Source of data to be used:
Central Electricity Authority, Ministry of Power, Government of India (CEA) has developed a “CO2 Baseline Database” for the “Indian Power Sector” wherein relevant figure for Build Margin Emission factor (EF BM,y) for the Baseline Grid has been provided. These estimates provided by CEA (Ministry of Power, Government of India), have been thoroughly checked and have been compiled in the best possible manner and therefore are considered to be a reliable source of data. Such data if available in a timely manner, shall be used. Otherwise, this parameter shall be calculated as provided below, using parameters A.2 to A.6: Calculated as Σ F i,m,y * COEF i,m
i ,m Σ GEN m,y m where F i,m,y is the amount of fuel i (in metric tonnes) consumed by relevant power sources m in year(s) y, m refers to the power sources delivering electricity to the grid, COEF i,m is the CO2 emission coefficient of fuel i (tCO2 / metric tonnes of the fuel), taking into account the carbon content of the fuels used by relevant power sources m and the percent oxidation of the fuel in year(s) y i.e NCVi * EF CO2, i * OXID i, and GEN m,y is the electricity (GWh) delivered to the grid by source m.
Value of data applied for the purpose of calculating expected emission reductions in section B.5
780 t CO2/GWh
Description of Not Applicable

PROJECT DESIGN DOCUMENT FORM (CDM PDD) - Version 03.1. CDM – Executive Board page 63 measurement methods and procedures to be applied: QA/QC procedures to be applied:
The uncertainty level of this data is low. This is calculated based on data collected from official/ reliable data sources. No additional QA/QC procedures may need to be planned.
Any comment: Data will be recorded as per Monitoring Plan. Data will be archived electronically/ paper as available. Archived data will be stored as per Monitoring Plan.
A.2 Data / Parameter: Fi,m,y ( as per ACM0002) Data unit: Metric tonnes/ Year Description: Amount of fuel ‘i’ in metric tonnes consumed by relevant power sources ‘m’ in
year(s) ‘y’. Source of data to be used:
Fuel used in Build Margin sample "m" plants (i.e. plant name/power source) to be estimated based on the ratio of “ Σ GEN m,y” to the total generation in the baseline grid (a),applied to the fuel consumption in the baseline grid, separately for steam plants and gas plants (b), based on availability of data. a) Generation data for baseline grid will be calculated from data collected from table 6.1 (Gross Generation) and 5.5 (Auxiliary consumption) CEA General Review(Ministry of Power, Government of India), as follows: (Gross Generation – Auxiliary Consumption). b) Fuel consumption data for the baseline grid will be collected from table 6-1, CEA General review (Ministry of Power, Government of India) of the corresponding year.
Value of data applied for the purpose of calculating expected emission reductions in section B.5
Not Applicable as value of A.1 is available.
Description of measurement methods and procedures to be applied:
Not Applicable.
QA/QC procedures to be applied:
The uncertainty level of this data is low. This is collected from official sources. No additional QA/QC procedures may need to be planned.
Any comment: Data will be recorded as required for Build Margin Emission Factor in Monitoring Plan. Proportion of data monitored will be 100%. Data will be archived electronically/ paper as available. Archived data will be stored as required for Build Margin Emission Factor in Monitoring Plan.
A.3 Data / Parameter: GEN m,y (as per ACM0002) Data unit: GWh Description: Electricity (GWh) delivered to the baseline grid by source ‘m’ in years “y” Source of data to be Electricity delivered to baseline grid by sample group “m” is represented by power
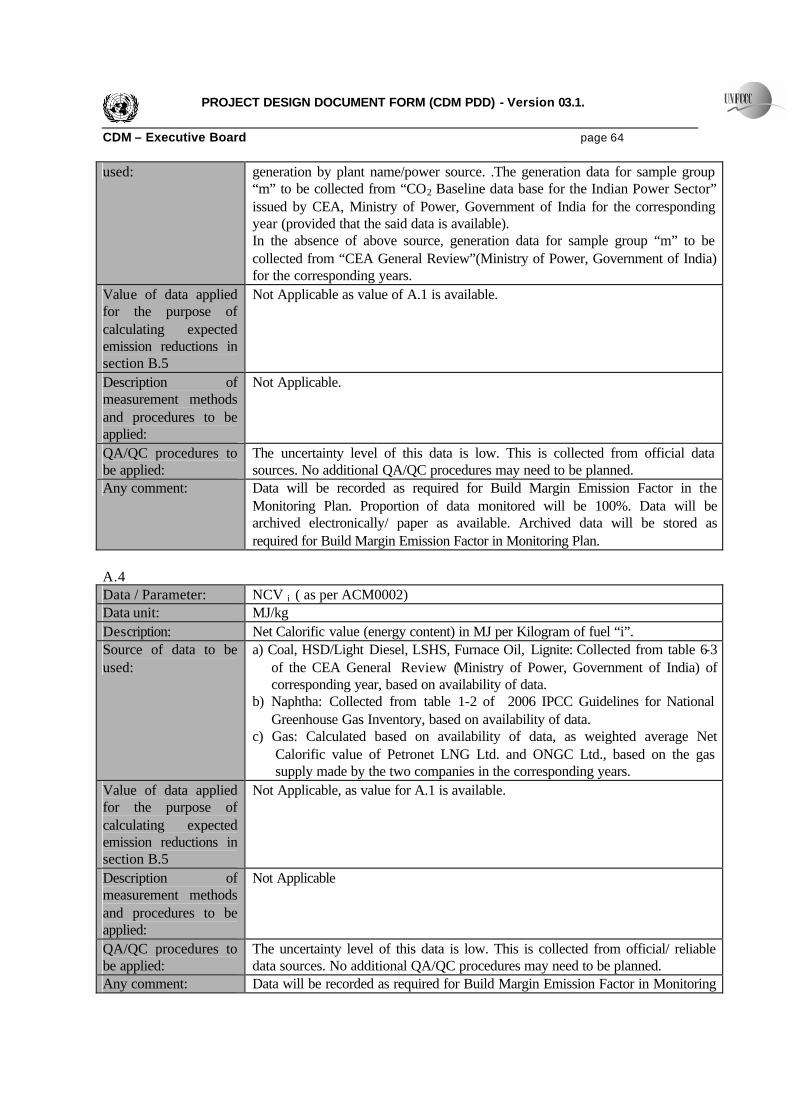
PROJECT DESIGN DOCUMENT FORM (CDM PDD) - Version 03.1. CDM – Executive Board page 64 used: generation by plant name/power source. .The generation data for sample group
“m” to be collected from “CO2 Baseline data base for the Indian Power Sector” issued by CEA, Ministry of Power, Government of India for the corresponding year (provided that the said data is available). In the absence of above source, generation data for sample group “m” to be collected from “CEA General Review”(Ministry of Power, Government of India) for the corresponding years.
Value of data applied for the purpose of calculating expected emission reductions in section B.5
Not Applicable as value of A.1 is available.
Description of measurement methods and procedures to be applied:
Not Applicable.
QA/QC procedures to be applied:
The uncertainty level of this data is low. This is collected from official data sources. No additional QA/QC procedures may need to be planned.
Any comment: Data will be recorded as required for Build Margin Emission Factor in the Monitoring Plan. Proportion of data monitored will be 100%. Data will be archived electronically/ paper as available. Archived data will be stored as required for Build Margin Emission Factor in Monitoring Plan.
A.4 Data / Parameter: NCV i ( as per ACM0002) Data unit: MJ/kg Description: Net Calorific value (energy content) in MJ per Kilogram of fuel “i”. Source of data to be used:
a) Coal, HSD/Light Diesel, LSHS, Furnace Oil, Lignite: Collected from table 6-3 of the CEA General Review (Ministry of Power, Government of India) of corresponding year, based on availability of data.
b) Naphtha: Collected from table 1-2 of 2006 IPCC Guidelines for National Greenhouse Gas Inventory, based on availability of data.
c) Gas: Calculated based on availability of data, as weighted average Net Calorific value of Petronet LNG Ltd. and ONGC Ltd., based on the gas supply made by the two companies in the corresponding years.
Value of data applied for the purpose of calculating expected emission reductions in section B.5
Not Applicable, as value for A.1 is available.
Description of measurement methods and procedures to be applied:
Not Applicable
QA/QC procedures to be applied:
The uncertainty level of this data is low. This is collected from official/ reliable data sources. No additional QA/QC procedures may need to be planned.
Any comment: Data will be recorded as required for Build Margin Emission Factor in Monitoring

PROJECT DESIGN DOCUMENT FORM (CDM PDD) - Version 03.1. CDM – Executive Board page 65
Plan. Proportion of data monitored will be 100%. Data will be archived electronically/ paper as available. Archived data will be stored as required for Build Margin Emission Factor in Monitoring Plan.
A.5 Data / Parameter: EF CO2,i _( as per ACM0002) Data unit: Kg C/GJ to be converted into tCO2 /TJ by multiplying with (44000/12000) Description: CO2 emission factor in tonnes per Tera Joule of the fuel “i” Source of data to be used:
Collected from table 1-3 of the 2006 IPCC Guidelines for National Greenhouse Gas Inventories, based on availability of data.
Value of data applied for the purpose of calculating expected emission reductions in section B.5
Not Applicable, as value for A.1 is available.
Description of measurement methods and procedures to be applied:
Not Applicable
QA/QC procedures to be applied:
The uncertainty level of this data is low. This is collected from reliable data sources. No additional QA/QC procedures may need to be planned.
Any comment: Data will be recorded as required for Build Margin Emission Factor in Monitoring Plan. Proportion of data monitored will be 100%. Data will be archived electronically/ paper as available. Archived data will be stored as required for Build Margin Emission Factor in Monitoring Plan.
A.6 Data / Parameter: OXID i _( as per ACM0002) Data unit: Number Description: Oxidation factor of the fuel “i” Source of data to be used:
IPCC Guidelines for default values in accordance with ACM0002.
Value of data applied for the purpose of calculating expected emission reductions in section B.5
Not Applicable, as value for A.1 is available.
Description of measurement methods and procedures to be applied:
Not Applicable
QA/QC procedures to be applied:
The uncertainty level of this data is low. This is collected from reliable data sources. No additional QA/QC procedures may need to be planned.
Any comment: Data will be recorded as required for Build Margin Emission Factor in Monitoring Plan. Proportion of data monitored will be 100%. Data will be archived electronically/ paper as available. Archived data will be stored as required for Build Margin Emission Factor in Monitoring Plan.

PROJECT DESIGN DOCUMENT FORM (CDM PDD) - Version 03.1. CDM – Executive Board page 66 A.7 Data / Parameter: Plant name/ Power source.(i.e. sample group “m” as per ACM0002 Build
Margin) Data unit: Text Description: Identification of power source/plant for the Build Margin Calculation Source of data to be used:
For monitoring during crediting period: Sample “m” plants and generation data thereof shall be collected from “CO2 Baseline data base for the Indian Power Sector” issued by CEA (Ministry of Power, Government of India) for the corresponding year (provided that the said data is available ). In the absence of the above source of data for any corresponding year, (a) the baseline grid generation (MWh) will be calculated from data collected from table 6.1 (Gross Generation) and 5.5 (Auxiliary consumption) CEA General Review (Ministry of Power, Government of India), as follows: (Gross Generation – Auxiliary Consumption) and (b) the data regarding capacity additions (i.e. recently built plants) made to the baseline grid will be collected from table 2.7 of CEA General Review (Ministry of Power, Government of India), of the corresponding year.
Value of data applied for the purpose of calculating expected emission reductions in section B.5
Not Applicable as value for A.1 is available.
Description of measurement methods and procedures to be applied:
Not Applicable
QA/QC procedures to be applied:
The uncertainty level of this data is low. This is collected from official data sources. No additional QA/QC procedures may need to be planned.
Any comment: Data will be recorded as required for Build Margin Emission Factor in Monitoring Plan. Proportion of data monitored will be 100% of set of plants. Data will be archived electronically/ paper as available. Archived data will be stored as required for Build Margin Emission Factor in Monitoring Plan.
B: Monitoring parameters for Project Activity: B1: Data / Parameter: FC f,y Data unit: m3 Description: Annual quantity of fuel “f” to be consumed in the project activity. In case,
monitoring and verification are planned to be completed for lesser or greater duration than a year, this parameter will be actual natural gas consumption value for such period.
Source of data to be used:
For the purpose of Section B5 and B6.3 : Calculated on the basis of a) Net electricity evacuated to the grid by the project plant , b) Gross Calorific value of

PROJECT DESIGN DOCUMENT FORM (CDM PDD) - Version 03.1. CDM – Executive Board page 67
fuel “f” and c) Gross station heat rate of Advanced Class Combined Cycle technology, as follows: ΣFC f,y (m3)= EGpj,y (GWh) * 10^6* Gross heat rate (kCal/kWh)*/ GCV (kCal/m3) {i.e. (a) * (c) / (b)} For monitoring during crediting period: Fuel flow meter reading at the project boundary. The consumption of natural gas will be metered daily using the turbine flow meter of the project activity which is located within the project boundary. The metering records will be maintained electronically. The metered readings will be cross-verified with the Natural Gas supplier(s)/ Natural Gas Transporter(s) bills. In case of any significant difference in the monthly consumption figures, the higher of the two readings (project-end and Natural Gas Supplier’s/ Natural Gas Transporter’s end) would be used.
Value of data applied for the purpose of calculating expected emission reductions in section B.5
1744834538.12 m3
Description of measurement methods and procedures to be applied:
For: For the purpose of Section B5 and B 6.3- Not Applicable. b) For monitoring during crediting period:-: The flow meter shall be used for the measurement of volume of fuel consumed. The total accuracy of turbine flow meter shall be at least +/- 0.5%.. The measurement shall be taken online by the mass flow meter and the same shall be recorded in the flow computer. All the measurement methods and procedure adopted shall be as per the industry practice.
QA/QC procedures to be applied:
Natural gas supply metering to the project will be subject to regular maintenance and testing in accordance with stipulation of the meter supplier, applicable industry and national standards and relevant agreements to ensure accuracy. These readings will be double checked (cross-verified) with the measurement provided by the gas supplier’s/ transporters . The flow meter shall be supplied by M/S Siemens and the calibration certificate shall be valid in accordance with the German Metering Calibration Rules, 1988
Any comment: Data will be recorded as per Monitoring Plan. Proportion of data monitored will be 100%. Data will be archived electronically/ paper as available. Archived data will be stored as per Monitoring Plan.
B2: Data / Parameter: NCV f,y Data unit: kCal/m3 (this will be converted to GJ/m3 by multiplying with (4.186/10 6̂), since 1
Cal = 4.186 J). Description: This is the average ‘Net Calorific Value’ of natural gas to be consumed in the
project activity. In case, Gross Calorific Value (GCV) is available instead of

PROJECT DESIGN DOCUMENT FORM (CDM PDD) - Version 03.1. CDM – Executive Board page 68
NCV, then GCV to NCV conversion will be completed using standard ASTM conversion procedures. These values will be obtained fort-nightly.
Source of data to be used:
For the purpose of Section B5 and B6.3 – a) Gas: Collected as weighted average Net Calorific value of Petronet LNG Ltd.
and ONGC Ltd., weights applied are .5 and .5 respectively (Gross calorific value is converted into Net calorific value by dividing the GCV by a factor 1.10).
b) For monitoring during crediting period – The data for NCV (GCV if available instead) will be provided by the gas supplier(s)/ gas transporter(s). In case GCV is available, then gas characteristics required for conversion of GCV to NCV will be obtained from the gas supplier(s)/ gas transporter(s).
Value of data applied for the purpose of calculating expected emission reductions in section B.5
0.036587733 GJ/m3
Description of measurement methods and procedures to be applied:
For: a) the purpose of Section B5 and B6.3- Not Applicable. b) monitoring during crediting period: - Not Applicable.
QA/QC procedures to be applied:
The uncertainty level of this data is low. No additional QA/QC procedures may need to be planned.
Any comment: Data will be recorded as per Monitoring Plan. Proportion of data monitored will be 100%. Data will be archived electronically/ paper as available. Archived data will be stored as per Monitoring Plan..
B3: Data / Parameter: EF CO2, f,y Data unit: Kg C/GJ to be converted into tCO2 /GJ Description: Emission factor for fuel “f” in tonnes of carbon dioxide per Giga Joule . Source of data to be used:
For the purpose of Section B5 and B6.3: Estimated on the basis of data collected from table 1-3 of the 2006 IPCC Guidelines for National Greenhouse Gas Inventories, based on availability of data. For monitoring during crediting period: Use supplier(s)/ transporter(s)-provided data, local data, country-specific /IPCC values, in that order of preference.
Value of data applied for the purpose of calculating expected emission reductions in section B.5
15.30 Kg C/ GJ /1000 *(44/12) =0.0561 t CO2/GJ
Description of measurement methods and procedures to be applied:
Not Applicable
QA/QC procedures to be applied:
The uncertainty level of this data is low. No additional QA/QC procedures may need to be planned.
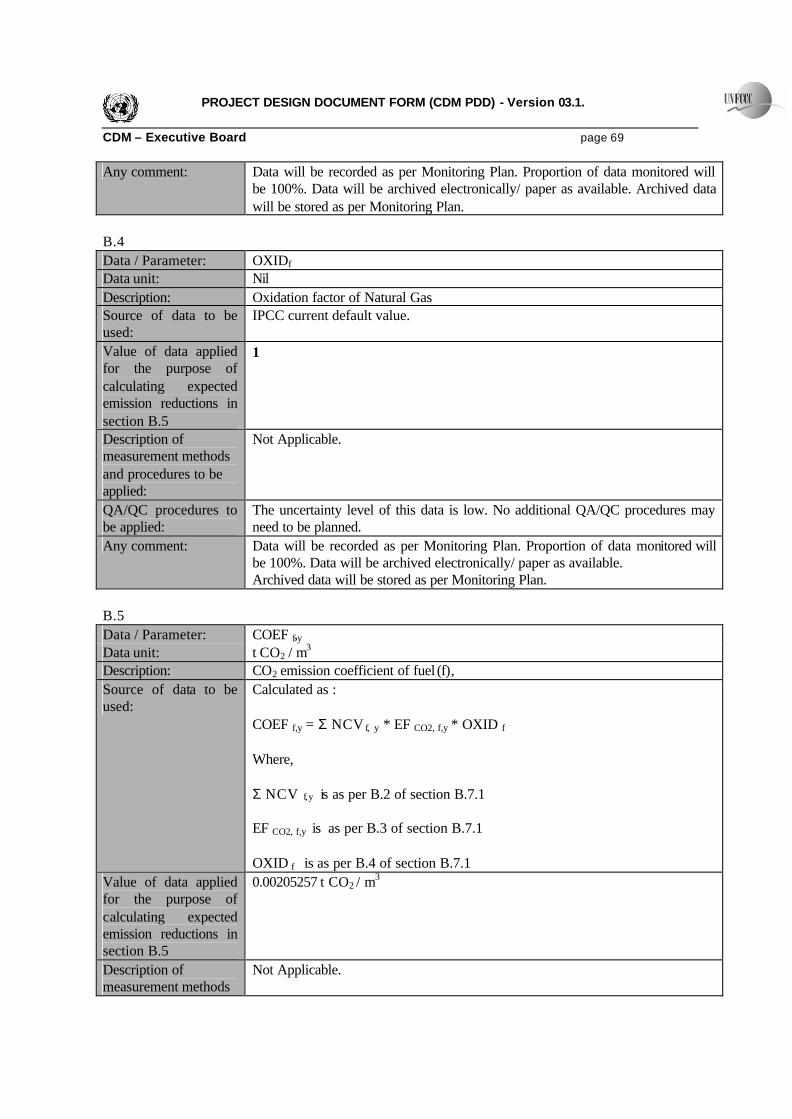
PROJECT DESIGN DOCUMENT FORM (CDM PDD) - Version 03.1. CDM – Executive Board page 69 Any comment: Data will be recorded as per Monitoring Plan. Proportion of data monitored will
be 100%. Data will be archived electronically/ paper as available. Archived data will be stored as per Monitoring Plan.
B.4 Data / Parameter: OXIDf Data unit: Nil Description: Oxidation factor of Natural Gas Source of data to be used:
IPCC current default value.
Value of data applied for the purpose of calculating expected emission reductions in section B.5
1
Description of measurement methods and procedures to be applied:
Not Applicable.
QA/QC procedures to be applied:
The uncertainty level of this data is low. No additional QA/QC procedures may need to be planned.
Any comment: Data will be recorded as per Monitoring Plan. Proportion of data monitored will be 100%. Data will be archived electronically/ paper as available. Archived data will be stored as per Monitoring Plan.
B.5 Data / Parameter: COEF f,y Data unit: t CO2 / m
3 Description: CO2 emission coefficient of fuel (f), Source of data to be used:
Calculated as : COEF f,y = Σ NCV f, y * EF CO2, f,y * OXID f
Where, Σ NCV f, y is as per B.2 of section B.7.1 EF CO2, f,y is as per B.3 of section B.7.1 OXID f is as per B.4 of section B.7.1
Value of data applied for the purpose of calculating expected emission reductions in section B.5
0.00205257 t CO2 / m3
Description of measurement methods
Not Applicable.

PROJECT DESIGN DOCUMENT FORM (CDM PDD) - Version 03.1. CDM – Executive Board page 70 and procedures to be applied: QA/QC procedures to be applied:
The uncertainty level of this data is low. No additional QA/QC procedures may need to be planned.
Any comment: Data will be calculated and recorded as per Monitoring Plan. Proportion of data monitored will be 100%. Data will be archived electronically/ paper as available. Archived data will be stored as per Monitoring Plan.
B.6 Data / Parameter: PE y Data unit: t CO2 Description: Project emissions due to combustion of fuel in tonnes of CO2 Source of data to be used:
Calculated under project activity as per equation no-2 of AM00029.
Value of data applied for the purpose of calculating expected emission reductions in section B.5
3581398.206 t CO2
Description of measurement methods and procedures to be applied:
Not Applicable.
QA/QC procedures to be applied:
The uncertainty level of this data is low. No additional QA/QC procedures may need to be planned.
Any comment: Data will be calculated and recorded as per Monitoring Plan. Proportion of data monitored will be 100%. Data will be archived electronically/ paper as available. Archived data will be stored as per Monitoring Plan.
C: Monitoring parameters for Leakages: C-1: Data / Parameter: FC y Data unit: m3 Description: Quantity of natural gas combusted in the project plant during the year “y” in cubic
meters. Source of data to be used:
Refer to table B.1 “fuel consumption for the project activity” under sub section B “ Monitoring parameters for project activity” of section B.7.1
Value of data applied for the purpose of calculating expected emission reductions in section B.5
1744834538.12 m3
Description of measurement methods and procedures to be applied:
Refer to table B.1 “fuel consumption for the project activity” under sub section B “Monitoring parameters for project activity” of section B.7.1.

PROJECT DESIGN DOCUMENT FORM (CDM PDD) - Version 03.1. CDM – Executive Board page 71 QA/QC procedures to be applied:
Refer to table B.1 “fuel consumption for the project activity” under sub section B “ Monitoring parameters for project activity” of section B.7.1
Any comment: Refer to table B.1 “fuel consumption for the project activity” under sub section B “ Monitoring parameters for project activity” of section B.7.1
C.2 : Data / Parameter: NCV NG,y , NCV y Data unit: GJ/ m3 Description: Average net Calorific value of natural gas combusted in the project plant during
the year “y” in Giga joules per cubic meter. Source of data to be used:
Refer to table B.2 “Net calorific value of fuel used in project activity” under sub section B “ Monitoring parameters for project activity” of section B.7.1
Value of data applied for the purpose of calculating expected emission reductions in section B.5
0.036587733 GJ/m3
Description of measurement methods and procedures to be applied:
Refer to table B.2 “Net calorific value of fuel used in project activity” under sub section B “ Monitoring parameters for project activity” of section B.7.1
QA/QC procedures to be applied:
Refer to table B.2 “Net calorific value of fuel used in project activity” under sub section B “ Monitoring parameters for project activity” of section B.7.1
Any comment: Refer to table B.2 “Net calorific value of fuel used in project activity” under sub section B “ Monitoring parameters for project activity” of section B.7.1
C.3: Data / Parameter: EG PJ,y Data unit: MWh Description: Net annual electricity generated in the project plant (delivered to the grid) during
any year ’y’. In case the monitoring and verification period selected is different from a full 12 month period, actual net electricity delivered to the grid will be used.
Source of data to be used:
a) For the purposes of Section B5 and B6.3- Estimated based on 1) Capacity of the project plant 2) EPC Contractor’s guarantee of an equivalent availability factor at 93 % and 3) Auxiliary consumption (AUX) which is estimated at 3% and is based on note V to regulation 16 of Central Electricity Regulation Commission (CERC) guideline for tariff calculation. For monitoring during crediting period- Measured and recorded by the online energy meter installed in the plant. Data will be recorded and archived in the power plant.
Value of data applied for the purpose of calcula ting expected emission reductions in
9067999.4 MWh

PROJECT DESIGN DOCUMENT FORM (CDM PDD) - Version 03.1. CDM – Executive Board page 72 section B.5 Description of measurement methods and procedures to be applied:
For the purpose of Section B5 and B6.3 - Not Applicable. b) For ex- post calculations- The electricity meter to be installed on-site will be used for the measurement of net electricity generated from the project activity and delivered to the grid. In case, gross electricity generated and auxiliary consumption meters are available, the difference between the two could also be used to cross-check the net electricity export meter. The data will be cross-verified with data recorded by the grid/ recipient.
QA/QC procedures to be applied:
The accuracy level of all the electricity meters under the control of the project participant is of accuracy class 0.2 . The measurement and calibration procedure shall be done as specified in the CEA (Government/Regulatory authority) regulations. The measurement equipments shall be ‘Availability Based Tariff compliant’ as specified in the CEA regulations(Ministry of Power, Government of India). The measurement will be done on-line and the data is recorded in the control system. Thus, the uncertainty level of this data is low, and no additional QA/QC procedures will be applied.
Any comment: Data will be recorded as per Monitoring Plan. Proportion of data monitored will be 100%. Data will be archived electronically/ paper as available. Archived data will be stored as per Monitoring Plan.
C.4: Data / Parameter: FC LNG,y ( for CO2 emissions from LNG) Data unit: m3 (which is to be converted in terms of Tara Joules on the basis of a) GCV of
Gas provided by fuel supplier(s) and b) 1 calories =4.186 joules) Description: Quantity of LNG purchased during the year “y” in terms of cubic meters Source of data to be used:
For the purposes of Section B5 and B6.3: 50% of the power evacuated to the grid is expected to be generated using LNG. GCV is 9879.1 Kcal/ m3 based on Petronet LNG Ltd. supplies. For monitoring during crediting period: On daily basis based on readings provided by fuel suppliers during the year “y” The daily readings shall be cross checked with the fortnightly invoices from the fuel suppliers.
Value of data applied for the purpose of calculating expected emission reductions in section B.5
849055020.6 m3 or 35111.74712 TJ
Description of measurement methods and procedures to be applied:
Not applicable
QA/QC procedures to be applied:
The uncertainty level of this data is low. This is collected from daily “LNG consumption readings” and cross checked with fortnightly invoices which are processed for payment.. No additional QA/QC procedures may need to be planned.
Any comment: 1) Data will be recorded as per Monitoring Plan. Proportion of data monitored

PROJECT DESIGN DOCUMENT FORM (CDM PDD) - Version 03.1. CDM – Executive Board page 73
will be 100%. Data will be archived electronically/ paper as available. Archived data will be stored as per Monitoring Plan. The daily data shall be cross checked with the fortnightly invoices from the fuel supplier. 2) The reason for including this as a parameter for monitoring is that this data
varies and is required for calculating LELNG,CO2,y. B.7.2 Description of the monitoring plan:
>> The monitoring plan for this project activity includes details of the operational and management structure that Torrent Power Limited is developing to monitor emission reductions during the crediting period, including measurement of those parameters in baseline, project and leakage emission scenarios that will be used to calculate actual emission reductions. It also identifies the team and responsibilities for monitoring the relevant parameters, data archiving and calibration of equipment and procedures. The monitoring plan is organized as per information provided below, and the detailed background information are included under Annex 4. • Introduction about the monitoring plan • Obligations of CDM Manager • Description of data required to be monitored • Approach used in the monitoring plan • Organizational structures & procedures for collection, processing, review, storage and reporting of
data • Description of workbook for emission reduction calculations • Organizational structures & procedures during project implementation. B.8 Date of completion of the application of the baseline study and monitoring methodology and the name of the responsible person(s)/entity(ies) >> (1) The details of baseline information are included in Annex 3. (2)The date of completion of the application of the methodology to the project activity is 09.12.2006. (3) Mr. Deepak Dalal of Torrent Power Ltd. is responsible for the application of the baseline and monitoring methodology to the project activity and the entity (viz. Torrent Power Ltd) is also a project participant listed in Annexure-1
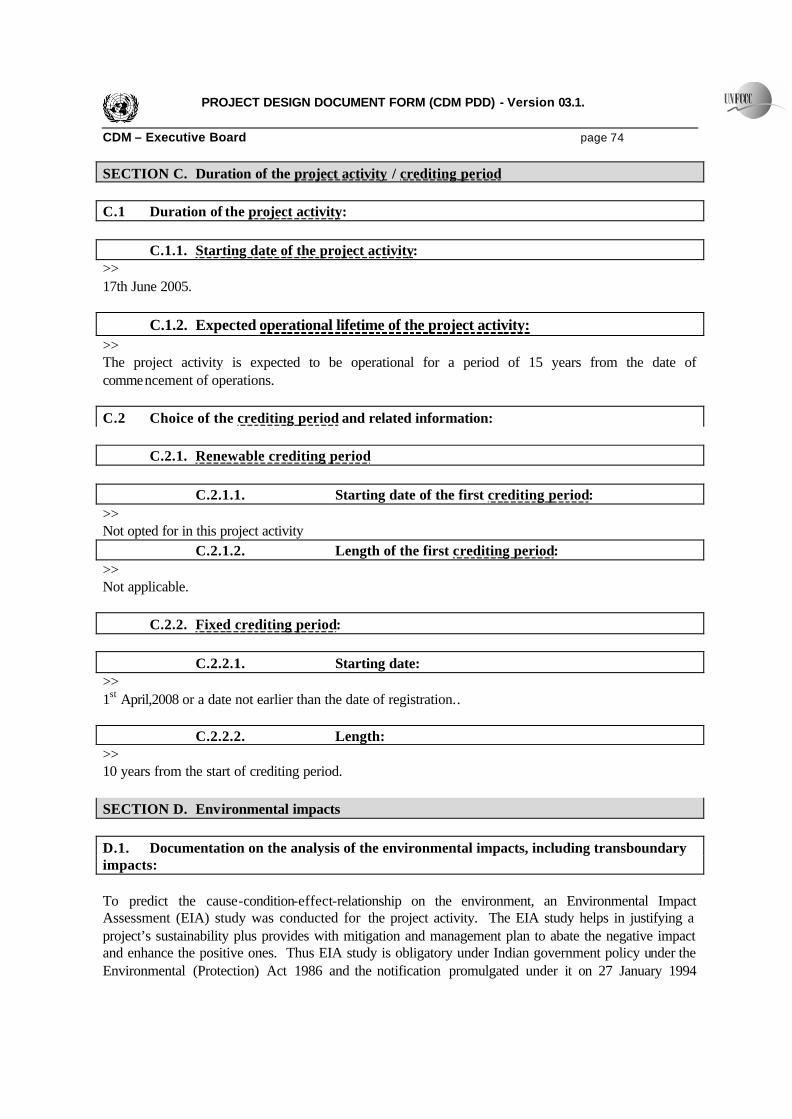
PROJECT DESIGN DOCUMENT FORM (CDM PDD) - Version 03.1. CDM – Executive Board page 74 SECTION C. Duration of the project activity / crediting period C.1 Duration of the project activity: C.1.1. Starting date of the project activity: >> 17th June 2005. C.1.2. Expected operational lifetime of the project activity: >> The project activity is expected to be operational for a period of 15 years from the date of commencement of operations. C.2 Choice of the crediting period and related information: C.2.1. Renewable crediting period C.2.1.1. Starting date of the first crediting period: >> Not opted for in this project activity C.2.1.2. Length of the first crediting period: >> Not applicable. C.2.2. Fixed crediting period: C.2.2.1. Starting date: >> 1st April,2008 or a date not earlier than the date of registration.. C.2.2.2. Length: >> 10 years from the start of crediting period. SECTION D. Environmental impacts D.1. Documentation on the analysis of the environmental impacts, including transboundary impacts: To predict the cause-condition-effect-relationship on the environment, an Environmental Impact Assessment (EIA) study was conducted for the project activity. The EIA study helps in justifying a project’s sustainability plus provides with mitigation and management plan to abate the negative impact and enhance the positive ones. Thus EIA study is obligatory under Indian government policy under the Environmental (Protection) Act 1986 and the notification promulgated under it on 27 January 1994

PROJECT DESIGN DOCUMENT FORM (CDM PDD) - Version 03.1. CDM – Executive Board page 75 (amended on 04/05/1994, 10/04/1997, 27/1/2000 and 13/12/2000). The EIA report can be verified by the Designated Operational Entity. After conducting the EIA study it was found that the project activity benefits the local, regional and global environment in various ways. Reduced additional GHG emission in relation to the baseline emissions which includes huge emissions of carbon dioxide, sulphur dioxide, oxides of nitrogen, and particulate matter that would have occurred in absence of this project in Business-as-usual case. Another redeeming feature is that the project reduced adverse impacts related to air emission at coal mines, as well as elimination of fuel required for transportation of coal that would have been required to meet the additional capacity requirement of coal based thermal power stations. Also, it may be noted that there are no trans-boundary impacts due to this project activity. A summary the findings from the EIA report and an action plan for mitigation of negative environmental impact are provided in appendix-3. D.2. If environmental impacts are considered significant by the project participants or the host Party, please provide conclusions and all references to support documentation of an environmental impact assessment undertaken in accordance with the procedures as required by the host Party: >> The Environment Impact Assessment study did not indicate any significant environmental impacts. However, mitigative measures have been taken up for lesser impacts also, as per details provided in D.1. Regular monitoring of all significant environmental parameters is essential to check the compliance status vis-à-vis the environmental laws and regulations. The objectives of the monitoring will be as follows:
• To verify the results of the impact assessment study with respect to the proposed project. • To study the trend of concentration values of the parameters, which have been, identified as
critical and planning the mitigative measures. • To check and assess the efficacy of pollution control equipment. • To ensure that any additional parameters, other than those identified in the impact, do not
become critical after the commissioning of the project activity. All necessary steps will be taken to monitor the efficiency of pollution control equipment on regular basis. Regular monitoring and vigilance of the surrounding environmental quality will be done. All necessary stipulations and legal requirements of Gujarat Pollution Control Board and Ministry of Environment & Forests will be fully complied. Though this project may have insignificant adverse impact on the biological environment, if all the recommended mitigative measures are followed, then the impacts will be manageable and, affect a very limited area. The adverse impact will be greatly offset by the many positive socio-economic impacts that will flow directly from the project. The project is likely to have impacts on the community lifestyle (day to day activity of the people living near the plant). Torrent is committed to develop the surrounding area in a manner that balances consistently the societal & environmental requirements while safeguarding the environmental and social

PROJECT DESIGN DOCUMENT FORM (CDM PDD) - Version 03.1. CDM – Executive Board page 76 features. Implementing a public relations strategy; employing locals; buying local goods and services; encouraging local entrepreneurship, involving women participation in conservation efforts and creating awareness about environmental health and pollution and encouraging respect for local traditions and religious beliefs (all of them on reasonable endeavour basis) will offset the negative environmental impacts SECTION E. Stakeholders’ comments >> E.1. Brief description how comments by local stakeholders have been invited and compiled: >> Torrent identified local communities, NGOs, state government and governmental agencies, employees, contractors and consultants/ advisors as the most important stakeholders with an interest in the proposed CDM project activity. Accordingly, Torrent sent out a notice on 11th August,2004 to representatives of various stakeholder groups viz Government of Gujarat, Gujarat Control Pollution Board, 5 NGOs, representatives of 4 surrounding villages, 4 contractors, 20 employees of Torrent and 3 consultants, with a brief on the project, informing them of the proposed meeting on 26th August 2004 at Uma Mangal Hall, Kamrej Char Rasta, Kamrej, Surat District (in which district the project activity is located at Akhakhol Village) and requesting each stakeholder group to send representatives to the said meeting at the appointed hour. Also the aforesaid notice was placed at the Mamlatdar Office, Kamrej on 11 th August, 2004. This notice also gave time for the various stakeholders to file their observations by 6th September, 2004 in writing. There were 42 participants representing various parties including from local communities, NGOs, state government, employees, and contractors who attended the meeting on 26th August 2004. Villagers from the vicinity also showed interest in the project and related social and environmental development activities. The meeting agenda was as follows: a) Welcome address to the representatives by Mr. Dipen Chauhan of Torrent b) Election of a Chairperson for the meeting by the stakeholder group representatives from amongst themselves. c) Introduction of the project by Mr. Deepak Dalal, Executive Director Torrent, on request from the Chair. d) Open house discussion on the merits of the project with permission of the Chair. e) Summation of the concerns expressed by the stakeholder groups and the commitments to address the concerns made by Torrent by the Chairperson. f) Preparation and circulation of draft Minutes of the Meeting and signing of the MOM. E.2. Summary of the comments received: >>

PROJECT DESIGN DOCUMENT FORM (CDM PDD) - Version 03.1. CDM – Executive Board page 77 After a brief discussion regarding the pros and cons of this project the chair person interacted with the participants to clarify their doubts and concerns regarding the likely impacts of the project. The stakeholders viewed Torrent Group as a reputed group of companies contributing to the local economy. The participants sought clarifications on Kyoto Protocol and Clean Development Mechanism processes. Overall there was agreement that the proposed project had nil or negligible effect on people or their livelihood and that the project activity is a beneficial project. .Detailed comments and responses are shown in the table in section E.3. E.3. Report on how due account was taken of any comments received: >> Torrent clarified all the stake holder’s concerns by providing relevant evidence of the project claims and answered all question to the satisfaction of the participants. Detailed MOM delineating the above concerns and Torrents responses has been recorded and appended hereunder Summary Record of the proceedings of Stakeholder Consultation meeting held at Uma Mangal Hall, Kamrej Char Rasta, Kamrej, Dist. Surat, Gujarat, India on 26.08.2004, 11.30 am Local stakeholder consultation meeting to discuss stakeholder concerns on proposed Clean Development Mechanism (CDM) project – Natural Gas based Combined Cycle Power Plant of capacity 1050 (+10%) MW by Torrent Power Generation Ltd. (TPGL) (which has since merged into Torrent Power Limited).

PROJECT DESIGN DOCUMENT FORM (CDM PDD) - Version 03.1. CDM – Executive Board page 78 Date and Venue: 26.08.2004, 11.30 am at Uma Mangal Hall, Kamrej Char Rasta, Kamrej, Dist. Surat, Gujarat, India Mr. Dipen Chauhan of TGPL introduced the objective of the meeting. He further suggested the participants to elect a chairman to conduct the meeting. Mr. Dinesh Mehta had proposed the name of Mr. Dhiraj Sanghani, Mamlatdar and Executive Magistrate Kamrej, and Mr. Bharatbhai Patel seconded the proposal. Accordingly, Mr. Dhiraj Sanghani, as a chairman, further conducted the meeting. Agenda set in the notification for the meeting by TORRENT was approved by Mr. Dhiraj Sanghani and obtained the consent of the participants to the agenda. Subsequently, Mr. Deepak Dalal was invited to provide a brief on the CDM project cycle and the role of local stakeholders in the project. He briefed the participants about the Kyoto Protocol and clean development mechanisms there in and elaborated the need for the project under this mechanism to catalyze sustainable development. He also outlined that the local stakeholders concern are to be internalized in any project under clean development mechanism of the Kyoto Protocol. Brief understanding of the project, elucidating the likely environmental and social impacts of the project, followed by the salient technical and environmental features of the project and how the proposed Natural Gas based Combine Cycle Power Plant of 1050 MW (±10%) would reduce GHG emissions was also mentioned. The Chairman called upon the participants to seek clarifications and express their concerns on the likely impacts of the project, and it being structured as clean development mechanisms project under Kyoto Protocol. Participants were also given further time to go through the project documents that are made available at the site of the meeting. The stakeholders viewed Torrent Group as a reputed group of companies contributing to local economy. The participants sought clarifications on Kyoto Protocol and Clean Development Mechanisms process. Overall there was agreement that the proposed project was a beneficial project from sustainability viewpoint. Specific concerns and questions and the answers are delineated in the table below. Stakeholder concern / question / comment Answer / outcome Public Concern Does this project lead to increase in discharge of gaseous, liquid and/or solid wastes? If yes, what are the impacts?
No. Instead the project by avoiding use of conventional fuel that is coal, reduces emission of CO2, and avoids emission of SO2 and SPM. It also avoids generation of fly ash and other problems associated with handling coal such as excess land requirement for storage and usage of coal, land degradation and effluents. The project also avoids emission of excessive NOx unlike many similar power projects in India by using an advanced technology. No industrial effluents with pollution potential will be discharged from the project.

PROJECT DESIGN DOCUMENT FORM (CDM PDD) - Version 03.1. CDM – Executive Board page 79 Stakeholder concern / question / comment Answer / outcome What technology to be employed? The project utilizes a technology that aims at
maximizing efficiency of production and reducing emission of NOx.
What are the socio-economic and welfare development programs be initiated for the area?
Community development plan will be introduced, which will encourage local entrepreneurship, provide employment to locals. Training programs for developing self-sufficiency among the local youth will be organized. Programs like tree planting, free health check-ups and medicines, donation of building materials and furniture, local school building renovation, are also included in the socio-economic development plan. Locally available service of farmers, plumbers, electricians, vehicle repair shops, shopkeepers and traders, hotels and eateries will be utilized to be maximum.
Does the project increase employment opportunities in the area?
The project requires labour during construction phase and operation phase (at designated areas of operation and utilities, such as green-belt maintenance, house-keeping, etc).
What are the contributions of the project activity to the sustainable development of around the project area?
The project will lead to sustainable development around the project area by contributing to the development of local economy and create jobs and employment in and around the project site. The project will use clean fuel and better technology that helps in minimizing pollution potential that is usually associated with other power generators in India.
What is the role of Torrent in CDM and Kyoto Protocol?
Torrent as a responsible corporate citizen volunteers to support the cause behind Kyoto Protocol. The group believes that all developmental projects should be evaluated against their potential for emission/discharge/disturbance reduction and

PROJECT DESIGN DOCUMENT FORM (CDM PDD) - Version 03.1. CDM – Executive Board page 80 Stakeholder concern / question / comment Answer / outcome environment restoration opportunities. Such
projects, often require overcoming some barriers which are institutional, technological, organizational but can be financially feasible.
NGO’s Concerns
Will the emissions from the project affect the life of flora in the region?
No. The project emissions CO2 and some NOx are very less compared to conventional projects and no impacts are expected.
How do CO2 emissions contribute to global warming? CO2 emissions when present in the atmosphere prevent escape of solar heat energy from the earth’s surface, resulting in heat build-up and global warming.
What are the safety practices to be adopted for this project?
Fire fighting facilities with water reservoir reservoirs, pumps and hydrant networks, detailed and documented on-site and off-site emergency procedures, active and passive accident control equipment and risk mitigation measures will be implemented. Formation of safety department of TORRENT will also be taken up. Continuous preventive measures, training and mock-drills will be implemented as per disaster management plan for the project.
What other socio -economic development can be availed from the project?
The project will bring many other indirect employment opportunities in the region due to development of infrastructure (roads), TORRENT housing colony, and other banking and co-operative societies around the project site.
Contractor’s Concerns
What is the cost of the project? Rs. 3,256 Crore (US$ 723.56 Mn) What is the projected timeline? Above 15 years. Employee’s Concerns How many CDM projects have happened in India so far?
Around 50 projects in various stages of development.
Does this project require new skills and how are you going to provide them?
The engineers and technicians to be employed for the project will undergo enhancement of skill through appropriate training as required for the type of activity to be performed.

PROJECT DESIGN DOCUMENT FORM (CDM PDD) - Version 03.1. CDM – Executive Board page 81
Stakeholder concern / question / comment Answer / outcome
Are there any occupational health impacts from this project?
No. Every employee will be regularly covered under mandatory health check-up as per requirements of Factories Act. Additionally the low noise turbine will be installed and personal protective equipments will be provided to the employment working in noise prone zone.
Does this project lead to cost savings in energy production as compared to conventional fossil fuel projects?
Marginally higher operational costs are expected due to higher environmental benefits from the project due to use of a better technology and a cleaner fuel. CDM benefits are expected to offset partially this disadvantage.
Subsequent to questions and answers, chairman summarized the concerns articulated and clarifications provided. Further, Mr. Dipen Chauhan from TORRENT thanked the chair and also all the participants. Signed by Chairman of the meeting TORRENT also informed the stakeholders that the project activity would contribute to the sustainable development of the region and country by facilitating and catalyzing local and regional opportunities, thereby creating sustainable economic, social and environmental value. No comments were received in writing from the various stakeholders in response to the notice dated 11th August, 2004 by 6th September, 2004 the date stipulated in the notice.

PROJECT DESIGN DOCUMENT FORM (CDM PDD) - Version 03.1. CDM – Executive Board page 82
Annex 1
CONTACT INFORMATION ON PARTICIPANTS IN THE PROJECT ACTIVITY
Organization: Torrent Power Limited
Street/P.O.Box: Ashram Road, Building: Torrent House City: Ahmedabad State/Region: Gujarat Postfix/ZIP: 380009 Country: India Telephone: +91-92742 10100 FAX: +91-92742 10199 E-Mail: [email protected] URL: www.torrentpower.com Represented by: Title: Executive Director Salutation: Mr. Last Name: Dalal Middle Name: First Name: Deepak Department: Site Mobile: +91-9227433549 Direct FAX: +91-92742 10199 Direct tel: +91-9274210101 Personal E-Mail: [email protected]

PROJECT DESIGN DOCUMENT FORM (CDM PDD) - Version 03.1. CDM – Executive Board page 83
Annex 2
INFORMATION REGARDING PUBLIC FUNDING No public funding or Official Development Assistance is involved.

PROJECT DESIGN DOCUMENT FORM (CDM PDD) - Version 03.1. CDM – Executive Board page 84
Annex 3
BASELINE INFORMATION
A. Calculation of Baseline emission factor, Project Emissions, Leakages enclosed as spreadsheet calculations.
Table -1 : Low Cost / Must Run Plants (% of net generation)
Year 2000-01 2001-02 2002-03 2003-04 2004-05 Low Cost % of Total Generation in the Western Regional Grid i.e. Baseline Grid
8.2%
8.5%
8.2%
9.1%
8.8%
Average Of Low Cost % For Past 5 Years
8.56%
Data Source: CO2 Baseline Database for the Indian Power Sector issued by Central Electricity Authority, Ministry Of Power, Government of India December, 2006.) (http://www.cea.nic.in/planning/c%20and%20e/Government%20of%20India%20website.htm)
B. Emission Reduction Calculations:
Calculation of Emission factor of technology, identified as the most likely Baseline Scenario (EF BL,CO2)
Table M.1- Calculation of Emission factor of technology, identified as the most likely Baseline Scenario
Particulars Value Unit
CO2 Emission Co-efficient (COEF BL) (note-1) 0.093884 t CO2e/ GJ Energy Efficiency (η BL) (note-2) 35.10% % Emission factor of technology, identified
as the most likely Baseline Scenario (EF BL,CO2) 962.91282 t CO2/ GWh Data Sources note 1) Refer to "Working note-1:Calculation of CO2 Emission Co-efficient (COEF BL)" note 2) Collected from official source i.e., Note iii to Regulation 16 (Gross Station Heat rate for coal
based thermal power stations, installed capacity 500MW and above) of tariff regulations issued by CERC- www.cercind.org
Working note-1: Calculation of CO2 Emission Co-efficient (COEF BL) Particulars Value Unit
Net Calorific value (note-3) 3625 Kcal/Kg CO2 Emission Factor (note-3) 95.80 t CO2/ TJ Oxidation factor (note-3) 0.98 CO2 Emission Co-efficient (COEF BL) (note-4) 1.42442962 t CO2e/ tonne
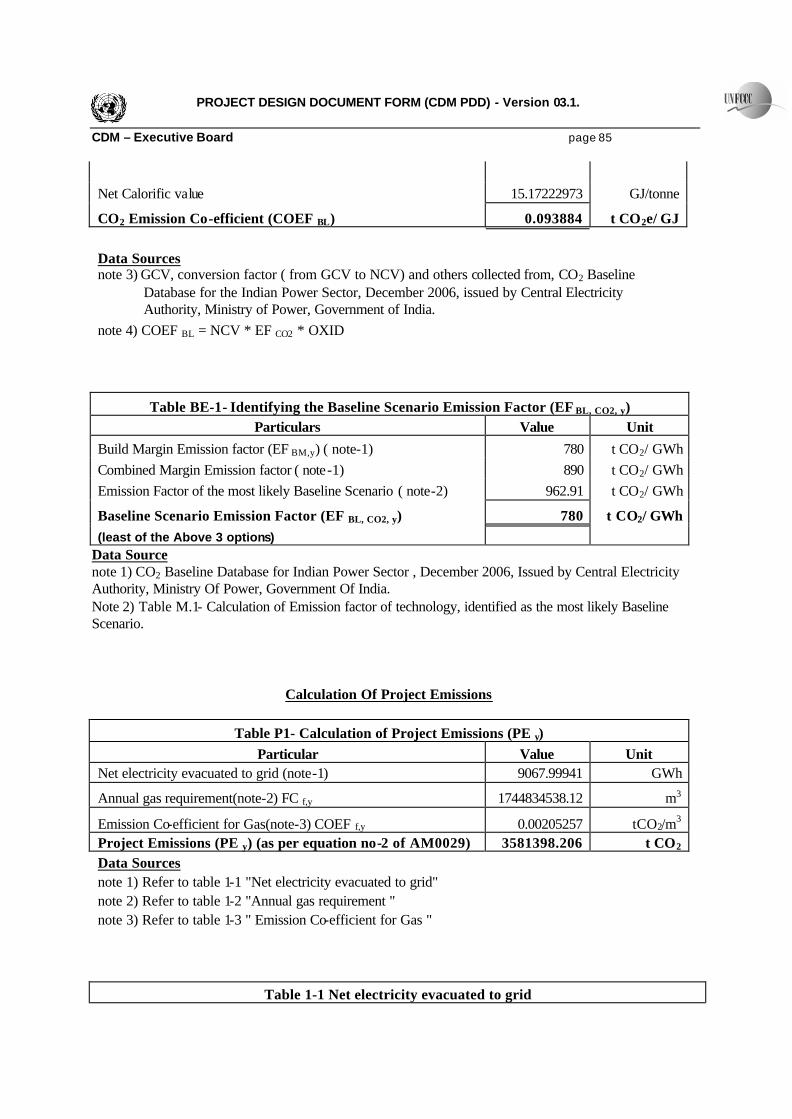
PROJECT DESIGN DOCUMENT FORM (CDM PDD) - Version 03.1. CDM – Executive Board page 85
Net Calorific value 15.17222973 GJ/tonne
CO2 Emission Co-efficient (COEF BL) 0.093884 t CO2e/ GJ
Data Sources note 3) GCV, conversion factor ( from GCV to NCV) and others collected from, CO2 Baseline
Database for the Indian Power Sector, December 2006, issued by Central Electricity Authority, Ministry of Power, Government of India.
note 4) COEF BL = NCV * EF CO2 * OXID
Table BE-1- Identifying the Baseline Scenario Emission Factor (EF BL, CO2, y) Particulars Value Unit
Build Margin Emission factor (EF BM,y) ( note-1) 780 t CO2/ GWh Combined Margin Emission factor ( note-1) 890 t CO2/ GWh Emission Factor of the most likely Baseline Scenario ( note-2) 962.91 t CO2/ GWh
Baseline Scenario Emission Factor (EF BL, CO2, y) 780 t CO2/ GWh (least of the Above 3 options)
Data Source note 1) CO2 Baseline Database for Indian Power Sector , December 2006, Issued by Central Electricity Authority, Ministry Of Power, Government Of India. Note 2) Table M.1- Calculation of Emission factor of technology, identified as the most likely Baseline Scenario.
Calculation Of Project Emissions
Table P1- Calculation of Project Emissions (PE y) Particular Value Unit
Net electricity evacuated to grid (note-1) 9067.99941 GWh
Annual gas requirement(note-2) FC f,y 1744834538.12 m3
Emission Co-efficient for Gas(note-3) COEF f,y 0.00205257 tCO2/m3 Project Emissions (PE y) (as per equation no-2 of AM0029) 3581398.206 t CO2 Data Sources note 1) Refer to table 1-1 "Net electricity evacuated to grid" note 2) Refer to table 1-2 "Annual gas requirement " note 3) Refer to table 1-3 " Emission Co-efficient for Gas "
Table 1-1 Net electricity evacuated to grid
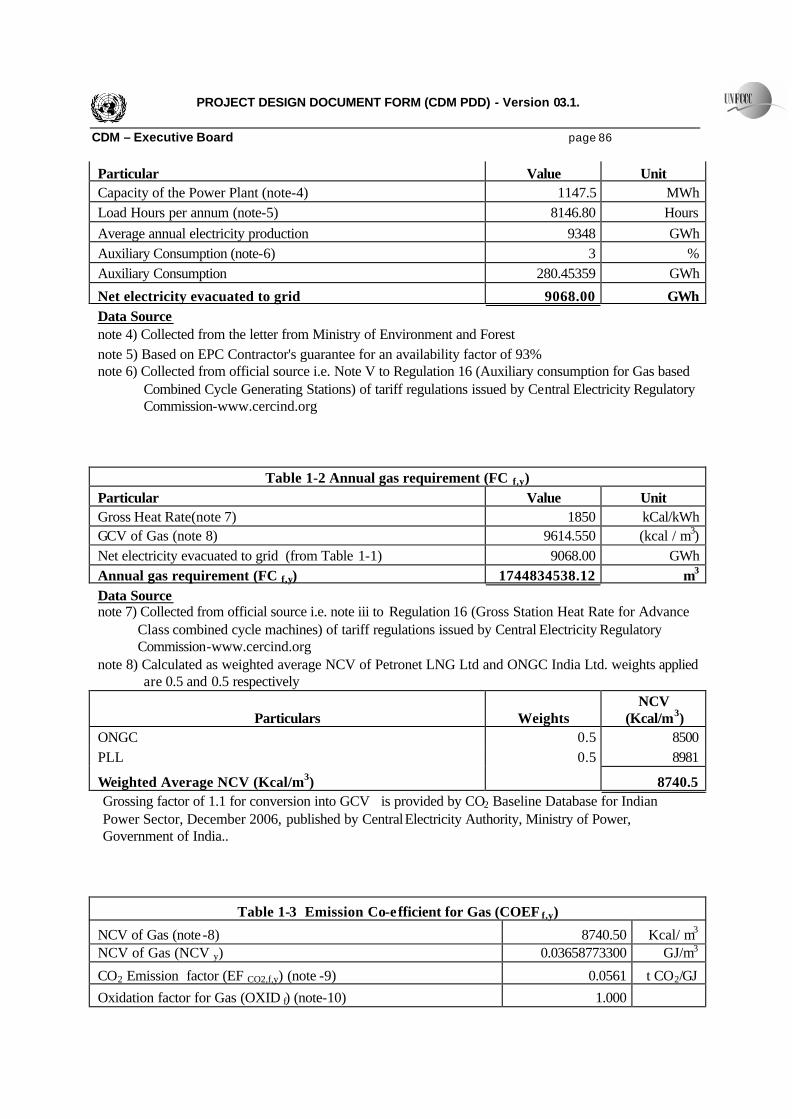
PROJECT DESIGN DOCUMENT FORM (CDM PDD) - Version 03.1. CDM – Executive Board page 86 Particular Value Unit Capacity of the Power Plant (note-4) 1147.5 MWh Load Hours per annum (note-5) 8146.80 Hours Average annual electricity production 9348 GWh Auxiliary Consumption (note-6) 3 % Auxiliary Consumption 280.45359 GWh
Net electricity evacuated to grid 9068.00 GWh Data Source note 4) Collected from the letter from Ministry of Environment and Forest note 5) Based on EPC Contractor's guarantee for an availability factor of 93% note 6) Collected from official source i.e. Note V to Regulation 16 (Auxiliary consumption for Gas based
Combined Cycle Generating Stations) of tariff regulations issued by Central Electricity Regulatory Commission-www.cercind.org
Table 1-2 Annual gas requirement (FC f,y) Particular Value Unit Gross Heat Rate(note 7) 1850 kCal/kWh GCV of Gas (note 8) 9614.550 (kcal / m3) Net electricity evacuated to grid (from Table 1-1) 9068.00 GWh Annual gas requirement (FC f,y) 1744834538.12 m3 Data Source note 7) Collected from official source i.e. note iii to Regulation 16 (Gross Station Heat Rate for Advance
Class combined cycle machines) of tariff regulations issued by Central Electricity Regulatory Commission-www.cercind.org
note 8) Calculated as weighted average NCV of Petronet LNG Ltd and ONGC India Ltd. weights applied are 0.5 and 0.5 respectively
Particulars Weights NCV
(Kcal/m3) ONGC 0.5 8500 PLL 0.5 8981
Weighted Average NCV (Kcal/m3) 8740.5 Grossing factor of 1.1 for conversion into GCV is provided by CO2 Baseline Database for Indian Power Sector, December 2006, published by Central Electricity Authority, Ministry of Power, Government of India..
Table 1-3 Emission Co-efficient for Gas (COEF f,y)
NCV of Gas (note -8) 8740.50 Kcal/ m3 NCV of Gas (NCV y) 0.03658773300 GJ/m3
CO2 Emission factor (EF CO2,f,y) (note -9) 0.0561 t CO2/GJ Oxidation factor for Gas (OXID f) (note-10) 1.000
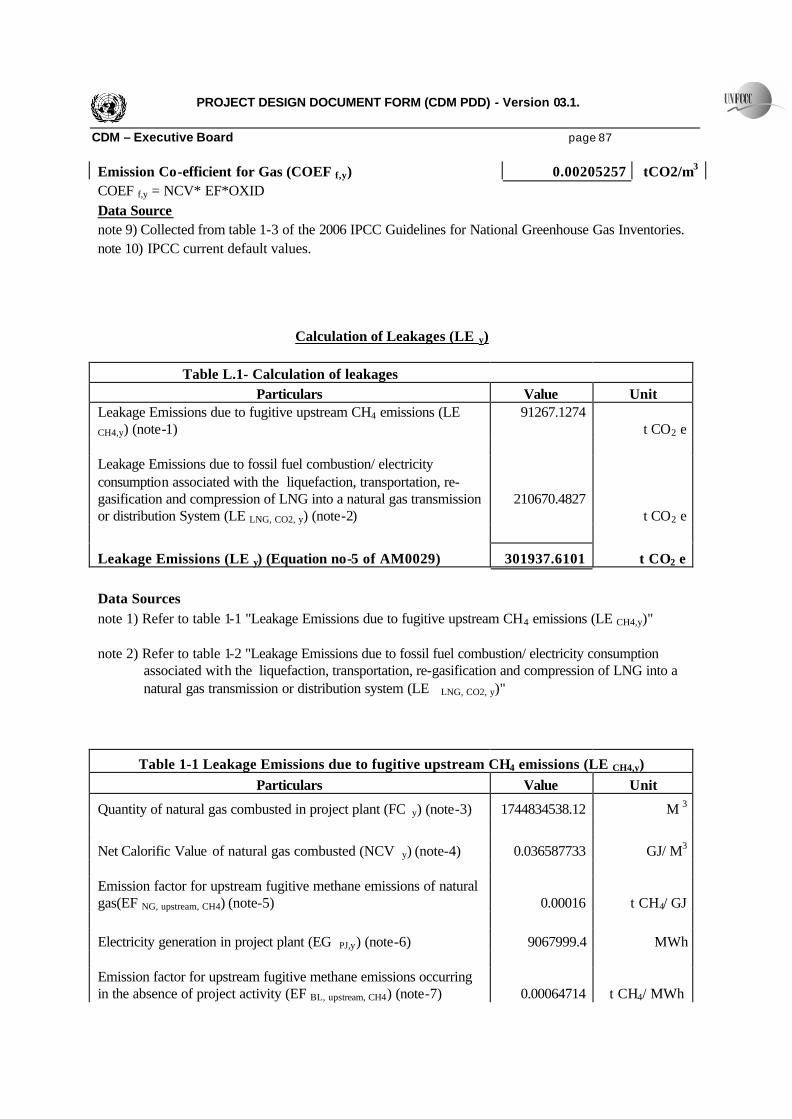
PROJECT DESIGN DOCUMENT FORM (CDM PDD) - Version 03.1. CDM – Executive Board page 87 Emission Co-efficient for Gas (COEF f,y) 0.00205257 tCO2/m3 COEF f,y = NCV* EF*OXID Data Source note 9) Collected from table 1-3 of the 2006 IPCC Guidelines for National Greenhouse Gas Inventories. note 10) IPCC current default values.
Calculation of Leakages (LE y)
Table L.1- Calculation of leakages Particulars Value Unit
Leakage Emissions due to fugitive upstream CH4 emissions (LE
CH4,y) (note-1) 91267.1274
t CO2 e Leakage Emissions due to fossil fuel combustion/ electricity consumption associated with the liquefaction, transportation, re-gasification and compression of LNG into a natural gas transmission or distribution System (LE LNG, CO2, y) (note-2)
210670.4827 t CO2 e
Leakage Emissions (LE y) (Equation no-5 of AM0029) 301937.6101 t CO2 e Data Sources note 1) Refer to table 1-1 "Leakage Emissions due to fugitive upstream CH4 emissions (LE CH4,y)" note 2) Refer to table 1-2 "Leakage Emissions due to fossil fuel combustion/ electricity consumption
associated with the liquefaction, transportation, re-gasification and compression of LNG into a natural gas transmission or distribution system (LE LNG, CO2, y)"
Table 1-1 Leakage Emissions due to fugitive upstream CH4 emissions (LE CH4,y) Particulars Value Unit
Quantity of natural gas combusted in project plant (FC y) (note-3) 1744834538.12 M 3
Net Calorific Value of natural gas combusted (NCV y) (note-4) 0.036587733 GJ/ M3 Emission factor for upstream fugitive methane emissions of natural gas(EF NG, upstream, CH4) (note-5) 0.00016 t CH4/ GJ Electricity generation in project plant (EG PJ,y) (note-6) 9067999.4 MWh Emission factor for upstream fugitive methane emissions occurring in the absence of project activity (EF BL, upstream, CH4) (note-7) 0.00064714 t CH4/ MWh

PROJECT DESIGN DOCUMENT FORM (CDM PDD) - Version 03.1. CDM – Executive Board page 88 Global Warming potential of methane (GWP CH4) (note-8) 21.0000 Leakage Emissions due to fugitive upstream CH4 emissions (LE CH4,y) (Equation no-6 of AM0029) 91267.1274 t CO2 e Data Sources note 3) Refer to "Working notes for calculating Leakages" Section -1 note 4) Refer to "Working notes for calculating Leakages" Section -2 note 5) Refer to "Working notes for calculating Leakages" Section -3 note 6) Refer to "Working notes for calculating Leakages" Section -4 note 7) Refer to "Working notes for calculating Leakages" Section -5 note 8) Data collected from publicly available sources, published by “U.S Greenhouse Gas Inventory
Program, Office of Atmospheric Programs, U.S Environmental Protection Agency.”
Table 1-2 Leakage Emissions due to fossil fuel combustion/ electricity consumption associated with the liquefaction, transportation, re-gasification and compression of LNG into
a natural gas transmission or distribution System (LE LNG, CO2, y) Particulars Value Unit
Quantity of natural gas combusted in project plant (FC LNG, y) ( for CO 2 emissions from LNG) (note-9)
35111.74712 TJ
Emission factor for upstream CO2 emissions associated with the liquefaction, transportation, re-gasification and compression of LNG into a natural gas transmission or distribution System (EF CO2,upstream,LNG) (note-10) 6 t CO2/ TJ
Leakage Emissions due to fossil fuel combustion/ electricity consumption associated with the liquefaction, transportation, re-gasification and compression of LNG into a natural gas transmission or distribution System (LE LNG, CO2, y) 210670.4827 t CO2 e Data Sources note 9) Refer to "Working notes for calculating Leakages" Section -6 note 10) Collected from AM0029
Working notes for calculation of Leakages Particulars Value Unit
Section 1:Quantity of natural gas combusted in project plant (FC y)
Natural gas combusted in project plant (note-1) 1744834538.12 m3

PROJECT DESIGN DOCUMENT FORM (CDM PDD) - Version 03.1. CDM – Executive Board page 89
Quantity of natural gas combusted in project plant (FC y) 1744834538.12 M3
Section-2:Net Calorific Value of natural gas (NCV y)
Net calorific value of natural gas (note-1) 8740.500 Kcal/m3
Net Calorific Value of natural gas (NCV y) 0.036587733 GJ/ M3 Section-3:Emission factor for upstream fugitive methane emissions of natural gas (EF NG, upstream, CH4) Emission factor for fugitive methane emissions due to Gas Production (note -2) 72 t CH4/ PJ Emission factor for fugitive methane emissions due to Gas Processing, transport and distribution (note-2) 88 t CH4/ PJ Emission factor for upstream fugitive methane emissions of natural gas (addition of above two figures) 160 t CH4/ PJ Emission factor for upstream fugitive methane emissions of natural gas(EF NG, upstream, CH4) 0.00016 t CH4/ GJ
Section-4: Electricity generation in project plant (EG PJ,y) Electricity generation in project plant (note 1) 9067.9994 GWh
Electricity generation in project plant (EG PJ,y) 9067999.41 MWh
Section:6-Quantity of natural gas combusted in project plant (FC LNG, y) (For CO2 emissions from LNG) Net Electricity evacuated to the grid (note-1) 9067.9941 GWh 50% of the Electricity evacuated to the grid* 4533.999705 GWh GCV of LNG (note-3) 9879.1 Kcal/m3 Gross Station Heat rate (note-1) 1850 Kcal/ KWh
Total LNG requirement 849055020.6
m3 Gross Calorific value of Gas (note -3) 9879.1 Kcal/ m3
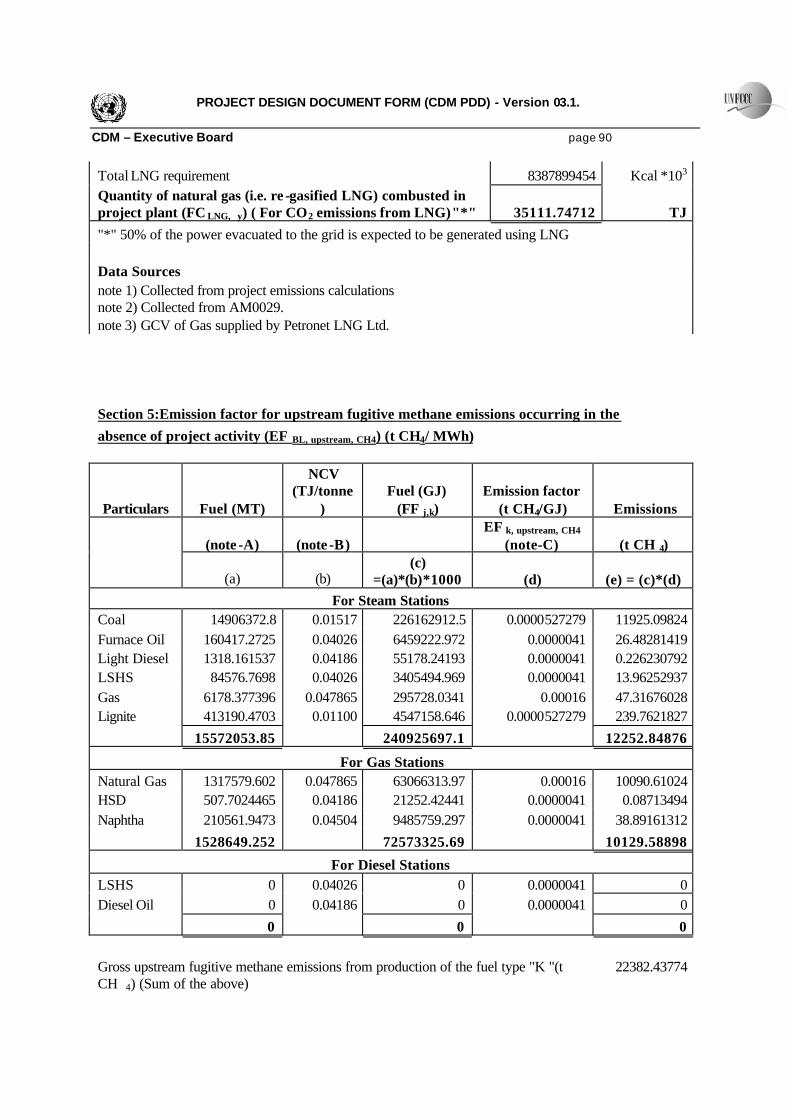
PROJECT DESIGN DOCUMENT FORM (CDM PDD) - Version 03.1. CDM – Executive Board page 90
Total LNG requirement 8387899454 Kcal *103 Quantity of natural gas (i.e. re -gasified LNG) combusted in project plant (FC LNG, y) ( For CO2 emissions from LNG)"*" 35111.74712 TJ "*" 50% of the power evacuated to the grid is expected to be generated using LNG Data Sources note 1) Collected from project emissions calculations note 2) Collected from AM0029. note 3) GCV of Gas supplied by Petronet LNG Ltd. Section 5:Emission factor for upstream fugitive methane emissions occurring in the absence of project activity (EF BL, upstream, CH4) (t CH4/ MWh)
Particulars Fuel (MT)
NCV (TJ/tonne
) Fuel (GJ)
(FF j,k) Emission factor
(t CH4/GJ) Emissions
(note -A) (note -B) EF k, upstream, CH4
(note-C) (t CH 4)
(a) (b) (c)
=(a)*(b)*1000 (d) (e) = (c)*(d) For Steam Stations
Coal 14906372.8 0.01517 226162912.5 0.0000527279 11925.09824 Furnace Oil 160417.2725 0.04026 6459222.972 0.0000041 26.48281419 Light Diesel 1318.161537 0.04186 55178.24193 0.0000041 0.226230792 LSHS 84576.7698 0.04026 3405494.969 0.0000041 13.96252937 Gas 6178.377396 0.047865 295728.0341 0.00016 47.31676028 Lignite 413190.4703 0.01100 4547158.646 0.0000527279 239.7621827 15572053.85 240925697.1 12252.84876
For Gas Stations Natural Gas 1317579.602 0.047865 63066313.97 0.00016 10090.61024 HSD 507.7024465 0.04186 21252.42441 0.0000041 0.08713494 Naphtha 210561.9473 0.04504 9485759.297 0.0000041 38.89161312 1528649.252 72573325.69 10129.58898
For Diesel Stations LSHS 0 0.04026 0 0.0000041 0 Diesel Oil 0 0.04186 0 0.0000041 0 0 0 0 Gross upstream fugitive methane emissions from production of the fuel type "K "(t CH 4) (Sum of the above)
22382.43774
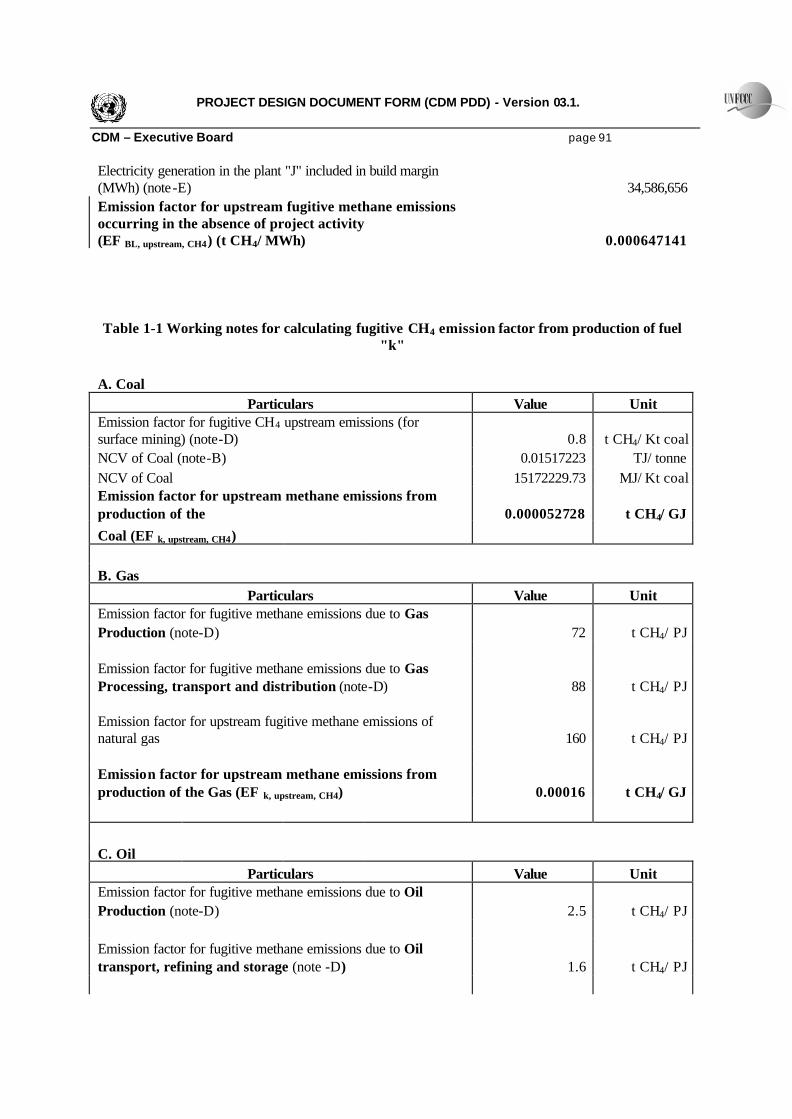
PROJECT DESIGN DOCUMENT FORM (CDM PDD) - Version 03.1. CDM – Executive Board page 91 Electricity generation in the plant "J" included in build margin (MWh) (note-E) 34,586,656 Emission factor for upstream fugitive methane emissions occurring in the absence of project activity (EF BL, upstream, CH4) (t CH4/ MWh) 0.000647141
Table 1-1 Working notes for calculating fugitive CH4 emission factor from production of fuel "k"
A. Coal
Particulars Value Unit Emission factor for fugitive CH4 upstream emissions (for surface mining) (note-D) 0.8 t CH4/ Kt coal NCV of Coal (note-B) 0.01517223 TJ/ tonne NCV of Coal 15172229.73 MJ/ Kt coal Emission factor for upstream methane emissions from production of the 0.000052728 t CH4/ GJ Coal (EF k, upstream, CH4) B. Gas
Particulars Value Unit Emission factor for fugitive methane emissions due to Gas Production (note-D) 72 t CH4/ PJ Emission factor for fugitive methane emissions due to Gas Processing, transport and distribution (note-D) 88 t CH4/ PJ Emission factor for upstream fugitive methane emissions of natural gas 160 t CH4/ PJ Emission factor for upstream methane emissions from production of the Gas (EF k, upstream, CH4) 0.00016 t CH4/ GJ C. Oil
Particulars Value Unit Emission factor for fugitive methane emissions due to Oil Production (note-D) 2.5 t CH4/ PJ Emission factor for fugitive methane emissions due to Oil transport, refining and storage (note -D) 1.6 t CH4/ PJ

PROJECT DESIGN DOCUMENT FORM (CDM PDD) - Version 03.1. CDM – Executive Board page 92 Emission factor for upstream fugitive methane emissions of oil 4.1 t CH4/ PJ Emission factor for upstream methane emissions from production of the oil (EF k, upstream, CH4) 0.0000041 t CH4/ GJ Data Sources note A) Calculated based on data sourced from CEA, Ministry Of Commerce, Government of India,
calculations are annex hereto.{Working note-F 1:Calculation of Fuel consumption (F i,m,y)} note B) Net Calorific Value of:
Coal, HSD, LSHS, Furnace Oil, Naphtha : Collected from CO2 Baseline Database For Indian Power Sector, December 2006, Issued by Central Electricity Authority, Ministry Of Power, Government Of India Lignite: Collected from table 6.3 CEA General Review, data for 2004-2005, GCV converted into NCV using conversion factor provided by “CO2 Baseline Database For Indian Power Sector, December 2006, Issued by Central Electricity Authority, Ministry Of Power, Government Of India” . Gas: Calculated as weighted average NCV of Petronet LNG Ltd and ONGC India Ltd. based on the gas supply made by the two companies in 2004-05.
Particulars Supply
(TBTU) NCV
(kCal/ M3) (a) (b) (a)* (b)
ONGC 666.72 8500 5667120 Petronet Lng Ltd 125.03 8981 1122894.43 791.75 6790014.43
Weighted average NVC (Kcal/ M3) 8575.96 Weighted average NVC (Kcal/ Kg) 11434.61 Weighted average NVC (TJ/ tonne) 0.047865278 note C) Collected from table 1-1 (Working notes for calculating fugitive CH4 emission factor from
production of fuel "k") note D) Collected from AM0029 note E) Power generation of sample "m" plants (including low cost and must run units)
Working note-F 1:Calculation of Fuel consumption (F i,m,y) (used for calculation of EF BL, upstream, CH4)
Particulars Unit For Western Grid For Build Margin
2004-05 (note-A1) sample "m" plants"*"

PROJECT DESIGN DOCUMENT FORM (CDM PDD) - Version 03.1. CDM – Executive Board page 93 Thermal power generation GWh 155845.2209 30138.96 Generation by Steam GWh 130816.6347 20717.59 based stations Generation by Gas GWh 25028.58618 9,421 based stations Generation by Diesel GWh 0 0 based stations Fuel used in steam stations for aforesaid generation Coal MT 94123000 14906372.8 Furnace Oil MT 1012919.45 160417.2725 Light Diesel MT 8323.24 1318.161537 LSHS MT 534041.34 84576.7698 Gas MT 39012 6178.377396 Lignite MT 2609000 413190.4703 98326296.03 15572053.85
Fuel used in Gas stations for aforesaid generation Natural Gas MT 3500250 1317579.602 HSD MT 1348.75 507.7024465 Naphtha MT 559373.76 210561.9473 4060972.51 1528649.252
Fuel used in Diesel MT 0 0 stations for aforesaid generation

PROJECT DESIGN DOCUMENT FORM (CDM PDD) - Version 03.1. CDM – Executive Board page 94 "*" Fuel used in Build Margin sample "m" plants is estimated based on the ratio of Build Margin sample "m" plants generation to the total generation of western grid, applied to fuel consumption in the western grid, separately for steam plants and gas plants. Data Source (note –A1)
Fuel Unit Consumption" ** " Density “ *** “ (Kg/Lt or kg/m3) Consumption (MT)
Steam Stations Coal MT 94123000 1 94123000 Furnace Oil KL 1066231 0.95 1012919.45 Light Diesel KL 10028 0.83 8323.24 LSHS KL 574238 0.93 534041.34 Gas MT 39012 39012 Lignite MT 2609000 2609000 98326296.03
Gas Stations Natural Gas MMSCM 4667 0.75 3500250 HSD KL 1625 0.83 1348.75 Naphtha KL 776908 0.72 559373.76 4060972.51
Diesel Stations LSHS KL 0 0.93 0 Diesel Oil KL 0 0.83 0 " ** "Collected from table 6-1 CEA General Review 2004-05, Published by Central Electricity Authority, Ministry of Power, Government of India. “ *** “
1) Density of gas has been taken from , a presentation made by Gail India Ltd. 2) Density of Furnace Oil and Diesel (including HSD and Light Diesel) has been collected from CO2
Baseline Database for Indian Power Sector, December 2006, issued by CEA, Ministry of Power, Government of India
3) Density of Naphtha is collected from the website of Bharat Petroleum (www.bharatpetroleum.in) 4) Density of LSHS is collected from the website of www.energyefficiencyasia.org

PROJECT DESIGN DOCUMENT FORM (CDM PDD) - Version 03.1. CDM – Executive Board page 95
List of Build Margin Sample "m" Plants
SR NO
NAME UNIT NO
DATE OF COMM.
CAPACITY MW AS ON 31/03/2005
TYPE FUEL 1
FUEL 2
2004-05 Net
Generation GWh
2004-05 in
Build Margin
1 GANDHI NAGAR 5 17-Mar-98 210 THERMAL COAL OIL 1,421 1 2 HAZIRA CCCP 1 30-Sep-01 52 THERMAL GAS n/a 378 1 3 HAZIRA CCCP 2 30-Sep-01 52 THERMAL GAS n/a 368 1 4 HAZIRA CCCP 3 30-Sep-01 52.1 THERMAL GAS n/a 377 1 5 DHUVARAN CCPP 1 04-Jun-03 67.9 THERMAL GAS n/a 0 1 6 DHUVARAN CCPP 2 22-Sep-03 38 THERMAL GAS n/a 0 1 7 WANAKBORI 7 31-Dec-98 210 THERMAL COAL OIL 1,508 1 8 KUTCH LIG. 3 02-Apr-97 75 THERMAL LIGN OIL 411 1 9 ESSAR GT IMP. 1 10-Aug-95 515 THERMAL GAS NAPT 3,285 1
10 G.I.P.C.L. GT 5 26-Aug-97 106 THERMAL GAS NAPT 732 1 11 G.I.P.C.L. GT 6 18-Nov-97 54 THERMAL GAS NAPT 367 1 12 SURAT LIG. 1 16-Jan-00 125 THERMAL LIGN OIL 762 1 13 SURAT LIG. 2 06-Nov-99 125 THERMAL LIGN OIL 839 1 14 G.T.E. CORP. 1 01-Apr-98 135 THERMAL GAS NAPT 724 1 15 G.T.E. CORP. 2 01-Apr-98 135 THERMAL GAS NAPT 775 1 16 G.T.E. CORP. 3 14-Feb-98 135 THERMAL GAS NAPT 750 1 17 G.T.E. CORP. 4 13-Oct-98 250 THERMAL GAS NAPT 1,336 1 18 SANJAY GANDHI 3 28-Feb-99 210 THERMAL COAL OIL 1,393 1 19 SANJAY GANDHI 4 23-Nov-99 210 THERMAL COAL OIL 1,322 1 20 VINDH_CHAL STPS 7 03-Mar-99 500 THERMAL COAL OIL 3,545 1 21 VINDH_CHAL STPS 8 26-Feb-00 500 THERMAL COAL OIL 3,570 1 22 K_KHEDA II 3 31-May-00 210 THERMAL COAL OIL 1,462 1 23 K_KHEDA II 4 07-Jan-01 210 THERMAL COAL OIL 1,362 1 24 CHANDRAPUR 7 01-Oct-97 500 THERMAL COAL OIL 3,123 1 25 RELIANCE ENERGY 1 14-Aug-99 48 THERMAL NAPT n/a 329 1 26 DHABOL GT 1 12/11/1998 235 THERMAL NAPT 0 1 27 DHABOL GT 2 12/11/1998 235 THERMAL NAPT 0 1 28 DHABOL GT 3 12/11/1998 235 THERMAL NAPT 0 1 29 DHABOL GT 4 12/11/1998 35 THERMAL NAPT 0 1 30 KADANA 3 2-Jan-1998 60 HYDRO 76 1 31 KADANA 4 27-May-1998 60 HYDRO 76 1 32 S.SAROVAR CHPH 1 4-Oct-2004 50 HYDRO 22 1 33 S.SAROVAR CHPH 2 4-Sep-2004 50 HYDRO 22 1 34 S.SAROVAR CHPH 3 1-Sep-2004 50 HYDRO 22 1 35 S.SAROVAR CHPH 4 1-Sep-2004 50 HYDRO 22 1 36 S.SAROVAR CHPH 5 15-Dec-2004 50 HYDRO 22 1 37 S.SAROVAR RBPH 1 1-Feb-2005 200 HYDRO 149 1 38 INDIRA SAGAR 1 1-Jan-2004 125 HYDRO 168 1 39 INDIRA SAGAR 2 18-Jan-2004 125 HYDRO 168 1

PROJECT DESIGN DOCUMENT FORM (CDM PDD) - Version 03.1. CDM – Executive Board page 96
List of Build Margin Sample "m" Plants SR NO
NAME UNIT NO
DATE OF COMM.
CAPACITY MW AS ON 31/03/2005
TYPE FUEL 1
FUEL 2
2004-05 Net
Generation GWh
2004-05 in
Build Margin
40 INDIRA SAGAR 3 27-Feb-2004 125 HYDRO 168 1 41 INDIRA SAGAR 4 28-Mar-2004 125 HYDRO 168 1 42 INDIRA SAGAR 5 23-Jul-2004 125 HYDRO 168 1 43 INDIRA SAGAR 6 29-Dec-2004 125 HYDRO 168 1 44 INDIRA SAGAR 7 27-Oct-2004 125 HYDRO 168 1 45 INDIRA SAGAR 8 23-Mar-2005 125 HYDRO 168 1 46 BANSAGAR (II) 1 18-Feb-2002 15 HYDRO 33 1 47 BANSAGAR (II) 2 1-Sep-2002 15 HYDRO 33 1 48 BANSAGAR (III) 1 26-Nov-2000 20 HYDRO 27 1 49 BANSAGAR (III) 2 25-Aug-2001 20 HYDRO 27 1 50 BANSAGAR (III) 3 2-Sep-2002 20 HYDRO 27 1 51 RAJGHAT (MP) 1 15-Oct-1999 15 HYDRO 29 1 52 RAJGHAT (MP) 2 29-Sep-1999 15 HYDRO 29 1 53 RAJGHAT (MP) 3 3-Nov-1999 15 HYDRO 29 1 54 TAWA 1 31-Mar-2002 6.75 HYDRO 15 1 55 TAWA 2 31-Mar-2002 6.75 HYDRO 15 1 56 KOYNA-IV 15 28-Mar-2000 250 HYDRO 527 1 57 KOYNA-IV 16 3-Mar-2000 250 HYDRO 267 1 58 KOYNA-IV 17 25-Nov-1999 250 HYDRO 718 1 59 KOYNA-IV 18 7-Oct-1999 250 HYDRO 224 1 60 BHANDARDHARA-II 2 30-Mar-1996 34 HYDRO 30 1 61 SURYA 1 31-Dec-1998 6 HYDRO 13 1 62 MANIKDOH 1 1-Nov-1996 6 HYDRO 4 1 63 DIMBE 1 12-Mar-1997 5 HYDRO 9 1 64 WARNA 1 16-Sep-1998 8 HYDRO 31 1 65 WARNA 2 1-Sep-1999 8 HYDRO 31 1 66 DUDH GANGA 1 27-Feb-2000 12 HYDRO 31 1 67 DUDH GANGA 2 31-Mar-2000 12 HYDRO 31 1 68 BHIVPURI 1 31-Mar-1998 24 HYDRO 75 1 69 BHIVPURI 2 29-Sep-1998 24 HYDRO 75 1 70 BHIVPURI 3 24-Sep-1999 24 HYDRO 75 1 71 BHIVPURI 4 24-Sep-1997 1.5 HYDRO 5 1 72 BHIVPURI 5 24-Sep-1997 1.5 HYDRO 5 1 73 KHOPOLI 1 13-Feb-2002 24 HYDRO 95 1 74 KHOPOLI 2 25-Mar-2003 24 HYDRO 95 1 75 KHOPOLI 3 2-Mar-2001 24 HYDRO 95 1
TOTAL 8422 Total 34,587 Coat 3,085 Coal 20,718 Gas 2,380 Gas 9,421 Hydro 2,957 Hydro 4,448
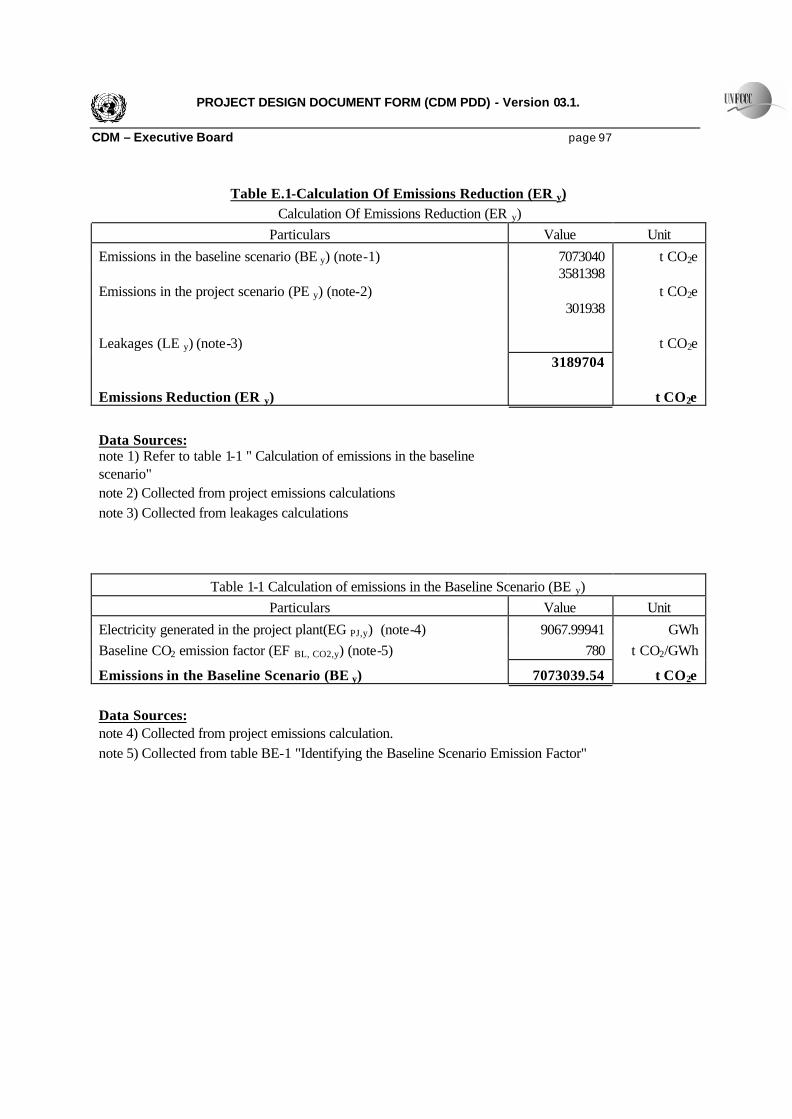
PROJECT DESIGN DOCUMENT FORM (CDM PDD) - Version 03.1. CDM – Executive Board page 97
Table E.1-Calculation Of Emissions Reduction (ER y) Calculation Of Emissions Reduction (ER y)
Particulars Value Unit Emissions in the baseline scenario (BE y) (note-1) 7073040 t CO2e
Emissions in the project scenario (PE y) (note-2) 3581398
t CO2e
Leakages (LE y) (note-3)
301938 t CO2e
Emissions Reduction (ER y)
3189704 t CO2e
Data Sources: note 1) Refer to table 1-1 " Calculation of emissions in the baseline scenario" note 2) Collected from project emissions calculations note 3) Collected from leakages calculations
Table 1-1 Calculation of emissions in the Baseline Scenario (BE y) Particulars Value Unit
Electricity generated in the project plant(EG PJ,y) (note-4) 9067.99941 GWh Baseline CO2 emission factor (EF BL, CO2,y) (note-5) 780 t CO2/GWh
Emissions in the Baseline Scenario (BE y) 7073039.54 t CO2e Data Sources: note 4) Collected from project emissions calculation. note 5) Collected from table BE-1 "Identifying the Baseline Scenario Emission Factor"

PROJECT DESIGN DOCUMENT FORM (CDM PDD) - Version 03.1. CDM – Executive Board page 98
Annex 4
MONITORING INFORMATION 1. The monitoring plan This document serves as the Monitoring Plan (MP) for the “1147.5 MW Natural gas- based grid connected Combined cycle power generation project” in Akhakhol Village, District Surat, Gujarat state. The MP presents a plan to meet the requirements for the collection, processing and reporting of data required to fulfil the requirements in decision 7/CMP.17. It describes management systems and procedures to be implemented by Torrent upon project implementation in order to ensure consistent project operation as well as monitoring, processing and reporting of data required for the calculation of emission reductions (ERs) taking into account AM0029 and the guidance presented in the Validation and Verification Manual. If necessary, the MP can be updated and adjusted to meet operational requirements, provided such modifications are approved by a Designated Operational Entity (DOE) during the process of validation and/or verification. 2. Obligations of Torrent Power’s CDM manager It is the responsibility of Torrent Power’s CDM manager to develop and implement a management and operational system that meets the requirements of this MP. Equally, it is his responsibility to enter into appropriate agreements with institutions in India to secure adequate data gathering, processing and recording, if required. 3. Description of data required to be monitored The MP foresees recording of the following parameters during project operation in order to enable calculation of emission reductions from the project activity. In tables 1-3 they are described in detail. The tables also show the recording frequency of each parameter as given in AM0029. Table 1: Parameters to be monitored for calculation of project emissions: ID Data variable Source of data Data unit
Recording frequency
FCf,y Fuel consumption Flow meter m3 Daily NCVf,y Net calorific value Fuel supplier(s)/
transporter(s) GJ/m3 Fortnightly
EFCO2,f,y Emission factor for fuel consumed
Preferably fuel supplier(s)/ fuel transporter(s). If this is not available, local data and then country specific data/IPCC values will be used
t CO2/GJ Annually
OXIDf Oxidation factor for Natural Gas
IPCC current default value
Number Annually

PROJECT DESIGN DOCUMENT FORM (CDM PDD) - Version 03.1. CDM – Executive Board page 99 Table 2: Parameters to be monitored for calculation of baseline emissions: ID Data variable Source of data Data unit
Recording frequency
EGPJy Electricity generation by project activity for supply
Electricity meter MWh Hourly measurement , monthly recording
EFy or EF BL,CO2
Baseline Grid emissions factor using Build Margin
Preferably CEA baseline database (Ministry of Power, Government of India). If unavailable, calculation from raw data of CEA(Ministry of Power, Government of India), as well as from IPCC and others (as detailed in B.7.1)
t CO2/GWh Annually
Table 3: Parameters to be monitored for calculation of emissions due to leakage: ID Data variable Source of data Data unit
Recording frequency
FCLNG,Y ( For CO2 emissions from LNG)
LNG consumption Fuel supplier(s) m3 Daily
4. Approach used in this mo nitoring plan This MP has been designed to clearly separate data collection activities and ER calculation activities. Each activity follows its own organizational structures and procedures. ER calculation will be undertaken with a stand-alone Excel spreadsheet (in the following referred to as the “Workbook“). Data collection activities have been designed to derive verifiable monthly and/or yearly values from the periodic measurements undertaken for each parameter that can be easily processed in a Workbook for ER calculation. After validation and after each reporting of emission reductions to the DOE the CDM Manager will organize a meeting with all staff involved in the execution of MP. The purpose of the meeting will be the identification for corrective actions in the organizational structures and procedures in order to provide for more accurate future monitoring and reporting taking into account possible requests for improvements by the DOE. Findings of the meeting will be communicated to the DOE and alterations might be made to the MP in accordance with the DOE’s advice.

PROJECT DESIGN DOCUMENT FORM (CDM PDD) - Version 03.1. CDM – Executive Board page 100 Section 5 outlines the organizational structures and procedures for collection, processing, review, storage and reporting of data required for ER calculation. Section 6 presents the “Workbook“ for ER calculation and describes its functioning. For calculation of ERs this MP follows the formulae specified in AM0029. All formulae have been incorporated in the workbook. Section 7 describes different protocols to be prepared during project implementation (e.g. training protocol). 5. Description of organizational structures & procedures for collection, processing, review, storage and reporting of data The organization structure and responsibility matrix for this CDM project activity is as below: A) CDM Organization Structure:
The Director of Torrent Power has issued an official order, authorizing the CDM Manager to implement the PDD and the Monitoring Plan and delegating all powers in relation thereto, to the CDM Manager including the power to direct O&M team, and fuel team, CDM team to: (a) Provide all information/data required for this monitoring plan b) Comply with all the requirements as per the Project Design Document and Monitoring Plan. c) Adherence to the laid down protocols, procedures and processes, in relation to CDM project activity, by the aforesaid O&M team, fuel team and the CDM team d) Refer all conflicts, discrepancies, mistakes, etc in relation to the Monitoring Plan of the CDM project activity, to the CDM manager for resolution, which resolution in this regard shall be final and binding on the aforesaid teams. The CDM team consists of CDM auditor and CDM compiler. The O&M team is headed by the Head- O&M and the Fuel team is headed by the Fuel Manager.
Director
CDM Manager Operation and Maintenance Team
CDM Team Fuel Team

PROJECT DESIGN DOCUMENT FORM (CDM PDD) - Version 03.1. CDM – Executive Board page 101 B) CDM responsibility matrix:
S/No Designation Responsibilities
1 Director • Implement the organization structure. • Issue office orders, authorizing the CDM Manager to
implement the PDD and the Monitoring plan and delegating to him all powers in relation thereto.
2 CDM Manager • Direct the O& M team, fuel team, CDM team in relation to conformance with PDD and monitoring plan
• Storage of aggregated data. • Coordinate with DOE during verification process. • Monitor raw data in relation to Build Margin and
Oxidation factor. • Randomly check data wherever necessary to
independently check the authenticity of data and take corrective actions wherever required.
• Resolve all conflicts in relation to CDM project activity. • Calculate ER and submit them to DOE. • Implement the PDD and the Monitoring Plan.
3 O&M Team • Calibrate and maintain data • Monitor raw data as per enclosed task.
4 CDM Auditor • Data review • Process review • Report non-conformances with PDD, Monitoring plan
and CDM manager’s directions. 5 CDM Compiler • Data processing
• Data aggregation 6 Fuel Manager • Monitor raw data as per enclosed task
The following table provides detailed information on the organizational structures & procedures for collection, processing, review, storage and reporting of data during operation of the project activity.
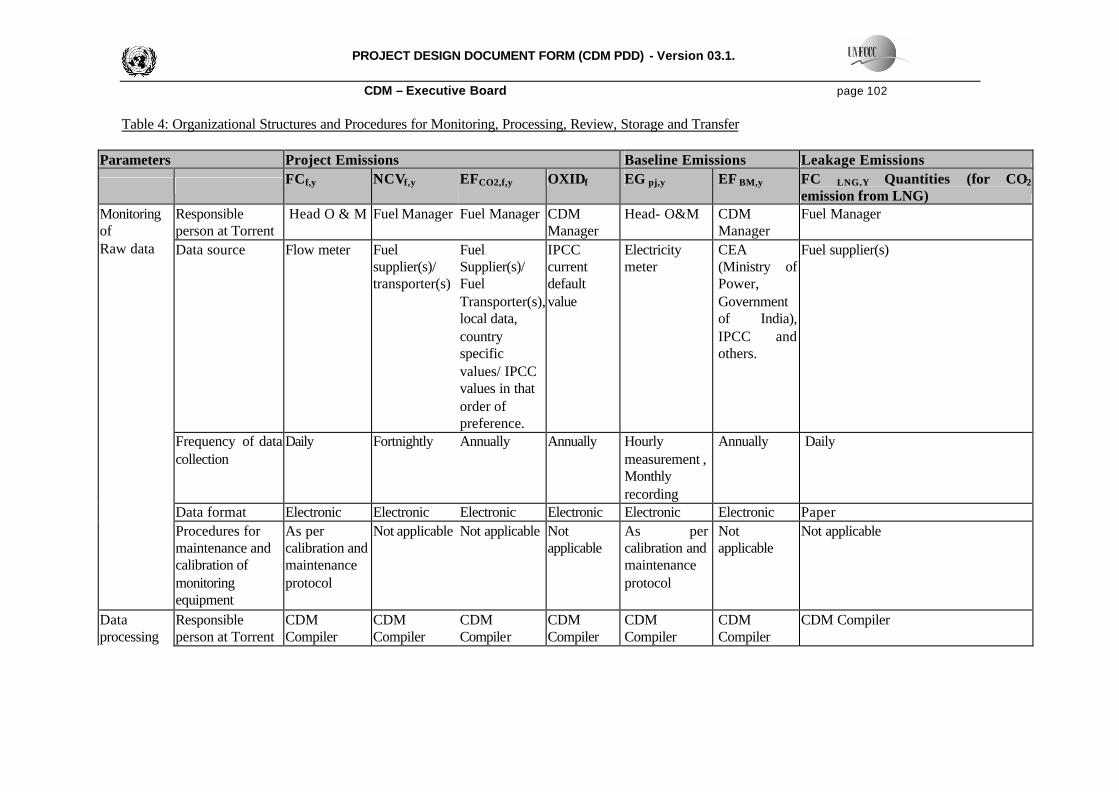
PROJECT DESIGN DOCUMENT FORM (CDM PDD) - Version 03.1.
CDM – Executive Board page 102 Table 4: Organizational Structures and Procedures for Monitoring, Processing, Review, Storage and Transfer
Parameters Project Emissions Baseline Emissions Leakage Emissions
FCf,y NCVf,y EFCO2,f,y OXIDf EG pj,y EF BM,y FC LNG,Y Quantities (for CO2
emission from LNG) Responsible person at Torrent
Head O & M Fuel Manager Fuel Manager CDM Manager
Head- O&M CDM Manager
Fuel Manager
Data source Flow meter Fuel supplier(s)/ transporter(s)
Fuel Supplier(s)/ Fuel Transporter(s), local data, country specific values/ IPCC values in that order of preference.
IPCC current default value
Electricity meter
CEA (Ministry of Power, Government of India), IPCC and others.
Fuel supplier(s)
Frequency of data collection
Daily Fortnightly Annually Annually Hourly measurement , Monthly recording
Annually
Daily
Data format Electronic Electronic Electronic Electronic Electronic Electronic Paper
Monitoring of Raw data
Procedures for maintenance and calibration of monitoring equipment
As per calibration and maintenance protocol
Not applicable Not applicable Not applicable
As per calibration and maintenance protocol
Not applicable
Not applicable
Data processing
Responsible person at Torrent
CDM Compiler
CDM Compiler
CDM Compiler
CDM Compiler
CDM Compiler
CDM Compiler
CDM Compiler
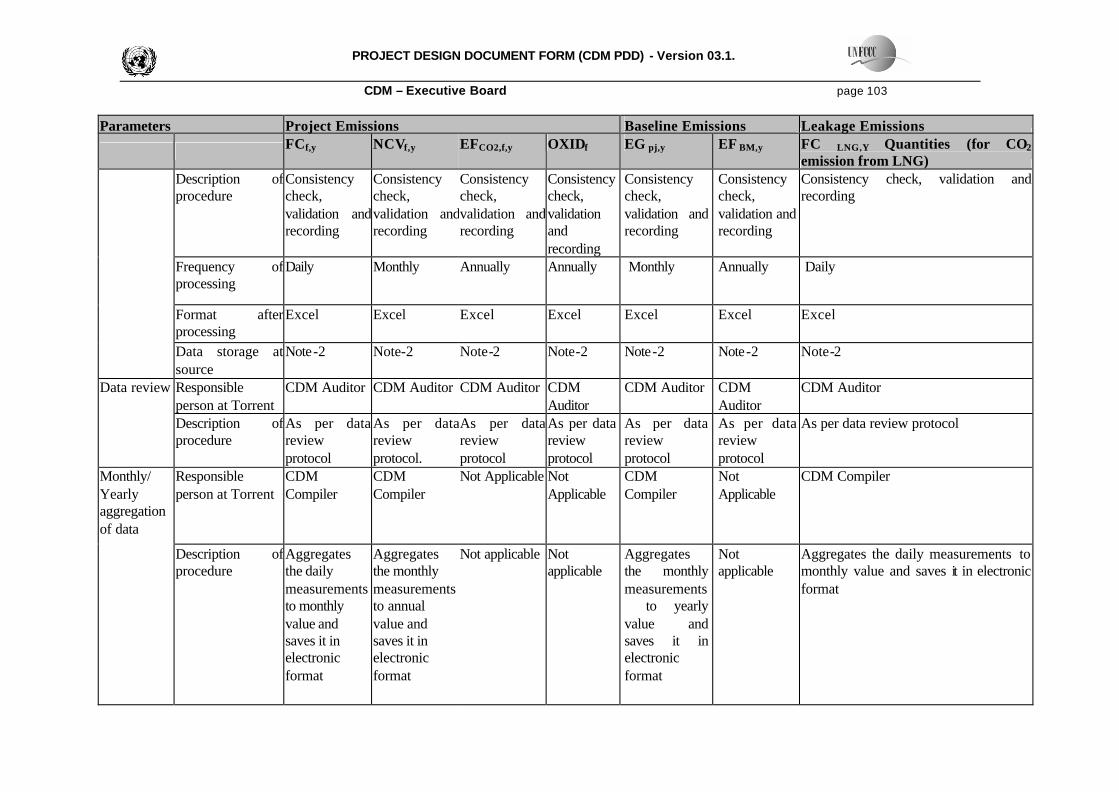
PROJECT DESIGN DOCUMENT FORM (CDM PDD) - Version 03.1.
CDM – Executive Board page 103
Parameters Project Emissions Baseline Emissions Leakage Emissions
FCf,y NCVf,y EFCO2,f,y OXIDf EG pj,y EF BM,y FC LNG,Y Quantities (for CO2
emission from LNG) Description of procedure
Consistency check, validation and recording
Consistency check, validation and recording
Consistency check, validation and recording
Consistency check, validation and recording
Consistency check, validation and recording
Consistency check, validation and recording
Consistency check, validation and recording
Frequency of processing
Daily Monthly Annually Annually Monthly Annually Daily
Format after processing
Excel Excel Excel Excel Excel Excel Excel
Data storage at source
Note-2 Note-2 Note-2 Note-2 Note-2 Note-2 Note-2
Responsible person at Torrent
CDM Auditor CDM Auditor CDM Auditor CDM Auditor
CDM Auditor CDM Auditor
CDM Auditor Data review
Description of procedure
As per data review protocol
As per data review protocol.
As per data review protocol
As per data review protocol
As per data review protocol
As per data review protocol
As per data review protocol
Responsible person at Torrent
CDM Compiler
CDM Compiler
Not Applicable Not Applicable
CDM Compiler
Not Applicable
CDM Compiler Monthly/ Yearly aggregation of data
Description of procedure
Aggregates the daily measurements to monthly value and saves it in electronic format
Aggregates the monthly measurements to annual value and saves it in electronic format
Not applicable Not applicable
Aggregates the monthly measurements to yearly value and saves it in electronic format
Not applicable
Aggregates the daily measurements to monthly value and saves it in electronic format

PROJECT DESIGN DOCUMENT FORM (CDM PDD) - Version 03.1.
CDM – Executive Board page 104
Parameters Project Emissions Baseline Emissions Leakage Emissions
FCf,y NCVf,y EFCO2,f,y OXIDf EG pj,y EF BM,y FC LNG,Y Quantities (for CO2
emission from LNG) Responsible person at Torrent
CDM Manager
CDM Manager
CDM Manager
CDM Manager
CDM Manager
CDM Manager
CDM Manager
Frequency of storage
Monthly Monthly Annually Annually Monthly Annually Monthly
Format of data stored
Electronic (Excel) and paper version
Electronic (Excel) and paper version
Electronic (Excel) and paper version
Electronic (Excel) and paper version
Electronic (Excel) and paper version
Electronic (Excel) and paper version
Electronic (Excel) and paper version
Storage of aggregated data
Duration of storage
Note-2
Note-2
Note-2
Note-2
Note-2
Note-2
Note-2
Note-2: Kept for two years after the end of the crediting period or the last issuance of CERs for this project activity, which ever occurs later.

`
PROJECT DESIGN DOCUMENT FORM (CDM PDD) - Version 03.1. CDM – Executive Board page 105 The electricity generation by power station for supply and the fuel consumption are measured by electricity meter and flow meter respectively. Following guidelines will be followed for the A) data Monitoring B) Calibration and maintenance and C) Verification of monitoring results.
A) Data Monitoring The data that will be monitored include: a) Monitoring of Electricity generated by the Project: The electricity generated by the project
will be through metering equipment at the plant. The data can also be monitored and recorded at the on-site control centre using a computer system. There will be Main metering system and backup metering system. The meter reading will be readily accessible for DOE. Calibration test records will be maintained for verification.
b) Monitoring of quantity of Gas combusted: Quantity of gas combusted will be monitored through flow metering equipments. Detailed monitoring procedure of quantity of Gas combusted by the project will be established in accordance with the agreements with the gas suppliers and gas transporter .The LNG consumed will be based on the data provided by fuel supplier(s) The flow meter reading will be readily accessible for DOE. Calibration test records will be maintained for verification.
c) Monitoring of NCV: The NCV of gas is used in the calculation of CO2 emission coefficient. Hence the measurement report of Gas character must be obtained from fuel supplier(s)/ transporter(s).
d) Monitoring the data needed to calculate the baseline emission factor: The baseline emission factor is obtained from the CEA baseline database (Ministry of Power, Government of India) or calculated from raw data of CEA (Ministry of Power, Government of India), IPCC and others. The project owner should check the data and submit the revised ex-post calculation to the DOE on annual basis. The emission factor calculation for arriving at emission reduction of this project will be calculated based on the data available in accordance with the approved methodology AM0029 and will be verified by DOE.
B) Calibration and Maintenance:
The detailed calibration, testing and maintenance procedure shall be prepared by the CDM Manager based on the agreements with the fuel supplier(s), fuel transporter(s) etc), equipment manufacturer’s recommendations and the industry and national standards as applicable.
C) Verification of Monitoring Results:
The verification of the monitoring results of the project is mandatory process required for all CDM projects. The responsibilities for verification of the project are as follows: 1. The CDM Manager will arrange for the verification and will prepare for the audit and
verification process to the best of its abilities.

`
PROJECT DESIGN DOCUMENT FORM (CDM PDD) - Version 03.1. CDM – Executive Board page 106
2. The CDM Manager will facilitate the verification through providing the DOE with all required necessary information, before, during and, in the event of queries, after verification.
3. The project owner will fully cooperate with the DOE and instruct its staff and management to be available for interviews and respond honestly to all questions from DOE.
6. Description of organizational structures & procedures for calculation of emission reductions as well as review, storage and reporting of the ER calculation results Calculation of ERs is carried out by the CDM Manager annually by utilisation of an excel-based workbook whose functions are explained in detail below. The CDM Manager must retain a copy of every month’s workbook. Each month’s workbook must be saved on the plant server under a unique name reflecting the month for which monitoring has been carried out and hard copies of the workbook shall be printed out, signed by the CDM Manager in accordance with company procedures, and stored in the archive room. In addition, after each data entry and/or modification of the workbook, electronic copies of the workbook shall be saved under a new name, and hard copies shall be signed and stored safely. Yearly summaries are calculated based on the monthly results. The workbooks serve as a data base for the periodic reporting of ERs to the verifying DOE by the CDM Manager. After completion of the workbook the ER results are reviewed according to the procedures laid out in the data review protocol. Description of the workbook for emission reduction calculation This section explains and illustrates the steps required to be performed by the CDM Manager to enable the GHG emission reductions to be calculated on an annual basis using the workbook. It presents the worksheets contained in the workbook and explains their use. The section is intended as a user manual for the workbook. The relevant formulas are displayed in the relevant worksheets for easier orientation. The electronic workbook is an Annex to the MP and an integral part thereof.
The CDM Manager is responsible for ensuring the entry of the required data shown in tables below into the electronic workbook and completion of the workbook starting with April 2008 or a date not earlier than the date of registration, as required by the monitoring methodology and the data input templates in the electronic workbook. The workbook is designed with 1) Data entry and aggregation screen, and 2) Data calculation screen. The data to be entered is keyed in the data entry screen and also aggregated in the same screen where necessary. The data calculation screen has all the formulas required for the calculation as per the approved methodology and is linked to the appropriate cell of data entry screen. The screen shots of these screen along with formula used are given below:

`
PROJECT DESIGN DOCUMENT FORM (CDM PDD) - Version 03.1. CDM – Executive Board page 107
1) Data Entry Screen: a) FC f,y
Frequency Daily Source Flow Meter
Data Unit m3 Day 1 2 3 4 5 6 7 8 9 10 11 12 13 14 15 Fortnightly total 16 17 18 19 20 21 22 23 24 25 26 27 28

`
PROJECT DESIGN DOCUMENT FORM (CDM PDD) - Version 03.1. CDM – Executive Board page 108
29 30 31 Fortnightly Total Monthly Total Same tabular format shall apply for each month of the year. Monthly Fuel consumption-
January (m3) Monthly Fuel consumption-
February (m3) Monthly Fuel consumption-
March (m3)
Monthly Fuel consumption- April (m3)
Monthly Fuel consumption- May (m3)
Monthly Fuel consumption- June (m3)
Monthly Fuel consumption- July (m3)
Monthly Fuel consumption- August (m3)
Monthly Fuel consumption- September (m3)
Monthly Fuel consumption- October (m3)
Monthly Fuel consumption- November (m3)
Monthly Fuel consumption- December (m3)
Annual Fuel Consumption (m3) b) NCV f,y

`
PROJECT DESIGN DOCUMENT FORM (CDM PDD) - Version 03.1. CDM – Executive Board page 109
Frequency Fortnightly
Source Fuel Supplier(s)/ Transporter(s).
Data Unit GJ January 1 First Fortnight 2 Second Fortnight Total for the month February 1 First Fortnight 2 Second Fortnight Total for the month March 1 First Fortnight 2 Second Fortnight Total for the month April 1 First Fortnight 2 Second Fortnight Total for the month May 1 First Fortnight 2 Second Fortnight Total for the month June 1 First Fortnight 2 Second Fortnight Total for the month July 1 First Fortnight 2 Second Fortnight Total for the month August 1 First Fortnight 2 Second Fortnight Total for the month September 1 First Fortnight 2 Second Fortnight Total for the month

`
PROJECT DESIGN DOCUMENT FORM (CDM PDD) - Version 03.1. CDM – Executive Board page 110
October 1 First Fortnight 2 Second Fortnight Total for the month November 1 First Fortnight 2 Second Fortnight Total for the month December 1 First Fortnight 2 Second Fortnight Total for the month Total for the year (in GJ) Total for the year (in GJ/m3)
C. EG PJy Frequency Monthly
Source Electricity Meter Data Unit MWh Months January February March April May June July August September October November December Total (in MWh)
Total (in GWh)
D. LNG consumption (FC LNG,Y) ( For CO2 emissions from LNG) Frequency Daily
Source Fuel Suppliers Data Unit m3 Day 1 2

`
PROJECT DESIGN DOCUMENT FORM (CDM PDD) - Version 03.1. CDM – Executive Board page 111
3 4 5 6 7 8 9 10 11 12 13 14 15 Fortnightly total 16 17 18 19 20 21 22 23 24 25 26 27 28 29 30 31 Fortnightly Total Monthly Total Same tabular format shall apply for each month of the year.

`
PROJECT DESIGN DOCUMENT FORM (CDM PDD) - Version 03.1. CDM – Executive Board page 112
Monthly LNG consumption-
January (m3) Monthly LNG consumption-
February (m3) Monthly LNG consumption-
March (m3)
Monthly LNG consumption- April (m3)
Monthly LNG consumption- May (m3)
Monthly LNG consumption- June (m3)
Monthly LNG consumption- July (m3)
Monthly LNG consumption- August (m3)
Monthly LNG consumption- September (m3)
Monthly LNG consumption- October (m3)
Monthly LNG consumption- November (m3)
Monthly LNG consumption- December (m3)
Annual LNG Consumption (m3)
Annual Data. Parameter Data Unit Value Data Source. A. Project Activity OXID f Number 1 IPCC current
default value EF(CO2,f,y) t CO2/GJ @
B. Leakages FC(F,y) m3 {From (a) of Data
Entry System} ---------------------
NCV(y) GJ/m3 {From (b) of Data Entry System}
---------------------
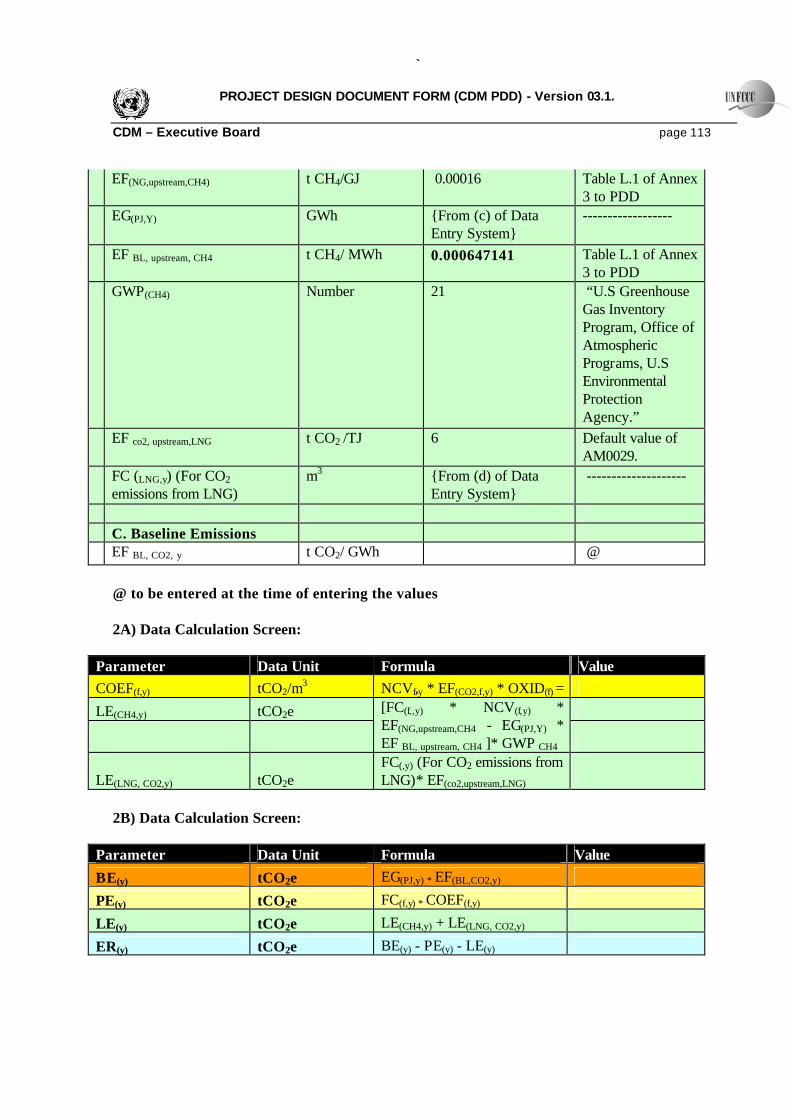
`
PROJECT DESIGN DOCUMENT FORM (CDM PDD) - Version 03.1. CDM – Executive Board page 113
EF(NG,upstream,CH4) t CH4/GJ 0.00016 Table L.1 of Annex 3 to PDD
EG(PJ,Y) GWh {From (c) of Data Entry System}
------------------
EF BL, upstream, CH4 t CH4/ MWh 0.000647141 Table L.1 of Annex 3 to PDD
GWP(CH4) Number 21 “U.S Greenhouse Gas Inventory Program, Office of Atmospheric Programs, U.S Environmental Protection Agency.”
EF co2, upstream,LNG t CO2 /TJ 6 Default value of AM0029.
FC (LNG,y) (For CO2 emissions from LNG)
m3 {From (d) of Data Entry System}
--------------------
C. Baseline Emissions EF BL, CO2, y t CO2/ GWh @
@ to be entered at the time of entering the values 2A) Data Calculation Screen:
Parameter Data Unit Formula Value COEF(f,y) tCO2/m3 NCVf,y * EF(CO2,f,y) * OXID(f) =
LE(CH4,y) tCO2e
[FC(f,,y) * NCV(f,y) * EF(NG,upstream,CH4 - EG(PJ,Y) * EF BL, upstream, CH4 ]* GWP CH4
LE(LNG, CO2,y) tCO2e FC(,y) (For CO2 emissions from LNG)* EF(co2,upstream,LNG)
2B) Data Calculation Screen:
Parameter Data Unit Formula Value
BE(y) tCO2e EG(PJ,y) * EF(BL,CO2,y)
PE(y) tCO2e FC(f,y) * COEF(f,y)
LE(y) tCO2e LE(CH4,y) + LE(LNG, CO2,y)
ER(y) tCO2e BE(y) - PE(y) - LE(y)
`
PROJECT DESIGN DOCUMENT FORM (CDM PDD) - Version 03.1. CDM – Executive Board page 114 The data entry screens and data calculation screens will be kept for two years after the end of the crediting period or the last issuance of CERs for this project activity, which ever occurs latter. 7. Organizational structures & procedures during project implementation Before the start of the crediting period the CDM Manager will develop the following protocols whose functions are described below, based upon the organizational structures & procedures described in this MP. Data handling protocol The establishment of a transparent system for the collection, computation and storage of data, including adequate record keeping and data monitoring systems is required. It is the CDM Manager’s responsibility with the assistance of CDM Auditor to ensure implementation of a protocol that provides for these critical functions and processes. For electronic -based and paper-based data entry and recording systems, there must be clarity in terms of the procedures and protocols for collection and entry of data, usage of the spreadsheets and any assumptions made, so that compliance with requirements can be assessed by the DOE. Stand-by processes and systems, e.g. paper-based systems, must be outlined and used in the event of, and to provide for, the possibility of systems failures. Training protocol It is the CDM Manager’s responsibility to ensure that the required capacity and internal training is made available to assigned staff, to enable them to undertake the tasks required by this MP. All staff involved in any of the procedures will be trained before the start of the crediting period in order to perform the tasks specified in this MP. For this purpose a training protocol will be prepared. Calibration and maintenance protocol It is the CDM Manager’s responsibility to ensure that the calibration and maintenance procedures for all measurement instruments relevant for monitoring the parameters included in this MP are followed. A calibration and maintenance protocol will be established for this purpose which will be prepared by the CDM manager based on the agreements with the fuel supplier(s), fuel transporter(s) etc , equipment manufacturer’s recommendations and the applicable industry / national standards. Data review protocol It is the CDM Manager’s responsibility to prepare a data review protocol that in case of failure of an instrument, or inconsistency of the data, enables staff to adjust the data according to the procedures outlined in this protocol. The data review protocol shall also include procedures for emergency preparedness for cases where emergencies can cause unintended emissions.

`
PROJECT DESIGN DOCUMENT FORM (CDM PDD) - Version 03.1. CDM – Executive Board page 115
Appendix-1 Fuel Availability
(A) The fuel availability in India is determined based on various sources of information which is as follows:-
Domestic:
• Under the new exploration and licensing policy, potential gas blocks are bid out and the
selected bidders are permitted to market gas finds at market determined prices. The recent
gas finds under this policy and other significant sources available for sourcing NG include the
following:
a) Reliance Industries Ltd.
Ø 400 billion m3 gas reserve in the Krishna-Godavari basin by Reliance Industries Limited, which
is expected to supply around 40 MMSCMD of gas from middle / end, 2008. Further, at an oil
conference in London, a top official of Reliance Industries has claimed that natural gas
reserve in KG basin could be more than 50tcf (“Reserves and technical resources put
together could exceed 1.4 trillion m3 – Atul Chandra, Head of Reliance International
Operations). Reliance Industries Limited is planning to enhance the proposed production and
supply from approx 40 million m3 per day to 80 million m3 per day.28
Ø Reliance Industries, ONGC and Great Eastern Energy Corporation Limited have established
175 billion m3 of Coal Bed Methane over 4 Blocks. 2 among these blocks are in Madhya
28 http://www.teluguportal.net/modules/news/artical.php?storyid=3956
www.siliconindia.com/shownews/33248
http://www.thehindubusinessline.com/2003/11/22/stories/2003112202500200.htm
`
PROJECT DESIGN DOCUMENT FORM (CDM PDD) - Version 03.1. CDM – Executive Board page 116
Pradesh, the neighbour state of Gujarat, where the project activity is located. This is expected
to yield a supply of approx 10 million m3 per day29
b) Gujarat State Petroleum Corporation Limited
Ø Gas Reserve of more than 550 billion m3 reportedly discovered by the Gujarat State Petroleum
Corporation Limited in the Krishna-Godavari fields, whose supply of approx. 40 million m3 per
day is expected from 2009 / 201030.
c) Panna-Mukta-Tapti gas fields
Ø Additional production is expected from Panna-Mukta-Tapti gas fields to the extent of 5.0
million m3 per day by post-monsoon of 200731.
d) Rajasthan by Focus Energy Ltd
Ø 170 billion m3 gas discovery is in Rajasthan by Focus Energy Ltd., which is billed as one of the
largest ever land gas finds in recent times. This is expected to yield a supply of approx 10
million m3 per day32 .
Imports
a) Petronet LNG Limited
Ø Petronet LNG Ltd (PLL) is expanding its current capacity of 5.0 million metric tons per
annum regasification capacity (approx 20 million m3 per day) to 12.5 million metric tons per
annum (approx 50 million m3 per day), which is expected to be commissioned by end 2008.
PLL is also setting up a facility for receiving and re-gasifying 2.5 million metric tons per
annum (approx 10 million m3 per day) of LNG in Cochin. PLL has signed a fuel supply
29 http://www.indlawnews.com/a5b2375c7ae191c06f1a6dc25b020826 30 http:/www.gujaratpetro.com/operationalgspc.htm 31 Business Line News dated 6th September,2006 (www.businessline.com)

`
PROJECT DESIGN DOCUMENT FORM (CDM PDD) - Version 03.1. CDM – Executive Board page 117
agreement with Rasgas of Qatar for supply of 7.5 million tons per annum (approx 30
MMSCMD) for a period of 25 years. PLL is in negotiation with various parties including
Rasgas of Qatar for sourcing additional 7.5 million tons per annum of LNG (approx 30 million
m3 per day) for the aforementioned new projects as well as expansion. Indian Oil Companies
have contracted with Iran for supply of 5.0 million metric tons per annum (approx 20 million
m3 per day) of LNG from December, 2009, which may also be re-gasified in PLL’s
facilities33.
b) Hazira LNG Ltd. (Promoted by Shell Ltd.)
Ø Hazira LNG Ltd. (HLL) promoted by Shell and currently owned by Shell and Total has a
regasification capacity of 2.5 million metric tons per annum (approx. 10 million m3 per day) at
Hazira. HLL has plans of increasing this capacity to 10.0 million tons per annum (approx. 40
million m3 per day), depending upon demand in India. The capacity utilization in this terminal is
currently reported to be low as users are not willing to pay the market price applicable
globally34.
c) Gujarat State Petroleum Corporation Limited (GSPCL)
32 http://economictimes.indiatimes.com/articleshow/1612228.cms 33 Annual Report Petronet LNG Limited – www.petronetlng.com
http://inhome.rediff.com/money/2003/oct/11spec1.htm
http://www.thehindubusinessline.com/2005/07/26/stories/2005072600070300.htm
Http://www.indiaembassy.gov.qa/ibr99/ibr-aug99.html 34 http://sify.com/finance/fullstory.php?id=14339198
http://www.thehindubusinessline.com/2005/04/22/stories/2005042202690300.htm
www.energyintel.com

`
PROJECT DESIGN DOCUMENT FORM (CDM PDD) - Version 03.1. CDM – Executive Board page 118
Ø Gujarat State Petroleum Corporation Ltd is proposing to set up a 5 million metric tons per
annum (approx 20 million m3 per day) LNG Regasification Terminal at pipavav in Gujarat35.
d) Dabhol LNG
Ø Dabhol LNG with a regasification capacity of 5 million metric tons per annum (approx. 20
million m3 per day) is expected to be commissioned by middle of 2008. Due diligence exercise
is underway to disinvest this regasification terminal. Among the many interested, PLL is in the
fore front36.
e) Other Imports
Ø Imports through pipelines from Iran, Kazakhstan and Myanmar of approx over 130 million m3
per day are also under consideration.
(Sourcing of gas through LNG or piped imports would not be difficult as India is advantageously located amongst countries rich in gas reserves. viz. Qatar, Iran, Myanmar, Malaysia, Indonesia, Australia and CIS States).
[B] According to another source (Gail/Infraline: Natural Gas in India 2006 – a reference book, http://naturalgas.infraline.com/) the likely availability of natural gas from various sources in India is as follows:
Summary of Gas Availability (million m3 per day):
Source Immediate Medium Term (2007-09)
Long Term (2010-2011)
ONGC 51 50 30 OIL (Raj.+NE) 4 5 5 Sub Total 55 55 35 JV producers 17 53 59 LNG sources 18 30 36 Iran LNG -- -- 18 Transnational pipelines* : -- -- 148
35 http://www.thehindubusinessline.com/2006/10/13/stories/2006101304400200.htm 36 http://sify.com/finance/fullstory.php?id=14339198

`
PROJECT DESIGN DOCUMENT FORM (CDM PDD) - Version 03.1. CDM – Executive Board page 119
Iran and Myanmar Other LNG sources*: Adgas, Petronas, Qatar. Australia
-- -- 18
Total 90 138 314 Source: DGH/OIL/LTGP 2K
*Expected
Since the gas availability from international sources is long term in nature, therefore it is envisaged that the total gas availability in the country by 2010-11 could be in the range of 250-314 million m3 per day
To sum up,
(a) India currently has gas sales of about 90 million m3 per day. Additional supplies to the tune of
approximately 250 million m3 per day are expected by 2010/11, which means that the overall supplies are
expected to grow four fold. The expected additional supplies of around 250 million m3 per day during the
first three/four years of the crediting period of the project activity can support approx 60000 MW of power
generation.
(b) Most of the current gas sold in India is currently in or from the Western Region, in which the project activity is located. The Bombay High Gas production, Cairn Gas, Niko Gas and the regasification terminals of Petronet, Shell Hazira and Dabhol are all located in the Western region. The major sources of Natural gas viz Qatar and Iran are also to the West of India. A good part of the Krishna Godavari Gas of approx 120 million m3 per day is expected to be brought to the Western region and in particular Gujarat (where the project activity is located) through the grand East West pipeline of more than 1400 km in length. All the regasification terminals in the Western Region are connected or proposed to be connected to the trunk lines of Gail (Dahej-Uran pipeline, HVJ pipeline) and GSPL (Mora Sajod pipeline, which is being extended on both the North and South sides). Therefore in the future also a major part of the additional supplies of natural gas is expected to be available in the Western Region of India. Therefore projects comparable in size to the project activity shall not be constrained by natural gas availability in the baseline grid

`
PROJECT DESIGN DOCUMENT FORM (CDM PDD) - Version 03.1. CDM – Executive Board page 120
Appendix-2
Source: North American Natural Gas Markets, by Stephen Brown Federal Reserve Bank of Dallas Presentation to International Seminar on Natural Gas Rio de Janeiro, Brazil - 31 Julho 2006 (http://iis-db.stanford.edu/evnts/4582/Brown_NorthAmericaNatGas.pdf)

PROJECT DESIGN DOCUMENT FORM (CDM PDD) - Version 03.1. CDM – Executive Board page 121
Appendix-3 Environment Impact Assessment Report
Parameter Potential Impact (Without
Mitigating Measures)
Activities Mitigating Measures Overall Impact
Monitoring Requirement Responsible Entities
Construction Phase Land •Flooding during
rainy season •Increase in soil erosion •Loss of trees and habitat •Sediment deposition •Interference with natural drainage pattern •Visual alteration of landscape
•Site clearing •Soil excavation •Mobilization of plant and heavy machinery •Construction of civil structures
•Making garland drain along plant boundary to collect storm water runoff will avoid flooding. •Proper compacting of backfill areas will reduce soil erosion. •Greenbelt and horticulture development will create natural habitat. •Adequate sloping of dumped earthworks and building materials will reduce wind losses and siltation of drains. •Restoring land surface consistent with existing contour conditions will not alter drainage pattern. •Using the excavated soil for greenbelt and horticulture and landscaping purpose will improve the general aesthetics of the landscape.
Long-term positive impact
•Torrent will ensure that all the mitigating measures are incorporated in the contract documents. Technical Department/EMU will check that all documented measures are effectively implemented by the contractor. •The supervision will be done daily.
EPC contractor, EMU/ Technical Department of Torrent will monitor and supervise.
Surface water
•Water pollution •Waterborne diseases •Siltation of water course
•Wastewater generated from domestic services and surface runoff
•Safe drinking water will be provided to workers. •Toilets will have septic tanks and soak pits. •Sedimentation pit will be made to collect the runoff water and it will be
Short-term, negative impact
•These clauses are already incorporated in GCC of EPC tender specifications. Torrent will ensure that all the mitigating measures are incorporated in the EPC contracts. •Technical Department/EMU of Torrent will ensure the quality of drinking water as per contract
EPC contractor, EMU of Torrent will monitor and supervise.

PROJECT DESIGN DOCUMENT FORM (CDM PDD) - Version 03.1. CDM – Executive Board page 122
Parameter Potential Impact (Without
Mitigating Measures)
Activities Mitigating Measures Overall Impact
Monitoring Requirement Responsible Entities
reused for dust suppression.
document.
Air quality • Dust nuisance from site due to vehicular movement and windborne surface dust
• Vehicular movement, haulage of building materials and earthworks
•Water sprinkling will be done for dust suppression. •Service road will be suitably stabilized for smooth traffic flow. •Road surface will be cleaned regularly. •Vehicle wheels will be cleaned to dislodge soil prior to entering the public utility road. •Air around the site will be monitored regularly to ensure compliance with ambient air quality standard.
Short-term, negative impact
•Torrent will ensure that all the mitigating measures are incorporated in the EPC contracts. Technical Department /EMU of Torrent will also check the efficacy of water sprinkling measures adopted by the contractor and will ensure that the public roads are not soiled. •By appointing approved lab, the ambient air quality will be monitored at three locations (120o to each other) at the plant boundary. Level of particulate matter, SO2 and NO2 in air will be measured twice a week.
EPC contractor, EMU of Torrent will monitor and supervise.
Solid waste • Soil contamination and degradation
• In appropriate waste disposal
• Empty cement bags will be sold for reuse. •Spent oil will be given to registered recyclers for reprocessing.
Long-term, negative impacts
• Torrent will ensure that all the mitigating measures are conveyed in the contract documents.
EPC contractor, EMU of Torrent will monitor and supervise.

PROJECT DESIGN DOCUMENT FORM (CDM PDD) - Version 03.1. CDM – Executive Board page 123
Parameter Potential Impact (Without
Mitigating Measures)
Activities Mitigating Measures Overall Impact
Monitoring Requirement Responsible Entities
Noise • Nuisance to surrounding population due to increased noise level
•Vehicular movement, construction machinery, piling work
• Major construction activity will be done only during daytime. •Vehicular movement during night time will be avoided. •Earplugs will be provided to workers exposed to high noise level.
Short-term, negative impact
•Torrent will ensure that all the mitigating measures are conveyed in the contract documents. •By appointing an approved lab, the noise quality will be monitored at three locations (120o to each other) at the plant boundary. Noise level (in dB [A] Leq.) will be measured for day and night time twice a week.
EPC contractor, EMU of Torrent will monitor and supervise.
Socio-economic and cultural environment
•Direct job creation for about 500 people during construction period •Indirect economic development due to market multiplier effect •Creation of infrastructure facilities •Immigration of outside labour force
•Deployment of construction workers •Development of infrastructure facilities like roads and residential quarters •Deployment of contract vehicles
•Locals will be deployed during construction to the extent the same are available in line with requirement of skill. •Effective public relations strategy will be maintained and the locals will be allowed to use the developed infrastructure facility. There will be regular interaction with locals to solve their problems.
Long-term, positive impact
•Torrent will ensure that locals are deployed during the construction phase. • Torrent will interact with the local population.
EPC contractor, PRO of Torrent will monitor and supervise.

PROJECT DESIGN DOCUMENT FORM (CDM PDD) - Version 03.1. CDM – Executive Board page 124
Parameter Potential Impact (Without
Mitigating Measures)
Activities Mitigating Measures Overall Impact
Monitoring Requirement Responsible Entities
• Friction between workers and local Population •Development of squatter slums. •Stress on natural resources like wood, water, sanitation • Inducement of traffic Congestion and road safety hazards.
Operation Phase
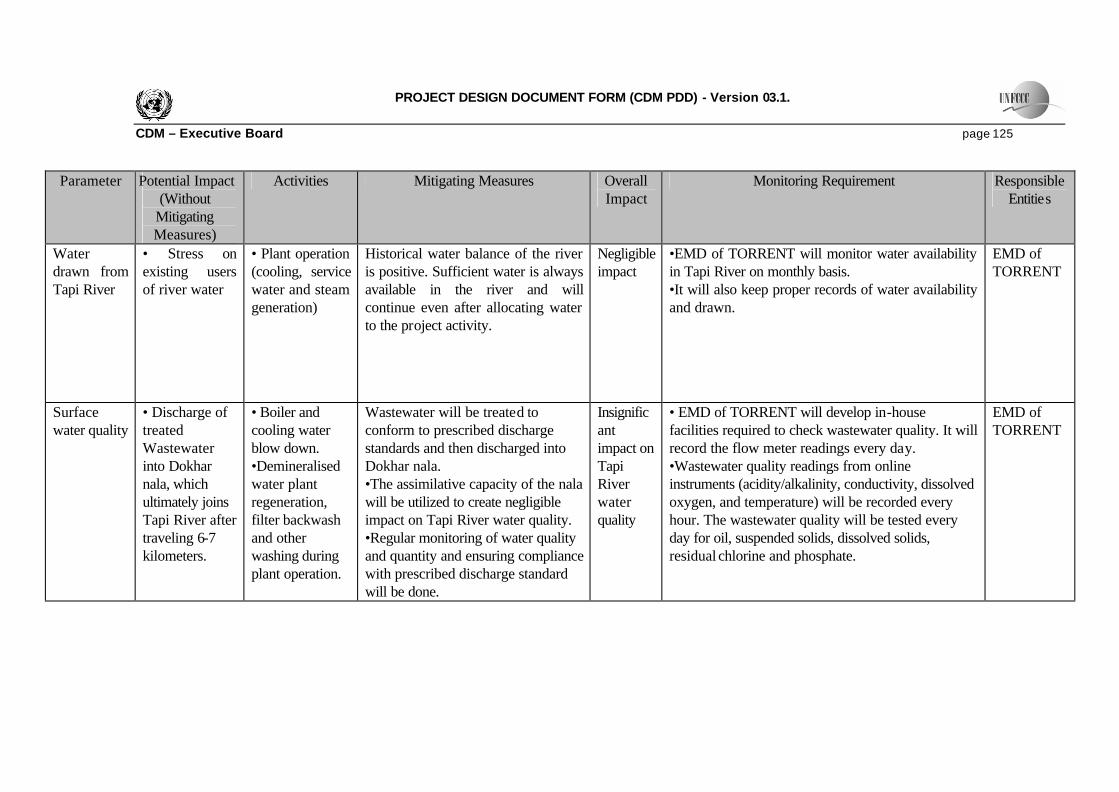
PROJECT DESIGN DOCUMENT FORM (CDM PDD) - Version 03.1. CDM – Executive Board page 125
Parameter Potential Impact (Without
Mitigating Measures)
Activities Mitigating Measures Overall Impact
Monitoring Requirement Responsible Entities
Water drawn from Tapi River
• Stress on existing users of river water
• Plant operation (cooling, service water and steam generation)
Historical water balance of the river is positive. Sufficient water is always available in the river and will continue even after allocating water to the project activity.
Negligible impact
•EMD of TORRENT will monitor water availability in Tapi River on monthly basis. •It will also keep proper records of water availability and drawn.
EMD of TORRENT
Surface water quality
• Discharge of treated Wastewater into Dokhar nala, which ultimately joins Tapi River after traveling 6-7 kilometers.
• Boiler and cooling water blow down. •Demineralised water plant regeneration, filter backwash and other washing during plant operation.
Wastewater will be treated to conform to prescribed discharge standards and then discharged into Dokhar nala. •The assimilative capacity of the nala will be utilized to create negligible impact on Tapi River water quality. •Regular monitoring of water quality and quantity and ensuring compliance with prescribed discharge standard will be done.
Insignificant impact on Tapi River water quality
• EMD of TORRENT will develop in-house facilities required to check wastewater quality. It will record the flow meter readings every day. •Wastewater quality readings from online instruments (acidity/alkalinity, conductivity, dissolved oxygen, and temperature) will be recorded every hour. The wastewater quality will be tested every day for oil, suspended solids, dissolved solids, residual chlorine and phosphate.
EMD of TORRENT

PROJECT DESIGN DOCUMENT FORM (CDM PDD) - Version 03.1. CDM – Executive Board page 126
Parameter Potential Impact (Without
Mitigating Measures)
Activities Mitigating Measures Overall Impact
Monitoring Requirement Responsible Entities
Ground water
• Rainwater harvesting structures and water reservoir will improve the quality and quantity of groundwater.
• No ground water will be used during construct ion or plant operation.
• Rooftop rainwater harvesting structure will be made. Seepage, if any, from reservoir will improve the quality and quantity of groundwater.
Long-term positive
• The EMD of TORRENT will test groundwater quality of Akhakhol village every year. Special attention will be given to parameters like oil, suspended solids, dissolved solids, residual chlorine and phosphate.
EMD of TORRENT
Air quality • Air emissions in the form of oxides of nitrogen in excess of stipulated limits can cause problems to biological and physical environment
• Firing of Natural Gas (including LNG)
•NOx emissions from turbines will be limited to 50 parts per million. •Regular monitoring of air and ensuring compliance with emission standard will be done.
Insignificant impact on existing ambient air quality
•On-line NOx monitors will be installed in each stack. •The monitors will be capable of giving continuous readings of NOx emissions, which will be recorded by the EMD. •The EMD will develop facilities for ambient air sampling and testing. The air quality will be monitored at three locations (120o to each other) at the plant boundary. Levels of particulate matter, SO2 and NO2 in air will be measured twice a week.
EMD of TORRENT

PROJECT DESIGN DOCUMENT FORM (CDM PDD) - Version 03.1. CDM – Executive Board page 127
Parameter Potential Impact (Without
Mitigating Measures)
Activities Mitigating Measures Overall Impact
Monitoring Requirement Responsible Entities
Noise quality •Increased noise generation due to operating turbines and compressors. •Increased traffic flow will add to existing noise level.
• Turbines , compressors
•Low noise turbines (85 decibel on the A scale) are selected for the plant. •Plant vehicles will be maintained and serviced at regular intervals.
Insignificant impact
•The EMD will develop facilities for noise testing. The noise quality will be monitored at three locations (120o to each other) at the plant boundary. Noise level will be measured for day and night time twice a week.
EMD of TORRENT
Solid waste • Indiscriminate disposal of solid waste will create leaching and affect soil and groundwater quality.
• Water treatment plant sludge, spent oil, and lubricants
•Sludge from water treatment plant is not hazardous or toxic. •It will be dewatered in centrifuge and used as landfill material inside the premises. •Spent oil and lubricants will be collected in drums and given to authorized recyclers for reprocessing as per rules.
Insignificant impact
• The EMD will keep proper records of solid waste generated from the water treatment plant. It will identify low-lying land inside the plant premises for disposal. It will also keep records of quantity of spent oil and lubricants generated from the plant, mode of storage and disposal details.
EMD of TORRENT

PROJECT DESIGN DOCUMENT FORM (CDM PDD) - Version 03.1. CDM – Executive Board page 128
Parameter Potential Impact (Without
Mitigating Measures)
Activities Mitigating Measures Overall Impact
Monitoring Requirement Responsible Entities
Biological environment
• There will be insignificant impact because there is no ecologically sensitive area, no forest cover, no national park, no wildlife sanctuaries, no sensitive or endangered species in and around the project area. • The Tapi River is impounded by two dams/weirs; upstream and downstream of Surat; hence aquatic diversity is poor.
• Plant operation • 100% compliance with applicable discharge standards for air emissions and wastewater quality will be ensured.
Insignificant impact
• The EMD will keep a watch on the general conditions of surrounding flora. It will also obtain records of the crop yield of surrounding villages on yearly basis from the Taluka office.
EMD of TORRENT

PROJECT DESIGN DOCUMENT FORM (CDM PDD) - Version 03.1. CDM – Executive Board page 129
Parameter Potential Impact (Without
Mitigating Measures)
Activities Mitigating Measures Overall Impact
Monitoring Requirement Responsible Entities
Public health and safety
• Accident and damage to life and property due to handling flammable gas
• Natural Gas (including LNG) receipt and use in power generation.
•Fire fighting facility •Water reservoir, pumps, and hydrant network •On-site and off-site emergency plan •Active and passive accident control equipment and risk mitigation measures will be implemented.
Long-term negative
•The EMD of TORRENT will develop facilities for monitoring of wind speed and direction at the site. •The Safety Department of TORRENT will conduct mock drills every year to ensure efficacy of the risk mitigating measures.
Safety Department of TORRENT
Socio-economic and cultural environment
•Threat to traditional agriculture practices •Loss of livelihood for people dependent on agriculture •Pressure on resources from unplanned peripheral development •Increased access of outsiders disturbing traditional
• Project development and operation
•Peripheral development will occur due to population influx and increased business opportunities. •Community development plan will be introduced, which will encourage local entrepreneurship, provide employment to locals depending upon their skills. Training programs for developing self-sufficiency among the local youths will be organized. •Public relations strategy will encourage respect for local traditions and religious beliefs. •Community development schemes like tree planting, free health checkup and medicines, donating building materials and furniture for school building renovation. •Locally
Long-term, positive
•Public relations officer (PRO) of TORRENT will ensure that qualified locals are preferred for employment. •He will also interact with the local population and take appropriate steps to solve their problems. •He will implement the community development schemes in surrounding villages.
PRO of TORRENT

PROJECT DESIGN DOCUMENT FORM (CDM PDD) - Version 03.1. CDM – Executive Board page 130
Parameter Potential Impact (Without
Mitigating Measures)
Activities Mitigating Measures Overall Impact
Monitoring Requirement Responsible Entities
beliefs and religion.
available services of farmers, plumbers, electricians, vehicle repair shops, shopkeepers and traders, hotels and eateries will be utilized to the maximum.
EMD = environmental management department, EMU = environmental management unit, EPC = engineering, procurement, and construction, GCC
= general conditions of contract; LNG = liquefied natural gas, NO2 = nitrogen dioxide, NOx = nitrogen oxides, PRO = public relations officer, SO2 = sulfur dioxide, TORRENT = Torrent Power Limited.
- - - - -