pdd piedra larga fase i 29.03 - cdm loan...
TRANSCRIPT

PROJECT DESIGN DOCUMENT FORM (CDM PDD) - Version 03 CDM – Executive Board page 1
CLEAN DEVELOPMENT MECHANISM PROJECT DESIGN DOCUMENT FORM (CDM-PDD)
Version 03 - in effect as of: 28 July 2006
CONTENTS A. General description of project activity B. Application of a baseline and monitoring methodology C. Duration of the project activity / crediting period D. Environmental impacts E. Stakeholders’ comments
Annexes Annex 1: Contact information on participants in the project activity Annex 2: Information regarding public funding Annex 3: Baseline information
Annex 4: Monitoring plan

PROJECT DESIGN DOCUMENT FORM (CDM PDD) - Version 03 CDM – Executive Board page 2 SECTION A. General description of project activity A.1. Title of the project activity: Title: Piedra Larga Wind Farm (the “Piedra Larga Project” or the “Project”). Version: Document Version Number 3. Date: 29/03/2011 (29th March 2011) A.2. Description of the project activity: The purpose of the project activity is the generation of renewable electric energy in Mexico through the construction and operation of a 90 MW wind farm in the municipality of Unión Hidalgo, Oaxaca State. The project will be enlarged by the construction of a second phase of 137.5 MW, which will make the object of a second PDD.
Figure 1. General focus of the area where the wind farm will be constructed
PROJECT DESIGN DOCUMENT FORM (CDM PDD) - Version 03 CDM – Executive Board page 3 The project activity will increase the percentage of renewable sourced power in Mexico grid, promoting the growth of renewable capacity and diversifying the Mexican generation mix, significantly contributing to the sustainable development of the region. This represents a quite important solution, as the Mexican electric generation mix is greatly weighted towards fossil fuels. The power plant will have an expected minimum operating life of 21 years. Commencement of the construction of the wind farm is expected to be started on February 2011. The suitable tests will be done by September 2011 and the wind farm will come into operation on December 2011. The Project developer Generation Permit has been obtained from CRE (Energy Regulatory Commission or Comisión Reguladora de la Electricidad), that was approved on June 2009. An Interconnection Agreement was signed with CFE (Electricity Federal Commission or Comisión Federal de Electricidad) to get access to the grid, on May 2010. The mexican environmental permit MIA (Manifestación de Impacto Ambiental) was obtained on January 2009 for the entire Project (phase I and phase II, mentioned before) from SEMARNAT (The Secretary of the Environment and Natural Resources or Secretaría de Medio Ambiente y Recursos Naturales). Until now, the MIA requirements have been fulfilled rigorously. Lately, an extra time has been asked since the resolution was only valid for 1 year. On March 2010 the adaptation of MIA for it exclusive application to the phase I of the project and to the definitive turbines distribution was requested, and it was approved on April 2010 by SEMARNAT. Other permits and authorisations have been asked: INAH (Instituto Nacional de Antropología e Historia) authorisation (it has been awarded but some small archaeological studies are being completed), Construction and use of soil changing Unión Hidalgo municipality’s license, and the Civil Aeronautic Direction authorisation. As mentioned before, the Project activity will contribute to sustainable development. The contributions are summarized as follows:
• Environmental improvement The Piedra Larga Project will reduce greenhouse gas emissions compared to a business-as-usual scenario, by displacing fossil-fuel based electricity. In addition, it will reduce other pollutants (CO, NOx, SO2) resulting from the power generation industry in Mexico. Specifically, some advantages of wind energy are:
Free, abundant and inexhaustible resource. Clean energy, since CO2 emissions are inexistent in the operating phase. Provides a barrier against the volatility of fossil fuel prices. Supplying security – Avoiding the dependence on fossil fuels.
Modulate and quite fast installation.

PROJECT DESIGN DOCUMENT FORM (CDM PDD) - Version 03 CDM – Executive Board page 4
• Social and economic improvement The Project activity will create local employment during the project construction and operation period and will require training workers as soon as construction begins. Likewise skills will easily be transferred to other wind power projects that are being developed in the area. Specifically, during the construction of the wind farm and later phases for its operation and maintenance, it is planned to hire the field owners and their families, and afterwards the inhabitants of Union Hidalgo municipality. It is forecasted to hire during the construction phase an average of 375 people for civil works, 213 people for electromechanical erection and 55 people for WTG erection, in addition to 8 medium/high qualified persons. After that, 8 low qualified persons and 2 medium/high qualified ones will be needed for the operation and maintenance of the wind farm. In addition to the direct jobs that will be created, the construction works will have a positive impact in the creation of more indirect jobs in companies that provide professional services as well as auxiliary and assistance services like transport, hotel management, food supply, textile industry, etc. A total of 80 jobs are forecasted to be created. Furthermore land lease will provide additional income to land owners, who will also continue with their regular land use practices (with the corresponding income). Moreover, the Project will contribute to Mexico’s income through the payment of taxes. The Project will also contribute to the market development by providing knowledge about business to power consumers in long-term purchases. Also, a bridge will be built on the Espiritu Santo River, improving vehicular traffic for citizens, farmers and livestock farmers, as nowadays there is only one bridge that is being repaired. Therefore the Project will contribute to improving local income levels and living standards and reducing dependence of fossil fuels as energy sources. Furthermore the Project will help to transfer acquired skills and promote administrative and rural property regulation in Oaxaca.
• Technological development The project will help to stimulate the growth of the wind power industry in Mexico and will serve as a demonstration for wider application of wind power technology and other projects for clean renewable electricity generation in local and national level. A.3. Project participants:
Name of Party involved (*)
((host) indicates a host Party) Private and/or public entity(ies) project participants
(*) (as applicable)
Kindly indicate if the Party involved wishes to be considered as project participant (Yes/No)
Mexico (Host) Desarrollos Eólicos Mexicanos de Oaxaca 1 SA de CV (DEMEX OAXACA 1) No
Table 1. Project participants involved

PROJECT DESIGN DOCUMENT FORM (CDM PDD) - Version 03 CDM – Executive Board page 5 Desarrollos Eólicos Mexicanos de Oaxaca 1 SA de CV, called DEMEX OAXACA 1, is the Mexican society that will develop and operate the Project. A.4. Technical description of the project activity: A.4.1. Location of the project activity: A.4.1.1. Host Party(ies): Mexico A.4.1.2. Region/State/Province etc.: Juchitán district, Oaxaca State. A.4.1.3. City/Town/Community etc.: Municipality of Unión Hidalgo A.4.1.4. Details of physical location, including information allowing the unique identification of this project activity (maximum one page): The Project will be located in Oaxaca State, in the southern part of Mexico. It is situated in the municipality of Unión Hidalgo, with 12,983 habitants in 2005, according to INEGI (Instituto Nacional de Estadística, Geografía e Informática) data. The Project site has a 764.99 hectares total area, but installed wind turbines, platforms and access roads will only occupy a space of 26.39 hectares (3.5% of total area). The wind turbines will present the following perimeter coordinates:
LONGITUDE (W) LATITUDE (N)1 94.83105 16.524502 94.81848 16.524183 94.78727 16.508974 94.78791 16.515485 94.79546 16.508336 94.79456 16.507357 94.80757 16.506178 94.80849 16.493109 94.80984 16.4931810 94.81085 16.5007011 94.82882 16.49900
GEOGRAPHIC COORDINATES (º)
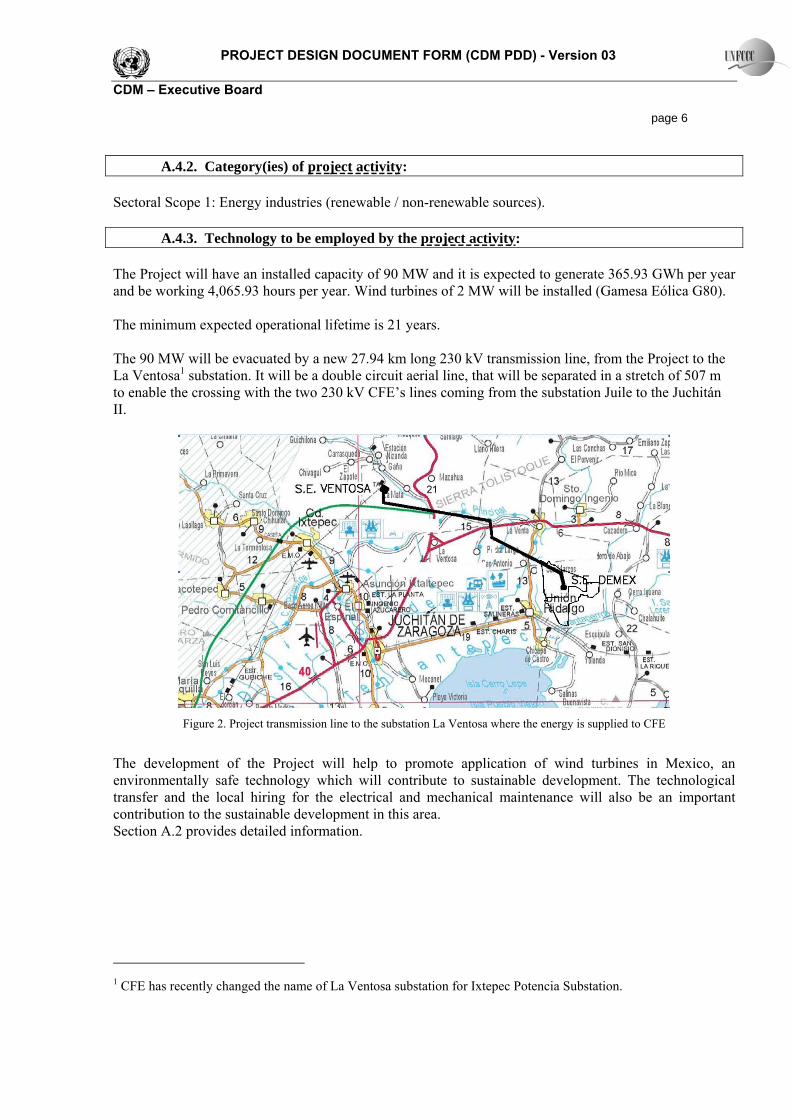
PROJECT DESIGN DOCUMENT FORM (CDM PDD) - Version 03 CDM – Executive Board page 6 A.4.2. Category(ies) of project activity: Sectoral Scope 1: Energy industries (renewable / non-renewable sources). A.4.3. Technology to be employed by the project activity: The Project will have an installed capacity of 90 MW and it is expected to generate 365.93 GWh per year and be working 4,065.93 hours per year. Wind turbines of 2 MW will be installed (Gamesa Eólica G80). The minimum expected operational lifetime is 21 years. The 90 MW will be evacuated by a new 27.94 km long 230 kV transmission line, from the Project to the La Ventosa1 substation. It will be a double circuit aerial line, that will be separated in a stretch of 507 m to enable the crossing with the two 230 kV CFE’s lines coming from the substation Juile to the Juchitán II.
Figure 2. Project transmission line to the substation La Ventosa where the energy is supplied to CFE
The development of the Project will help to promote application of wind turbines in Mexico, an environmentally safe technology which will contribute to sustainable development. The technological transfer and the local hiring for the electrical and mechanical maintenance will also be an important contribution to the sustainable development in this area. Section A.2 provides detailed information.
1 CFE has recently changed the name of La Ventosa substation for Ixtepec Potencia Substation.
PROJECT DESIGN DOCUMENT FORM (CDM PDD) - Version 03 CDM – Executive Board page 7
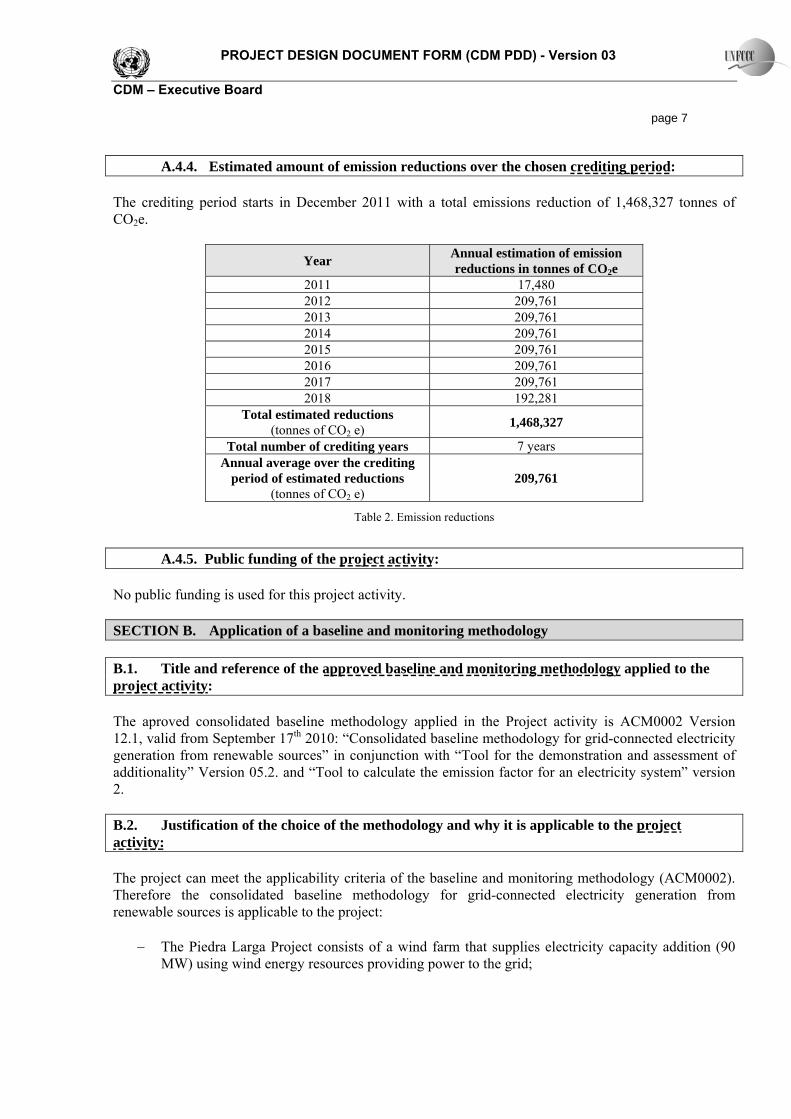
A.4.4. Estimated amount of emission reductions over the chosen crediting period: The crediting period starts in December 2011 with a total emissions reduction of 1,468,327 tonnes of CO2e.
Year Annual estimation of emission reductions in tonnes of CO2e
2011 17,480 2012 209,761 2013 209,761 2014 209,761 2015 209,761 2016 209,761 2017 209,761 2018 192,281
Total estimated reductions (tonnes of CO2 e) 1,468,327
Total number of crediting years 7 years Annual average over the crediting
period of estimated reductions (tonnes of CO2 e)
209,761
Table 2. Emission reductions
A.4.5. Public funding of the project activity: No public funding is used for this project activity. SECTION B. Application of a baseline and monitoring methodology B.1. Title and reference of the approved baseline and monitoring methodology applied to the project activity: The aproved consolidated baseline methodology applied in the Project activity is ACM0002 Version 12.1, valid from September 17th 2010: “Consolidated baseline methodology for grid-connected electricity generation from renewable sources” in conjunction with “Tool for the demonstration and assessment of additionality” Version 05.2. and “Tool to calculate the emission factor for an electricity system” version 2. B.2. Justification of the choice of the methodology and why it is applicable to the project activity: The project can meet the applicability criteria of the baseline and monitoring methodology (ACM0002). Therefore the consolidated baseline methodology for grid-connected electricity generation from renewable sources is applicable to the project:
− The Piedra Larga Project consists of a wind farm that supplies electricity capacity addition (90 MW) using wind energy resources providing power to the grid;
PROJECT DESIGN DOCUMENT FORM (CDM PDD) - Version 03 CDM – Executive Board page 8
− The Piedra Larga Project is not an activity that involves switching from fossil fuels to renewable energy at the site of the project activity; and
− The power grid can be clearly identified as shown in SENER´s “Prospectiva del sector eléctrico”
document, which provides information and data about the geographic area and infrastructure in Mexico, energy exports and imports from/to the Mexican system, detailed characteristics of the Mexican system, etc. Information is publicly available and can be found in the CFE (www.cfe.gob.mx) and SENER (www.sener.gob.mx) websites.
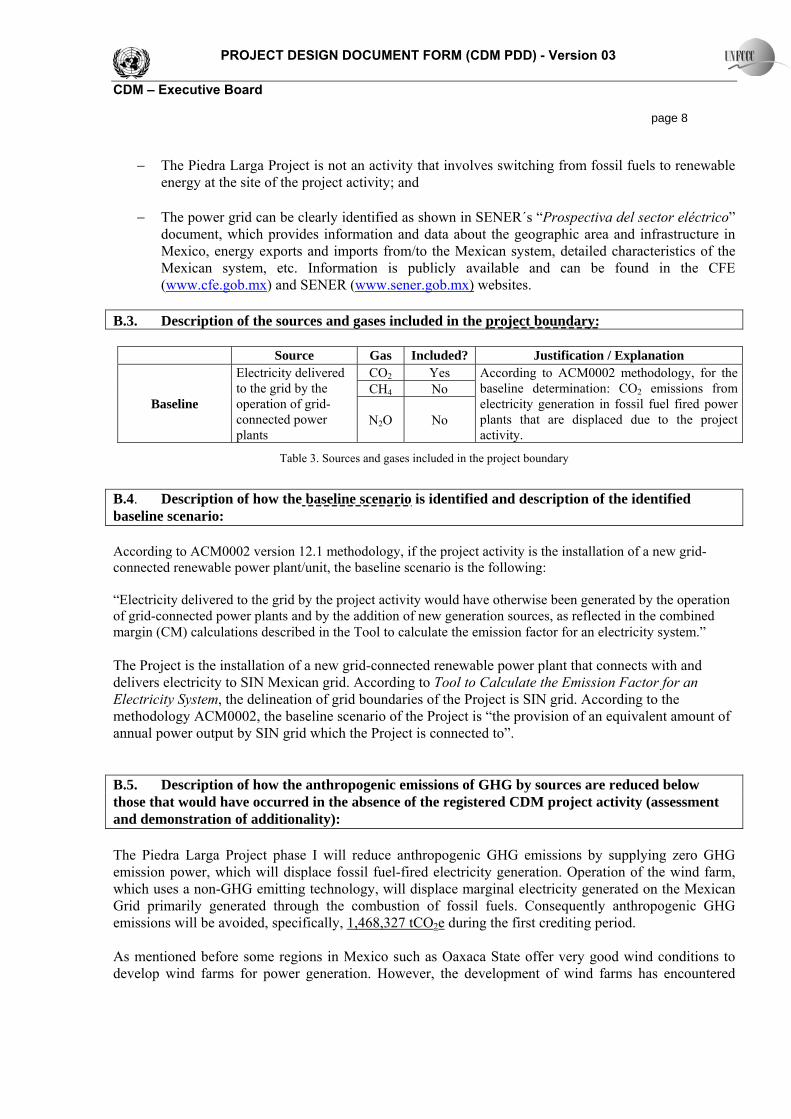
B.3. Description of the sources and gases included in the project boundary:
Source Gas Included? Justification / Explanation
Baseline
Electricity delivered to the grid by the operation of grid-connected power plants
CO2 Yes According to ACM0002 methodology, for the baseline determination: CO2 emissions from electricity generation in fossil fuel fired power plants that are displaced due to the project activity.
CH4 No
N2O No
Table 3. Sources and gases included in the project boundary
B.4. Description of how the baseline scenario is identified and description of the identified baseline scenario: According to ACM0002 version 12.1 methodology, if the project activity is the installation of a new grid-connected renewable power plant/unit, the baseline scenario is the following: “Electricity delivered to the grid by the project activity would have otherwise been generated by the operation of grid-connected power plants and by the addition of new generation sources, as reflected in the combined margin (CM) calculations described in the Tool to calculate the emission factor for an electricity system.” The Project is the installation of a new grid-connected renewable power plant that connects with and delivers electricity to SIN Mexican grid. According to Tool to Calculate the Emission Factor for an Electricity System, the delineation of grid boundaries of the Project is SIN grid. According to the methodology ACM0002, the baseline scenario of the Project is “the provision of an equivalent amount of annual power output by SIN grid which the Project is connected to”. B.5. Description of how the anthropogenic emissions of GHG by sources are reduced below those that would have occurred in the absence of the registered CDM project activity (assessment and demonstration of additionality): The Piedra Larga Project phase I will reduce anthropogenic GHG emissions by supplying zero GHG emission power, which will displace fossil fuel-fired electricity generation. Operation of the wind farm, which uses a non-GHG emitting technology, will displace marginal electricity generated on the Mexican Grid primarily generated through the combustion of fossil fuels. Consequently anthropogenic GHG emissions will be avoided, specifically, 1,468,327 tCO2e during the first crediting period. As mentioned before some regions in Mexico such as Oaxaca State offer very good wind conditions to develop wind farms for power generation. However, the development of wind farms has encountered

PROJECT DESIGN DOCUMENT FORM (CDM PDD) - Version 03 CDM – Executive Board page 9 economic and financial challenges (for example, there are no premiums or incentives for sales of energy from renewable sources like in other countries), institutional barriers and legal and regulatory framework with an incipient maturity level, and lack of information and organizational structure and therefore at present the Project is not a very attractive alternative in the business-as-usual (“BAU”) scenario. In other words, the Piedra Larga Project would only be developed and built if it is registered as a CDM project. According to “Prospectiva del sector eléctrico 2009-2024”, an official document issued by the Mexican government, wind power installations will only comprise 2.31% of the total power installed within the Mexican energy system in 2024 according to long-term planning estimates. The Mexican energy system will be until 2020 mainly based on combined cycle, based on fossil fuels and natural gas, with the 52% of the generated energy in 2020. It also has to be noted that the contribution of wind power to the power generation system is very unlikely to happen if these plants does not receive some sort of direct or indirect financial support, e.g. in the form of CERs from CDM projects. Analysis of the additionality of the project To demonstrate the project’s additionality, “Tool for the demonstration and assessment of additionality” (version 05.2) has been applied following the steps defined:
Step 1. Identification of alternatives to the project activity consistent with current laws and regulations
Sub-step 1a: Define alternatives to the project activity
Definition of alternative scenarios to the project activity that otherwise could be implemented in case that the project activity does not reach its operative status. Under the current circumstances of the Mexican power sector, the following alternatives available to the project developer have been identified:
1. No project activity undertaken (continuation of current practice). Based on data provided by SENER, the continuation of current situation will be natural gas-fired CCGT construction. The latest planning document issued by SENER1 shows 53.2% of the 5.11 GW of “fixed” planned capacity will be based on combined cycle power plants, while the other 46.8% is distributed between other technologies (gas, geothermal, internal combustion diesel type, etc.). Therefore, the BAU alternative would most likely be gas-fired power generation sponsored by CFE.
2. Implementation of power generation plants for renewable sources (minihydro power plants,
biomass plants) to obtain equivalent electricity output. Minihydro power plants would not produce the same GWh than the project and would be necessary conventional hydro, which has a large environmental impact.
3. Implementation of the Project without CDM assistance. The 90 MW wind power project is
developed without obtaining the incremental revenues that result from CDM registration.
1 Secretaría de Energía, México 2009. “Prospectiva del Sector Eléctrico 2009-2024” (table 32, page 129). http://www.sener.gob.mx/webSener/res/PE_y_DT/pub/Prospectiva_electricidad%20_2009-2024.pdf

PROJECT DESIGN DOCUMENT FORM (CDM PDD) - Version 03 CDM – Executive Board page 10 Without CDM incomes, the Project could not be developed due to the regulatory, economical and technical obstacles for its development. Therefore, considering the environmental impacts of large hydro, the baseline scenario for the proposed project is the continuation of the current practice, which means that the Piedra Larga Project would not be implemented. Sub-step 1b: Consistency with mandatory laws and regulations
CFE is Mexico's state-owned utility. The country's Public Electricity Service Act (Ley del Servicio Público de la Energía Eléctrica) was amended in December 1992, allowing private participation in such generation activities as described in article 36 from Ley del Servicio Público de Energía Eléctrica.
− Independent Production (Producción Independiente): They are large generation projects sponsored by CFE in which the developer builds and operates the power plant. All energy is sold to CFE at a fixed price under a long term PPA (typically 25 years) and new plants must be included in CFE expansion plans.
− Self-consumption (Autoabastecimiento): The producer generates power for its own consumption. The power generator may share the ownership of the production company, joining with a number of consumers. Likewise, energy not used by the consumer has to be sold to CFE at a fixed price. It is worth mentioning that most of non-independent production private generation in Mexico has been developed under this scheme.
− Cogeneration (Cogeneración): It is the power generation combined with steam or other thermal energy production for Self-consumption. In order to develop a project under this scheme, it is a requirement that the efficiency of the whole system (i.e., electricity and thermal energy) is higher than that each part independently. The ownership structure of cogeneration facilities is similar to that of Self-consumption projects.
− Small energy producers (Pequeña producción): These are power plants smaller than 30 MW, located in specific areas determined by SENER, and which production must be sold to CFE.
At present renewable projects promoted by private investors can only be developed under Independent production or Self-consumption schemes. Since Piedra Larga Project is not included in the CFE expansion plan, it can only be developed under the Self-consumption scheme.
Step 2. Investment analysis We will next demonstrate that the project activity is economically less attractive than other alternatives without additional revenues from the sale of Certified Emission Reductions (CER). Accordingly, a benchmark analysis was performed to demonstrate the project additionality.
PROJECT DESIGN DOCUMENT FORM (CDM PDD) - Version 03 CDM – Executive Board page 11 Sub-step 2a. Determine appropriate analysis method Since the proposed project will earn revenues from not only CDM but also electricity sales, related the simple cost analysis method is not appropriate. Instead, investment comparison analysis benchmark analysis (Option III) will be applied. It is worth mentioning that the data used for the financial parameters analysis corresponds to the time when investment decision took place, which was on December 3rd 2009, time when the buying of the turbines was awarded to Gamesa. Sub-step 2b.- Option III. Apply benchmark analysis The additionality of the Piedra Larga Project will be demonstrated by benchmark analysis with Project IRR as financial parameter. According to the “Tool for the demonstration and assessment of additionality” (version 05.2), a relevant benchmark for a project IRR can be derived from government bond rates increased by a suitable risk premium to reflect private investment and/or project type. Accordingly, a benchmark value of 11.41% has been determined. This value takes into consideration of the rates for Treasury Bonds in Mexico and a risk premium to reflect private investment country risk factors, as follows:
The Bank of Mexico indicates that the rate for 20-year Fix Rate Bond (“Bono a tasa fija a 20 años”) is 8.44%. This value corresponds to the the Bond rate of December 2009, month in which the investment decision took place. (http://www.banxico.org.mx/SieInternet/consultarDirectorioInternetAction.do?accion=consultarCuadro&idCuadro=CF114§or=7&locale=es).
The risk premium was determined considering both the mature market investment premium
and the technology risk premium:
o Investment premium: According to the Bloomberg database, an acknowledged specialist in providing financial data and investment information, the risk premium for Mexico is 2.972%. Although this figure reflects the country risk of the date of December 2009, it is not likely that this rate would change during the investment phase of the project given the relatively stable state of Mexico’s economy with respect to the risk. 2
o Technology risk: a reliable risk premium related to wind energy projects could not be
identified due to a lack of public information in this sector. However, this risk has not been considered in the benchmark value, as a conservative approach, since wind energy is the only business of Desarrollos Eólicos Mexicanos de Oaxaca 1 SA de CV (DEMEX OAXACA 1).
In line with a conservative approach, a benchmark of 11.41% has been selected. 2 Here, the most conservative risk premium between the value available at Damodaran Online (http://pages.stern.nyu.edu/%7Eadamodar/) and at Bloomberg database has been used.
PROJECT DESIGN DOCUMENT FORM (CDM PDD) - Version 03 CDM – Executive Board page 12 Sub-step 2c. Calculation and comparison of financial indicators According to the methodological tool for additionality demonstration, the previously indicated financial indicator have been calculated for the Piedra Larga Project and compared with the context situation.
Benchmark analysis comparison (Option III): Estimations on basic parameters for calculation of Piedra Larga Project financial indicators are the following:
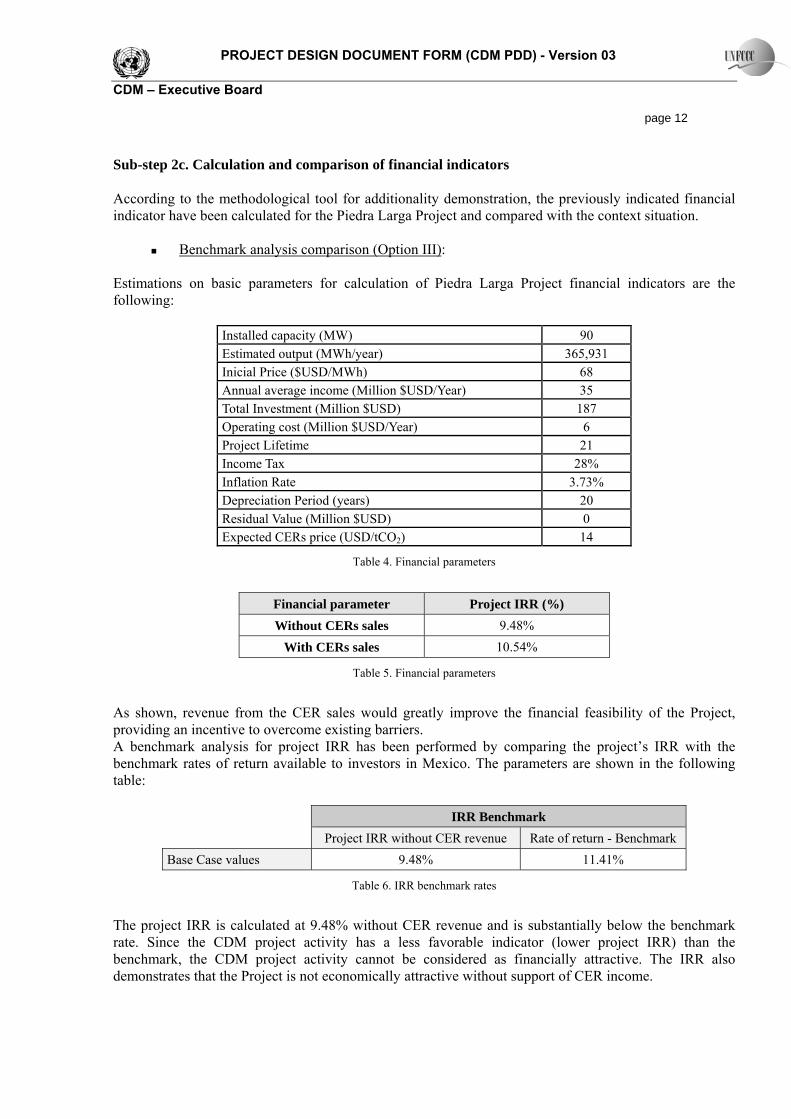
Installed capacity (MW) 90 Estimated output (MWh/year) 365,931 Inicial Price ($USD/MWh) 68 Annual average income (Million $USD/Year) 35 Total Investment (Million $USD) 187 Operating cost (Million $USD/Year) 6 Project Lifetime 21 Income Tax 28% Inflation Rate 3.73% Depreciation Period (years) 20 Residual Value (Million $USD) 0 Expected CERs price (USD/tCO2) 14
Table 4. Financial parameters
Financial parameter Project IRR (%) Without CERs sales 9.48%
With CERs sales 10.54%
Table 5. Financial parameters
As shown, revenue from the CER sales would greatly improve the financial feasibility of the Project, providing an incentive to overcome existing barriers. A benchmark analysis for project IRR has been performed by comparing the project’s IRR with the benchmark rates of return available to investors in Mexico. The parameters are shown in the following table:
IRR Benchmark Project IRR without CER revenue Rate of return - Benchmark
Base Case values 9.48% 11.41%
Table 6. IRR benchmark rates
The project IRR is calculated at 9.48% without CER revenue and is substantially below the benchmark rate. Since the CDM project activity has a less favorable indicator (lower project IRR) than the benchmark, the CDM project activity cannot be considered as financially attractive. The IRR also demonstrates that the Project is not economically attractive without support of CER income.

PROJECT DESIGN DOCUMENT FORM (CDM PDD) - Version 03 CDM – Executive Board page 13 Sub-step 2d. Sensitivity Analysis A sensitivity analysis is a frequently used method for assessing the perceived uncertainties by identifying the potential changing ranges of some key elements and potential impacts of such changes on the economic model of the Project . A sensitivity analysis has been carried out for some financial indicators when fluctuating within the range of -10% to +10%:
Financial indicators sensibility analysis
Project IIR
10% 5% Base Case -5% -10%
Project Cost 8.52% 8.98% 9.48% 10.02% 10.60%
Electricity Price 10.66% 10.08% 9.48% 8.86% 8.22%
O&M Cost 9.65% 9.72% 9.48% 9.87% 9.95%
Electricity Generation 10.66% 10.08% 9.48% 8.86% 8.22%
Table 7. Financial parameters sensivity analysis.
As shows the sensibility analysis of the main variable financial parameters, the revenue obtained from the CER will greatly improve the financial feasibility of the Project and will provide an incentive to overcome existing barriers. Step 3. Barrier analysis N/A Step 4. Common practice analysis Sub-step 4a. Analyze other activities similar to the proposed project activity. This wind energy source is not similar to any other technology or power plant due to its technical characteristics. As this kind of technology still has to face a wide number of barriers in Mexico to be developed, almost all Wind Farms projects in Mexico have been implemented with CDM support. CDM wind farms developed in Mexico are the following:
Project Activity Status Date Bii Nee Stipa Registered December 2005 Eurus Wind Farm Registered January 2007 Bii Nee Stipa III Registered February 2007 La Venta II Registered June 2007 La Ventosa Wind Energy Project Registered December 2007 Santo Domingo Wind Energy Project Registered November 2008 Bii Stinu Wind Energy Project Registered January 2009 Fuerza Eólica del Istmo Wind Farm Registered August 2009

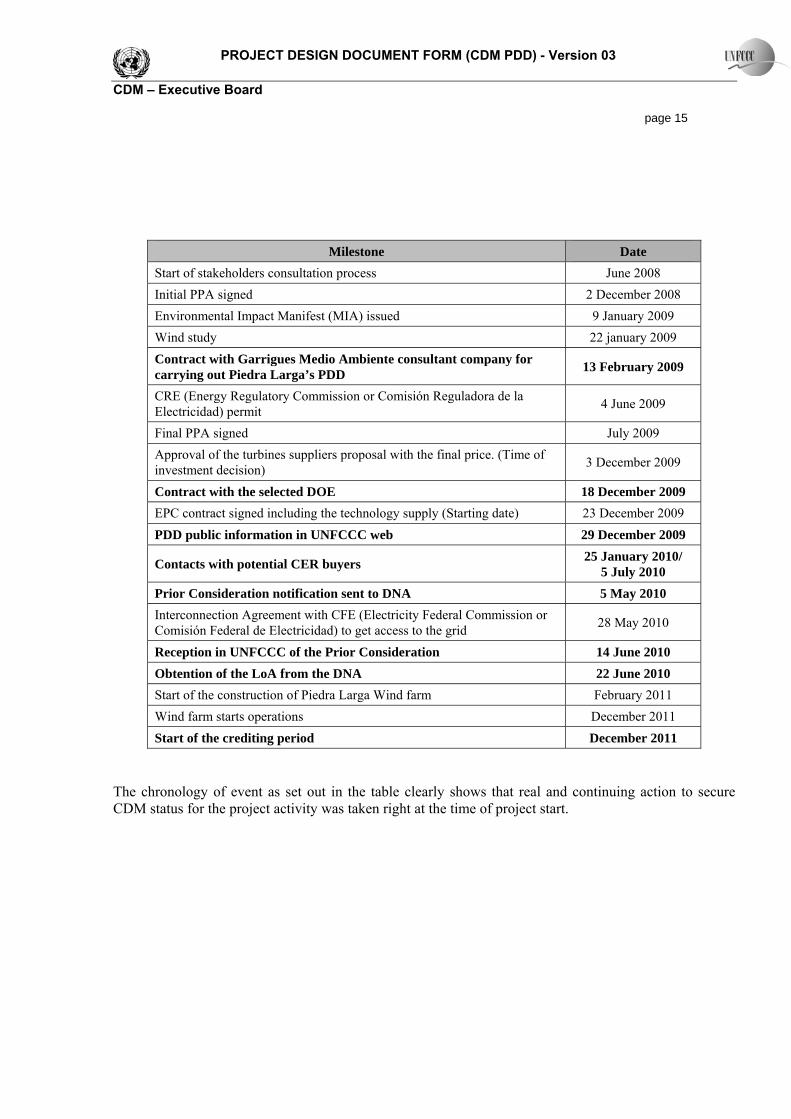
PROJECT DESIGN DOCUMENT FORM (CDM PDD) - Version 03 CDM – Executive Board page 14 Only one not CMD wind farm similar project, “La Venta III” with 101 MW, is actually under construction in México. “La Venta III” project is being developed under a national large scale renewable energy program (“Proyecto de Energías Renovables a Gran Escala” PERGE) consisting on helping Mexico to develop the initial experience required for implementing renewable energy applications connected to the grid with a commercial base. Therefore, a grant was stated by FMAM of about 25.35 millions US$ for helping to the construction of this 101 wind farm. Sub-step 4b. Discuss any similar options that are occurring. The Piedra Larga Project is not included in PERGE program and consequently is not being given any economic support as was La Venta III project. Besides, no other similar activities are observed. Similar projects that have been recently announced rely on additional income from registration as a CDM project in order to overcome the existing barriers, as La Venta II Wind Farm project (83.3 MW), La Ventosa Wind Farm project (102 MW, but only 79.9 MW constructed at the moment) and Fuerza Eólica del Istmo Wind Farm project (50 MW), among others. As a result of applying the “Tool for the demonstration and assessment of additionality” ver. 5.2 it is concluded that based on conservative approaches and assumptions the proposed project activity “Piedra Larga Wind Farm” fulfils all the additionality requirements demonstrating that the CDM registration is required and fundamental for it’s implemented. Prior CDM consideration: The project participant had undertaken the proposed project activity by considering the CDM benefits to overcome the financial barriers associated with it. The project participant, during their decision to invest in the project, had seriously considered CDM benefits. Besides, there are several other initiatives that have been taken by the project participant for successfully and timely implement this project as a CDM project activity. According to EB 49 Annex 22, project participant of project activities with a starting date on or after 02 August 2008 must inform a Host Party DNA and the UNFCCC secretariat of the commencement of the project activity and of their intention to seek CDM status. According to the requirements, in Piedra Larga’s Proyect such notification has been made within six months of the project activity start date, 23/12/2009, when contract for wind turbines supply was signed. In order to demonstrate the prior consideration of CDM, next is included a timetable indicating all the relevant information regarding the development of the project and the main events related to the CDM development (shown in bold font):
PROJECT DESIGN DOCUMENT FORM (CDM PDD) - Version 03 CDM – Executive Board page 15
Milestone Date Start of stakeholders consultation process June 2008 Initial PPA signed 2 December 2008 Environmental Impact Manifest (MIA) issued 9 January 2009 Wind study 22 january 2009 Contract with Garrigues Medio Ambiente consultant company for carrying out Piedra Larga’s PDD 13 February 2009
CRE (Energy Regulatory Commission or Comisión Reguladora de la Electricidad) permit 4 June 2009
Final PPA signed July 2009 Approval of the turbines suppliers proposal with the final price. (Time of investment decision) 3 December 2009
Contract with the selected DOE 18 December 2009 EPC contract signed including the technology supply (Starting date) 23 December 2009 PDD public information in UNFCCC web 29 December 2009
Contacts with potential CER buyers 25 January 2010/ 5 July 2010
Prior Consideration notification sent to DNA 5 May 2010 Interconnection Agreement with CFE (Electricity Federal Commission or Comisión Federal de Electricidad) to get access to the grid 28 May 2010
Reception in UNFCCC of the Prior Consideration 14 June 2010 Obtention of the LoA from the DNA 22 June 2010 Start of the construction of Piedra Larga Wind farm February 2011 Wind farm starts operations December 2011 Start of the crediting period December 2011
The chronology of event as set out in the table clearly shows that real and continuing action to secure CDM status for the project activity was taken right at the time of project start.

PROJECT DESIGN DOCUMENT FORM (CDM PDD) - Version 03 CDM – Executive Board page 16 B.6. Emission reductions:
B.6.1. Explanation of methodological choices: The baseline scenario represents the electricity that would have otherwise been generated by the operation of the grid-connected power plants and by the addition of new generation sources. Step 1.Identify the relevant electricity systems The Mexican electricity system (Sistema Electrico Nacional, SEN) is formed by the Interconnected National System (Sistema Interconectado Nacional, SIN) and two isolated grids (Baja California and Baja California Sur)3. For being situated in Oaxaca state, located in the “Oriental” operation area (See Figure 3), Piedra Larga Phase I wind farm project will deliver the generated electricity to the main grid “Sistema Interconectado Nacional” (SIN).
Figure 3. National Electric System (SEN) operation areas. Source: Prospectiva del Sector Eléctrico 2009-2024, page 172.
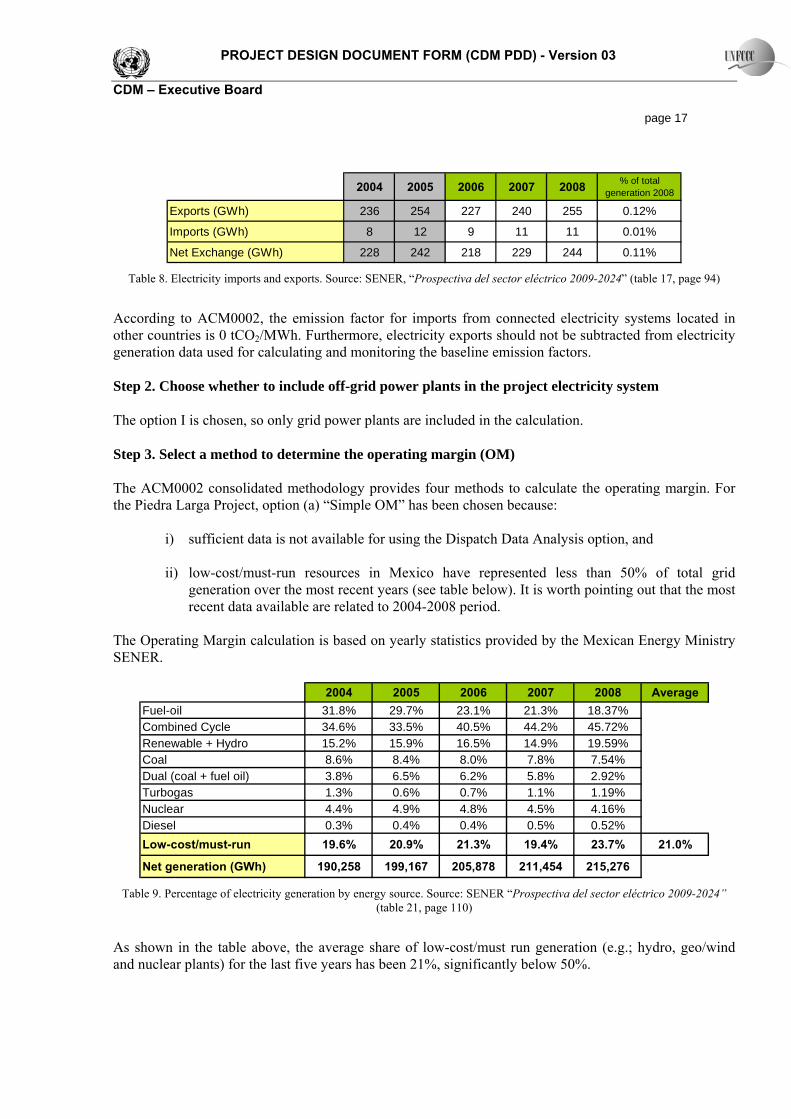
Nevertheless, data for the SIN grid are not always available by their own, so data from the global system SEN have been used at some points. There are no imports to the grid within the boundaries of Mexico, but there are electricity imports and exports with electricity systems in other countries by means of nine electric interconnections with the Unites States of America, Belize and Gautemala. Specifically imports come from the US and exports go to EUA, Belize and Guatemala, being most of it received or exported throught the Baja California isolated grid. Therefore, SIN imports and exports data are given in table below:
3 Source: SENER “Prospectiva Sector Eléctrico 2009-2024”) p 123, among others.
PROJECT DESIGN DOCUMENT FORM (CDM PDD) - Version 03 CDM – Executive Board page 17
2004 2005 2006 2007 2008 % of total generation 2008
Exports (GWh) 236 254 227 240 255 0.12%
Imports (GWh) 8 12 9 11 11 0.01%
Net Exchange (GWh) 228 242 218 229 244 0.11% Table 8. Electricity imports and exports. Source: SENER, “Prospectiva del sector eléctrico 2009-2024” (table 17, page 94)
According to ACM0002, the emission factor for imports from connected electricity systems located in other countries is 0 tCO2/MWh. Furthermore, electricity exports should not be subtracted from electricity generation data used for calculating and monitoring the baseline emission factors. Step 2. Choose whether to include off-grid power plants in the project electricity system The option I is chosen, so only grid power plants are included in the calculation. Step 3. Select a method to determine the operating margin (OM) The ACM0002 consolidated methodology provides four methods to calculate the operating margin. For the Piedra Larga Project, option (a) “Simple OM” has been chosen because:
i) sufficient data is not available for using the Dispatch Data Analysis option, and ii) low-cost/must-run resources in Mexico have represented less than 50% of total grid
generation over the most recent years (see table below). It is worth pointing out that the most recent data available are related to 2004-2008 period.
The Operating Margin calculation is based on yearly statistics provided by the Mexican Energy Ministry SENER.
2004 2005 2006 2007 2008 AverageFuel-oil 31.8% 29.7% 23.1% 21.3% 18.37%Combined Cycle 34.6% 33.5% 40.5% 44.2% 45.72%Renewable + Hydro 15.2% 15.9% 16.5% 14.9% 19.59%Coal 8.6% 8.4% 8.0% 7.8% 7.54%Dual (coal + fuel oil) 3.8% 6.5% 6.2% 5.8% 2.92%Turbogas 1.3% 0.6% 0.7% 1.1% 1.19%Nuclear 4.4% 4.9% 4.8% 4.5% 4.16%Diesel 0.3% 0.4% 0.4% 0.5% 0.52%Low-cost/must-run 19.6% 20.9% 21.3% 19.4% 23.7% 21.0%
Net generation (GWh) 190,258 199,167 205,878 211,454 215,276 Table 9. Percentage of electricity generation by energy source. Source: SENER “Prospectiva del sector eléctrico 2009-2024”
(table 21, page 110)
As shown in the table above, the average share of low-cost/must run generation (e.g.; hydro, geo/wind and nuclear plants) for the last five years has been 21%, significantly below 50%.

PROJECT DESIGN DOCUMENT FORM (CDM PDD) - Version 03 CDM – Executive Board page 18 The Simple OM emission factor can be calculated using either of the two following data vintages for year (s):
• Ex-ante option: A 3-year generation weighted average, based on the most recent data available at the time of submission of the CDM-PDD to the DOE for validation, without requirement to monitor and recalculate the emissions factor during the crediting period, or
• Ex-post option: The year in which the project activity displaces grid electricity, requiring the emissions factor to be updated annually during monitoring.
Ex-ante option has been chosen because the yearly statistics provided by SENER needed to calculate the OM ex-post are normally published more than one year after the end of the reporting year, leading to large delays between emission reduction and monitoring, verification and issuance of CERs. It has been also chosen due to the simplicity of the project development and also for the emission reduction verification. Step 4: Calculate the operating margin emission factor according to the selected method. The Simple OM Emission Factor (EFOM,simple,y) is calculated as the generation-weighted average emissions per electricity unit (tCO2/MWh) of all generating sources serving the system, not including low-operating cost and must-run power plants. It has been calculated following the “Option B” mentioned in the Step 4 of the “Tool to calculate the emission factor for an electricity system” (version 2). Option B is used because:
(a) total net electricity generation of all power plants serving the system as well as the fuel types and total fuel consumption of the project electricity system are available; conversely, data for option A are not; and
(b) only nuclear and renewable power generation are considered as low-cost/ must-run power sources and the quantity of electricity supplied to the grid by these sources is known; and
(c) off-grid power plants have not been included in the calculation (see Option I chosen in Step 2). Option B addresses the calculation based on data on fuel consumption and net electricity generation of each power plant / unit, resulting in the equation below.
y
iyiCOyiyi
yOMsimplegrid EG
EFNCVFCEF
∑ ⋅⋅=
,,2,,
,, (tCO2e/MWh)
Where:
EFgrid,OMsimple,y is the simple operating margin CO2 emission factor in year y (tCO2/MWh); FCi,y refers to the amount of fossil fuel type i consumed in the project electricity system in
year y (mass or volume unit); NCVi,y refers to the net calorific value (energy content) of fossil fuel type i in year y (TJ/Gg); EFCO2,i,y refers to the CO2 emission factor of fossil fuel type i in year y (tCO2/GJ); EGy refers to the net electricity generated and delivered to the grid by all power sources
serving the system, not including low cost/ must run power plants/units, in year y (MWh);

PROJECT DESIGN DOCUMENT FORM (CDM PDD) - Version 03 CDM – Executive Board page 19
i refers to all fossil fuel types combusted in power sources in the project electricity system in year y.
y refers to the relevant year as per the data vintage chosen in step 3.
The parameters that are used for calculating the Operating Margin are obtained as follows:
− The FCi,y factor can be found in SENER’s official documents “Prospectiva del sector eléctrico 2007-2016”, “Prospectiva del sector eléctrico 2008-2017”, which are available at http://www.energia.gob.mx/webSener/portal/publicaciones.html, and private communication with SENER for 2008 data.
− The EGy factor has been obtained from the “Prospectiva del sector eléctrico 2009-
2024”SENER’s official publication. − The NCVi,y and EFCO2,i,y factors can be found in the “2006 IPCC Guidelines for National
Greenhouse Gas Inventories”, Volume 2 (Energy), Chapter 1 (Introduction). The calculation of the operating margin includes electricity imports to the grid. Step 5: Identify the group of power units to be included in the build margin (BM). The sample of power plants must be chosen between two options proposed in the “Tool to calculate the emission factor for an electricity system” version 2:
(a) The set of five power units that have been built most recently, or (b) The set of power capacity additions in the electricity system that comprise 20% of the
system generation (in MWh) and that have been built most recently. Option (b) has been chosen to calculate the BM as this is the alternative that yields a sample group which comprises the larger annual generation. In terms of vintage data, one of the following two options must be chosen:
Option 1. Calculate, for the first crediting period, the BM emission factor ex-ante based on the most recent information available on units already built; and for the second crediting period, update the BM emission factor based on the most recent information available on units already built at the time of submission of the request for renewal of the crediting period to the DOE. For the third crediting period, the BM emission factor calculated for the second crediting period should be used. This option does not require monitoring the emission factor during the crediting period. Option 2. Update the build margin emission factor annually, ex-post, for the first crediting period, including those units built up to the year of registration of the project activity or, if information up to the year of registration is no yet available, including those units built up to the latest year for which information is available. For the second crediting period, the BM emission factor shall be calculated ex-ante, as described in option 1 above. For the third crediting period, the build margin emission factor calculated for the second crediting period should be used.
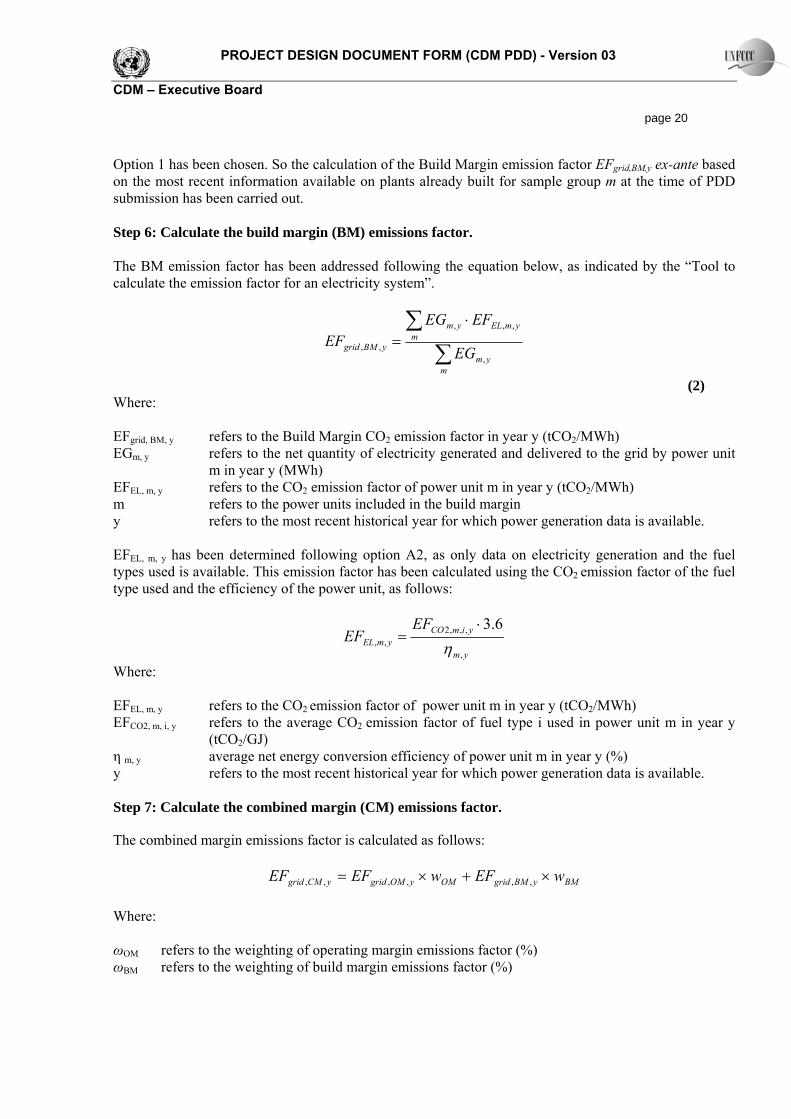
PROJECT DESIGN DOCUMENT FORM (CDM PDD) - Version 03 CDM – Executive Board page 20 Option 1 has been chosen. So the calculation of the Build Margin emission factor EFgrid,BM,y ex-ante based on the most recent information available on plants already built for sample group m at the time of PDD submission has been carried out. Step 6: Calculate the build margin (BM) emissions factor. The BM emission factor has been addressed following the equation below, as indicated by the “Tool to calculate the emission factor for an electricity system”.
∑∑ ⋅
=
mym
ymELm
ym
yBMgrid EG
EFEGEF
,
,,,
,,
(2) Where: EFgrid, BM, y refers to the Build Margin CO2 emission factor in year y (tCO2/MWh) EGm, y refers to the net quantity of electricity generated and delivered to the grid by power unit
m in year y (MWh) EFEL, m, y refers to the CO2 emission factor of power unit m in year y (tCO2/MWh) m refers to the power units included in the build margin y refers to the most recent historical year for which power generation data is available. EFEL, m, y has been determined following option A2, as only data on electricity generation and the fuel types used is available. This emission factor has been calculated using the CO2 emission factor of the fuel type used and the efficiency of the power unit, as follows:
ym
yimCOymEL
EFEF
,
,,,2,,
6.3η
⋅=
Where: EFEL, m, y refers to the CO2 emission factor of power unit m in year y (tCO2/MWh) EFCO2, m, i, y refers to the average CO2 emission factor of fuel type i used in power unit m in year y
(tCO2/GJ) η m, y average net energy conversion efficiency of power unit m in year y (%) y refers to the most recent historical year for which power generation data is available. Step 7: Calculate the combined margin (CM) emissions factor.
The combined margin emissions factor is calculated as follows:
BMyBMgridOMyOMgridyCMgrid wEFwEFEF ×+×= ,,,,,, Where: ωOM refers to the weighting of operating margin emissions factor (%) ωBM refers to the weighting of build margin emissions factor (%)
PROJECT DESIGN DOCUMENT FORM (CDM PDD) - Version 03 CDM – Executive Board page 21 For wind and solar projects, the default weights are as follows: ωOM = 0.75 and ωBM = 0.25 (due to their intermittent and non-dispatchable nature). For the calculation of these two terms (BM and OM), official data published by SENER in the “Prospectiva del sector eléctrico” documents have been used. These documents can be accessed at http://www.energia.gob.mx/webSener/portal/publicaciones.html.
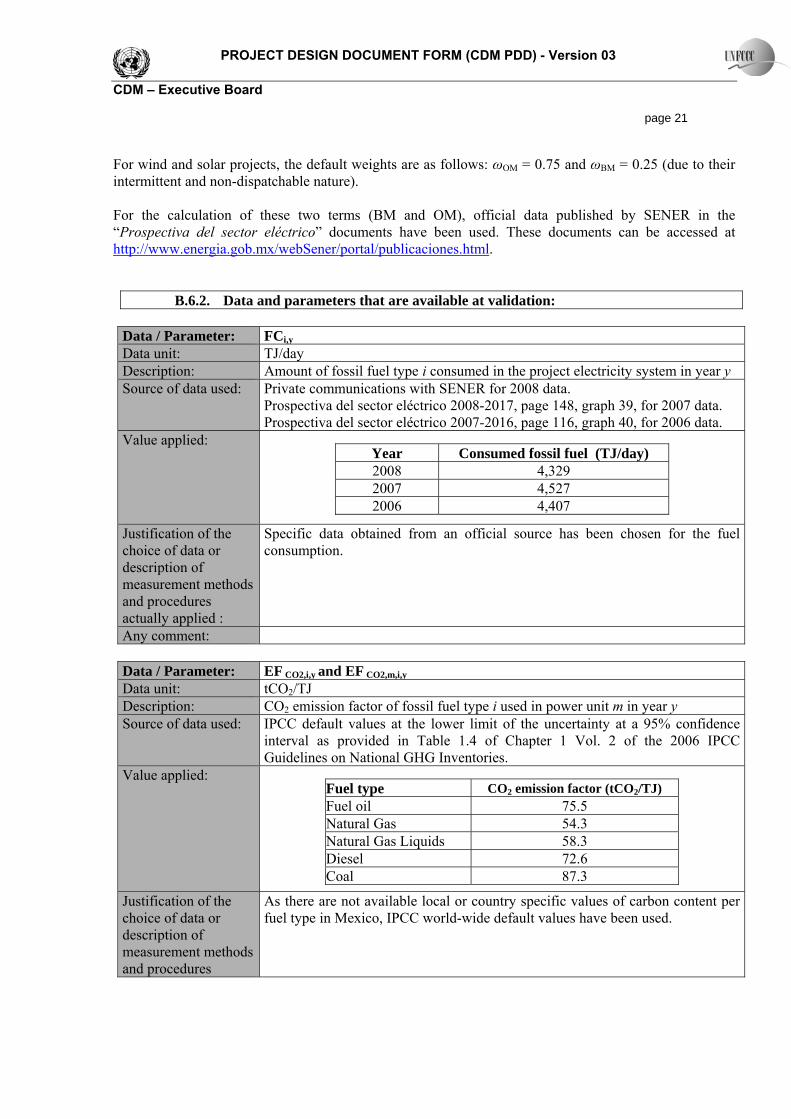
B.6.2. Data and parameters that are available at validation:
Data / Parameter: FCi,y Data unit: TJ/day Description: Amount of fossil fuel type i consumed in the project electricity system in year y Source of data used: Private communications with SENER for 2008 data.
Prospectiva del sector eléctrico 2008-2017, page 148, graph 39, for 2007 data. Prospectiva del sector eléctrico 2007-2016, page 116, graph 40, for 2006 data.
Value applied: Year Consumed fossil fuel (TJ/day) 2008 4,329 2007 4,527 2006 4,407
Justification of the choice of data or description of measurement methods and procedures actually applied :
Specific data obtained from an official source has been chosen for the fuel consumption.
Any comment:
Data / Parameter: EF CO2,i,y and EF CO2,m,i,y Data unit: tCO2/TJ Description: CO2 emission factor of fossil fuel type i used in power unit m in year y Source of data used: IPCC default values at the lower limit of the uncertainty at a 95% confidence
interval as provided in Table 1.4 of Chapter 1 Vol. 2 of the 2006 IPCC Guidelines on National GHG Inventories.
Value applied: Fuel type CO2 emission factor (tCO2/TJ) Fuel oil 75.5 Natural Gas 54.3 Natural Gas Liquids 58.3 Diesel 72.6 Coal 87.3
Justification of the choice of data or description of measurement methods and procedures
As there are not available local or country specific values of carbon content per fuel type in Mexico, IPCC world-wide default values have been used.
PROJECT DESIGN DOCUMENT FORM (CDM PDD) - Version 03 CDM – Executive Board page 22
actually applied : Any comment:
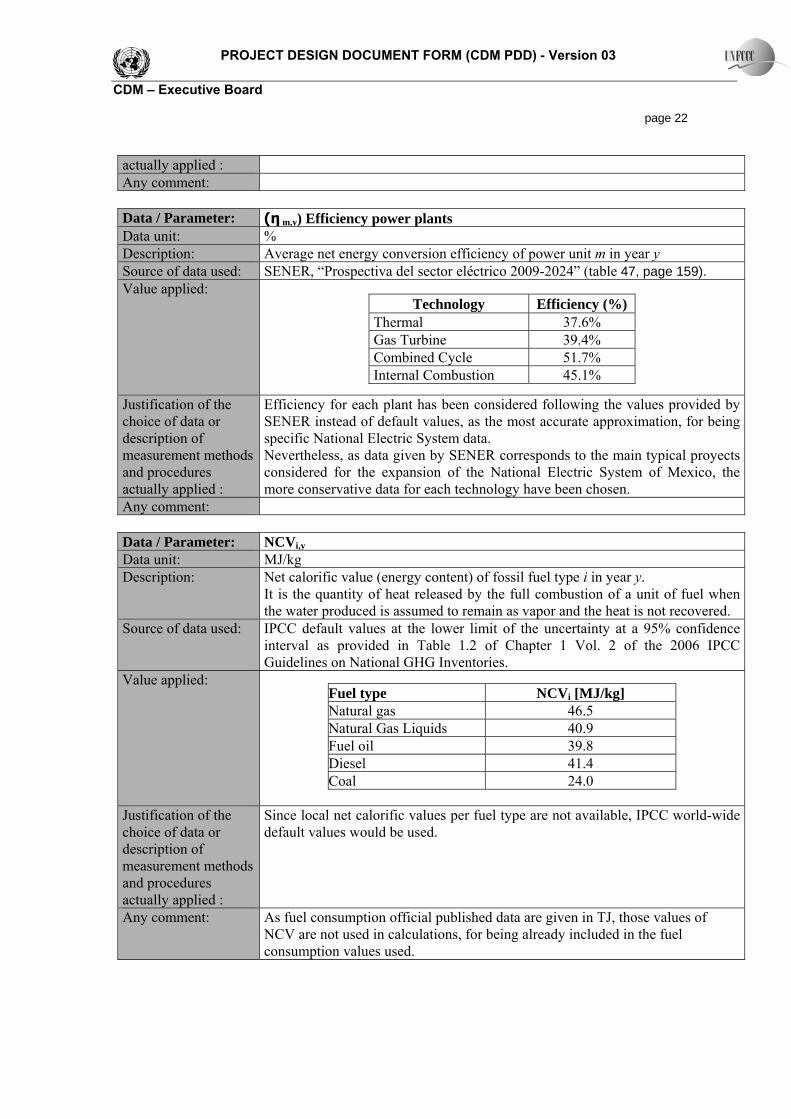
Data / Parameter: (η m,y) Efficiency power plants Data unit: % Description: Average net energy conversion efficiency of power unit m in year y Source of data used: SENER, “Prospectiva del sector eléctrico 2009-2024” (table 47, page 159). Value applied:
Technology Efficiency (%) Thermal 37.6% Gas Turbine 39.4% Combined Cycle 51.7% Internal Combustion 45.1%
Justification of the choice of data or description of measurement methods and procedures actually applied :
Efficiency for each plant has been considered following the values provided by SENER instead of default values, as the most accurate approximation, for being specific National Electric System data. Nevertheless, as data given by SENER corresponds to the main typical proyects considered for the expansion of the National Electric System of Mexico, the more conservative data for each technology have been chosen.
Any comment:
Data / Parameter: NCVi,y
Data unit: MJ/kg Description: Net calorific value (energy content) of fossil fuel type i in year y.
It is the quantity of heat released by the full combustion of a unit of fuel when the water produced is assumed to remain as vapor and the heat is not recovered.
Source of data used: IPCC default values at the lower limit of the uncertainty at a 95% confidence interval as provided in Table 1.2 of Chapter 1 Vol. 2 of the 2006 IPCC Guidelines on National GHG Inventories.
Value applied: Fuel type NCVi [MJ/kg] Natural gas 46.5 Natural Gas Liquids 40.9 Fuel oil 39.8 Diesel 41.4 Coal 24.0
Justification of the choice of data or description of measurement methods and procedures actually applied :
Since local net calorific values per fuel type are not available, IPCC world-wide default values would be used.
Any comment: As fuel consumption official published data are given in TJ, those values of NCV are not used in calculations, for being already included in the fuel consumption values used.
PROJECT DESIGN DOCUMENT FORM (CDM PDD) - Version 03 CDM – Executive Board page 23
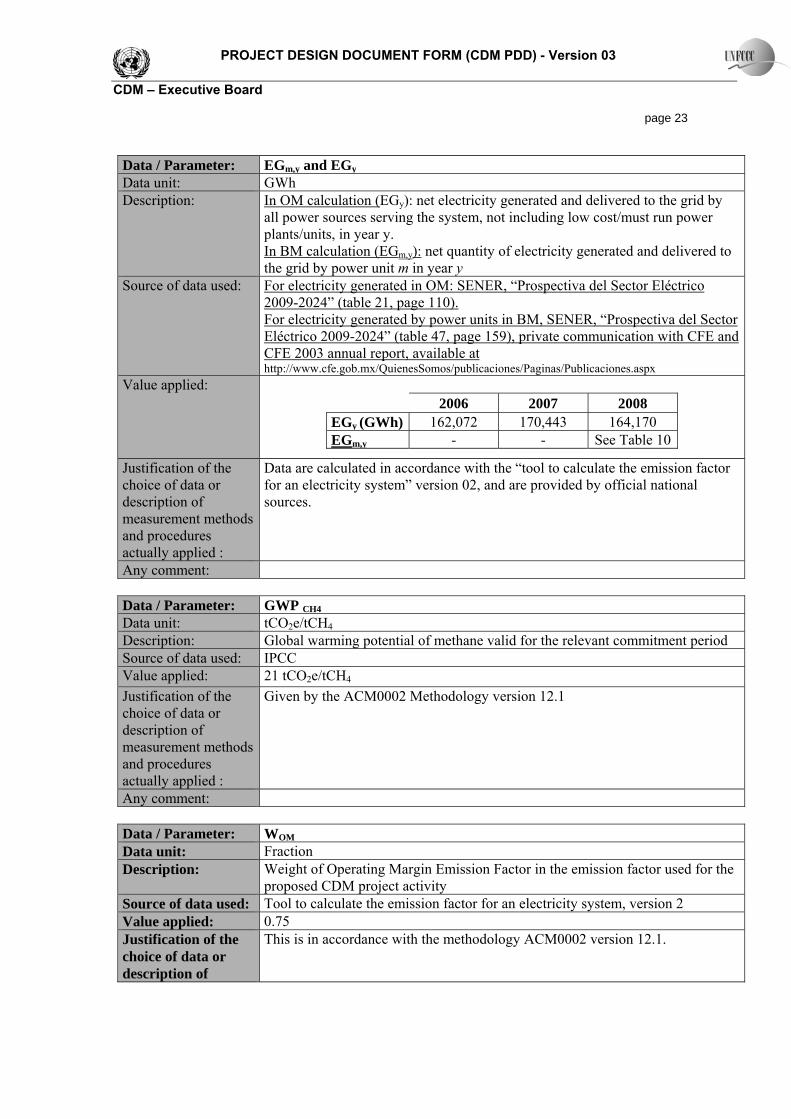
Data / Parameter: EGm,y and EGy Data unit: GWh Description: In OM calculation (EGy): net electricity generated and delivered to the grid by
all power sources serving the system, not including low cost/must run power plants/units, in year y. In BM calculation (EGm,y): net quantity of electricity generated and delivered to the grid by power unit m in year y
Source of data used: For electricity generated in OM: SENER, “Prospectiva del Sector Eléctrico 2009-2024” (table 21, page 110). For electricity generated by power units in BM, SENER, “Prospectiva del Sector Eléctrico 2009-2024” (table 47, page 159), private communication with CFE and CFE 2003 annual report, available at http://www.cfe.gob.mx/QuienesSomos/publicaciones/Paginas/Publicaciones.aspx
Value applied: 2006 2007 2008
EGy (GWh) 162,072 170,443 164,170 EGm,y - - See Table 10
Justification of the choice of data or description of measurement methods and procedures actually applied :
Data are calculated in accordance with the “tool to calculate the emission factor for an electricity system” version 02, and are provided by official national sources.
Any comment:
Data / Parameter: GWP CH4
Data unit: tCO2e/tCH4 Description: Global warming potential of methane valid for the relevant commitment period Source of data used: IPCC Value applied: 21 tCO2e/tCH4 Justification of the choice of data or description of measurement methods and procedures actually applied :
Given by the ACM0002 Methodology version 12.1
Any comment:
Data / Parameter: WOM Data unit: Fraction Description: Weight of Operating Margin Emission Factor in the emission factor used for the
proposed CDM project activity Source of data used: Tool to calculate the emission factor for an electricity system, version 2 Value applied: 0.75 Justification of the choice of data or description of
This is in accordance with the methodology ACM0002 version 12.1.
PROJECT DESIGN DOCUMENT FORM (CDM PDD) - Version 03 CDM – Executive Board page 24
measurement methods and procedures actually applied : Any comment:
Data / Parameter: WBM Data unit: Fraction Description: Weight of Built Margin Emission Factor in the emission factor used for the
proposed CDM project activity Source of data used: Tool to calculate the emission factor for an electricity system, version 2 Value applied: 0.25 Justification of the choice of data or description of measurement methods and procedures actually applied :
This is in accordance with the methodology ACM0002 version 12.1.
Any comment:
Data / Parameter: EFOM,y Data unit: tCO2/GWh Description: Operating Margin Emission Factor for Mexican grid in year y Source of data used: SENER, “Prospectiva del sector eléctrico 2009-2024” (table 21, page 110; table
17, page 94), “Prospectiva del sector eléctrico 2008-2017” (graph 39, page 148) “Prospectiva del sector eléctrico 2007-2016” (graph 40, page 116), 2006 IPCC default values and private communication with SENER.
Value applied: 650.33 tCO2/GWh Justification of the choice of data or description of measurement methods and procedures actually applied :
The Simple OM Emission Factor (EFOM,simple,y) is calculated as the generation-weighted average emissions per electricity unit of all generating sources serving the system, not including low-operating cost and must-run power plants. It has been calculated following the “Option B” mentioned in the Step 4 of the “Tool to calculate the emission factor for an electricity system” (version 2).
Any comment:
Data / Parameter: EFBM,y Data unit: tCO2/GWh Description: Build Margin Emission Factor for Mexican grid in year y Source of data used: SENER, “Prospectiva del sector eléctrico 2009-2024” (Table 18, page 96; table
47, page 159), “Prospectiva del sector eléctrico 2008-2017” (Table 19, page 101), “Prospectiva del sector eléctrico 2007-2016” (table 19, page 77), “Prospectiva del sector eléctrico 2006-2015” (table 13, page 57), “Prospectiva del sector eléctrico 2005-2014” (table 14, page 51), “Prospectiva del sector eléctrico 2004-2013” (table 9, page 44), Private communications with CFE and CFE 2003 Annual Report available at

PROJECT DESIGN DOCUMENT FORM (CDM PDD) - Version 03 CDM – Executive Board page 25
http://www.cfe.gob.mx/QuienesSomos/publicaciones/Paginas/Publicaciones.aspx.Value applied: 341.91 tCO2/GWh Justification of the choice of data or description of measurement methods and procedures actually applied :
According to the Tool to calculate the emission factor for an electricity system version 2, the sample of power plants have been calculated as Option b (the set of power capacity additions in the electricity system that comprise 20% of the system generation and that have been built most recently). In terms of vintage data Option 1 has been chosen. So the calculation of the Build Margin emission factor EFgrid,BM,y ex-ante based on the most recent information available on plants already built for sample group m at the time of PDD submission has been carried out.
Any comment:
Data / Parameter: EFgrid CM,y Data unit: tCO2/GWh Description: Combined margin CO2 emission factor for the proposed CDM project activity. Source of data used: Formula given by the Tool to calculate the emission factor for an electricity
system version 2 Value applied: 573.22 tCO2/GWh Justification of the choice of data or description of measurement methods and procedures actually applied :
ex-ante baseline emission factor
Any comment:
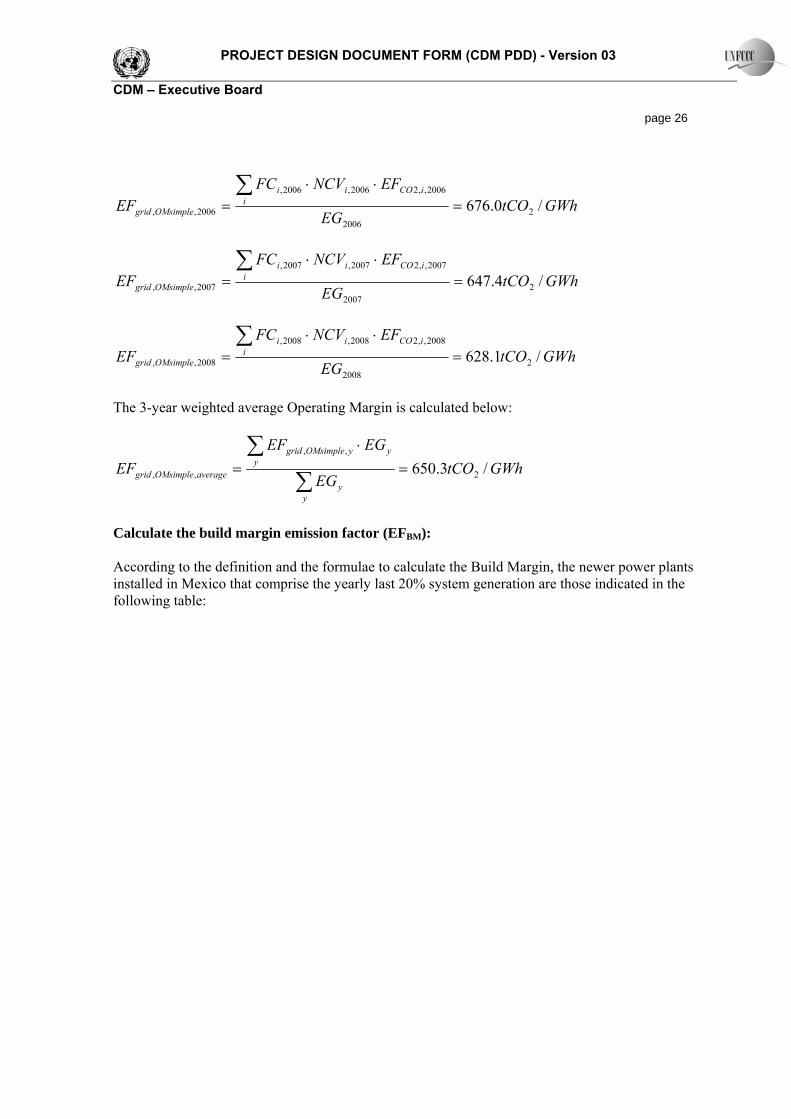
B.6.3. Ex-ante calculation of emission reductions: Calculate the operating margin emission factor (EFOM): Using the “Tool to calculate the emission factor for an electricity system”, data on the specific energy consumption by fuel type is directly taken from SENER’s documents “Prospectiva del sector eléctrico 2007-2016”, “Prospectiva del sector eléctrico 2008-2017”4 and private communications with SENER for 2008 data. Data on electricity generation, imports and exports, were taken from “Prospectiva del sector eléctrico 2009-2024” (table 17, page 94). As fuel consumption data, provided by the Mexican Government official publications, are given in TJ units, NCV factor is already included in the official published used value. The emission coefficient factor by fuel type is determined in tCO2/TJ, taken from the “2006 IPCC Guidelines for National Greenhouse Gas Inventories”, Volume 2 (Energy), Chapter 1 (Introduction), Table 1.4 (Default CO2 emission factors for combustion), Effective CO2 emission factor, 95% confidence interval, lower limit value. Them, appliyng the mentioned values, the next annual Operating Margin Emission Factors are obtained:
4 Available at http://www.energia.gob.mx/webSener/portal/publicaciones.html
PROJECT DESIGN DOCUMENT FORM (CDM PDD) - Version 03 CDM – Executive Board page 26
GWhtCOEG
EFNCVFCEF i
iCOii
OMsimplegrid /0.676 22006
2006,,22006,2006,
2006,, =⋅⋅
=∑
GWhtCOEG
EFNCVFCEF i
iCOii
OMsimplegrid /4.647 22007
2007,,22007,2007,
2007,, =⋅⋅
=∑
GWhtCOEG
EFNCVFCEF i
iCOii
OMsimplegrid /1.628 22008
2008,,22008,2008,
2008,, =⋅⋅
=∑
The 3-year weighted average Operating Margin is calculated below:
GWhtCOEG
EGEFEF
yy
yyyOMsimplegrid
averageOMsimplegrid /3.650 2
,,
,, =⋅
=∑
∑
Calculate the build margin emission factor (EFBM): According to the definition and the formulae to calculate the Build Margin, the newer power plants installed in Mexico that comprise the yearly last 20% system generation are those indicated in the following table:

PROJECT DESIGN DOCUMENT FORM (CDM PDD) - Version 03 CDM – Executive Board page 27
Name of the power plant Start of operation
Technology * Fuel
Installed capacity
(MW)Humeros 07/04/2008 GEO - 5.00 39.81 0.0% 40 0.02%Ciudad del Carmen 01/05/2008 GT Diesel 16.00 3.02 1.5% 3 0.02%Ciudad del Carmen 01/05/2008 GT Diesel 17.00 3.20 1.5% 3 0.02%Vallejo (LFC) 09/08/2007 GT Natural Gas 32.00 128.30 1.5% 126 0.08%Holbox 01/07/2007 IC Diesel 0.80 4.59 9.1% 4 0.08%Holbox 01/07/2007 IC Diesel 0.80 4.59 9.1% 4 0.08%Tamazunchale (PIE) 21/06/2007 CC Natural Gas 1,135.00 6,846.35 2.9% 6,648 3.17%El Cajón (Leonardo Rodríguez Alcaine) 01/06/2007 HY - 375.00 914.25 0.0% 914 3.60%
El Cajón (Leonardo Rodríguez Alcaine) 01/03/2007 HY - 375.00 914.25 0.0% 914 4.02%
Coyotepec (LFC) 30/01/2007 GT Natural Gas 32.00 128.30 1.5% 126 4.08%Coyotepec (LFC) 30/01/2007 GT Natural Gas 32.00 128.30 1.5% 126 4.14%Cuautitlán (LFC) 30/01/2007 GT Natural Gas 32.00 128.30 1.5% 126 4.20%Villa de las Flores (LFC) 04/01/2007 GT Natural Gas 32.00 128.30 1.5% 126 4.26%Victoria (LFC) 04/01/2007 GT Natural Gas 32.00 128.30 1.5% 126 4.31%Remedios (LFC) 04/01/2007 GT Natural Gas 32.00 128.30 1.5% 126 4.37%Ecatepec (LFC) 04/01/2007 GT Natural Gas 32.00 128.30 1.5% 126 4.43%Atenco (LFC) 2006 GT Natural Gas 32.00 96.60 1.5% 95 4.48%Chihuahua II (El Encino) 2006 CC Natural Gas 65.30 506.77 2.9% 492 4.71%Altamira V (PIE) 2006 CC Natural Gas 1,121.00 8,699.61 2.9% 8,447 8.63%Tuxpan V (PIE) 2006 CC Natural Gas 495.00 3,841.49 2.9% 3,730 10.36%Valladolid III (PIE) 2006 CC Natural Gas 525.00 4,074.31 2.9% 3,956 12.20%Hermosillo 2005 CC Natural Gas 93.30 675.72 2.9% 656 12.50%Ixtaczoquitlan 2005 HY - 1.60 12.15 0.0% 12 12.51%Yecora 2005 IC Diesel 0.70 4.05 9.1% 4 12.51%Botello 2005 HY - 9.00 68.37 0.0% 68 12.54%Rio Bravo IV PIE 2005 CC Natural Gas 500.00 3,621.23 2.9% 3,516 14.18%La Laguna II PIE 2005 CC Natural Gas 498.00 3,606.74 2.9% 3,502 15.80%Holbox 2005 IC Diesel 0.80 4.63 9.1% 4 15.81%El Sauz 2004 CC Natural Gas 128.00 494.25 2.9% 480 16.03%Tuxpan (Pdte. Adolfo López Mateos) 2004 GT Natural Gas 163.00 239.06 1.5% 235 16.14%San Lorenzo Potencia 2004 GT Natural Gas 266.00 390.11 1.5% 384 16.32%Rio Bravo III PIE 2004 CC Natural Gas 495.00 1,911.36 2.9% 1,856 17.18%Chicoasén (Manuel Moreno Torres) 2004 HY - 900.00 2,799.16 0.0% 2,799 18.48%
Transalta Campeche 2003 CC Natural Gas 252.00 1,787.00 2.9% 1,735 19.28%Naco Nogales 2003 CC Natural Gas 258.00 2,090.00 2.9% 2,029 20.23%
43,544.52NOTE:*Technology (CC:Combined Cycle; HY:Hydro; GT: Gas Turbine; IC: Internal Combustion; TH; Thermal, Simple Cycle)
Additions 2006
Additions 2005
Additions 2004
Additions 2003
Additions 2008
Additions 2007
Accumulated net generation
(%)
Power plants characteristics Gross generation
(GWh)
Self-use rate (%)
Net generation
(GWh)
Table 10. Latest generation of the newest power plants covering 20% of the system generation from 2008 backwards. Source: SENER, “Prospectiva del sector eléctrico 2009-2024”, “Prospectiva del sector eléctrico 2008-2017”, “Prospectiva del sector
eléctrico 2007-2016”, “Prospectiva del sector eléctrico 2006-2015”, “Prospectiva del sector eléctrico 2005-2014”, “Prospectiva del sector eléctrico 2004-2013”, Private communications with CFE and CFE 2003 Annual Report.
Data of “Name of the power plant”, “Start of operation”, “Technology” and “Installed capacity” have been obtained from SENER “Prospectiva del sector eléctrico 2009-2024” (table 18, page 96), “Prospectiva del sector eléctrico 2008-2017” (table 19, page 101), “Prospectiva del sector eléctrico 2007-2016” (table 19, page 77), “Prospectiva del sector eléctrico 2006-2015” (table 13, page 57), “Prospectiva del sector eléctrico 2005-2014” (table 14, page 51) and “Prospectiva del sector eléctrico 2005-2014” (table 9, page 44). Plants included in Baja California and Baja California Sur isolated grids have been excluded as well as CDM registered projects. Data for “Fuel” and “Gross generation” have been obtained from private communications with CFE. For the selection of the type of fuel for each plant, the most conservative option has been chosen when

PROJECT DESIGN DOCUMENT FORM (CDM PDD) - Version 03 CDM – Executive Board page 28 different fuels were being used. This is the case of Internal Combustion plants that use fuel oil and diesel, where disel with a more conservative emission factor has been chosen. Aslo, for 2003 additions, CFE 2003 Annual Report (available at http://www.cfe.gob.mx/QuienesSomos/publicaciones/Paginas/Publicaciones.aspx) have been used . Data for “Self-use rate” have been obtained from SENER “Prospectiva del sector eléctrico 2009-2024” (table 47, page 159). There, most conservative data given by technology have been chosen. The Build Margin emission factor for the year 2008 is determined as follows:
GWhtCOEG
EFEGEF
mym
ymELm
ym
BMgrid / 9.341 2,
,,,
2008,, =⋅
=∑
∑
Calculate the combined margin emission factor (EFCM): The baseline emission factor is calculated as the weighted average of the Operating Margin and the Building Margin emission factors. In the case of wind projects, the default weight for ωOM is 0.75 and for ωBM, 0.25 (owing to their intermittent and non-dispatchable nature). Thus, the obtained ex-ante baseline emission factor which applies for the first crediting period is:
GWhtCOwEFwEFEF BMyBMgridOMyOMgridyCMgrid /2.57325.0*9.34175.0*3.650 2,,,,,, =+=×+×=
Calculate the baseline emissions: Baseline emissions include only CO2 emissions from electricity generation in fossil fuel fired power plants that are displaced due to the project activity, and are calculated as follows:
yCMgridyPJy EFEGBE ,,, ×= Where: BEy = Baseline emissions in year y (tCO2/yr) EGPJ,y = Quantity of net electricity generation that is produced and fed into the grid as a result of the
implementation of the CDM project activity in year y (MWh/yr) EFgrid,CM,y = Combined margin CO2 emission factor for grid connected power generation in year y
calculated using the latest version of the “Tool to calculate the emission factor for an electricity system” (tCO2/MWh)
According to the ACM0002 version 12.1 methodology, the Piedra Larga Project is considered as a Greenfield renewable energy power plant, then:
yfacilityyPJ EGEG ,, = Where:
PROJECT DESIGN DOCUMENT FORM (CDM PDD) - Version 03 CDM – Executive Board page 29 EGfacility,y = Quantity of net electricity generation supplied by the project plant/unit to the grid in year y
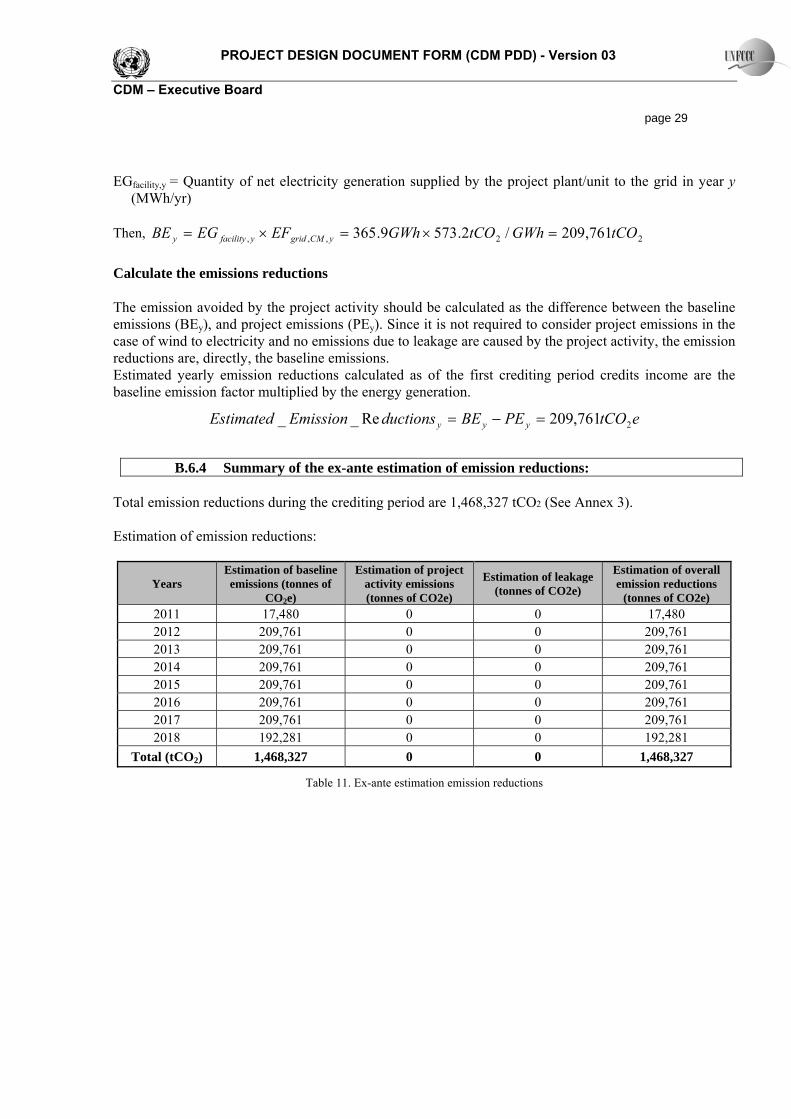
(MWh/yr) Then, 22,,, 761,209/2.5739.365 tCOGWhtCOGWhEFEGBE yCMgridyfacilityy =×=×=
Calculate the emissions reductions The emission avoided by the project activity should be calculated as the difference between the baseline emissions (BEy), and project emissions (PEy). Since it is not required to consider project emissions in the case of wind to electricity and no emissions due to leakage are caused by the project activity, the emission reductions are, directly, the baseline emissions. Estimated yearly emission reductions calculated as of the first crediting period credits income are the baseline emission factor multiplied by the energy generation.
etCOPEBEductionsEmissionEstimated yyy 2761,209Re__ =−=
B.6.4 Summary of the ex-ante estimation of emission reductions:
Total emission reductions during the crediting period are 1,468,327 tCO2 (See Annex 3). Estimation of emission reductions:
Years Estimation of baseline emissions (tonnes of
CO2e)
Estimation of project activity emissions (tonnes of CO2e)
Estimation of leakage (tonnes of CO2e)
Estimation of overall emission reductions
(tonnes of CO2e) 2011 17,480 0 0 17,480 2012 209,761 0 0 209,761 2013 209,761 0 0 209,761 2014 209,761 0 0 209,761 2015 209,761 0 0 209,761 2016 209,761 0 0 209,761 2017 209,761 0 0 209,761 2018 192,281 0 0 192,281
Total (tCO2) 1,468,327 0 0 1,468,327
Table 11. Ex-ante estimation emission reductions

PROJECT DESIGN DOCUMENT FORM (CDM PDD) - Version 03 CDM – Executive Board page 30
B.7. Application of the monitoring methodology and description of the monitoring plan:
B.7.1 Data and parameters monitored:
Data / Parameter: EGfacility, y
Data unit: MWh/year
Description: Quantity of net electricity generation supplied by the project plant/unit to the grid in year y
Source of data to be used: Project activity site. Estimation by Windtest of the annual energy production for the P02 case project.
Value of data applied for the purpose of calculating expected emission reductions in section B.5
365.93 GWh/year
Description of measurement methods and procedures to be applied:
Electricity meters
QA/QC procedures to be applied:
Cross check measurements results with record for sold electricity. Measurements will be done each 5 minutes by the power meters installed.
Any comment: Electricity supplied by the Piedra Larga Project to the national grid to be checked by sales receipts. Archived data kept during the crediting period and two years after by means of electronic and paper backup.

PROJECT DESIGN DOCUMENT FORM (CDM PDD) - Version 03 CDM – Executive Board page 31
B.7.2. Description of the monitoring plan: The project meets the applicability criteria under the monitoring methodology, ACM0002 Version 12.1 “Consolidated baseline methodology for grid-connected electricity generation from renewable sources”. This methodology is designed, among other things, for Power plants using wind resources. For this purpose and in accordance with monitoring methodology, the information that needs to be monitored shall include the electricity generation from the proposed project activity, measured from the control house on site. Data will be obtained from two CFE (Comisión Federal de Electricidad) power meters, one as the main meter and a back up one, located at the substation of La Ventosa belonging to CFE. The CFE will deliver to DEMEX OAXACA 1 detailed information about the hourly generated energy. Those aspects are regulated in the Interconnection for Renewable energy sources official model contract. To check the generation output, the electricity measured will be compared with the electricity bill to avoid possible discrepancies. Further details are discussed in Annex 4. For the emission reductions calculation, it will be used the following formula: Annual emission reduction = (project activity’s annual electricity dispatched to the grid) * (CO2 emission factor (ex-ante) of the estimated baseline) The project activity’s annual electricity dispatched to the grid (EGfacility,y) will be monitored in accordance to the monitoring requirements of the ACM0002 methodology, by continuous measurements by electricity meters and at least monthly recording. The DEMEX OAXACA 1 operation and maintenance department will be responsible for the check, authorize and forward monitoring data submitted by CFE, and for calculations and elaborate monitoring reports as well.
B.8. Date of completion of the application of the baseline study and monitoring methodology and the name of the responsible person(s)/entity(ies):
Date of completion: 30/11/2010 (November 30th 2010) The entity responsible for the application of the baseline and monitoring methodology:
Garrigues Medio Ambiente Consultoría Técnica y de Gestión Integrada del Medio Ambiente Hermosilla 3 28001 Madrid, SPAIN Tel: +34 91 514 52 00/ Fax: +34 91 399 24 08 [email protected]; [email protected]
This entity is not a project participant.

PROJECT DESIGN DOCUMENT FORM (CDM PDD) - Version 03 CDM – Executive Board page 32 SECTION C. Duration of the project activity / crediting period C.1. Duration of the project activity: C.1.1. Starting date of the project activity: 23/12/2009 (December 23rd 2009), date for the signature of the EPC contract which includes the turbines supply. C.1.2. Expected operational lifetime of the project activity: The project activity is expected to have a minimum lifetime of 21 years from its commissioning date. C.2. Choice of the crediting period and related information: C.2.1. Renewable crediting period: C.2.1.1. Starting date of the first crediting period: 01/12/2011 (December 1st 2011) or the day after the project has been registered, whichever the latest. C.2.1.2. Length of the first crediting period: The crediting period will be 7 years, renewable. C.2.2. Fixed crediting period: C.2.2.1. Starting date: Not applicable. C.2.2.2. Length: Not applicable.
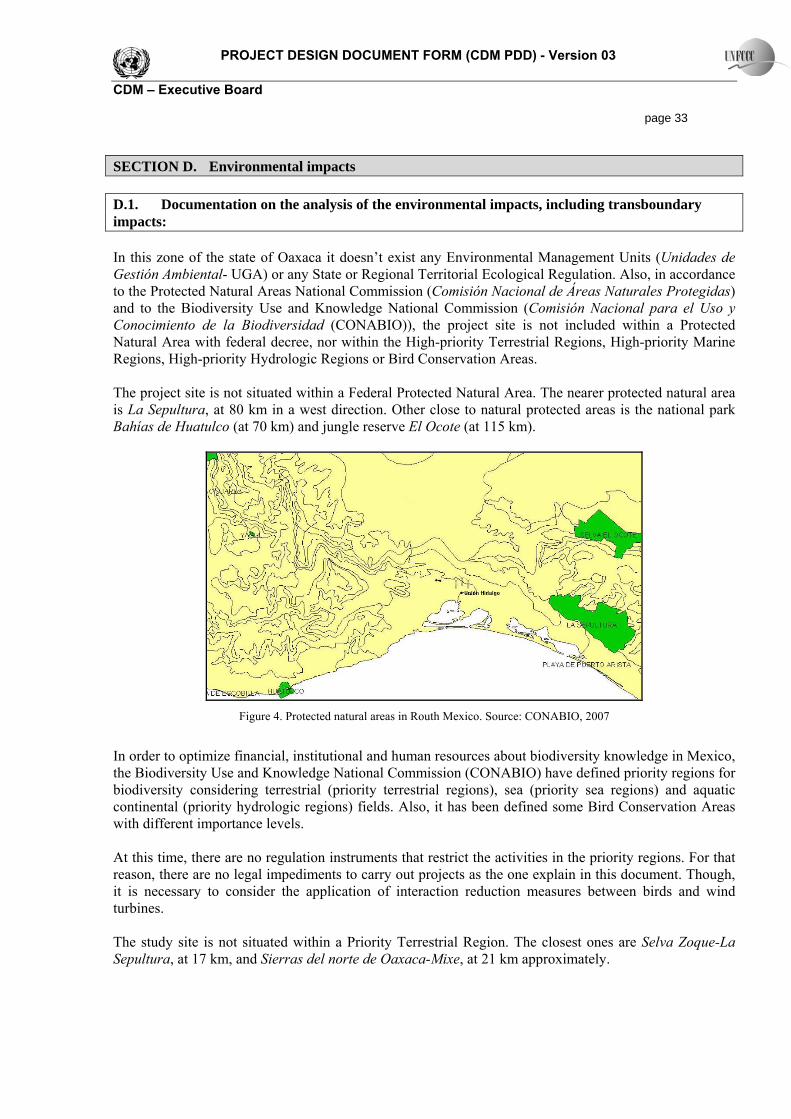
PROJECT DESIGN DOCUMENT FORM (CDM PDD) - Version 03 CDM – Executive Board page 33 SECTION D. Environmental impacts D.1. Documentation on the analysis of the environmental impacts, including transboundary impacts: In this zone of the state of Oaxaca it doesn’t exist any Environmental Management Units (Unidades de Gestión Ambiental- UGA) or any State or Regional Territorial Ecological Regulation. Also, in accordance to the Protected Natural Areas National Commission (Comisión Nacional de Áreas Naturales Protegidas) and to the Biodiversity Use and Knowledge National Commission (Comisión Nacional para el Uso y Conocimiento de la Biodiversidad (CONABIO)), the project site is not included within a Protected Natural Area with federal decree, nor within the High-priority Terrestrial Regions, High-priority Marine Regions, High-priority Hydrologic Regions or Bird Conservation Areas. The project site is not situated within a Federal Protected Natural Area. The nearer protected natural area is La Sepultura, at 80 km in a west direction. Other close to natural protected areas is the national park Bahías de Huatulco (at 70 km) and jungle reserve El Ocote (at 115 km).
Figure 4. Protected natural areas in Routh Mexico. Source: CONABIO, 2007
In order to optimize financial, institutional and human resources about biodiversity knowledge in Mexico, the Biodiversity Use and Knowledge National Commission (CONABIO) have defined priority regions for biodiversity considering terrestrial (priority terrestrial regions), sea (priority sea regions) and aquatic continental (priority hydrologic regions) fields. Also, it has been defined some Bird Conservation Areas with different importance levels. At this time, there are no regulation instruments that restrict the activities in the priority regions. For that reason, there are no legal impediments to carry out projects as the one explain in this document. Though, it is necessary to consider the application of interaction reduction measures between birds and wind turbines. The study site is not situated within a Priority Terrestrial Region. The closest ones are Selva Zoque-La Sepultura, at 17 km, and Sierras del norte de Oaxaca-Mixe, at 21 km approximately.
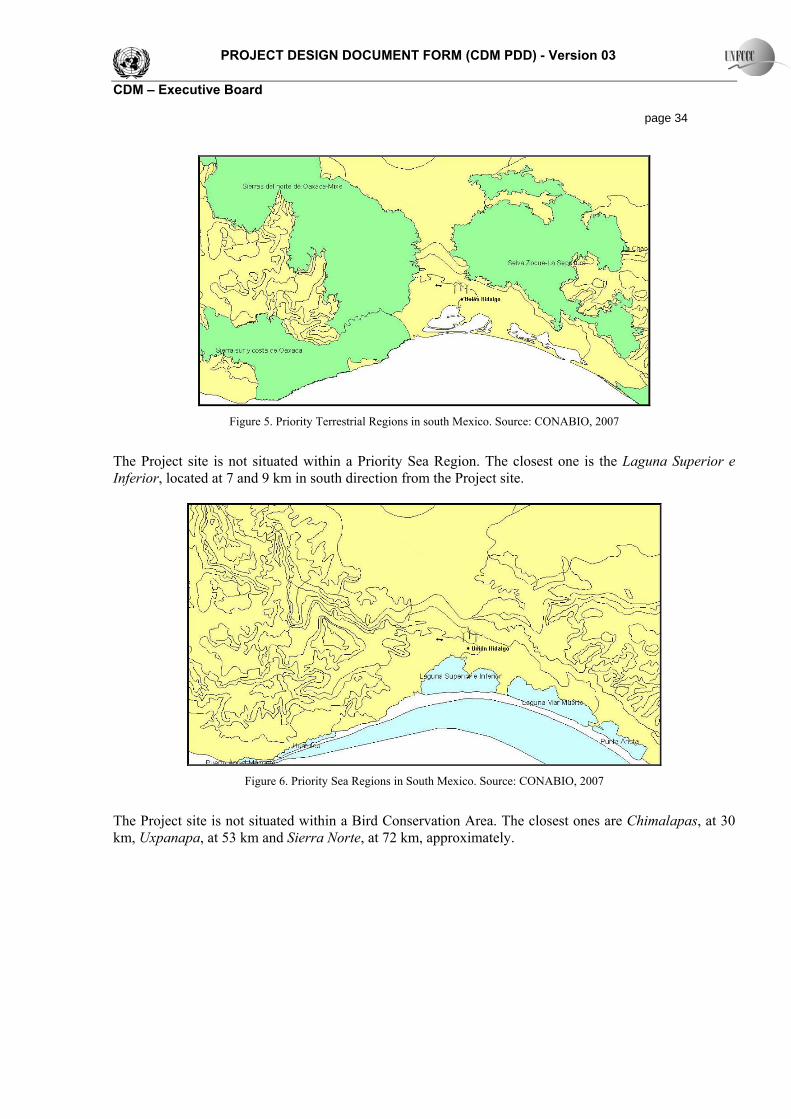
PROJECT DESIGN DOCUMENT FORM (CDM PDD) - Version 03 CDM – Executive Board page 34
Figure 5. Priority Terrestrial Regions in south Mexico. Source: CONABIO, 2007
The Project site is not situated within a Priority Sea Region. The closest one is the Laguna Superior e Inferior, located at 7 and 9 km in south direction from the Project site.
Figure 6. Priority Sea Regions in South Mexico. Source: CONABIO, 2007
The Project site is not situated within a Bird Conservation Area. The closest ones are Chimalapas, at 30 km, Uxpanapa, at 53 km and Sierra Norte, at 72 km, approximately.

PROJECT DESIGN DOCUMENT FORM (CDM PDD) - Version 03 CDM – Executive Board page 35
Figure 7. Bird Conservation Area in Mexico. Source: CONABIO, 2007
A study about the monitoring of birds and bats for the whole project territory (including phase I and phase II areas) was delivered in March 2010 and approved by the responsible organization in Agust 2010. D.2. If environmental impacts are considered significant by the project participants or the host Party, please provide conclusions and all references to support documentation of an environmental impact assessment undertaken in accordance with the procedures as required by the host Party: DEMEX OAXACA 1 will elaborate an Environmental Management Plan which will incorporate all the proposed prevention, protection, control, mitigation, restoration and compensation measures, and the determining statements in the decision issued by SEMARNAT. The Plan will specify procedures and activities that will be applied, and the expected time that their implementation would require. A noise level evaluation will be carried out in accordance to the MIA requirements, and the possible negative effects will be analysed. The environmental protection actions to carry out are listed next, by phase: Preparation and construction stage
• Compensate for vegetation lost and its environmental services like the soil retention, flora and fauna habitats, or its participation in the carbon capture through compensation actions in the affected areas (reforestation, erosion caused by the path control measures, etc.)
• Presentation of the technical report related to the conditions of the area where the wind farm will be built.
• Presentation of an existing vertebrates study or sampling. • Measures for rescue and conservation of the local species. • Local and regional annual bird study to identify possible nests, food supply or rest locations for
birds. If necessary, establish new prevention and protection measures.

PROJECT DESIGN DOCUMENT FORM (CDM PDD) - Version 03 CDM – Executive Board page 36
• At the end of the construction stage, present an affectation diagnosis report where the final environmental conditions will be described.
Operation and maintenance stage
• DEMEX OAXACA 1 will elaborate an environmental quality monitoring program (Programa de Seguimiento de la Calidad Ambiental, PSCA) through an environmental surveillance program (Programa de Vigilancia Ambiental, PVA), to establish control measures that will be executed. An Internal Contingency Plan in order to pay attention to any eventuality foreseeing the nearby communities and environment protection.
Abandonment of the site stage
• DEMEX OAXACA 1 will notify the corresponding authority of the site abandonment with three months beforehand. For this, it will be presented, for its approbation, the set of activities of restoration, retirement and/or alternative use of project area; also, the infrastructure required for the construction of the plant will be removed and dismantled.
SECTION E. Stakeholders’ comments E.1. Brief description how comments by local stakeholders have been invited and compiled: This chapter describes the stakeholders that were informed about the Piedra Larga Fase I Project and the process followed. Main agents selected by their concern in the Project have been informed and invited to take part in the process. In order to guarantee the right to social participation and allow the involvement of the general public in the evaluation of the Project, SEMARNAT (the Secretary of the Environment and Natural Resources or Secretaría de Medio Ambiente y Recursos Naturales) made the Piedra Larga Project’s MIA available for public scrutiny in its Documental Center (Centro Documental) located in Mexico DF. No complaints, inquiries, or public declarations were received from citizens, government or non government organizations. SEMARNAT evaluated the project’s MIA and made it available to all other environmental authorities involved in the evaluation of projects that might have an impact on the environment. All comments received by SEMARNAT were included in the MIA approval document. A copy of the MIA approval was also sent to the relevant environmental federal and Oaxaca State authorities. Also, Project developers have been in touch with CRE and CFE in order to obtain the necessary permits and/or sign agreements. DEMEX OAXACA 1 carried out some telephone conversations with stakeholders Lucrecia Martín (COMEGEI) and Akihito Escobar López (CFE) in December 2009, for their relevance in the development of the Project. Moreover, DEMEX OAXACA 1 carried out other stakeholder communications such as information talks and drawing competition about wind energy and the project in different schools of Unión Hidalgo during

PROJECT DESIGN DOCUMENT FORM (CDM PDD) - Version 03 CDM – Executive Board page 37 2008 and 2009, as well as a broad cast interview (98.3 Unión Hidalgo, Oaxaca) in 2008 informing about the project and Wind Farm Plants. On the order hand, local land owners were visited and consulted about the Project. Then, meetings were carried out during 2008 and 2009 to explain them the characteristics of the project and to answer to their questions before signing the land renting contracts. Evidences of those interactions are the list of assistants to these meeting and several asigned letters confirming they were correctly informed about the project and before signing the contract. Land owners gave their support to its development by signing a land renting agreement. After that, land owners have regularly been informed by DEMEX OAXACA 1 about the preliminary necessary studies to be carried out for the project. As an evidence, letters regarding the need of carrying out environmental studies within their properties were sent. DEMEX OAXACA 1 is in permanent contact with those local stakeholders to provide additional information of the Project status and answer comments and inquiries that might come up. A permanent and direct contact has also been maintained with local authorities as it can be checked in the letters or calls for meetings sent to the authotities of Union Hidalgo or other relevant authorities. Received comments and impressions are described in E.2. E.2. Summary of the comments received: All permits and authorizations required for the construction of the project have been obtained from CFE, CRE and other local authotities. No complaints or negative comments have been received from them Comments received by consulted authorities stakeholders before the publication of the PDD in UNFCCC web page, are summarized next:
- Lucrecia Martín, Asistant manager of COMEGEI (Mexican committee for GHG Reduction and capture Projects or Comité Mexicano para Proyectos de Reducción de Emisiones y de Captura de Gases de Efecto Invernadero): Lucrecia Martín showed her approval to this kind of projects.
- Ing. Akihito Escobar López, Manager Head of the Federal Commission of Electricity’s
Engineering of Distribution Department (CFE, Comisión Federal de Electricidad): Akihito Escobar López referred to the land owners that will receive money for the rental of the land during a long period. He expressed his wish of promoting the consumption of green energy in the local area, since the energy is send to the national grid and is not used by any of the industries of the zone.
In relation to the land owners, as the Piedra Larga Fase I wind farm is not situated in any “ejido”, collective agricultural used rural properties, but is located in different small owners’lands, no critics have been received so far and all the involved owners have sign the renting agreement. Stakeholders have given their approval and support to the development of the project which is compatible with the sustainable development of the country and achieving reductions on greenhouse gases emissions.

PROJECT DESIGN DOCUMENT FORM (CDM PDD) - Version 03 CDM – Executive Board page 38 E.3. Report on how due account was taken of any comments received: Several environmental requirements were included in the Environmental Approval document to be taken into account by project developer. DEMEX OAXACA 1 has been carrying out all of them as it is said in the SEMARNAT´s letter of extension of the MIA´s approval dated on 28/Jul/2010 and delivered on 08/Sept/2010.
Besides, no negative comments have been received on the project so far. Nevertheless, the Project developer will continue considering all suggestions that could be received and informing land owners regularly on the progress of the Project.

PROJECT DESIGN DOCUMENT FORM (CDM PDD) - Version 03 CDM – Executive Board page 39 Annex 1
CONTACT INFORMATION ON PARTICIPANTS IN THE PROJECT ACTIVITY
Organization: Desarrollos Eólicos Mexicanos de Oaxaca 1 S.A. de C.V. (DEMEX OAXACA 1) Street/P.O.Box: Emerson No. 243 piso 4, Col. Chapultepec de los Morales, Del. Miguel
Hidalgo Building: - City: México DF State/Region: Mexico Postcode/ZIP: 11570 Country: Mexico Telephone: +52 55 5280 2294 FAX: +52 55 5280 8703 E-Mail: - URL: - Represented by: Title: - Salutation: Mr. Last name: Ballester Surroca Middle name: - First name: Fernando Department: - Mobile: +52 1 55 4342 7332 Direct FAX: - Direct tel: - Personal e-mail: [email protected]
Organization: Desarrollos Eólicos Mexicanos de Oaxaca 1 S.A. de C.V. (DEMEX OAXACA 1) Street/P.O.Box: María de Molina 54, 9º Building: - City: Madrid State/Region: Madrid Postcode/ZIP: 28006 Country: Spain Telephone: (+34) 91 590 40 70 FAX: (+34) 91 564 63 23 E-Mail: - URL: - Represented by: Title: - Salutation: Mr. Last name: Galobart Middle name: - First name: Jaime Department: -

PROJECT DESIGN DOCUMENT FORM (CDM PDD) - Version 03 CDM – Executive Board page 40
Mobile: Direct FAX: - Direct tel: - Personal e-mail: [email protected]

PROJECT DESIGN DOCUMENT FORM (CDM PDD) - Version 03 CDM – Executive Board page 41
Annex 2
INFORMATION REGARDING PUBLIC FUNDING
NA
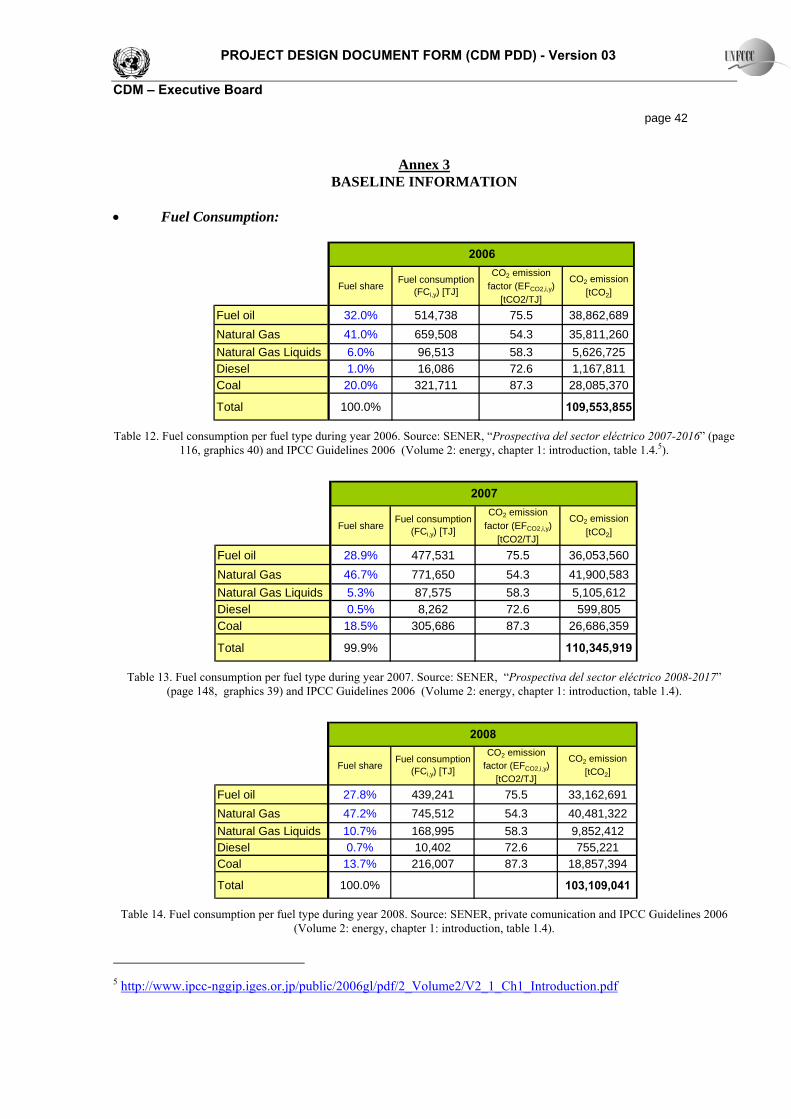
PROJECT DESIGN DOCUMENT FORM (CDM PDD) - Version 03 CDM – Executive Board page 42
Annex 3 BASELINE INFORMATION
• Fuel Consumption:
Fuel shareFuel consumption
(FCi,y) [TJ]
CO2 emission factor (EFCO2,i,y)
[tCO2/TJ]
CO2 emission [tCO2]
Fuel oil 32.0% 514,738 75.5 38,862,689Natural Gas 41.0% 659,508 54.3 35,811,260Natural Gas Liquids 6.0% 96,513 58.3 5,626,725Diesel 1.0% 16,086 72.6 1,167,811Coal 20.0% 321,711 87.3 28,085,370
Total 100.0% 109,553,855
2006
Table 12. Fuel consumption per fuel type during year 2006. Source: SENER, “Prospectiva del sector eléctrico 2007-2016” (page
116, graphics 40) and IPCC Guidelines 2006 (Volume 2: energy, chapter 1: introduction, table 1.4.5).
Fuel shareFuel consumption
(FCi,y) [TJ]
CO2 emission factor (EFCO2,i,y)
[tCO2/TJ]
CO2 emission [tCO2]
Fuel oil 28.9% 477,531 75.5 36,053,560Natural Gas 46.7% 771,650 54.3 41,900,583Natural Gas Liquids 5.3% 87,575 58.3 5,105,612Diesel 0.5% 8,262 72.6 599,805Coal 18.5% 305,686 87.3 26,686,359
Total 99.9% 110,345,919
2007
Table 13. Fuel consumption per fuel type during year 2007. Source: SENER, “Prospectiva del sector eléctrico 2008-2017”
(page 148, graphics 39) and IPCC Guidelines 2006 (Volume 2: energy, chapter 1: introduction, table 1.4).
Fuel shareFuel consumption
(FCi,y) [TJ]
CO2 emission factor (EFCO2,i,y)
[tCO2/TJ]
CO2 emission [tCO2]
Fuel oil 27.8% 439,241 75.5 33,162,691Natural Gas 47.2% 745,512 54.3 40,481,322Natural Gas Liquids 10.7% 168,995 58.3 9,852,412Diesel 0.7% 10,402 72.6 755,221Coal 13.7% 216,007 87.3 18,857,394
Total 100.0% 103,109,041
2008
Table 14. Fuel consumption per fuel type during year 2008. Source: SENER, private comunication and IPCC Guidelines 2006
(Volume 2: energy, chapter 1: introduction, table 1.4).
5 http://www.ipcc-nggip.iges.or.jp/public/2006gl/pdf/2_Volume2/V2_1_Ch1_Introduction.pdf

PROJECT DESIGN DOCUMENT FORM (CDM PDD) - Version 03 CDM – Executive Board page 43 • Generation by sources:
2004 2005 2006 2007 2008 % of total generation
Exports (GWh) 236 254 227 240 255 0.12%
Imports (GWh) 8 12 9 11 11 0.01%
Net Exchange (GWh) 228 242 218 229 244 0.11% Table 15. Electricity imports and exports. Source: SENER, “Prospectiva del sector eléctrico 2009-2024” (table 17, page 94)
2004 2005 2006 2007 2008Fuel-oil 31.8% 29.7% 23.1% 21.3% 18.37%
Combined Cycle 34.6% 33.5% 40.5% 44.2% 45.72%
Renewable + Hydro 15.2% 15.9% 16.5% 14.9% 19.59%
Coal 8.6% 8.4% 8.0% 7.8% 7.54%
Dual (coal + fuel oil) 3.8% 6.5% 6.2% 5.8% 2.92%
Turbogas 1.3% 0.6% 0.7% 1.1% 1.19%
Nuclear 4.4% 4.9% 4.8% 4.5% 4.16%
Diesel 0.3% 0.4% 0.4% 0.5% 0.52%National Public Service generation (GWh) 208,634 218,971 225,079 232,552 235,871
Net generation (GWh) 190,258 199,167 205,878 211,454 215,276
Mexico energy mix
Table 16. Generation by sources during years 2004 to 2008. Source: SENER, “Prospectiva del sector eléctrico 2009-2024”
(table 21, page 110).
% 2004 2005 2006 2007 2008Renewable + Hydro + Nuclear 19.6% 20.9% 21.3% 19.4% 23.7%Others 80.4% 79.1% 78.7% 80.6% 76.3%
GWh 2004 2005 2006 2007 2008Renewable + Hydro + Nuclear 37,255 41,585 43,815 41,022 51,117Others 153,003 157,582 162,063 170,432 164,159Total 190,258 199,167 205,878 211,454 215,276
Table 17. Generation by sources in % and GWh, during years 2004 to 2008. Source: SENER, “Prospectiva del sector eléctrico 2009-2024” (table 21, page 110).
According to these tables, the total percentage of low-cost/must-run generation sources (renewable, hydro and nuclear) was 19.6%, 20.9%, 21.3%, 19.4% and 23.7% in 2004 to 2008, respectively.
2004 2005 2006 2007 2008Net generation (GWh), excluding low cost/must run, including imports 153,011 157,594 162,072 170,443 164,170
Table 18. Net generation for non low cost/ must run generation sources including imports of electricity as one power plant.
Total fuel consumption in the years 2006, 2007 and 2008 is 1,608,555 TJ; 1,652,355 TJ and 1,580,158 TJ, respectively:

PROJECT DESIGN DOCUMENT FORM (CDM PDD) - Version 03 CDM – Executive Board page 44
Fuel shareFuel
consumption (FCi,y) [TJ]
CO2 emission factor (EFCO2,i,y)
[tCO2/TJ]
CO2 emission [tCO2]
Fuel oil 32.0% 514,738 75.5 38,862,689Natural Gas 41.0% 659,508 54.3 35,811,260Natural Gas Liquids 6.0% 96,513 58.3 5,626,725Diesel 1.0% 16,086 72.6 1,167,811Coal 20.0% 321,711 87.3 28,085,370Total 100.0% 109,553,855
FCy [TJ/day]FCy [TJ/year]
EFOM
4,4071,608,555
676.0
2006
Table 19: Fuel consumption per fuel type in 2006. Source: SENER, “Prospectiva del sector eléctrico 2007-2016” (page 116,
graphics 40) and IPCC Guidelines 2006 (Volume 2: energy, chapter 1: introduction, table 1.4).
Fuel shareFuel
consumption (FCi,y) [TJ]
CO2 emission factor (EFCO2,i,y)
[tCO2/TJ]
CO2 emission [tCO2]
Fuel oil 28.9% 477,531 75.5 36,053,560Natural Gas 46.7% 771,650 54.3 41,900,583Natural Gas Liquids 5.3% 87,575 58.3 5,105,612Diesel 0.5% 8,262 72.6 599,805Coal 18.5% 305,686 87.3 26,686,359Total 99.9% 110,345,919
FCy [TJ/day]FCy [TJ/year]
EFOM
4,5271,652,355
647.4
2007
Table 20: Fuel consumption per fuel type. Source: “Prospectiva del sector eléctrico 2008-2017” (page 148, graphics 39) and
IPCC Guidelines 2006 (Volume 2: energy, chapter 1: introduction, table 1.4).
Fuel shareFuel
consumption (FCi,y) [TJ]
CO2 emission factor (EFCO2,i,y)
[tCO2/TJ]
CO2 emission [tCO2]
Fuel oil 27.8% 439,241 75.5 33,162,691Natural Gas 47.2% 745,512 54.3 40,481,322Natural Gas Liquids 10.7% 168,995 58.3 9,852,412Diesel 0.7% 10,402 72.6 755,221Coal 13.7% 216,007 87.3 18,857,394Total 100.0% 103,109,041
FCy [TJ/day]FCy [TJ/year]
EFOM
4,3291,580,158
2008
628.1 Table 21: Fuel consumption per fuel type. Source: SENER, private comunication and IPCC Guidelines 2006 (Volume 2: energy,
chapter 1: introduction, table 1.4)

PROJECT DESIGN DOCUMENT FORM (CDM PDD) - Version 03 CDM – Executive Board page 45 • Operating Margin:
y
miyiCOyiyi
ysimpleOMgrid EG
EFNCVFCEF
∑ ⋅⋅= ,
,,2,,
,,,
Therefore:
0.676072,162
885,553,109 22006,,, ==
GWhtCOEF simpleOMgrid tCO2/GWh
4.647443,170
919,345,110 22007,,, ==
GWhtCO
EF simpleOMgrid tCO2/GWh
1.628 164,170
041,109,103 22008,,, ==
GWhtCO
EF simpleOMgrid tCO2/GWh
3.650)(,, =− anteexEF simpleOMgrid tCO2/GWh Electricity imports are included in denominator of OM factor calculation. • Build Margin: The factor ymELEF ,, for each power plant has been obtained from:
ym
yimCOymEL
EFEF
,
,,,2,,
6.3η
⋅=
Then, multiplying by the corresponding electric generation, and dividing by the generation sum, the Build Margin is obtained.
9.341,
,,,
,, =⋅
=∑
∑
mym
ymELm
ym
yBMgrid EG
EFEGEF tCO2/GWh
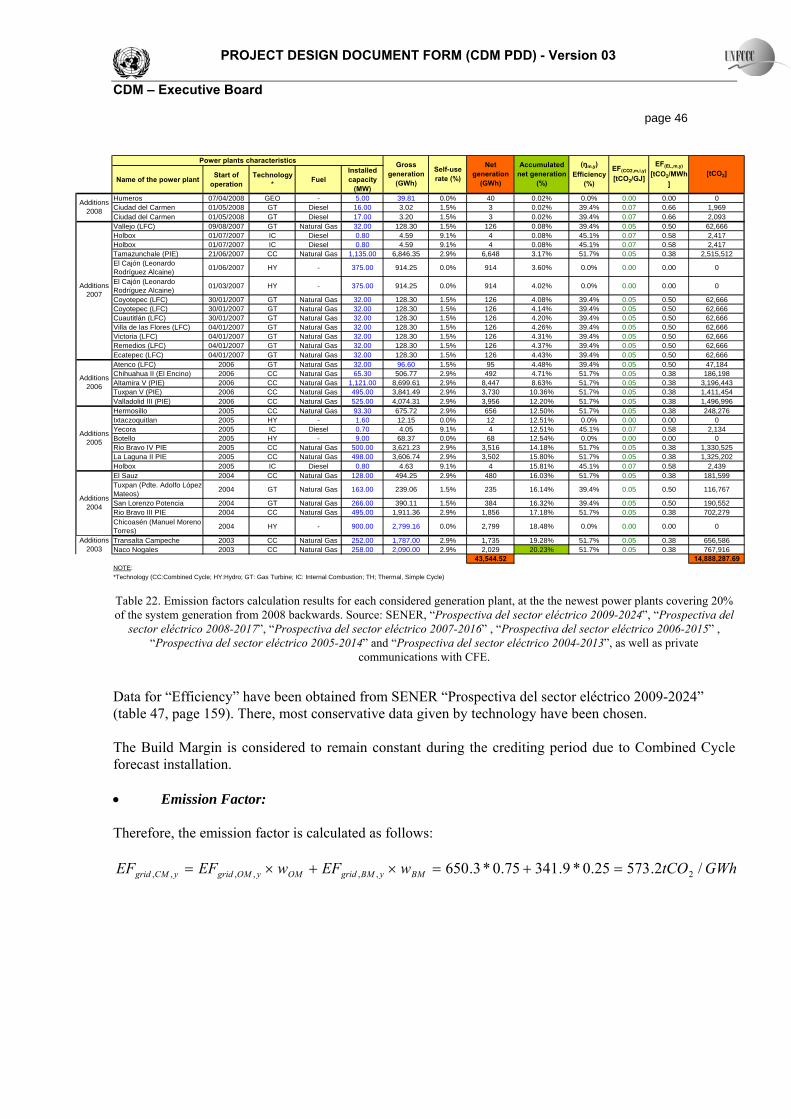
PROJECT DESIGN DOCUMENT FORM (CDM PDD) - Version 03 CDM – Executive Board page 46
Name of the power plant Start of operation
Technology * Fuel
Installed capacity
(MW)Humeros 07/04/2008 GEO - 5.00 39.81 0.0% 40 0.02% 0.0% 0.00 0.00 0Ciudad del Carmen 01/05/2008 GT Diesel 16.00 3.02 1.5% 3 0.02% 39.4% 0.07 0.66 1,969Ciudad del Carmen 01/05/2008 GT Diesel 17.00 3.20 1.5% 3 0.02% 39.4% 0.07 0.66 2,093Vallejo (LFC) 09/08/2007 GT Natural Gas 32.00 128.30 1.5% 126 0.08% 39.4% 0.05 0.50 62,666Holbox 01/07/2007 IC Diesel 0.80 4.59 9.1% 4 0.08% 45.1% 0.07 0.58 2,417Holbox 01/07/2007 IC Diesel 0.80 4.59 9.1% 4 0.08% 45.1% 0.07 0.58 2,417Tamazunchale (PIE) 21/06/2007 CC Natural Gas 1,135.00 6,846.35 2.9% 6,648 3.17% 51.7% 0.05 0.38 2,515,512El Cajón (Leonardo Rodríguez Alcaine) 01/06/2007 HY - 375.00 914.25 0.0% 914 3.60% 0.0% 0.00 0.00 0
El Cajón (Leonardo Rodríguez Alcaine) 01/03/2007 HY - 375.00 914.25 0.0% 914 4.02% 0.0% 0.00 0.00 0
Coyotepec (LFC) 30/01/2007 GT Natural Gas 32.00 128.30 1.5% 126 4.08% 39.4% 0.05 0.50 62,666Coyotepec (LFC) 30/01/2007 GT Natural Gas 32.00 128.30 1.5% 126 4.14% 39.4% 0.05 0.50 62,666Cuautitlán (LFC) 30/01/2007 GT Natural Gas 32.00 128.30 1.5% 126 4.20% 39.4% 0.05 0.50 62,666Villa de las Flores (LFC) 04/01/2007 GT Natural Gas 32.00 128.30 1.5% 126 4.26% 39.4% 0.05 0.50 62,666Victoria (LFC) 04/01/2007 GT Natural Gas 32.00 128.30 1.5% 126 4.31% 39.4% 0.05 0.50 62,666Remedios (LFC) 04/01/2007 GT Natural Gas 32.00 128.30 1.5% 126 4.37% 39.4% 0.05 0.50 62,666Ecatepec (LFC) 04/01/2007 GT Natural Gas 32.00 128.30 1.5% 126 4.43% 39.4% 0.05 0.50 62,666Atenco (LFC) 2006 GT Natural Gas 32.00 96.60 1.5% 95 4.48% 39.4% 0.05 0.50 47,184Chihuahua II (El Encino) 2006 CC Natural Gas 65.30 506.77 2.9% 492 4.71% 51.7% 0.05 0.38 186,198Altamira V (PIE) 2006 CC Natural Gas 1,121.00 8,699.61 2.9% 8,447 8.63% 51.7% 0.05 0.38 3,196,443Tuxpan V (PIE) 2006 CC Natural Gas 495.00 3,841.49 2.9% 3,730 10.36% 51.7% 0.05 0.38 1,411,454Valladolid III (PIE) 2006 CC Natural Gas 525.00 4,074.31 2.9% 3,956 12.20% 51.7% 0.05 0.38 1,496,996Hermosillo 2005 CC Natural Gas 93.30 675.72 2.9% 656 12.50% 51.7% 0.05 0.38 248,276Ixtaczoquitlan 2005 HY - 1.60 12.15 0.0% 12 12.51% 0.0% 0.00 0.00 0Yecora 2005 IC Diesel 0.70 4.05 9.1% 4 12.51% 45.1% 0.07 0.58 2,134Botello 2005 HY - 9.00 68.37 0.0% 68 12.54% 0.0% 0.00 0.00 0Rio Bravo IV PIE 2005 CC Natural Gas 500.00 3,621.23 2.9% 3,516 14.18% 51.7% 0.05 0.38 1,330,525La Laguna II PIE 2005 CC Natural Gas 498.00 3,606.74 2.9% 3,502 15.80% 51.7% 0.05 0.38 1,325,202Holbox 2005 IC Diesel 0.80 4.63 9.1% 4 15.81% 45.1% 0.07 0.58 2,439El Sauz 2004 CC Natural Gas 128.00 494.25 2.9% 480 16.03% 51.7% 0.05 0.38 181,599Tuxpan (Pdte. Adolfo López Mateos) 2004 GT Natural Gas 163.00 239.06 1.5% 235 16.14% 39.4% 0.05 0.50 116,767
San Lorenzo Potencia 2004 GT Natural Gas 266.00 390.11 1.5% 384 16.32% 39.4% 0.05 0.50 190,552Rio Bravo III PIE 2004 CC Natural Gas 495.00 1,911.36 2.9% 1,856 17.18% 51.7% 0.05 0.38 702,279Chicoasén (Manuel Moreno Torres) 2004 HY - 900.00 2,799.16 0.0% 2,799 18.48% 0.0% 0.00 0.00 0
Transalta Campeche 2003 CC Natural Gas 252.00 1,787.00 2.9% 1,735 19.28% 51.7% 0.05 0.38 656,586Naco Nogales 2003 CC Natural Gas 258.00 2,090.00 2.9% 2,029 20.23% 51.7% 0.05 0.38 767,916
43,544.52 14,888,287.69NOTE:*Technology (CC:Combined Cycle; HY:Hydro; GT: Gas Turbine; IC: Internal Combustion; TH; Thermal, Simple Cycle)
Additions 2006
Additions 2005
Additions 2004
Additions 2003
EF(EL,m,y)
[tCO2/MWh]
[tCO2]
Additions 2008
Additions 2007
Accumulated net generation
(%)
(ŋm,y)Efficiency
(%)
EF(CO2,m,i,y)
[tCO2/GJ]
Power plants characteristics Gross generation
(GWh)
Self-use rate (%)
Net generation
(GWh)
Table 22. Emission factors calculation results for each considered generation plant, at the the newest power plants covering 20% of the system generation from 2008 backwards. Source: SENER, “Prospectiva del sector eléctrico 2009-2024”, “Prospectiva del
sector eléctrico 2008-2017”, “Prospectiva del sector eléctrico 2007-2016” , “Prospectiva del sector eléctrico 2006-2015” , “Prospectiva del sector eléctrico 2005-2014” and “Prospectiva del sector eléctrico 2004-2013”, as well as private
communications with CFE.
Data for “Efficiency” have been obtained from SENER “Prospectiva del sector eléctrico 2009-2024” (table 47, page 159). There, most conservative data given by technology have been chosen. The Build Margin is considered to remain constant during the crediting period due to Combined Cycle forecast installation. • Emission Factor: Therefore, the emission factor is calculated as follows:
GWhtCOwEFwEFEF BMyBMgridOMyOMgridyCMgrid /2.57325.0*9.34175.0*3.650 2,,,,,, =+=×+×=

PROJECT DESIGN DOCUMENT FORM (CDM PDD) - Version 03 CDM – Executive Board page 47
2011 2012 2013 2014 2015 2016 2017 2018Emission factor [tCO2/GWh] 573.22 573.22 573.22 573.22 573.22 573.22 573.22 573.22
Annual generation [GWh] 30.49 365.93 365.93 365.93 365.93 365.93 365.93 335.44Emission reductions [tCO2] 17,480.00 209,761.00 209,761.00 209,761.00 209,761.00 209,761.00 209,761.00 192,281.00Total accumulative reductions (tCO2)
17,480 227,241 437,002 646,763 856,524 1,066,285 1,276,046 1,468,327
Table 23. Emission reductions estimations
Total cumulative reductions in for first crediting period will be: 1,468,327 tCO2.

PROJECT DESIGN DOCUMENT FORM (CDM PDD) - Version 03 CDM – Executive Board page 48
Annex 4
MONITORING INFORMATION A. Measuring and calculation procedure
1. Measuring
The CFE Department will obtain measures of the readings from the meters installed in their own substation of La Ventosa, where the monitoring point is situated. The measurements obtained each 5 minutes will be registered and stored electronically and will be later consolidated in a monthly report that will be received by DEMEX OAXACA I personnel. Personnel of the Operation Department of DEMEX OAXACA 1 are trained to perform this task due to these are wellknown technologies. If new personnel are hired, they will have to follow a training program and will be formed in the skills to carry out the Monitoring Plan
2. Calculation of electricity generation to be monitored:
LGEG y −= , where: EGy: Electricity generation data measured at La Ventosa substation (monitoring point). G: Generation of electricity by the project activity. L: Total transmission losses until the monitoring point.
Since measurement is carried out at the monitoring point, transmission losses are already included in the electricity generation. Thus L = 0. CFE will carry out the measurement control of the monitored data and will solve detected errors produced in the power meters following their own procedures. DEMEX OAXACA I will receive the collected data monthly summary and will then calculate the annual emission reductions as follows:
Piedra Larga Wind Farm Emission Reductions Year:
A B C Annual generation
(GWh) (source CFE) Emission factor ex-ante
(tCO2/GWh) Emission reductions
(tCO2) A B A*B
B. Quality control (QC) procedures and quality assurance procedures (QA) 1. Monitoring equipment
1.1. Monitoring equipment characteristics have been defined by CFE in the interconexion contract. 1.2. Monitoring equipment shall be authorized through a certificated formal process.

PROJECT DESIGN DOCUMENT FORM (CDM PDD) - Version 03 CDM – Executive Board page 49
1.3. After set up monitoring equipment shall be calibrated and checked periodically, in less than one year intervals, by CFE for accuracy.
2. Monitoring of amount of electricity.
2.1. The amount of electricity transmitted to the grid shall be measured automatically by the established equipment (main and back up meters).
2.2. The measured amount of electricity shall be collected daily, weekly, and monthly and shall be archived by CFE. Then, the collected data will be delivered monthly to DEMEX OAXACA I.
2.3. The collected variables in article 2.1. will be checked with the energy bill, as a quality control system, almost once each three months. This quality control activity will be carried out by Demex Oaxaca 1 or through a subcontracted company. An engineer belonging to the company responsible for the quality control will sign the corresponding report.
3. Corrective and preventive actions:
3.1. If the two variables compared in article 2.3. are different, the operation condition of electricity meters and other equipment shall be examined. In case measurements are improperly operated by the monitoring equipment, internal investigation and correction shall follow. Meanwhile, data will be collected from the back up meter.
3.2. Corrective and preventive actions will be properly documented.
4. Internal audit procedure:
4.1. The Manager of the Operation Department is responsible of the elaboration and execution of the internal audit.
4.2. Internal audit has the purpose of determining if the Monitoring Plan is being properly documented as well as identify any deficiency, disagreement o deviation, providing the application of corrective and preventive actions.
4.3. Internal audit will be implemented at least once per year.
- - - -