pdf hosted at the radboud repository of the radboud ... · introduction and outline of the thesis...
TRANSCRIPT

PDF hosted at the Radboud Repository of the Radboud University
Nijmegen
The following full text is a publisher's version.
For additional information about this publication click this link.
http://hdl.handle.net/2066/157750
Please be advised that this information was generated on 2017-12-05 and may be subject to
change.
UITNODIGING
JU
DIT
H C
LUIT
MA
NS
JUDITH CLUITMANS
Voor het bijwonen van de openbare verdediging van
mijn proefschrift
RED BLOOD CELL HOMEOSTASIS
Molecular mechanisms regulating morphology and function
Op donderdag 2 juni 2016
om 10.30u precies in de Aula van de Radboud Universiteit, Comeniuslaan 2 te Nijmegen.
Aansluitend zal ook mijn man zijn proefschrift getiteld
Transcranial magnetic stimulation: measuring and modeling in health
and disease verdedigen.
U bent van harte welkom op onze gezamenlijke receptie
om 14.00u in de Aula.
Judith CluitmansJavastraat 81
6524 LX [email protected]
ParanimfenRike Wallbrecher
[email protected] Janssen
Judith_ordernr21297_cover_dubbelzijdig-FC_Papyrus-Savanna-texture.indd 2-6 6-4-2016 15:14:28

Judith_ordernr21297_cover_dubbelzijdig-FC_Papyrus-Savanna-texture.indd 7-11 6-4-2016 15:14:28

JUDITH CLUITMANS
Colofon
The research presented in this thesis was performed at the Department of Biochemistry, Radboud Institute for Molecular Life Sciences, Radboudumc, Nijmegen, The Netherlands. Judith Cluitmans was funded by the research grant from the E-Rare Joint Translational Call 2009 (European Multidisciplinary Initia-tive on Neuroacanthocytosis; EMINA) and the E-Rare-2 Call 2012 (EMINA-2).
Cover & book design: Ilse Schrauwers – isontwerpPrinting: Gildeprint Drukkerij, EnschedeISBN: 978-94-92303-06-6
Copyright © Judith Cluitmans, 2016All rights reserved. No part of this work may be reproduced or transmitted in any form or by any means without the permission of the author.

RED BLOOD CELLHOMEOSTASISMolecular mechanisms regulating morphology and function
Proefschrift
ter verkrijging van de graad van doctoraan de Radboud Universiteit Nijmegen
op gezag van de rector magnificus,volgens besluit van het college van decanen
in het openbaar te verdedigen op donderdag 2 juni 2016om 10.30 uur precies
doorJudith Cornelia Antonia Cluitmans
geboren op 27 juni 1986te Waalwijk
PromotorProf. dr. R.E. Brock
CopromotorenDr. G.J.C.G.M. BosmanDr. ir. M.J.W. Adjobo-Hermans
ManuscriptcommissieProf. dr. N.M.A. Blijlevens Prof. dr. D.W. SwinkelsProf. dr. O.C.M. Sibon (UMC Groningen)
5
TABLE OF CONTENTs
Chapter 1 Introduction and outline of the thesis Chapter 2 Red blood cell deformability during storage: towards functional proteomics and metabolomics
Chapter 3 Alterations in red blood cell deformability during storage: a microfluidic approach
Chapter 4 Susceptibility to hyperosmotic stress-induced phosphatidylserine exposure increases during RBC storage
Chapter 5 Cytoskeletal control of RBC shape: theory and practice of vesicle formation Chapter 6 Red blood cell homeostasis: pharmacological interventions to explore biochemical, morphological and mechanical properties
Chapter 7 Abnormal red cell structure and function in neuroacanthocytosis Chapter 8 Summary and general discussion Chapter 9 Nederlandse samenvatting
Chapter 10 Appendices Bibliography Curriculum Vitae List of publications Dankwoord
6
24
38
56
70
94
116
134
148
160163181183187

7
introduction and outline of the thesis

8
Red blood cell homeostasis
9
1. Introduction and outline of the thesis
The red blood cell in health and disease
The red blood cell: structure and functionRed blood cells (RBCs), or erythrocytes, are by far the most numerous blood cells. A microliter of human blood contains 4 to 6 million RBCs and in total there are roughly 25 trillion RBCs in the five liters of blood of our human body. Their main function is the transport of oxygen (O2) from the lungs to the organs and to carry carbon dioxide (CO2) from the organs to the lungs.
The RBC presents an intricate relationship between cell structure and func-tion. Its oxygen transport function depends on rapid and efficient diffusion of oxygen across the red cell’s plasma membrane. The lack of organelles creates more space for hemoglobin. Furthermore, the biconcave shape makes the RBC more flexible when traveling through the narrow microcapillaries and the change to a bullet shape in the microcapillaries creates a large surface that is ideal for gas exchange. The absence of mitochondria results in the absence of a need to use the oxygen that RBCs transport for energy production. Instead, RBCs produce all their ATP via anaerobic glycolysis.
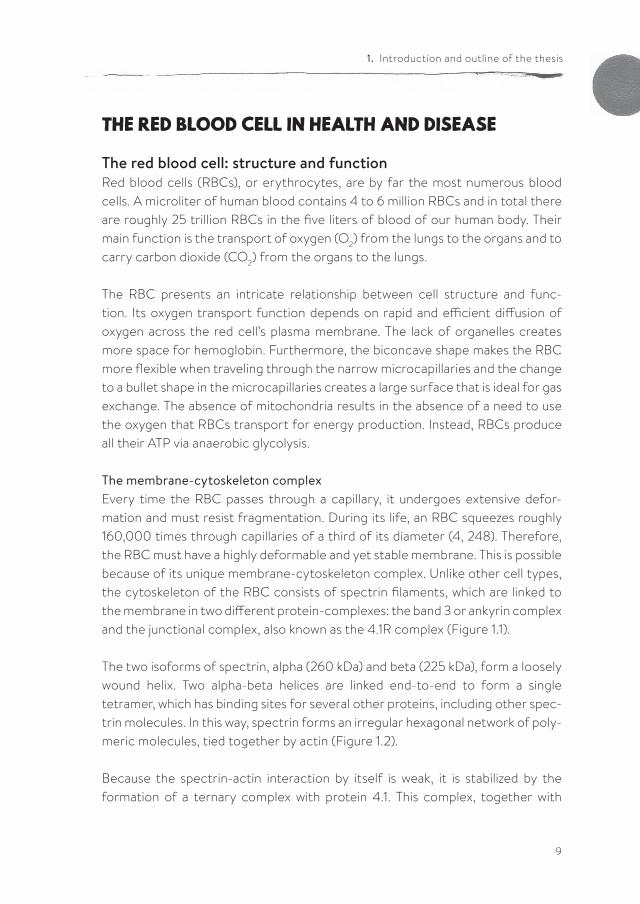
The membrane-cytoskeleton complexEvery time the RBC passes through a capillary, it undergoes extensive defor-mation and must resist fragmentation. During its life, an RBC squeezes roughly 160,000 times through capillaries of a third of its diameter (4, 248). Therefore, the RBC must have a highly deformable and yet stable membrane. This is possible because of its unique membrane-cytoskeleton complex. Unlike other cell types, the cytoskeleton of the RBC consists of spectrin filaments, which are linked to the membrane in two different protein-complexes: the band 3 or ankyrin complex and the junctional complex, also known as the 4.1R complex (Figure 1.1).
The two isoforms of spectrin, alpha (260 kDa) and beta (225 kDa), form a loosely wound helix. Two alpha-beta helices are linked end-to-end to form a single tetramer, which has binding sites for several other proteins, including other spec-trin molecules. In this way, spectrin forms an irregular hexagonal network of poly-meric molecules, tied together by actin (Figure 1.2).
Because the spectrin-actin interaction by itself is weak, it is stabilized by the formation of a ternary complex with protein 4.1. This complex, together with
10
Red blood cell homeostasis
many other proteins, is bound to the membrane in the junctional complexes. At the self-association side, spectrin binds to ankyrin, which in its turn binds to band 3, the anion (Cl-/HCO3
-) exchanger AE1 (see Figure 1.1).
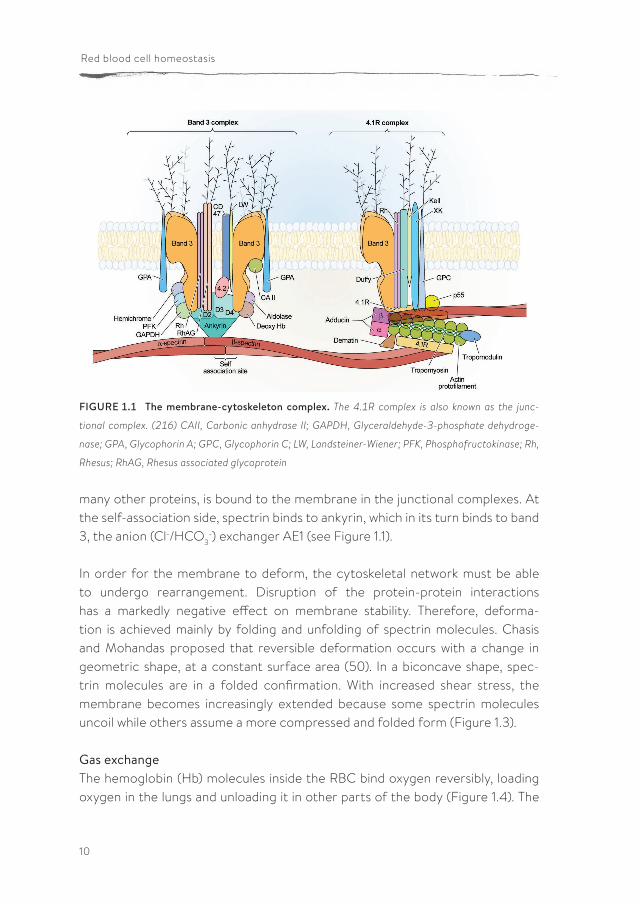
In order for the membrane to deform, the cytoskeletal network must be able to undergo rearrangement. Disruption of the protein-protein interactions has a markedly negative effect on membrane stability. Therefore, deforma-tion is achieved mainly by folding and unfolding of spectrin molecules. Chasis and Mohandas proposed that reversible deformation occurs with a change in geometric shape, at a constant surface area (50). In a biconcave shape, spec-trin molecules are in a folded confirmation. With increased shear stress, the membrane becomes increasingly extended because some spectrin molecules uncoil while others assume a more compressed and folded form (Figure 1.3).
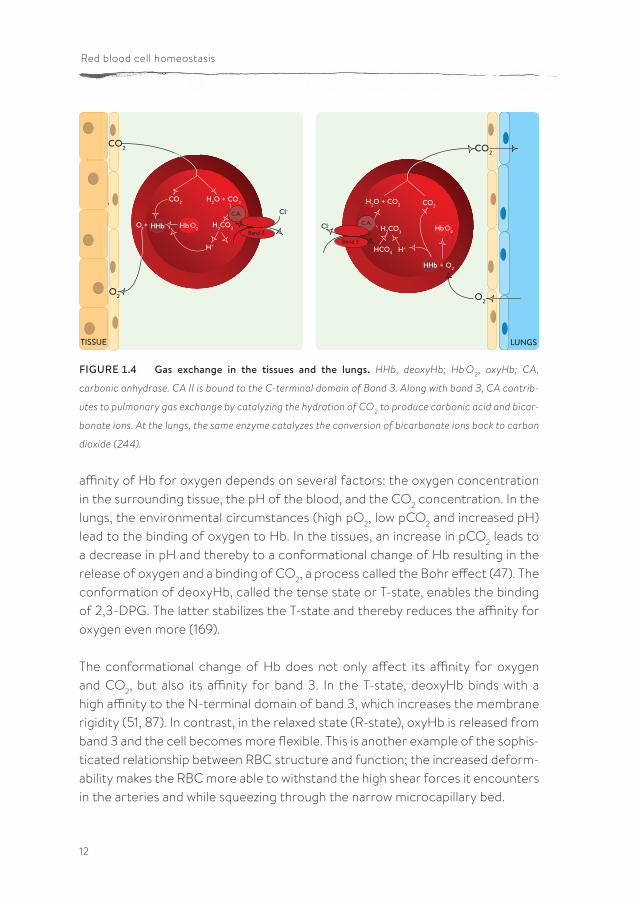
Gas exchangeThe hemoglobin (Hb) molecules inside the RBC bind oxygen reversibly, loading oxygen in the lungs and unloading it in other parts of the body (Figure 1.4). The
FIGURE 1.1 The membrane-cytoskeleton complex. The 4.1R complex is also known as the junc-
tional complex. (216) CAII, Carbonic anhydrase II; GAPDH, Glyceraldehyde-3-phosphate dehydroge-
nase; GPA, Glycophorin A; GPC, Glycophorin C; LW, Landsteiner-Wiener; PFK, Phosphofructokinase; Rh,
Rhesus; RhAG, Rhesus associated glycoprotein
11
1. Introduction and outline of the thesis
FIGURE 1.2 Visualization of the hexagonal lattice in the RBC membrane skeleton. (A) The structural
model of a hexagonal lattice composed of spectrin is supported by high-resolution electron micrographs
of isolated membranes. (B) The putative location of the structural elements is shown schematically. (161)
FIGURE 1.3 Model of the reversible deformation of the RBC membrane. (A) The nondeformed
membrane. With increased shear stress, the membrane becomes increasingly extended (B) and (C).
Further extension of the membrane beyond that shown in c would result in an increase in surface area
and the breaking of junction points. This is the stage at which membrane fragmentation occurs. ,
protein 4.1, actin, and spectrin association points; O, spectrin-spectrin association points; linear coils,
spectrin dimer. (50)
A
A B
B
C
12
Red blood cell homeostasis
affinity of Hb for oxygen depends on several factors: the oxygen concentration in the surrounding tissue, the pH of the blood, and the CO2 concentration. In the lungs, the environmental circumstances (high pO2, low pCO2 and increased pH) lead to the binding of oxygen to Hb. In the tissues, an increase in pCO2 leads to a decrease in pH and thereby to a conformational change of Hb resulting in the release of oxygen and a binding of CO2, a process called the Bohr effect (47). The conformation of deoxyHb, called the tense state or T-state, enables the binding of 2,3-DPG. The latter stabilizes the T-state and thereby reduces the affinity for oxygen even more (169).
The conformational change of Hb does not only affect its affinity for oxygen and CO2, but also its affinity for band 3. In the T-state, deoxyHb binds with a high affinity to the N-terminal domain of band 3, which increases the membrane rigidity (51, 87). In contrast, in the relaxed state (R-state), oxyHb is released from band 3 and the cell becomes more flexible. This is another example of the sophis-ticated relationship between RBC structure and function; the increased deform-ability makes the RBC more able to withstand the high shear forces it encounters in the arteries and while squeezing through the narrow microcapillary bed.
H2O + CO2
H2CO3
H+
Band 3
Cl-
CO2
C.A.
O2
CO2
Hb.O2 O2 +
H2O + CO2
H2CO3
H+ Band 3
Cl- C.A.
O2
Hb.O2
CO2
HCO3
+ O2
CO2
LUNGSTISSUE
HHb
HHb
FIGURE 1.4 Gas exchange in the tissues and the lungs. HHb, deoxyHb; Hb.O2, oxyHb; CA,
carbonic anhydrase. CA II is bound to the C-terminal domain of Band 3. Along with band 3, CA contrib-
utes to pulmonary gas exchange by catalyzing the hydration of CO2 to produce carbonic acid and bicar-
bonate ions. At the lungs, the same enzyme catalyzes the conversion of bicarbonate ions back to carbon
dioxide (244).
13
1. Introduction and outline of the thesis
Red blood cell metabolismGlucose is used in the RBC in a constant trade-off between two metabolic path-ways: the glycolysis and the pentose-phosphate pathway (PPP). The distribution between these pathways is coordinated by the reversible binding of hemoglobin to band 3 (178). The glycolysis is essential for red cell energy production, while the PPP has a function in the protection of the RBC to oxidative damage through the production of NADPH (87). The high oxygen tension and the generation of superoxide anion during binding and release of oxygen to hemoglobin constitute a high degree of oxidative stress, making the PPP important for survival.
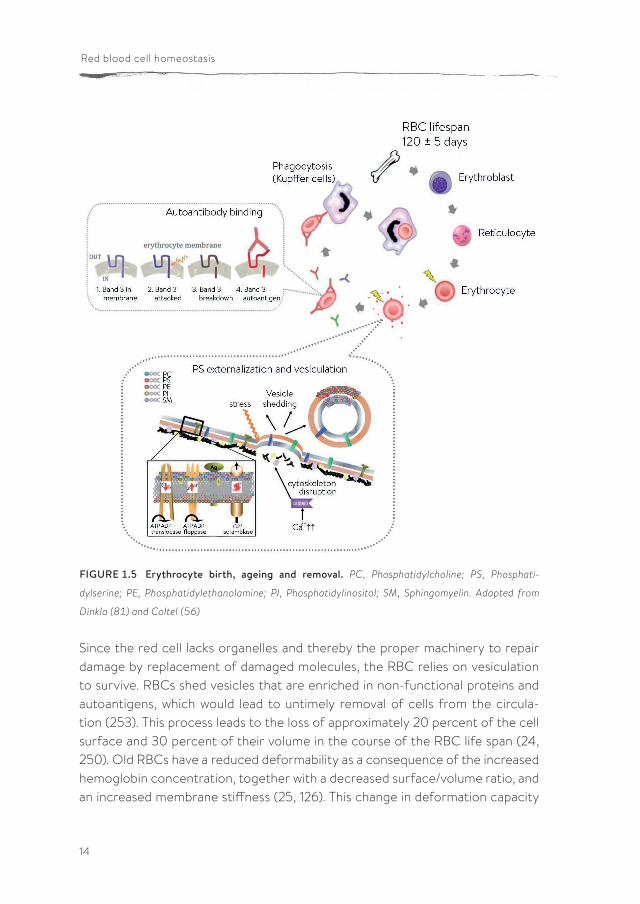
The N-terminal domain of band 3 contains binding sites for key enzymes of the glycolysis, such as glyceraldehyde-3-phosphate dehydrogenase (GAPDH), aldo-lase and phosphofructokinase (52). Binding of these enzymes to band 3 inhibits their function and thereby shifts the glucose consumption to the PPP. These enzymes compete with deoxyHb for binding to the N-terminal domain of band 3. Therefore, during deoxygenation, the glycolytic enzymes are released, which favors the use of glucose for the production of ATP (51). Through this mecha-nism, the cell can balance its metabolite flow between both pathways, depending on its needs. In circumstances with high oxygen levels, the cell has to be able to protect itself from an increase in reactive oxygen species (ROS) and needs therefore high levels of the reducing agent NADPH. Once the cell has released its oxygen in the tissues, the oxidative stress decreases, and the cell can invest more of its glucose in energy production. The life of a red blood cell RBCs originate in the bone marrow in the process called erythropoiesis. During erythropoiesis, a stem cell differentiates via several steps into a reticulocyte, which is then released into the bloodstream where it matures into an RBC within a few days. During its passage through the circulation, RBCs encounter severe physiological conditions consisting of mechanical stress, oxidative damage and fast changes in ionic and osmotic conditions. Yet, RBCs live for approximately 120 days before they are removed from the circulation (228) (Figure 1.5). In vivo, RBC aging is regulated by several pathways resulting finally in the controlled exposure of molecules that cause binding and phagocytosis by the immune and reticuloen-dothelial systems (168). RBC removal mainly takes place by macrophages in the liver and to some extent in the spleen (12, 223).
14
Red blood cell homeostasis
Since the red cell lacks organelles and thereby the proper machinery to repair damage by replacement of damaged molecules, the RBC relies on vesiculation to survive. RBCs shed vesicles that are enriched in non-functional proteins and autoantigens, which would lead to untimely removal of cells from the circula-tion (253). This process leads to the loss of approximately 20 percent of the cell surface and 30 percent of their volume in the course of the RBC life span (24, 250). Old RBCs have a reduced deformability as a consequence of the increased hemoglobin concentration, together with a decreased surface/volume ratio, and an increased membrane stiffness (25, 126). This change in deformation capacity
FIGURE 1.5 Erythrocyte birth, ageing and removal. PC, Phosphatidylcholine; PS, Phosphati-
dylserine; PE, Phosphatidylethanolamine; PI, Phosphatidylinositol; SM, Sphingomyelin. Adapted from
Dinkla (81) and Coltel (56)
15
1. Introduction and outline of the thesis
presumably stimulates the removal of old cells, by trapping them in the spleen where they can be recognized as old cells by macrophages (214). So far, three molecules have been identified as likely to play a role in recognition and phago-cytosis of aged RBCs: band 3, phosphatidylserine (PS) and CD47 (28, 45, 147).
Next to its main functions in anion exchange, membrane-cytoskeleton organi-zation and metabolism (see above), band 3 is important for RBC removal as well. Band 3 modifications accumulate during physiological RBC aging, probably due to oxidative insults. Conformational changes in band 3 eventually transform it into a senescent neoantigen that is recognized by autologous IgG (28, 138). These same conformational changes may induce loss of binding sites between the cytoskel-eton and lipid bilayer resulting in the formation of vesicles (37).
CD47, also known as the integrin-associated protein, may function as a marker of self on RBCs. It normally inhibits phagocytosis through interaction with the inhibitory immunoreceptor SIRPa, which is highly expressed by red pulp macro-phages in the spleen (45, 193). Conformational changes in CD47 may turn it from a “do-not-eat-me” signal into an “eat-me” signal (45).
Next to these two membrane proteins, components of the lipid bilayer have been postulated to play a role in RBC removal. The plasma membrane has a well-con-trolled phospholipid asymmetry, with phosphatidylserine (PS) and phosphatidy-lethanolamine (PE) mostly at the inside, and phosphatidylcholine (PC) and sphin-gomyelin (SM) mainly in the outer leaflet of the lipid bilayer (194). During ageing, the mechanisms controlling this lipid distribution may become disrupted, leading to the exposure of PS on the outside of the membrane. PS is recognized by macrophages as a removal signal, which may stimulate phagocytosis (147).
The RBC in diseaseStorage/Transfusion-associated pathologiesBlood transfusion is a medical treatment that was used for the first time already in the beginning of the 1800’s. It has been a successful life-saving treatment in the last decades for patients with blood loss because of trauma or during surgery, but also for anemic patients. In the Netherlands, yearly 250,000 people undergo at least one blood transfusion (221).
16
Red blood cell homeostasis
Since the beginning of blood banking, the legal requirements for blood storage have developed extensively. During storage, RBCs undergo various metabolic, structural and morphological changes, the so-called storage lesions (20, 140, 167). The acceptable extent of the metabolic changes, such as the decrease in 2,3-DPG, ATP, and pH, together with hemolysis, forms the major part of the current blood bank quality guidelines. Hemolysis and survival rate can also be used as quality parameters and seem to be more directly related to transfusion-related pathologies caused by the storage lesions, such as iron accumulation, endothelial damage, inflammation, and formation of alloantibodies (31). Especially for transfu-sion-dependent patients, these side effects become critical over time.
Transfused RBCs have been shown to have an overall good survival with a maximum of 135 days after transfusion (165). Nevertheless, survival studies show the disappearance of 5 - 10% within the first 24 hours after transfusion. This percentage increases up to 30% after the maximal storage time (167, 209). This suggests that, during blood bank storage, a specific population of RBCs becomes vulnerable for quick disappearance from the circulation. It has been proposed that this fraction of vulnerable RBCs is the main cause of the side effects of transfusion (31). The results of several studies have shown that six factors are the main determinants of RBC recovery after storage: 1) the duration of storage, 2) the type of plasticizer in the bag, 3) the composition of the suspending solution in the bag, 4), the volume of the suspending solution in the bag, 5) the quality of leukoreduction, and 6) as yet imperfectly understood interdonor variability (121). Nevertheless, it is still unknown which storage-associated alterations at the molecular level makes these RBCs more prone to clearance after transfusion.
In the last years, an increasing number of studies have focused on understanding the molecular changes causing these side effects, in order to improve storage conditions and transfusion (28, 38, 61, 144) The current blood bank quality guidelines are determined mainly by the extent of metabolic changes, such as indicated by changes in 2,3-DPG, ATP, and pH, as well as hemolysis. However, the reversibility of these metabolic changes in vivo make it unlikely that they are responsible for most transfusion side effects. Alterations in membrane struc-ture, as indicated by morphological changes, are more likely to cause a decrease in transfusion efficacy (20). Data on storage-related exposure of removal signals, such as band 3-derived senescent neoantigens and PS, support the theory that physiological aging-related changes in the membrane are functionally relevant
17
1. Introduction and outline of the thesis
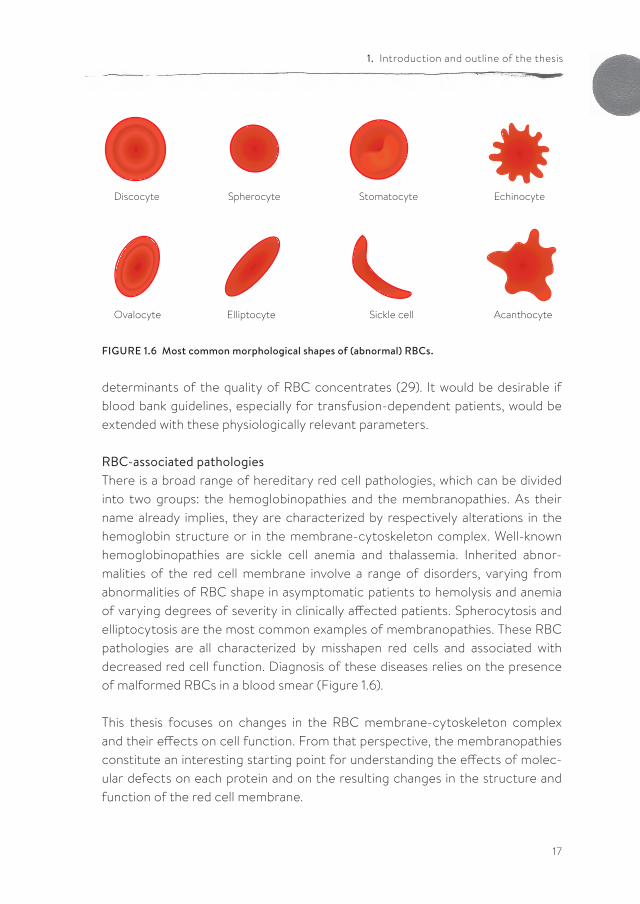
FIGURE 1.6 Most common morphological shapes of (abnormal) RBCs.
Discocyte Spherocyte Stomatocyte Echinocyte
Ovalocyte Elliptocyte Sickle cell Acanthocyte
determinants of the quality of RBC concentrates (29). It would be desirable if blood bank guidelines, especially for transfusion-dependent patients, would be extended with these physiologically relevant parameters.
RBC-associated pathologiesThere is a broad range of hereditary red cell pathologies, which can be divided into two groups: the hemoglobinopathies and the membranopathies. As their name already implies, they are characterized by respectively alterations in the hemoglobin structure or in the membrane-cytoskeleton complex. Well-known hemoglobinopathies are sickle cell anemia and thalassemia. Inherited abnor-malities of the red cell membrane involve a range of disorders, varying from abnormalities of RBC shape in asymptomatic patients to hemolysis and anemia of varying degrees of severity in clinically affected patients. Spherocytosis and elliptocytosis are the most common examples of membranopathies. These RBC pathologies are all characterized by misshapen red cells and associated with decreased red cell function. Diagnosis of these diseases relies on the presence of malformed RBCs in a blood smear (Figure 1.6).
This thesis focuses on changes in the RBC membrane-cytoskeleton complex and their effects on cell function. From that perspective, the membranopathies constitute an interesting starting point for understanding the effects of molec-ular defects on each protein and on the resulting changes in the structure and function of the red cell membrane.
18
Red blood cell homeostasis
Hereditary spherocytosis (HS) is the most common form of congenital hemolytic anemia, with an incidence of 1 in 2000 among Causasians. This group of hetero-geneous disorders is characterized by sphere-shaped RBCs, that are mechani-cally unstable and have an increased osmotic fragility (76). Spherocytosis is char-acterized clinically by anemia, jaundice, and splenomegaly, with variable severity. The severity of the disease differs from hardly any clinical expression to death in utero in the most extreme form (75). HS can be caused by a mutation in several genes encoding various proteins of the red cell membrane (100) (Table 1.1).
Hereditary elliptocytosis (HE) is the second most common hereditary hemo-lytic anemia, with an incidence of 1 in 5,000 to 10,000 among Caucasians, which may be significantly higher in other populations. HE is characterized by ellipti-cally shaped RBCs, which have a decreased mechanical stability resulting in a variable degree of hemolytic anemia. The clinical features resemble those of HS, although they are usually milder (75, 76). Elliptocytosis is caused by mutations in various RBC membrane proteins (100) (Table 1.1).
In literature, the interactions in the membrane-cytoskeleton complex are divided into two types: vertical interactions between the membrane skeleton and the lipid bilayer, and horizontal interactions among components that form the membrane skeleton meshwork.
It has been suggested that mutations in proteins involved in vertical interactions, such as the binding of the spectrin cytoskeleton to the band 3-ankyrin complex, induce vesiculation-associated membrane loss and the appearance of spherocytes. Mutations in membrane proteins that affect horizontal interactions, such as the spectrin dimer-dimer structure and the spectrin-actin-protein 4.1R interactions, are thought to lead to membrane fragmentation and elliptocytosis (182, 239).
Patients with typical HE are often asymptomatic and are diagnosed incidentally when tested for unrelated conditions. On the other hand, most HS patients have incompletely compensated hemolysis and mild to moderate anemia. In HS, the defect in one of the membrane proteins results in increased membrane fragility, which then leads to increased membrane vesiculation. As a result of this vesicula-tion, the surface-area-to-volume changes, causing the spheroidal shape of these RBCs and a decreased deformability. This makes these cells more vulnerable
19
1. Introduction and outline of the thesis
to entrapment in the hostile environment of the spleen. Destruction of these abnormal RBCs in the spleen is the principal cause of hemolysis (100).
NeuroacanthocytosisAlso other diseases can display abnormal RBC morphologies. Neuroacantho-cytosis (NA) is a family of rare hereditary neurodegenerative disorders, which includes chorea-acanthocytosis (ChAc), McLeod syndrome (MLS), Huntington’ s disease-like 2 (HDL2) and panthothenate kinase-associated neurodegeneration (PKAN) (135, 204). Patients affected by these progressive and fatal disorders suffer from devastating movement disorders as well as a variety of other symp-toms (135). NA shares considerable similarities with Huntington s disease (HD). As in HD, the basal ganglia are preferentially affected by neurodegeneration. In contrast to HD, a key to the understanding of underlying mechanisms may be found in the easily accessible RBCs of NA patients. Although the clinical symp-toms of NA all seem to be caused by neurodegeneration, the presence of acan-thocytes in the blood stream constitutes a characteristic feature of NA. Acan-thocytes are misshapen, spiky red blood cells (Figure 1.6). These cells are the
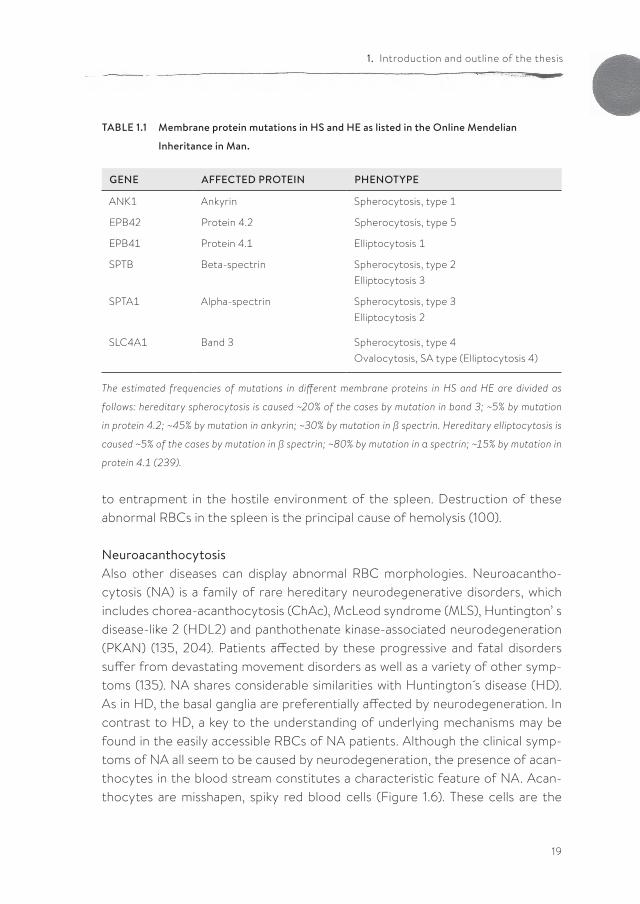
TABLE 1.1 Membrane protein mutations in HS and HE as listed in the Online Mendelian
Inheritance in Man.
GENE AFFECTED PROTEIN PHENOTYPE
ANK1 Ankyrin Spherocytosis, type 1
EPB42 Protein 4.2 Spherocytosis, type 5
EPB41 Protein 4.1 Elliptocytosis 1
SPTB Beta-spectrin Spherocytosis, type 2Elliptocytosis 3
SPTA1 Alpha-spectrin Spherocytosis, type 3Elliptocytosis 2
SLC4A1 Band 3 Spherocytosis, type 4Ovalocytosis, SA type (Elliptocytosis 4)
The estimated frequencies of mutations in different membrane proteins in HS and HE are divided as
follows: hereditary spherocytosis is caused ~20% of the cases by mutation in band 3; ~5% by mutation
in protein 4.2; ~45% by mutation in ankyrin; ~30% by mutation in ß spectrin. Hereditary elliptocytosis is
caused ~5% of the cases by mutation in ß spectrin; ~80% by mutation in α spectrin; ~15% by mutation in
protein 4.1 (239).
20
Red blood cell homeostasis
origin of the term neuroacanthocytosis, denoting the association of neurological findings and acanthocytes. During the last years, RBCs from NA patients have been used to gain more insight into the mechanisms underlying the pathophysi-ology of the NA disorders (11, 13, 32, 70, 71, 96, 232).
Although the genetic basis for the NA disorders is known, the molecular mech-anisms underlying both the neurodegeneration and the formation of acantho-cytes remain elusive. The affected genes encode the Kell protein-associated XK protein in MLS, VPS13A (vacuolar protein sorting 13A, also known as chorein) in ChAc, JPH3 (junctophilin 3) in HDL2 and PANK2 (pantothenate kinase 2) in PKAN (124, 173, 240, 259). JPH3 and PANK2 are not present in mature RBCs, and the function of XK and chorein are not known, which does not provide any obvious clues to the mechanism resulting in the typical acanthocytic shape. The occurrence of acanthocytes may be caused by distinct primary causes in each syndrome, depending on the respective gene defects. It has been suggested that each mutation affects a common pathway in erythropoiesis and/or red cell membrane homeostasis, thereby leading to the same pheno-type (204). Furthermore, this pathway might not only be responsible for the aberrant RBC shape, but also for the neurodegeneration. An improved under-standing of the alterations that arise in the, relatively easy accessible, patients’ RBCs may therefore help to understand the molecular basis for the neurolog-ical phenomena in NA.
Since RBC shape changes are often the result of changes in membrane struc-ture, it is to be expected that the membrane-cytoskeleton is disturbed in acan-thocytes. The membrane complexes are formed during erythropoiesis and remodeled during reticulocyte maturation (159). Deficiencies in protein sorting during erythropoiesis lead to aberrant RBC morphology (215). Therefore, it is suggested that acanthocytes are the result of an unbalanced distribution of membrane proteins and/or cytoskeleton during erythropoiesis (204). VPS13A has been proposed to control one or more steps in protein trafficking (204), and may affect the protein distribution of the main components of the RBC membrane-cytoskeleton complex during erythropoiesis. Furthermore, VPS13A may be involved in autophagy (131, 220). Autophagy is known to play an important role both in various forms of neurodegeneration and in late stages of erythropoi-esis, by removing aggregated proteins and non-functional organelles in neurons and in erythroid precursor cells (18, 152). Loss of autophagy has been associated
21
1. Introduction and outline of the thesis
with impaired erythropoiesis (184), and therefore may play a role in the forma-tion of acanthocytes. The Kx/Kell complex is part of the junctional complex, so absence of a functional XK protein may very well lead to shape changes in patients with MLS. At present, there are no clues to a possible mechanism of acanthocyte formation in patients with HDL2 and PKAN.
Aims and outline of the thesis
In the course of our studies on the molecular cause of neuroacanthocytosis, we were confronted with a lack of molecular knowledge on the relation between RBC structural and functional characteristics. The aim of this thesis is to gain a better understanding of the structural features that determine the func-tion and morphology of the red blood cell. These insights can contribute to the fundamental understanding of the structure/function relationship of cellular membranes in general, as well as help in a better understanding of RBC-related diseases. Furthermore it can contribute to the improvement of RBC transfusion.
Under normal conditions in vivo, or during blood bank storage, RBCs undergo several age-related structural changes. In the last decades, most research on RBC aging in vivo and in vitro has been focused on detailed analyses of the molec-ular changes in the plasma membrane. So far, relatively little attention has been devoted to the changes in deformability and the consequences of those changes on the cell’s function. In chapter 2, we review the available data on aging-as-sociated and storage-associated alterations in RBC deformability. The data we acquired in the course of a preliminary study served as the starting point for an inventory of the data on alterations in RBC deformability during storage, the putative consequences, and the proteomic and metabolomics indications for the underlying molecular mechanisms.
While various techniques have been used to investigate the rheological proper-ties of stored RBCs, the clinical significance of those data is controversial. We developed a microfluidic approach for evaluating RBC deformability in physio-logically meaningful and clinically significant conditions. In chapter 3, we describe the use of this approach to determine the effect of blood bank storage on the deformability capacity of RBCs. Our data indicate that the capacity of the cells to deform and relax is not affected during storage in the blood bank. Further-
22
Red blood cell homeostasis
more, altered cell morphology by itself does not necessarily affect deformability. The exposure of phosphatidylserine (PS), a potent removal signal, is considered to be an indication of the structural changes RBCs undergo during blood bank storage. In chapter 4 we postulate that, during blood bank storage, the suscep-tibility to stress-induced PS exposure increases, thereby rendering a consider-able fraction of the RBCs susceptible to rapid removal after transfusion. There-fore, RBCs of different storage times were exposed to various near-physiological stress conditions, after which PS exposure was measured. Our findings show that, during storage under blood bank conditions, RBCs become increasingly susceptible to loss of phospholipid asymmetry induced by hyperosmotic shock and energy depletion. This is associated with the appearance of an aging pheno-type. These findings could be an explanation for the rapid disappearance of up to 25 percent of RBCs during the first 24 hours after transfusion, which is particu-larly a problem for blood bank units after longer storage time.
Microvesicles are fragments that are shed from the plasma membrane of stimu-lated or apoptotic cells. They are associated with various physiological processes involving intercellular communication, hemostasis, and immunity. Classically, the RBC has been used as a model for the mechanism of vesicle formation. In the last few years, the interest in the ins and outs of RBC vesiculation has increased, since vesiculation plays a role in all stages of the RBC life, constitutes one of the RBC storage lesions, and also plays a role in RBC-associated pathologies. In chapter 5, we present the recent data on RBC vesicle composition, and discuss these in the light of the molecular mechanisms that have been postulated on the vesicle generation process. Furthermore, we combine these insights into a new model, and propose some experimental approaches that could falsify and/or refine this theory.
Band 3 is a central player in RBC homeostasis because of its interactions with several membrane and cytoskeletal proteins, as well as key enzymes of various metabolic pathways. These interactions are controlled by a signaling network acting via phosphorylation of band 3, and by the binding of deoxyhemoglobin to band 3. In chapter 6 we show that band 3-centered manipulation of the interac-tion between the lipid bilayer and the cytoskeleton using various treatments has diverse effects on morphology, membrane organization, membrane lipid organi-zation, deformability and metabolic activity.
23
1. Introduction and outline of the thesis
Panthothenate kinase-associated neurodegeneration (PKAN) is one of the neuroacanthocytosis syndromes. In comparison with ChAc and MLS, even less data are available on the characteristics of the RBCs of PKAN patients. In chapter 7, we describe for the first time a qualitative and semi-quantitative morpholog-ical, structural and functional analysis of the RBCs from PKAN patients and their relatives. Our results show the presence of morphological, structural and func-tional changes in RBCs not only of patients, but also in the RBCs of some of their relatives.
In chapter 8, the findings are summarized and future directions are provided.

25
PUBLISHED AS:
Judith C. A. Cluitmans1, Max R. Hardeman2, Sip Dinkla1,3, Roland Brock1 and Giel J.C.G.M. Bosman1
1 Department of Biochemistry, Radboud University Nijmegen Medical Centre,
Nijmegen Centre for Molecular Life Sciences, Nijmegen, the Netherlands;
2 Department of Translational Physiology, Academic Medical Centre, University of
Amsterdam, The Netherlands;
3 Department of Laboratory Medicine - Laboratory of Medical Immunology,
Radboud University Nijmegen Medical Centre, Nijmegen Institute for Infection,
Inflammation and Immunity, Nijmegen, The Netherlands.
Blood Transfusion 2012; 10 Suppl 2: s12-8
RED BLOOD CELL DEFORMABILITYDURING STORAge:
TOWARDS FUNCTIONAL PROTEOMICS AND METABOLOMICS IN THE BLOOD BANK

Red blood cell homeostasis
26
2. Red blood cell deformability, proteomics and metabolomics
27
Storage
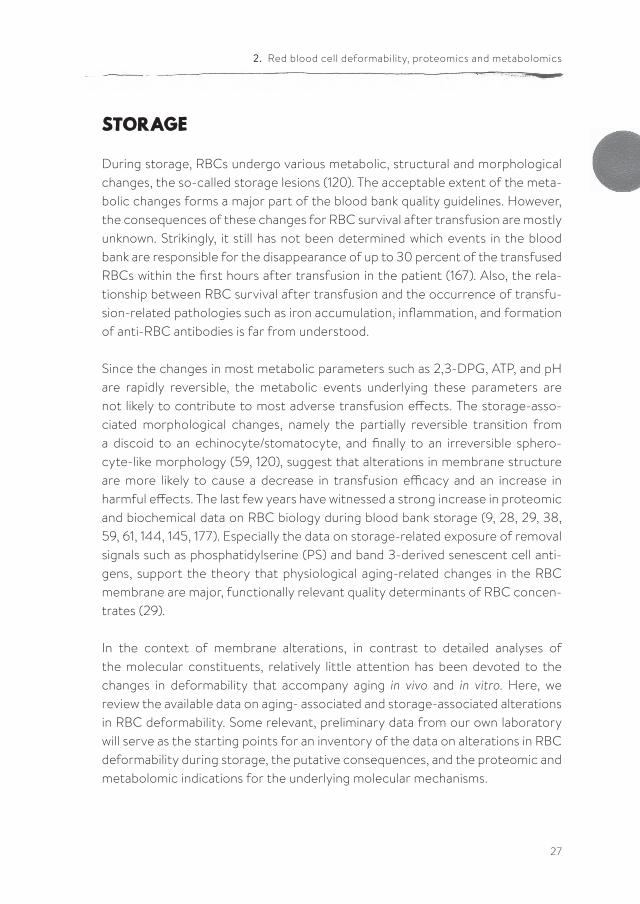
During storage, RBCs undergo various metabolic, structural and morphological changes, the so-called storage lesions (120). The acceptable extent of the meta-bolic changes forms a major part of the blood bank quality guidelines. However, the consequences of these changes for RBC survival after transfusion are mostly unknown. Strikingly, it still has not been determined which events in the blood bank are responsible for the disappearance of up to 30 percent of the transfused RBCs within the first hours after transfusion in the patient (167). Also, the rela-tionship between RBC survival after transfusion and the occurrence of transfu-sion-related pathologies such as iron accumulation, inflammation, and formation of anti-RBC antibodies is far from understood.
Since the changes in most metabolic parameters such as 2,3-DPG, ATP, and pH are rapidly reversible, the metabolic events underlying these parameters are not likely to contribute to most adverse transfusion effects. The storage-asso-ciated morphological changes, namely the partially reversible transition from a discoid to an echinocyte/stomatocyte, and finally to an irreversible sphero-cyte-like morphology (59, 120), suggest that alterations in membrane structure are more likely to cause a decrease in transfusion efficacy and an increase in harmful effects. The last few years have witnessed a strong increase in proteomic and biochemical data on RBC biology during blood bank storage (9, 28, 29, 38, 59, 61, 144, 145, 177). Especially the data on storage-related exposure of removal signals such as phosphatidylserine (PS) and band 3-derived senescent cell anti-gens, support the theory that physiological aging-related changes in the RBC membrane are major, functionally relevant quality determinants of RBC concen-trates (29).
In the context of membrane alterations, in contrast to detailed analyses of the molecular constituents, relatively little attention has been devoted to the changes in deformability that accompany aging in vivo and in vitro. Here, we review the available data on aging- associated and storage-associated alterations in RBC deformability. Some relevant, preliminary data from our own laboratory will serve as the starting points for an inventory of the data on alterations in RBC deformability during storage, the putative consequences, and the proteomic and metabolomic indications for the underlying molecular mechanisms.
Red blood cell homeostasis
28
Deformability
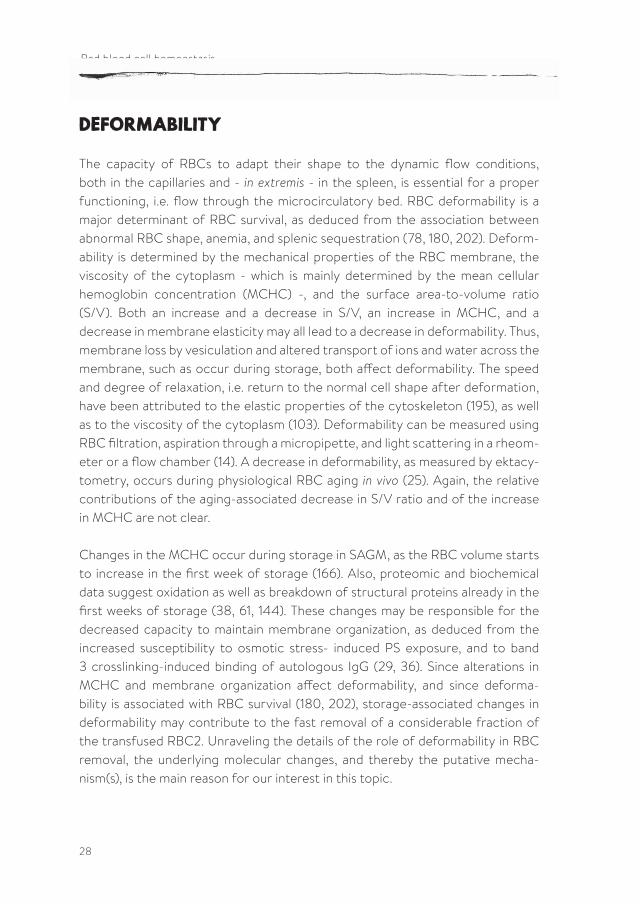
The capacity of RBCs to adapt their shape to the dynamic flow conditions, both in the capillaries and - in extremis - in the spleen, is essential for a proper functioning, i.e. flow through the microcirculatory bed. RBC deformability is a major determinant of RBC survival, as deduced from the association between abnormal RBC shape, anemia, and splenic sequestration (78, 180, 202). Deform-ability is determined by the mechanical properties of the RBC membrane, the viscosity of the cytoplasm - which is mainly determined by the mean cellular hemoglobin concentration (MCHC) -, and the surface area-to-volume ratio (S/V). Both an increase and a decrease in S/V, an increase in MCHC, and a decrease in membrane elasticity may all lead to a decrease in deformability. Thus, membrane loss by vesiculation and altered transport of ions and water across the membrane, such as occur during storage, both affect deformability. The speed and degree of relaxation, i.e. return to the normal cell shape after deformation, have been attributed to the elastic properties of the cytoskeleton (195), as well as to the viscosity of the cytoplasm (103). Deformability can be measured using RBC filtration, aspiration through a micropipette, and light scattering in a rheom-eter or a flow chamber (14). A decrease in deformability, as measured by ektacy-tometry, occurs during physiological RBC aging in vivo (25). Again, the relative contributions of the aging-associated decrease in S/V ratio and of the increase in MCHC are not clear.
Changes in the MCHC occur during storage in SAGM, as the RBC volume starts to increase in the first week of storage (166). Also, proteomic and biochemical data suggest oxidation as well as breakdown of structural proteins already in the first weeks of storage (38, 61, 144). These changes may be responsible for the decreased capacity to maintain membrane organization, as deduced from the increased susceptibility to osmotic stress- induced PS exposure, and to band 3 crosslinking-induced binding of autologous IgG (29, 36). Since alterations in MCHC and membrane organization affect deformability, and since deforma-bility is associated with RBC survival (180, 202), storage-associated changes in deformability may contribute to the fast removal of a considerable fraction of the transfused RBC2. Unraveling the details of the role of deformability in RBC removal, the underlying molecular changes, and thereby the putative mecha-nism(s), is the main reason for our interest in this topic.
2. Red blood cell deformability, proteomics and metabolomics
29
Storage and deformability
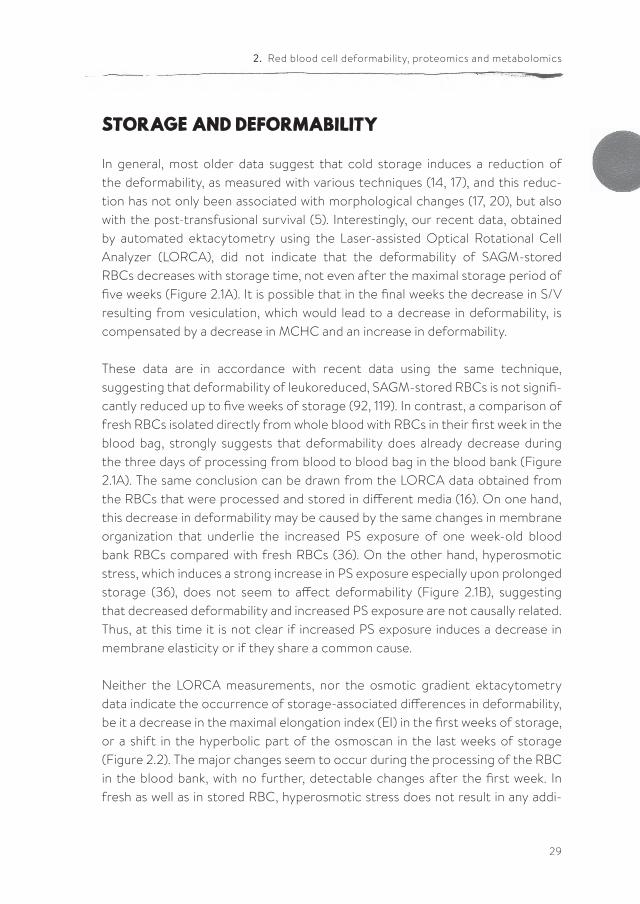
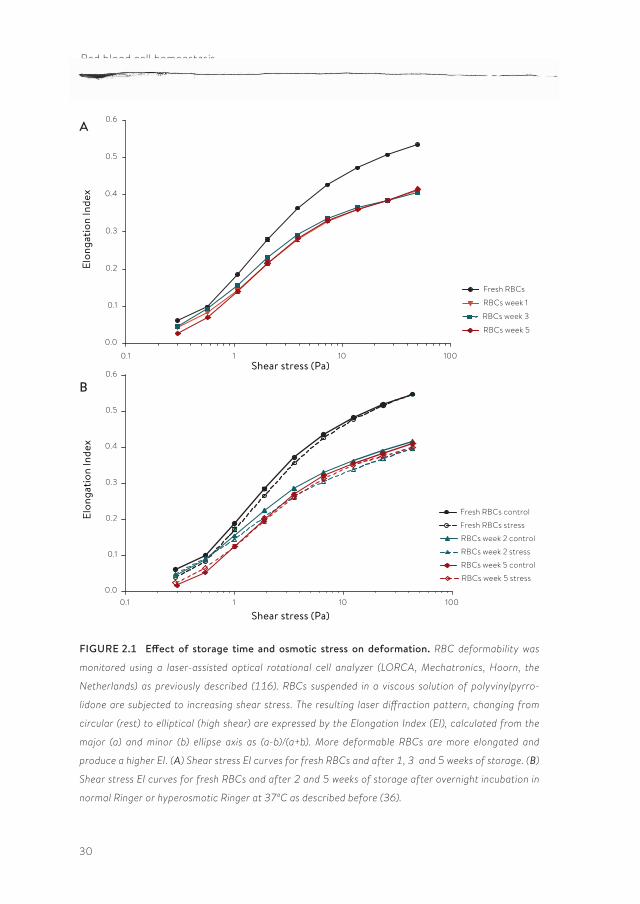
In general, most older data suggest that cold storage induces a reduction of the deformability, as measured with various techniques (14, 17), and this reduc-tion has not only been associated with morphological changes (17, 20), but also with the post-transfusional survival (5). Interestingly, our recent data, obtained by automated ektacytometry using the Laser-assisted Optical Rotational Cell Analyzer (LORCA), did not indicate that the deformability of SAGM-stored RBCs decreases with storage time, not even after the maximal storage period of five weeks (Figure 2.1A). It is possible that in the final weeks the decrease in S/V resulting from vesiculation, which would lead to a decrease in deformability, is compensated by a decrease in MCHC and an increase in deformability.
These data are in accordance with recent data using the same technique, suggesting that deformability of leukoreduced, SAGM-stored RBCs is not signifi-cantly reduced up to five weeks of storage (92, 119). In contrast, a comparison of fresh RBCs isolated directly from whole blood with RBCs in their first week in the blood bag, strongly suggests that deformability does already decrease during the three days of processing from blood to blood bag in the blood bank (Figure 2.1A). The same conclusion can be drawn from the LORCA data obtained from the RBCs that were processed and stored in different media (16). On one hand, this decrease in deformability may be caused by the same changes in membrane organization that underlie the increased PS exposure of one week-old blood bank RBCs compared with fresh RBCs (36). On the other hand, hyperosmotic stress, which induces a strong increase in PS exposure especially upon prolonged storage (36), does not seem to affect deformability (Figure 2.1B), suggesting that decreased deformability and increased PS exposure are not causally related. Thus, at this time it is not clear if increased PS exposure induces a decrease in membrane elasticity or if they share a common cause.
Neither the LORCA measurements, nor the osmotic gradient ektacytometry data indicate the occurrence of storage-associated differences in deformability, be it a decrease in the maximal elongation index (EI) in the first weeks of storage, or a shift in the hyperbolic part of the osmoscan in the last weeks of storage (Figure 2.2). The major changes seem to occur during the processing of the RBC in the blood bank, with no further, detectable changes after the first week. In fresh as well as in stored RBC, hyperosmotic stress does not result in any addi-
Red blood cell homeostasis
30
FIGURE 2.1 Effect of storage time and osmotic stress on deformation. RBC deformability was
monitored using a laser-assisted optical rotational cell analyzer (LORCA, Mechatronics, Hoorn, the
Netherlands) as previously described (116). RBCs suspended in a viscous solution of polyvinylpyrro-
lidone are subjected to increasing shear stress. The resulting laser diffraction pattern, changing from
circular (rest) to elliptical (high shear) are expressed by the Elongation Index (EI), calculated from the
major (a) and minor (b) ellipse axis as (a-b)/(a+b). More deformable RBCs are more elongated and
produce a higher EI. (A) Shear stress EI curves for fresh RBCs and after 1, 3 and 5 weeks of storage. (B)
Shear stress EI curves for fresh RBCs and after 2 and 5 weeks of storage after overnight incubation in
normal Ringer or hyperosmotic Ringer at 370C as described before (36).
0.1 1 10 100
0.0
0.1
0.2
0.3
0.4
0.5
0.6
Fresh RBCs
RBCs week 3
RBCs week 1
RBCs week 5
Shear stress (Pa)
Elon
gatio
n In
dex
0.1 1 10 1000.0
0.1
0.2
0.3
0.4
0.5
0.6
Fresh RBCs control
Fresh RBCs stress
RBCs week 2 control
RBCs week 2 stress
RBCs week 5 stress
RBCs week 5 control
Shear stress (Pa)
Elon
gatio
n In
dex
A
B
2. Red blood cell deformability, proteomics and metabolomics
31
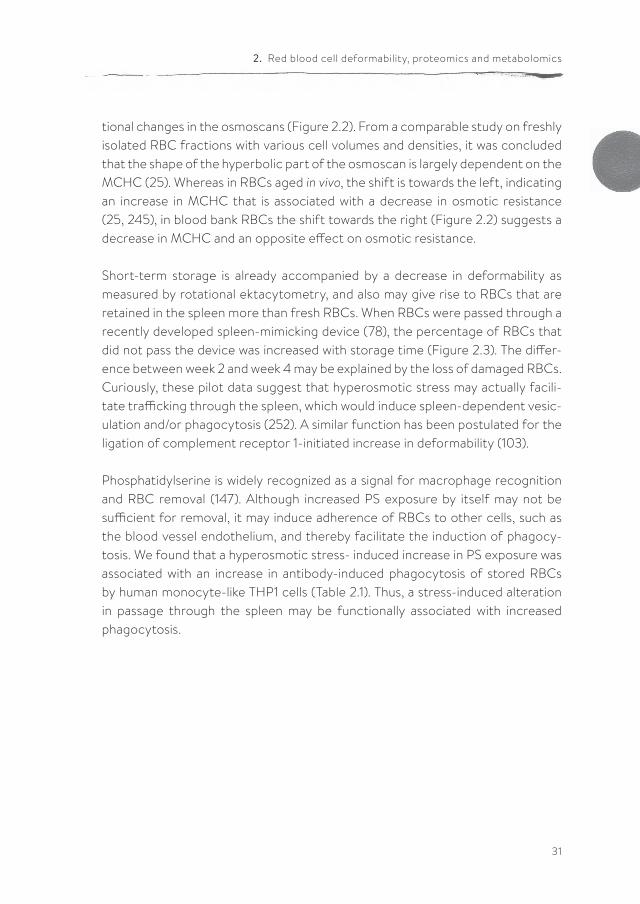
tional changes in the osmoscans (Figure 2.2). From a comparable study on freshly isolated RBC fractions with various cell volumes and densities, it was concluded that the shape of the hyperbolic part of the osmoscan is largely dependent on the MCHC (25). Whereas in RBCs aged in vivo, the shift is towards the left, indicating an increase in MCHC that is associated with a decrease in osmotic resistance (25, 245), in blood bank RBCs the shift towards the right (Figure 2.2) suggests a decrease in MCHC and an opposite effect on osmotic resistance.
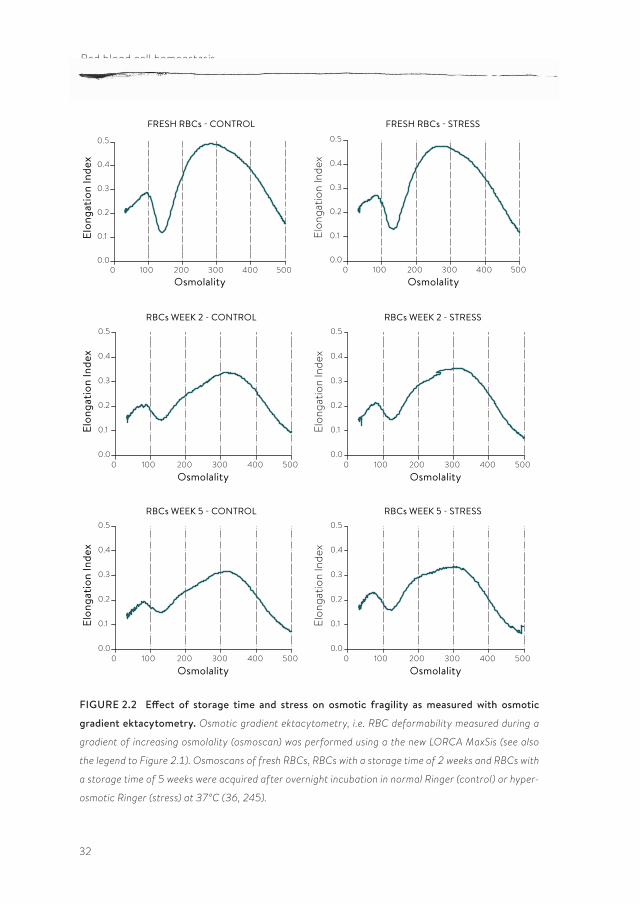
Short-term storage is already accompanied by a decrease in deformability as measured by rotational ektacytometry, and also may give rise to RBCs that are retained in the spleen more than fresh RBCs. When RBCs were passed through a recently developed spleen-mimicking device (78), the percentage of RBCs that did not pass the device was increased with storage time (Figure 2.3). The differ-ence between week 2 and week 4 may be explained by the loss of damaged RBCs. Curiously, these pilot data suggest that hyperosmotic stress may actually facili-tate trafficking through the spleen, which would induce spleen-dependent vesic-ulation and/or phagocytosis (252). A similar function has been postulated for the ligation of complement receptor 1-initiated increase in deformability (103).
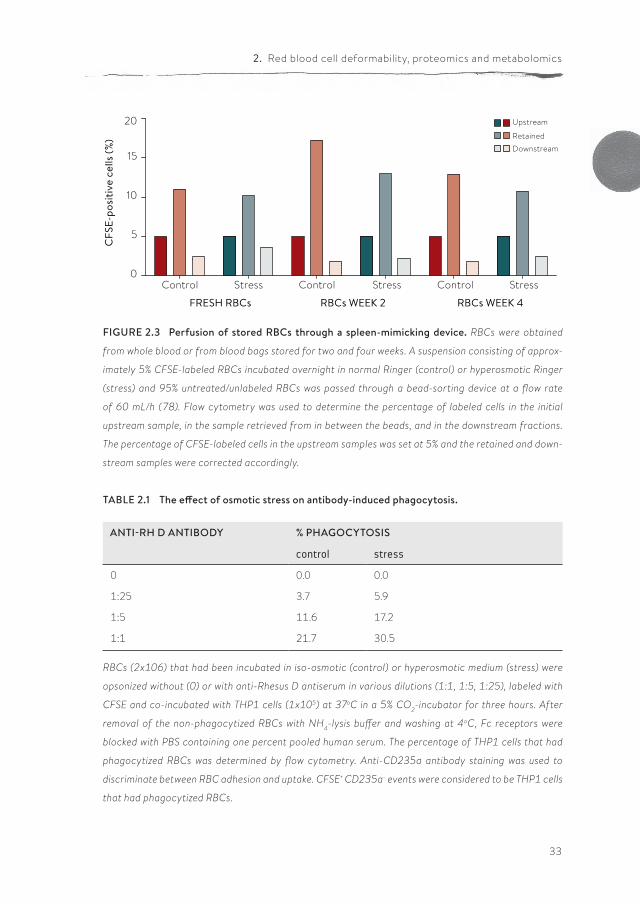
Phosphatidylserine is widely recognized as a signal for macrophage recognition and RBC removal (147). Although increased PS exposure by itself may not be sufficient for removal, it may induce adherence of RBCs to other cells, such as the blood vessel endothelium, and thereby facilitate the induction of phagocy-tosis. We found that a hyperosmotic stress- induced increase in PS exposure was associated with an increase in antibody-induced phagocytosis of stored RBCs by human monocyte-like THP1 cells (Table 2.1). Thus, a stress-induced alteration in passage through the spleen may be functionally associated with increased phagocytosis.
Red blood cell homeostasis
32
FIGURE 2.2 Effect of storage time and stress on osmotic fragility as measured with osmotic
gradient ektacytometry. Osmotic gradient ektacytometry, i.e. RBC deformability measured during a
gradient of increasing osmolality (osmoscan) was performed using a the new LORCA MaxSis (see also
the legend to Figure 2.1). Osmoscans of fresh RBCs, RBCs with a storage time of 2 weeks and RBCs with
a storage time of 5 weeks were acquired after overnight incubation in normal Ringer (control) or hyper-
osmotic Ringer (stress) at 37°C (36, 245).
FRESH RBCs - CONTROL
0 100 200 300 400 5000.0
0.1
0.2
0.3
0.4
0.5
Osmolality
Elon
gatio
n In
dex
FRESH RBCs - STRESS
0 100 200 300 400 5000.0
0.1
0.2
0.3
0.4
0.5
Osmolality
Elon
gatio
n In
dex
RBCs WEEK 2 - CONTROL
0 100 200 300 400 5000.0
0.1
0.2
0.3
0.4
0.5
Osmolality
Elon
gatio
n In
dex
RBCs WEEK 2 - STRESS
0 100 200 300 400 5000.0
0.1
0.2
0.3
0.4
0.5
Osmolality
Elon
gatio
n In
dex
RBCs WEEK 5 - CONTROL
0 100 200 300 400 5000.0
0.1
0.2
0.3
0.4
0.5
Osmolality
Elon
gatio
n In
dex
RBCs WEEK 5 - STRESS
0 100 200 300 400 5000.0
0.1
0.2
0.3
0.4
0.5
Osmolality
Elon
gatio
n In
dex
2. Red blood cell deformability, proteomics and metabolomics
33
TABLE 2.1 The effect of osmotic stress on antibody-induced phagocytosis.
ANTI-RH D ANTIBODY % PHAGOCYTOSIS
control stress
0 0.0 0.0
1:25 3.7 5.9
1:5 11.6 17.2
1:1 21.7 30.5
RBCs (2x10⁶) that had been incubated in iso-osmotic (control) or hyperosmotic medium (stress) were
opsonized without (0) or with anti-Rhesus D antiserum in various dilutions (1:1, 1:5, 1:25), labeled with
CFSE and co-incubated with THP1 cells (1x10⁵) at 37oC in a 5% CO2-incubator for three hours. After
removal of the non-phagocytized RBCs with NH4-lysis buffer and washing at 4oC, Fc receptors were
blocked with PBS containing one percent pooled human serum. The percentage of THP1 cells that had
phagocytized RBCs was determined by flow cytometry. Anti-CD235a antibody staining was used to
discriminate between RBC adhesion and uptake. CFSE+ CD235a- events were considered to be THP1 cells
that had phagocytized RBCs.
FIGURE 2.3 Perfusion of stored RBCs through a spleen-mimicking device. RBCs were obtained
from whole blood or from blood bags stored for two and four weeks. A suspension consisting of approx-
imately 5% CFSE-labeled RBCs incubated overnight in normal Ringer (control) or hyperosmotic Ringer
(stress) and 95% untreated/unlabeled RBCs was passed through a bead-sorting device at a flow rate
of 60 mL/h (78). Flow cytometry was used to determine the percentage of labeled cells in the initial
upstream sample, in the sample retrieved from in between the beads, and in the downstream fractions.
The percentage of CFSE-labeled cells in the upstream samples was set at 5% and the retained and down-
stream samples were corrected accordingly.
Control Stress Control Stress Control Stress0
5
10
15
20 Upstream
RetainedDownstream
FRESH RBCs RBCs WEEK 2 RBCs WEEK 4
CFS
E-po
sitiv
e ce
lls (%
)
Red blood cell homeostasis
34
Storage, deformability, proteomics and metabolomics
The presently available data, confirmed and extended by our own preliminary data using the spleen-mimicking device and osmoscan, suggest that the most pronounced effect of the changes RBCs undergo during blood bank storage may not only be a decreased deformability in the circulation, but also a decreased capacity to pass through the spleen. Since the spleen facilitates vesiculation and thereby possibly the removal of damaged membrane patches enriched in removal signals (252, 253), this may result in accelerated removal of stored RBCs. Also, a comparison of the osmoscan (Figure 2.2) and spleen-mimicking device data (Figure 2.3) indicates that the decrease in MCHC during the first weeks of storage, that by itself would result in an increase in deformability, is not a major determinant of changes in deformability of transfused RBCs in all relevant phys-iological conditions.Therefore, identification of the storage-associated alterations in the interaction between the cytoskeleton and the lipid bilayer that determine membrane elas-ticity, may be instrumental in identifying the processes that trigger deformabili-ty-linked removal of transfused RBCs. In most recent theories on the function-ally relevant changes in the membrane composition of stored RBCs, alterations in band 3 occupy a central position. Storage-associated breakdown as well as aggregation of band 3 have been observed by biochemical and immunochemical analysis (9, 28, 33, 144, 177). Together with proteomic data, these analyses show that breakdown of band 3, ankyrin and spectrin, and membrane accumulation of hemoglobin occur mainly after three weeks of storage, but that the effect of these processes are already detectable within the first two weeks of storage (38, 59, 177). The proteomic data also emphasize the importance of the 'repair and destroy' proteins that protect against oxidative stress and unfolding (104), and warrant a closer, experimental look at the changes in membrane-bound chap-erone proteins, proteasome components, and small G proteins already observed in the first weeks of storage (38).
Already during the first days of storage, signs of oxidation are observed in the cytoskeletal proteins 4.2 and 4.1, spectrin, and in band 3. These are followed by breakdown of actin, GAPDH, band 4.9 and ankyrin, as well as crosslinking of spectrin (61). These data indicate that oxidative damage of membrane and membrane-associated proteins may precede proteolysis.
2. Red blood cell deformability, proteomics and metabolomics
35
Thus, an oxidation-induced alteration of the linkage between membrane and cytoskeleton is a possible molecular mechanism causing the observed changes in deformability as revealed by the osmoscan and spleen-mimicking device data that warrants further investigation. Oxidation may influence the phosphoryla-tion status of band 3, and thereby affect the interaction between membrane and cytoskeleton (196, 197). Recent research on signaling in RBCs strongly suggests that a change in the interaction between integral membrane and cytoskeleton proteins, possibly caused by decreased phosphorylation, is the most likely reason for the early storage-associated susceptibility to the osmotic stress-induced decrease in deformability. Casein kinase II-catalyzed phosphorylation of beta spectrin and protein kinase C-catalyzed phosphorylation of protein 4.1 are asso-ciated with a complement receptor-mediated increase in deformability (103). These data confirm the involvement of serine phosphorylation of spectrin in the mechanical properties of the RBC membrane (172). Phosphorylation of band 4.1 promotes dissociation of actin from the cytoskeleton, also contributing to an increase in deformability (74, 171). Also, Lyn and/or Syk-catalyzed tyrosine phos-phorylation of the cytoplasmic domain of band 3 is associated with a decreased binding of the band 3 with the cytoskeleton, and with a 'vesiculating' morphology (95). Syk has a high preference for oxidized band 3 (197), which may be rele-vant in view of the early oxidation events during storage (61). Recent (phospho)proteomic-inspired data show an association between Lyn signaling and altered cytoskeleton-membrane interaction, resulting in an abnormal cell shape (71).
Also, altered phosphorylation may be responsible for the metabolic changes, such as the recently described increase in glycolytic intermediates within the first two weeks of storage (59, 102). The rate of glycolysis is influenced by the stor-age-associated decrease in pH and NAD+, but we postulate that the metabolic changes are mainly due to alterations in band 3 structure and function. The cyto-plasmic domain of band 3 has a high affinity for key enzymes of the glycolysis, and binding is regulated by phosphorylation (46, 163).
Red blood cell homeostasis
36
Conclusions and perspectives
The published data together with our results presented here support the theory that phosphorylation-driven changes in the RBC membrane during blood bank processing and especially in the first two weeks of storage are responsible for the accompanying changes in deformability. After 14 to 21 days of storage, func-tionally relevant molecular changes are likely to become irreversible, since they comprise progressive proteolysis and vesicle formation. Uncovering the trig-gering events and the underlying signaling pathways will be instrumental in under-standing and preventing the untimely disappearance of a considerable fraction of the transfused RBCs within the first hours after transfusion.
In our perspective, the most fruitful approach to elucidate the basis for reduced RBC survival after transfusion starts with investigating the effects of signal-ing-based manipulation of RBCs in vitro on functionally relevant parameters. These parameters should be informative on the activation of, and recognition and removal by the immune system, on deformability in the capillaries and in the spleen, and on the susceptibility to osmotic stress, as may be critical during passage of transfused RBCs through the kidneys (36, 149). Proteomics and metabolomics will be instrumental in analyzing the accompanying changes in membrane structure. The main challenge is the development of biologically rele-vant read-out systems, and the transition of blood bank research from quality control in the blood bag to quality control in the patient.

2. Red blood cell deformability, proteomics and metabolomics
37

39
PUBLISHED AS:
Judith C. A. Cluitmans1 , Venkatachalam Chokkalingam2, Arno M. Janssen3, Roland Brock1,
Wilhelm T. S. Huck2 and Giel J. C. G. M. Bosman1
1 Department of Biochemistry, Radboud Institute for Molecular Life Sciences, Radboud
University Medical Centre, Geert Grooteplein 28, 6525 GA Nijmegen,The Netherlands
2 Department of Physical Organic Chemistry, Radboud University Nijmegen, Institute for
Molecules and Materials, Heyendaalseweg 135, 6525 AJ Nijmegen,The Netherlands
3 Department of Neurology, Radboud University Medical Centre, Donders Institute for Brain,
Cognition and Behaviour, Reinier Postlaan 4, 6525 CG Nijmegen,The Netherlands
BioMed Research International, vol. 2014, Article ID 764268, 9 pages, 2014.
doi:10.1155/2014/764268
ALTERATIONS IN RED BLOOD CELL deformability:±
A MICROFLUIDIC APPROACH
40
Red blood cell homeostasis
Abstract
Red blood cells (RBCs) undergo extensive deformation when travelling through the microcapillaries. Deformability, the combined result of properties of the membrane-cytoskeleton complex, the surface area-to-volume ratio and the hemoglobin content, is a critical determinant of capillary blood flow. During blood bank storage and in many pathophysiological conditions, RBC morphology changes, which has been suggested to be associated with decreased deforma-bility and removal of RBC. While various techniques provide information on the rheological properties of stored RBCs, their clinical significance is controversial. We developed a microfluidic approach for evaluating RBC deformability in a phys-iologically meaningful and clinically significant manner. Unlike other techniques, our method enables a high-throughput determination of changes in deforma-tion capacity to provide statistically significant data, while providing morpho-logical information at the single cell level. Our data show that, under conditions that closely mimic capillary dimensions and flow, the capacity to deform and to relax are not affected during storage in the blood bank. Our data also show that altered cell morphology by itself does not necessarily affect deformability.
41
3. Microfluidic analysis of RBC deformability
Introduction
During its life span of approximately 120 days, a red blood cell (RBC) makes about 160,000 round-trips between the lungs and the tissues (110). Its high flexibility enables passage through microcapillaries, some of which have a diameter smaller than the RBCs themselves, thereby ensuring transport of oxygen and carbon dioxide throughout the body. Within the microcapillaries, RBCs repeatedly change from a discocyte shape to an axisymmetric bullet-like shape, depending on the flow properties and microcapillary diameter, and back to a discocyte shape within the venules (234). This extensive deformation and relaxation, which is a critical parameter of the blood flow, is the combined result of the elastic properties of the membrane-cytoskeleton complex, the surface area-to-volume ratio and the viscosity as determined by the hemoglobin content (183).
During storage in the blood bank, RBCs undergo several structural and func-tional changes (120). Some of these changes are likely to induce the clearance of up to 30% of the transfused RBCs from the circulation within 24 hours after transfusion (167). One possible explanation for this disappearance may be a crit-ical decrease in deformability during storage (54, 98), which could lead to a decrease in the capacity to pass the narrow inter-endothelial slits in the spleen, and a concomitant increase in susceptibility to phagocytosis (66). Also, various RBC-centered pathophysiological conditions that are associated with micro-vascular disorders are associated with altered RBC deformabilty (48, 181, 186). However, little is known on the underlying molecular mechanisms.
A number of techniques have been developed to quantify RBC deformability. The available methods can be divided into two categories: single-cell tech-niques, such as micropipette aspiration and optical tweezers, and measurement on whole blood or diluted RBC suspensions, such as filtration and ektacytometry (190). Single-cell techniques, while precise, make it difficult to obtain statistically significant data, whereas the RBC suspension techniques impose flow geome-tries that are far from those actually experienced by RBCs in human capillaries. Also, these techniques are only able to measure flow behavior of populations or endpoint results. Because of these limitations, these techniques have yielded confusing and sometimes even conflicting results (5, 117, 119, 183). The perfusion of RBCs through microcapillaries provides an alternative and more direct means to address RBC deformability (151, 237). Most work in this area so far has focused
42
Red blood cell homeostasis
on understanding the physical rather than the biological aspects of RBC deform-ability (40, 236, 237, 257). Therefore, we developed a microfluidic system for the study of red blood cell flow behavior in a microcirculation-mimicking network. In addition to assessing deformation in microchannels with dimensions similar to those of microcapillaries, we also monitored relaxation to the discocyte shape. Using high-temporal resolution imaging, we could record time-lapse videos of RBCs in the narrow channels and the relaxation zones. Deformation and relax-ation were analyzed by automated image processing that provides statistically significant data. This approach enables to address the effect of heterogeneity within the RBC population. The visual aspect of our approach makes it possible to relate the relaxed morphology to the deformed state on the single cell level. These characteristics make our microfluidic system useful not only for identifi-cation of the molecular determinants of RBC deformability, but also for evalua-tion of the effect of RBC pathology (abnormal hemoglobins, membranopathies and enzyme deficiencies) on the microcirculation, and of the consequences of pathological conditions such as systemic inflammation or cardiovascular disease on RBC deformability.
After establishing the conditions to measure RBC deformability in a physio-logically meaningful and clinically significant manner, we studied the associa-tion between blood bank storage and deformability, since this could serve as a possible explanation for the considerable loss of RBCs shortly after transfusion, and for the mostly unknown relationship between blood bank quality parameters and RBC function and behavior after transfusion (120, 167).
Materials and methods
Ethics statementAll procedures followed were in accordance with the ethical standards of the committee on human experimentation (CMO NL nr.: 45934.091.13). Written informed consent was obtained from all blood donors participating in this study.
RBC sample preparationExperiments were performed with RBCs from five transfusion units that had been collected, processed and stored following standard Dutch blood bank proce-dures, including removal of buffy coat, leukoreduction and storage in saline-ade-
43
3. Microfluidic analysis of RBC deformability
nine-glucose-mannitol. RBCs were washed to remove medium, plasma, and vesi-cles using Ringer solution (125 mmol/L NaCl, 5 mmol/L KCl, 1 mmol/L MgSO4, 2.5 mmol/L CaCl2, 5 mmol/L glucose, 32 mmol/L HEPES/NaOH, pH 7.4) by repeated centrifugation (5 min, 1550g). Fresh RBCs were isolated from 5 ml whole blood (EDTA), donated by healthy volunteers. RBC fractionation according to cell density was performed using a discontinuous Percoll gradient consisting of six layers ranging from 40% Percoll to 80% Percoll as described previously (24). The RBCs were combined into four fractions: fraction 1, 61% Percoll + 64.5% Percoll; fraction 2, 67.5% Percoll; fraction 3, 71% Percoll; fraction 4, 80% Percoll. All deformability analyses were performed in Ringer containing 1% bovine serum albumin (BSA, Sigma-Aldrich, St. Louis MO, USA).
Treatment of RBCsIn order to investigate the contribution of the various cell components to the deformability in our microfluidic system, RBCs were incubated for 20 min at room temperature with 0.05% glutaraldehyde (GA), obtained by dilution of a 25% GA-stock solution (Sigma-Aldrich, St. Louis MO, USA) with Ringer. Alter-natively, treatment with lysophosphatidylcholine (LPC) (Sigma-Aldrich, St. Louis MO, USA) consisted of incubation at room temperature at 10% hematocrit for five minutes with 5 to 10 uM LPC in Ringer.
Phosphatidylserine measurementsThe percentage of phosphatidylserine (PS)-exposing RBCs, a physiological indi-cation for the possibly damaging effect of the stress that the RBCs may have experienced, was determined as described before (36). In short, RBCs were incu-bated for 30 min at room temperature in the dark in Ringer with Annexin-V-FLUOS (1:25, Roche, Basel, Switzerland) to label PS-exposing cells. The RBCs were analyzed with a flow cytometer (FACScan, Becton Dickinson, Franklin Lakes, NJ), using its accompanying software (CELLQUEST, Becton Dickinson). The data were analyzed with Summit 4.3. Results are expressed as percentages of Annexin V–positive RBCs.
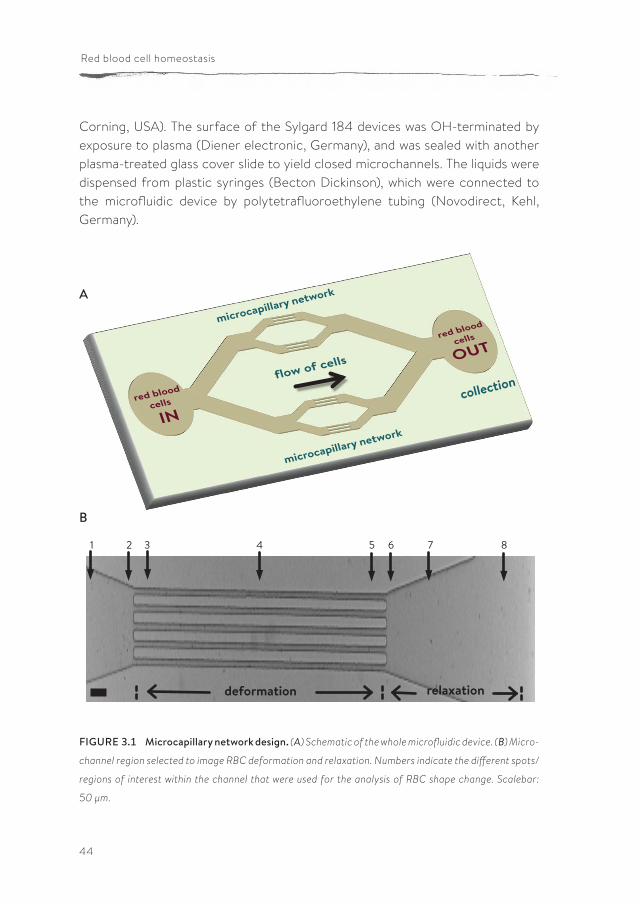
Microchannel fabricationSoft lithographic techniques were used to fabricate a microcapillary network of 10 µm deep channels (Figure 3.1; (255, 256)). The microfluidic device was molded against an SU-8 photoresist structure on a silicon wafer using a commercially available poly(dimethylsiloxane) (PDMS) silicone elastomer (Sylgard 184, Dow
44
Red blood cell homeostasis
Corning, USA). The surface of the Sylgard 184 devices was OH-terminated by exposure to plasma (Diener electronic, Germany), and was sealed with another plasma-treated glass cover slide to yield closed microchannels. The liquids were dispensed from plastic syringes (Becton Dickinson), which were connected to the microfluidic device by polytetrafluoroethylene tubing (Novodirect, Kehl, Germany).
FIGURE 3.1 Microcapillary network design. (A) Schematic of the whole microfluidic device. (B) Micro-
channel region selected to image RBC deformation and relaxation. Numbers indicate the different spots/
regions of interest within the channel that were used for the analysis of RBC shape change. Scalebar:
50 µm.
1 2 3 4 5 6 7 8
relaxationdeformation
A
B
45
3. Microfluidic analysis of RBC deformability
Experimental setup and data analysisFor monitoring RBCs in microfluidic flow, cells were diluted to a concentra-tion corresponding to a hematocrit of 2%. The cells were perfused through the microfluidic channels with computer-controlled syringe pumps (neMESYS, Cetoni, Germany) to enable accurate, constant volumetric flow rates. Images of the field-of-view were recorded (with up to 1250 frames per second) for quan-titative image processing. Flow of cells was observed through a 100X oil immer-sion objective (Olympus UPLFLN 100X, N.A. 1.30) using an optical microscope (IX71, Olympus B.V., The Netherlands), equipped with a high speed CMOS camera (Phantom high speed camera, Vision Research, UK). High quality snapshots of RBCs were obtained using a short exposure time down to 10 µs. In each run, a sequence of images of approximately 20,000 was recorded. The videos were manually pre-processed with Image J to divide them into separate video files for the various regions of interest (ROIs; Figure 3.1B). Hereafter, RBC detec-tion and DI calculation were performed fully automatically with a custom-written MATLAB code. The grey scale video files from Image J are used as input, and the output consists of DI values for all detected RBCs in the input files. The auto-matic RBC detection and DI calculation are split up in seven steps. Each of the following steps was performed for each video file individually. First, a subset of frames (20 percent) was taken for analysis. Second, background filtering was performed on the subset of frames by subtracting an averaged image, based on multiple frames. This procedure eliminates static objects, such as the microfluidic channels. Third, the grey scale frame images were transformed into binary black-white images, based on a pre-set grey intensity threshold. Fourth, RBCs were detected per frame as white pixel clusters in the black-white images. Fifth, pixel clusters representing aggregated RBCs and incomplete RBCs on the edge of the field, were excluded automatically from the data set. Sixth, the length, width and area were automatically determined for each included RBC (white pixel cluster). Seventh, the deformation index (DI), defined as the ratio between the sides (DI = length/width) was calculated for each individual RBC.
Statistical analysisData analysis was performed using PASW Statistics 18 (IBM, New York, USA). All DI values are mean values, calculated from at least 800 events per sample (represented by 200-300 cells). A p-value less than 0.05 was considered statis-tically significant. Differences between the mean values were evaluated using one-way ANOVA, followed by least significant difference correction for multiple
46
Red blood cell homeostasis
comparisons. In a first approximation, it was assumed that repeated measure-ments did not influence the results. Linear regression was applied to verify that DI remained constant within the channels. In all cases, the t-test for individual regression coefficients showed that the slope did not contribute significantly to the linear model and hence could be omitted, leaving a constant value.
Results
We aimed to measure RBC flexibility in a clinical context and under physiologi-cally relevant conditions. Therefore, next to assessing the capacity of RBCs to deform in narrow channels, we also addressed relaxation upon exit from these channels. Furthermore, given the heterogeneity in RBC populations from one donor (83, 123), we also aimed to obtain data at a single cell level. In order to meet these requirements, we established a microfluidic system with high-speed image acquisition and quantitative image analysis (Figure 3.1). The parallel array of microfluidic channels not only enhances throughput, but also enables collection of sufficient numbers of RBCs for biochemical analysis.
To establish the physiologically relevant conditions for quantitatively assessing RBC deformation in flow through narrow microchannels, we examined the effect of length and width of the channels, and the flow velocities along these channels. A channel length of 1000 µm was selected because at that length all RBCs exhib-ited the axisymmetric bullet-like shape found in the microcirculation in vivo. The deformation channels open into a wider region to allow the cells to relax back to their original shape (Figure 3.1). Analysis of the flexibility was performed at the exit of the deformation channels, enabling a simultaneous detection of the deformation and relaxation of a single RBC.
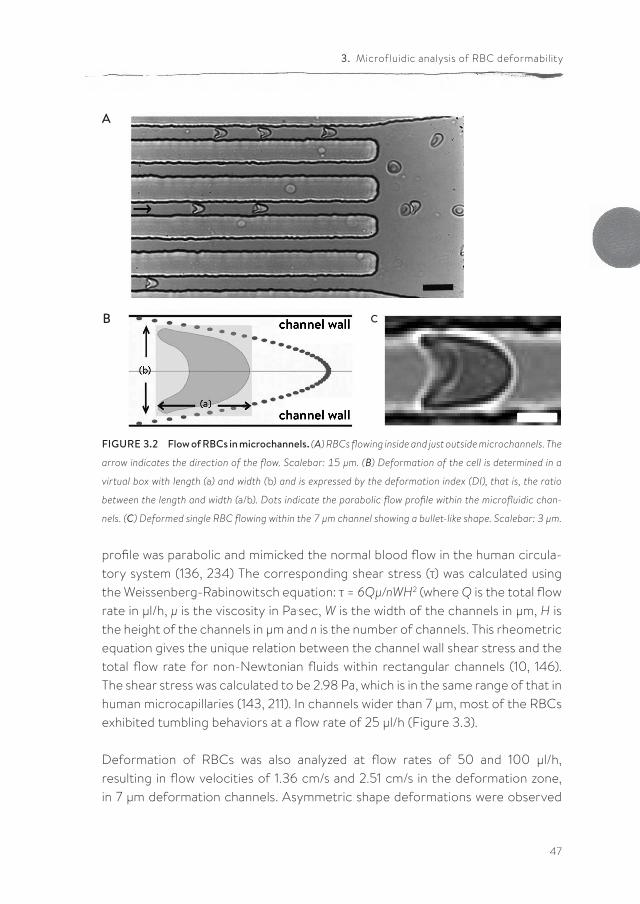
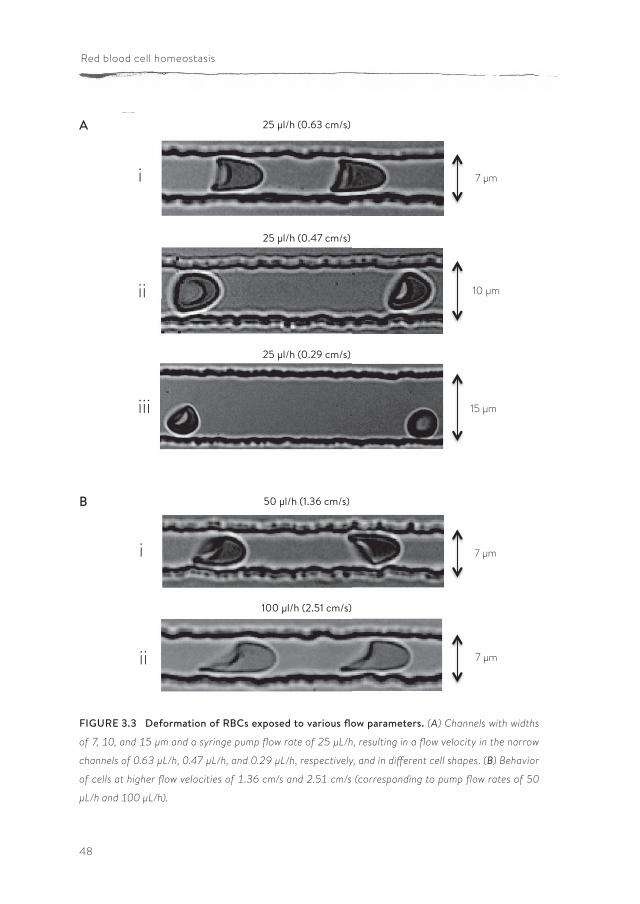
The RBCs exhibited a bullet-like shape in the deformation part (Figure 3.2). This RBC deformation in the narrow channels is expressed as the Deformation Index (DI), which is defined as the ratio between the length (A) and width (B) of the RBC during flow within this channel (Figure 3.2). In order to mimic flow condi-tions in vivo, the width of the microchannels was varied. In the smallest channel with a width of 7 µm, at a flow rate of 25 µl/h and a flow velocity of 0.63 cm/s in the narrow part of the channel, all RBCs showed the typical axisymmetric bullet-like shape (Figure 3.3) as described in vivo (234). Under these conditions, the flow
47
3. Microfluidic analysis of RBC deformability
FIGURE 3.2 Flow of RBCs in microchannels. (A) RBCs flowing inside and just outside microchannels. The
arrow indicates the direction of the flow. Scalebar: 15 µm. (B) Deformation of the cell is determined in a
virtual box with length (a) and width (b) and is expressed by the deformation index (DI), that is, the ratio
between the length and width (a/b). Dots indicate the parabolic flow profile within the microfluidic chan-
nels. (C) Deformed single RBC flowing within the 7 µm channel showing a bullet-like shape. Scalebar: 3 µm.
profile was parabolic and mimicked the normal blood flow in the human circula-tory system (136, 234) The corresponding shear stress (τ) was calculated using the Weissenberg-Rabinowitsch equation: τ = 6Qµ/nWH2 (where Q is the total flow rate in µl/h, µ is the viscosity in Pa.sec, W is the width of the channels in µm, H is the height of the channels in µm and n is the number of channels. This rheometric equation gives the unique relation between the channel wall shear stress and the total flow rate for non-Newtonian fluids within rectangular channels (10, 146). The shear stress was calculated to be 2.98 Pa, which is in the same range of that in human microcapillaries (143, 211). In channels wider than 7 µm, most of the RBCs exhibited tumbling behaviors at a flow rate of 25 µl/h (Figure 3.3).
Deformation of RBCs was also analyzed at flow rates of 50 and 100 µl/h, resulting in flow velocities of 1.36 cm/s and 2.51 cm/s in the deformation zone, in 7 µm deformation channels. Asymmetric shape deformations were observed
A
B C
48
Red blood cell homeostasis
FIGURE 3.3 Deformation of RBCs exposed to various flow parameters. (A) Channels with widths
of 7, 10, and 15 µm and a syringe pump flow rate of 25 µL/h, resulting in a flow velocity in the narrow
channels of 0.63 µL/h, 0.47 µL/h, and 0.29 µL/h, respectively, and in different cell shapes. (B) Behavior
of cells at higher flow velocities of 1.36 cm/s and 2.51 cm/s (corresponding to pump flow rates of 50
µL/h and 100 µL/h).
i
ii
iii
i
ii
&#'( #
)*# '( #
)+# '( #
&#'( #
&#'( #
,+#
,+# '- ./#0*"6(.45#
,+# '- ./#0*",7#3(.45#
+*# '- ./#0)"21#3(.45#
)**# '- ./#0,"+)#3(.45#
25 μl/h (0.63 cm/s)
7 μm
10 μm
15 μm
7 μm
7 μm
100 μl/h (2.51 cm/s)
50 μl/h (1.36 cm/s)
25 μl/h (0.29 cm/s)
25 μl/h (0.47 cm/s)
A
B
49
3. Microfluidic analysis of RBC deformability
in channels for flow velocities above 0.63 cm/sec (Figure 3.3), resulting from out-of-axis cell position. The behavior of RBCs in 7 µm channels at a flow velocity of 0.63 cm/s closely resembled that in the microcirculation in vivo (143, 211, 234). Therefore, these conditions were used in further analyses. RBCs were analyzed in Ringer solution instead of autologous plasma for ease of RBC preparation, and because plasma has a higher risk of clogging the channels; this did not lead to significant diffe rences in the deformation index and relax-ation (DI 1.63 ± 0.29 in Ringer vs. 1.61 ± 0.10 in plasma).
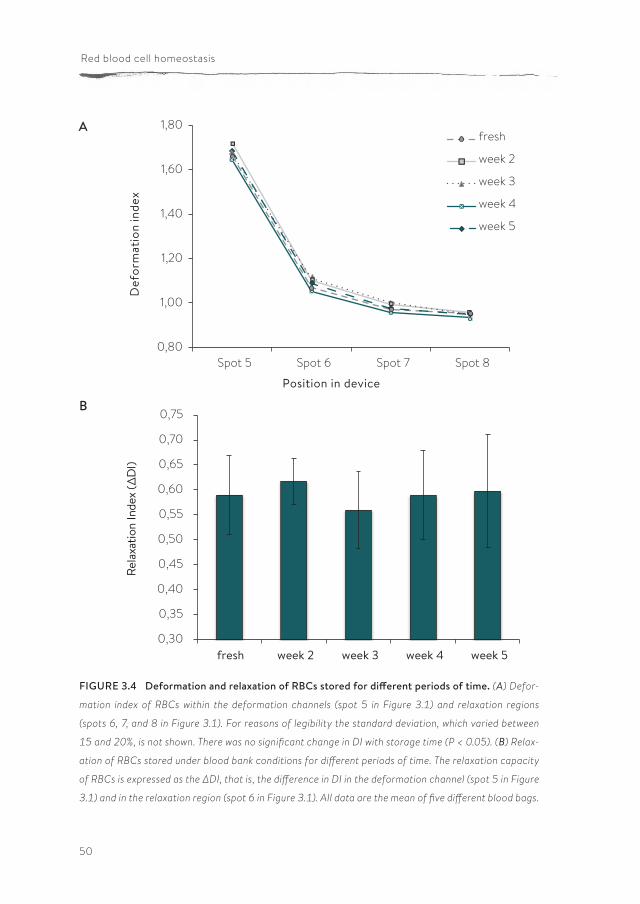
The microfluidic device enables the collection of RBCs for off-line analyses after passage through the device. The parallel array of microfluidic channels and a flow rate of 25 µl/h enable the collection of 10 million cells within 20-30 minutes for off-chip analysis. PS exposure on the outer membrane is a stress signal which facilitates recognition and removal by macrophages (36, 147). We used the possibility to collect RBCs after passage through the microchannels in order to evaluate any putative artifacts that would hamper the translation of our in vitro data to RBC behavior in vivo. Cells were collected at the end of the device and stained with Annexin-V. Flow cytometric analysis showed that any mechanical stress within the microfluidic device did not cause PS exposure (2.46 +/- 0.01 % PS-exposing cells before the passage through channels, compared to 2.24 +/- 0.01 % after passage). This observation supports the suitability of our set-up in mimicking the conditions experienced in vivo.Using our microfluidics setup, we investigated the effect of storage time in blood bank units on deformability and relaxation in a microcapillary-simulating environ-ment. After transfusion, up to 30% of the transfused RBCs are cleared from the circulation within 24 hours, and changes in deformation may contribute to this phenomenon (98, 167). RBCs of different storage times were perfused through the microfluidic device. In order to compare deformability, the DI of the cells was calculated at different locations within the device, in the microchannels as well as in the relaxation zone. Our data showed that storage in blood bank conditions for up to five weeks (the maximal storage time in the Netherlands) did not lead to a significant decrease in the capacity to deform to a bullet shape or to relax to a discoid shape afterwards (Figure 3.4). There were no indications for loss of RBCs or hemolysis in any of the samples, indicating the absence of a selection bias. The relatively large standard deviation suggests a large variation in deformation capacity of RBCs from different donors. This was confirmed by frequency distri-bution analysis of the DI values (Figure 3.5).
50
Red blood cell homeostasis
FIGURE 3.4 Deformation and relaxation of RBCs stored for different periods of time. (A) Defor-
mation index of RBCs within the deformation channels (spot 5 in Figure 3.1) and relaxation regions
(spots 6, 7, and 8 in Figure 3.1). For reasons of legibility the standard deviation, which varied between
15 and 20%, is not shown. There was no significant change in DI with storage time (P < 0.05). (B) Relax-
ation of RBCs stored under blood bank conditions for different periods of time. The relaxation capacity
of RBCs is expressed as the ΔDI, that is, the difference in DI in the deformation channel (spot 5 in Figure
3.1) and in the relaxation region (spot 6 in Figure 3.1). All data are the mean of five different blood bags.
0,80
1,00
1,20
1,40
1,60
1,80
Spot 5 Spot 6 Spot 7 Spot 8
Def
orm
atio
n in
dex
Position in device
fresh
week 2
week 3
week 4
week 5
0,30
0,35
0,40
0,45
0,50
0,55
0,60
0,65
0,70
0,75
fresh week 2 week 3 week 4 week 5
Rela
xatio
n In
dex
(ΔD
I)A
B

51
3. Microfluidic analysis of RBC deformability
Since the standard deviation within the individual samples also suggested a heterogeneous deformation capacity, we postulated that this might be associ-ated with an heterogeneity in cell morphology. It is known that storage is asso-ciated with both a decrease in RBC density and an increase in abnormal cell morphology (20, 120). Therefore, we measured the deformation behavior of RBCs of various densities as obtained by Percoll density separation. Although the stored RBCs in the various Percoll fractions had distinct morphologies, with the more aberrant cell shapes in the more dense fractions as has also been described by others (20), the mean DI of the RBCs did not differ significantly between the fractions (data not shown). These data indicate that a non-discocyte morphology is not necessarily associated with decreased deformability as measured in capil-lary-mimicking conditions.
FIGURE 3.5 Donor heterogeneity in RBC deformability of RBCs. Given is the frequency distribu-
tion of DI for the RBCs from freshly drawn blood from two different donors. Per sample 250–350 events
are measured.
Donor A
Donor B0 0.50 2.51 1.5 2
0 0.5 2.51 1.5 2
0.04
0.02
0.06
0.080.10
0.120.140.160.18
0.030.02
0.040.050.06 0.07 0.080.090.10
0.010
DI Value
DI Value
Frac
tion
of to
tal p
opul
atio
nFr
actio
n of
tota
l pop
ulat
ion
52
Red blood cell homeostasis
Deformability is determined by the elastic properties of the membrane-cytoskel-eton complex, the surface area-to-volume ratio and the cellular viscosity, mostly determined by the hemoglobin concentration. In order to identify the contri-bution of these factors, we analyzed the deformation of RBCs that had been altered with glutaraldehyde or with LPC. Treatment with the fixative glutaralde-hyde, which diminishes the elasticity of the membrane-cytoskeleton complex, has been described to impair RBC filterability (229), whereas incubation with LPC, which leads to a decrease in the surface-to-volume ratio, has been described to induce an increase in splenic retention ex vivo (214). Most glutaraldehyde-treated RBCs kept their fixed morphology in the narrow channels, leading to a deforma-tion index that was significantly (p < 0.05) different from that of untreated cells (Figure 3.6). Control cells relaxed back to their discocyte shape within maximally 40 ms after exiting from the narrow channels into the wider region of the device, while the glutaraldehyde-treated RBCs kept the same fixed morphology also in this relaxation zone. The difference in DI for the glutaraldehyde-treated RBCs measured in the narrow channel and in the relaxation region is probably caused by of the tumbling behavior the cells exert in the relaxation area, where there are no physical restrictions. Treatment of RBCs with LPC did not show any signifi-cant effects on deformation index or relaxation (data not shown), indicating that changes in membrane stiffness as induced by glutaraldehyde fixation affect the deformation index in the 7 um width microcapillaries, while moderate changes in the surface-to-volume ratio do not.
Discussion
Here we demonstrate that high temporal resolution imaging of RBCs at the exit zone of narrow channels within a microfluidic device provides comprehensive infor-mation on their capacity to deform and subsequently relax to a discoid shape. Using single-cell imaging, high throughput for statistically significant data was obtained by virtue of fully automated image processing. Furthermore, by parallelization of several microchannels, sufficient throughput can be generated for off-line anal-ysis, e.g. using flow cytometry. In addition, the visual aspect of this method makes it possible to study subpopulations within one sample, making it an attractive method to study red cell pathologies. By analyzing cells at the exit zone of the narrow chan-nels, a simultaneous detection of a deformed and relaxing RBC can be performed, thereby correlating deformation behavior to specific morphology of RBCs in rest.
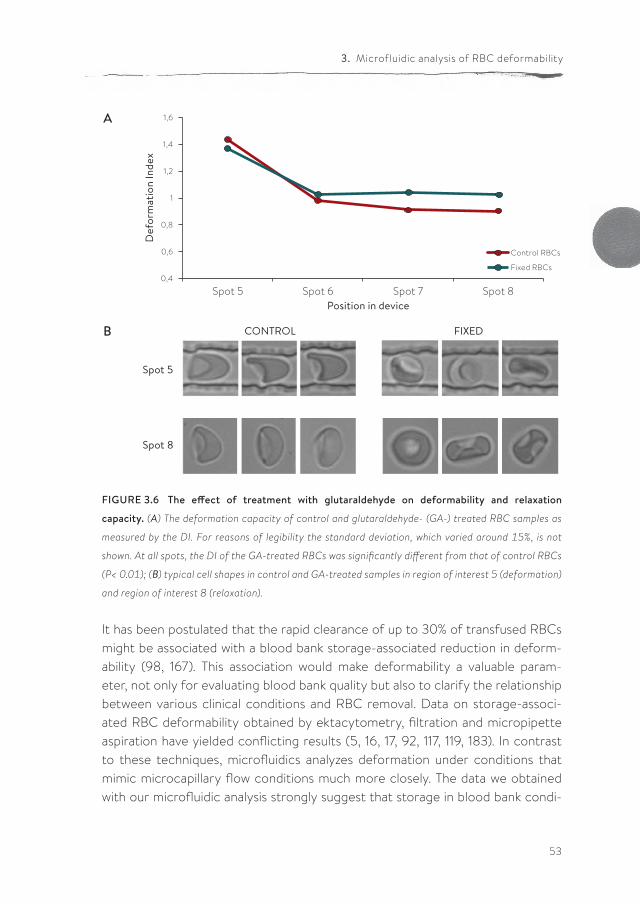
53
3. Microfluidic analysis of RBC deformability
It has been postulated that the rapid clearance of up to 30% of transfused RBCs might be associated with a blood bank storage-associated reduction in deform-ability (98, 167). This association would make deformability a valuable param-eter, not only for evaluating blood bank quality but also to clarify the relationship between various clinical conditions and RBC removal. Data on storage-associ-ated RBC deformability obtained by ektacytometry, filtration and micropipette aspiration have yielded conflicting results (5, 16, 17, 92, 117, 119, 183). In contrast to these techniques, microfluidics analyzes deformation under conditions that mimic microcapillary flow conditions much more closely. The data we obtained with our microfluidic analysis strongly suggest that storage in blood bank condi-
FIGURE 3.6 The effect of treatment with glutaraldehyde on deformability and relaxation
capacity. (A) The deformation capacity of control and glutaraldehyde- (GA-) treated RBC samples as
measured by the DI. For reasons of legibility the standard deviation, which varied around 15%, is not
shown. At all spots, the DI of the GA-treated RBCs was significantly different from that of control RBCs
(P< 0.01); (B) typical cell shapes in control and GA-treated samples in region of interest 5 (deformation)
and region of interest 8 (relaxation).
Spot 5
Spot 8
CONTROL FIXED
0,4
0,6
0,8
1
1,2
1,4
1,6
Spot 5 Spot 6 Spot 7 Spot 8
Control RBCs
Fixed RBCs
Def
orm
atio
n In
dex
Position in device
A
B
54
Red blood cell homeostasis
tions is not associated with alterations in deformability capacity of RBCs during their passage through the capillary system. Recent microfluidic data obtained with a comparable system also showed no significant effect of blood bank storage time on deformability, but a decrease in relaxation capacity (258). Interestingly, the latter was associated with an increase in the circularity distribution width, indi-cating that the relaxation capacity is more strongly associated with changes to a more spherical cell shape than the deformation index. Also, the data of the glutar-aldehyde-treated RBCs indicated that an increase in membrane stiffness leads to a decreased deformability in the narrow channels. It has been suggested that membrane loss by storage-associated vesiculation could be the main factor for a decreased deformability of red cells from transfusion units (98). However, the lack of an effect of LPC-induced increase in surface-to-volume ratio on the deforma-tion index or the relaxation index, indicates that moderate changes in surface-to-volume ratio by itself do not induce any aberrant behavior in microcapillaries. This is in line with our observations on the normal behavior of the most dense RBCs as obtained by separation on Percoll gradients. Nevertheless, more exten-sive changes in the surface-to-volume ratio could have an effect in conditions of more severe mechanical stress, as experienced by RBCs in the spleen (214).
Thus, all available data using a capillary-mimicking microfluidic approach suggest that the storage lesions, including the altered cell morphology, do not affect RBC behavior in the microcapillaries. However, an increased membrane rigidity in combination with an increased intracellular viscosity may be responsible for decreased capacity to pass through the spleen. These changes may be the effect of a vesiculation-induced increase in cellular hemoglobin concentration, and a concomitant loss of functional membrane-cytoskeletal anchorage proteins during aging in vivo and in vitro (34, 35). The loss of capacity to pass through the spleen may be detectable with the - more physically demanding - methods such as ektacytometry or the recently described spleen-mimicking device (78). Our data strengthen the hypothesis that removal of transfused RBCs is mainly caused by the appearance of removal signals.
In conclusion, we show that microfluidics, when geared to flow conditions in capillaries, can yield substantial information on RBC deformability. We expect this approach to become a valuable tool for providing insights into RBC behavior in transfusion and hematological research. Our microfluidic analysis may be

55
3. Microfluidic analysis of RBC deformability
especially useful in the elucidation of the biologically relevant factors that are responsible for the large variation in the quality of RBC concentrates. In addition, our setup may be useful in evaluating the effects of disorders such as cardiovas-cular disease or systemic inflammation on red blood cell function.

57
PUBLISHED AS: 7
Giel J.C.G.M. Bosman1, Judith C.A. Cluitmans1, Yvonne A.M. Groenen2, Jan M. Werre2, Frans L.A.
Willekens2, and Vera M.J. Novotny3
1 Department of Biochemistry and Nijmegen Centre for Molecular Life Sciences, Radboud
University Nijmegen Medical Centre, Nijmegen
2 Department of Clinical Chemistry, Rijnstate Hospital, Arnhem
3 Department of Hematology, Radboud University Nijmegen Medical Centre and Nijmegen
Institute for Infection, Inflammation and Immunity, Nijmegen, the Netherlands.
Transfusion 2011; 51 (5): 1072-107
SUSCEPTIBILITY TO HYPEROSMOTIC STRESS-INDUCED Phosphatidylserine EXPOSURE INCREASES DURING RED BLOOD CELL STORAGE
58
Red blood cell homeostasis
Abstract
Background During storage of red blood cell (RBCs) before transfusion, RBCs undergo a series of structural and functional changes that include the exposure of phos-phatidylserine (PS), a potent removal signal. It was postulated that, during blood bank storage, the susceptibility to stress-induced PS exposure increases, thereby rendering a considerable fraction of the RBCs susceptible to rapid removal after transfusion.
Study design and methodsRBCs were processed and stored following standard Dutch blood bank proce-dures. Samples were taken every week for up to 6 weeks and exposed to various stress conditions, such as hyperosmotic shock and energy depletion. The effect of these treatments on PS exposure was measured by flow cytometric analysis of annexin V binding. The same analyses were performed on RBCs that had been separated according to density using discontinuous Percoll gradients.
Results During storage under blood bank conditions, RBCs become increasingly suscep-tible to loss of phospholipid asymmetry induced by hyperosmotic shock and energy depletion. Especially the RBCs of higher densities, that have a smaller volume and an increased HbA1c content as is typical of aged RBCs, become increasingly susceptible with storage time.
Conclusions During storage, RBCs develop an increased susceptibility to stress-induced loss of phospholipid asymmetry that is especially associated with an aging phenotype. This increased susceptibility may be responsible for the rapid disappearance of a considerable fraction of the RBCs during the first 24 hours after transfusion.
59
4. Stress-induced PS after RBC storage
Introduction
During storage of red blood cells (RBCs) before transfusion, RBCs undergo a series of structural and functional changes. These include the loss of discoid morphology, changes in membrane organization as deduced from quantitative and qualitative data on membrane protein composition, decreases in the concen-tration of adenosine triphosphate (ATP) and 2,3-diphosphoglycerate acid, vesicle formation, and eventually lysis (29, 35, 122, 125). Although most of these changes are reversible in vitro, a considerable number of RBCs disappear from the circula-tion within the first hours after transfusion, even after less than 1 week of storage, during which these “storage lesions” are barely detectable (137). Thus, it has been postulated that RBCs undergo more subtle damage during processing and storage, such as glycation or oxidative damage to proteins and lipids, resulting in the exposure of efficient removal signals. These may be neoantigens that are iden-tical or related to physiological aging antigens on the integral membrane protein Band 3 and that are responsible for physiological immune recognition and removal of old RBCs in vivo (167). Alternatively, storage-associated loss of phospholipid asymmetry may result in exposure of phosphatidylserine (PS), an effective signal contributing to the recognition and phagocytosis of apoptotic cells and cell frag-ments (91). PS exposure has been implicated in removal of damaged RBCs (147).
Indications for both processes have been described in various blood bank storage conditions. However, a significant increase in binding of autologous antibodies and PS exposure was detectable only after prolonged storage periods and on much smaller cell numbers than the up to 25% that are removed from the circulation within the first 24 hours after transfusion (29, 35, 243). Thus, we postulate that blood processing and/or storage induce an increased susceptibility to the gener-ation or exposure of these removal signals after transfusion. Numerous data have been presented indicating a signaling complex leading to exposure of PS by RBCs subsequent to various forms of stress, such as hyperosmotic shock, oxidation, or energy depletion in vitro (149). Some of these “near-physiological” stress condi-tions, such as an increase in the osmotic value of the surrounding medium, are likely to be experienced by RBCs in vivo during their passage through the kidney (149). Therefore, we investigated the susceptibility of RBCs to stress-induced PS exposure during their storage in blood bank conditions. We also investigated the association of PS exposure during storage with other variables of RBC aging in vivo, such as cell density, cell volume, and HbA1c content.
60
Red blood cell homeostasis
Material and methods
Experiments were performed with RBCs from five RBC units of blood group A, Rhesus-positive donors that had been collected and processed according to standard Dutch blood bank protocols, including leukoreduction and storage in saline-adenine-glucose-mannitol. The concentrates were sampled every week. Samples of 2 to 5 mL were taken aseptically, and RBCs were washed to remove medium, plasma, and vesicles using Ringer’s solution (125 mmol/L NaCl, 5 mmol/L KCl, 1 mmol/L MgSO4, 2.5 mmol/L CaCl2, 5 mmol/L glucose, 32 mmol/L HEPES/ NaOH, pH 7.4) by repeated centrifugation (5 min, 1550 x g, 4°C). All experiments were performed in Ringer’s solution. Where indicated, osmolarity was increased by adding 400 mmol/L sucrose; extracellular Cl- was removed by replacing NaCl, KCl, and CaCl2 with Na-gluconate, K-gluconate, and Ca-gluco-nate, respectively; for energy depletion, glucose was omitted from the buffer.
RBC fractionation according to cell density was performed using a discontin-uous Percoll gradient consisting of six layers ranging from 40% Percoll (1.060 g/mL) to 80% Percoll (1.096 g/mL) as described previously (24). The RBCs were combined into four fractions: Fraction 1, 61% Percoll + 64.5% Percoll; Fraction 2, 67.5% Percoll; Fraction 3, 71% Percoll; and Fraction 4, 80% Percoll (Figure 4.1).
The relative content of the hemoglobin (Hb) subfractions was determined by means of ion-exchange high- performance liquid chromatography, after lysis of 100 mL of RBCs in 10 mmol/L malonic acid, 1 mmol/L NaCN, 15 mmol/L NaNO3, and 0.1% saponin for 30 minutes at 37°C and removal of cell debris by centrifu-gation for 30 minutes at 10,000 x g (251).
The stress treatments consisted of incubation of the RBCs at 4% hematocrit in a 96-well plate (U-form, Greiner Bio-One, Frickenhausen, Germany) in 200 mL of Ringer’s solution with or without 400 mmol/L sucrose or without glucose or chloride (see above) for 24 hours at 37°C in a humidified incubator. After this incubation, the RBCs were resuspended by gentle pipetting and 20 mL of the cell suspension was washed in 1 mL of Ringer’s solution by centrifugation (5 minutes, 1550 x g, 4°C). The RBC pellet was resuspended in 100 mL of Ringer’s and incubated for 30 to 60 minutes at room temperature in the dark with fluo-rescein isothiocyanate–labeled annexin V (1:25, Roche, Indianapolis, IN) to label exposed PS, with phycoerythrin-labeled CD235a (mouse IgG1, Clone 11E4B-7-6,
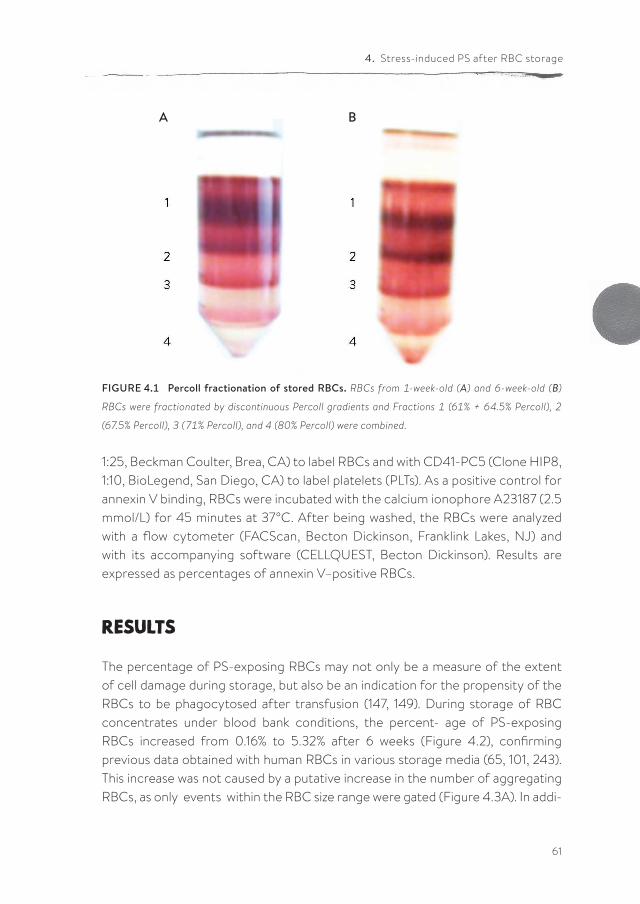
61
4. Stress-induced PS after RBC storage
1:25, Beckman Coulter, Brea, CA) to label RBCs and with CD41-PC5 (Clone HIP8, 1:10, BioLegend, San Diego, CA) to label platelets (PLTs). As a positive control for annexin V binding, RBCs were incubated with the calcium ionophore A23187 (2.5 mmol/L) for 45 minutes at 37°C. After being washed, the RBCs were analyzed with a flow cytometer (FACScan, Becton Dickinson, Franklink Lakes, NJ) and with its accompanying software (CELLQUEST, Becton Dickinson). Results are expressed as percentages of annexin V–positive RBCs.
Results
The percentage of PS-exposing RBCs may not only be a measure of the extent of cell damage during storage, but also be an indication for the propensity of the RBCs to be phagocytosed after transfusion (147, 149). During storage of RBC concentrates under blood bank conditions, the percent- age of PS-exposing RBCs increased from 0.16% to 5.32% after 6 weeks (Figure 4.2), confirming previous data obtained with human RBCs in various storage media (65, 101, 243). This increase was not caused by a putative increase in the number of aggregating RBCs, as only events within the RBC size range were gated (Figure 4.3A). In addi-
A B
FIGURE 4.1 Percoll fractionation of stored RBCs. RBCs from 1-week-old (A) and 6-week-old (B)
RBCs were fractionated by discontinuous Percoll gradients and Fractions 1 (61% + 64.5% Percoll), 2
(67.5% Percoll), 3 (71% Percoll), and 4 (80% Percoll) were combined.
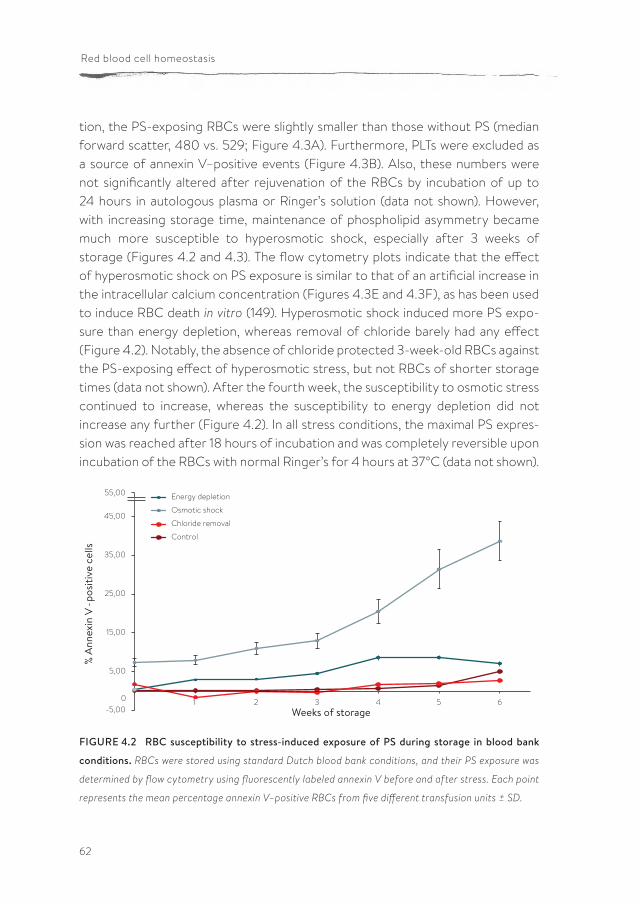
62
Red blood cell homeostasis
tion, the PS-exposing RBCs were slightly smaller than those without PS (median forward scatter, 480 vs. 529; Figure 4.3A). Furthermore, PLTs were excluded as a source of annexin V–positive events (Figure 4.3B). Also, these numbers were not significantly altered after rejuvenation of the RBCs by incubation of up to 24 hours in autologous plasma or Ringer’s solution (data not shown). However, with increasing storage time, maintenance of phospholipid asymmetry became much more susceptible to hyperosmotic shock, especially after 3 weeks of storage (Figures 4.2 and 4.3). The flow cytometry plots indicate that the effect of hyperosmotic shock on PS exposure is similar to that of an artificial increase in the intracellular calcium concentration (Figures 4.3E and 4.3F), as has been used to induce RBC death in vitro (149). Hyperosmotic shock induced more PS expo-sure than energy depletion, whereas removal of chloride barely had any effect (Figure 4.2). Notably, the absence of chloride protected 3-week-old RBCs against the PS-exposing effect of hyperosmotic stress, but not RBCs of shorter storage times (data not shown). After the fourth week, the susceptibility to osmotic stress continued to increase, whereas the susceptibility to energy depletion did not increase any further (Figure 4.2). In all stress conditions, the maximal PS expres-sion was reached after 18 hours of incubation and was completely reversible upon incubation of the RBCs with normal Ringer’s for 4 hours at 37°C (data not shown).
FIGURE 4.2 RBC susceptibility to stress-induced exposure of PS during storage in blood bank
conditions. RBCs were stored using standard Dutch blood bank conditions, and their PS exposure was
determined by flow cytometry using fluorescently labeled annexin V before and after stress. Each point
represents the mean percentage annexin V–positive RBCs from five different transfusion units ± SD.
-5,00
5,00
15,00
25,00
35,00
45,00
55,00
0 1 2 3 4 5 6
% A
nnex
in V
-pos
itive
cel
ls
Weeks of storage
Energy depletion
Osmotic shock
Chloride removal
Control
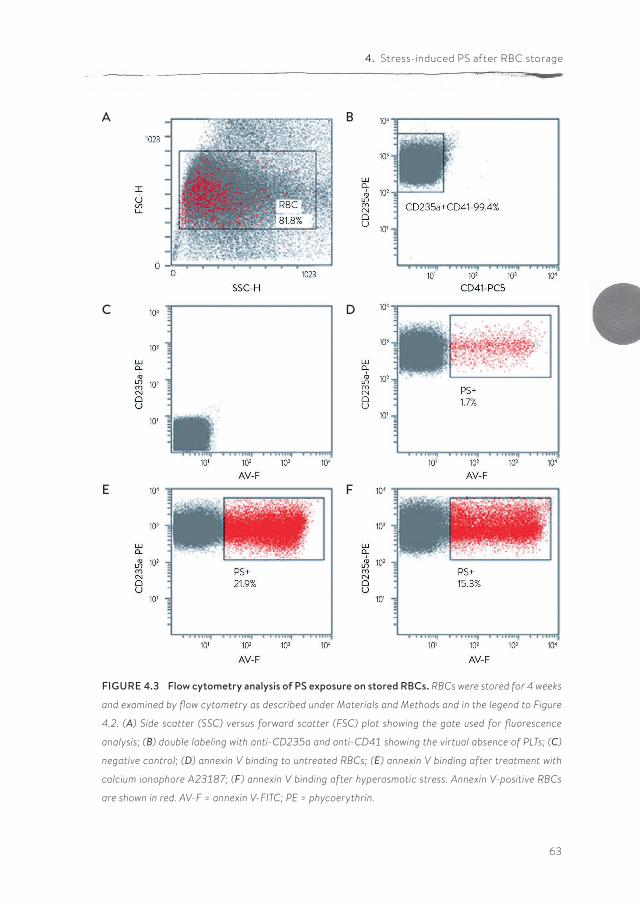
63
4. Stress-induced PS after RBC storage
FIGURE 4.3 Flow cytometry analysis of PS exposure on stored RBCs. RBCs were stored for 4 weeks
and examined by flow cytometry as described under Materials and Methods and in the legend to Figure
4.2. (A) Side scatter (SSC) versus forward scatter (FSC) plot showing the gate used for fluorescence
analysis; (B) double labeling with anti-CD235a and anti-CD41 showing the virtual absence of PLTs; (C)
negative control; (D) annexin V binding to untreated RBCs; (E) annexin V binding after treatment with
calcium ionophore A23187; (F) annexin V binding after hyperosmotic stress. Annexin V-positive RBCs
are shown in red. AV-F = annexin V-FITC; PE = phycoerythrin.
A
C
E
B
D
F
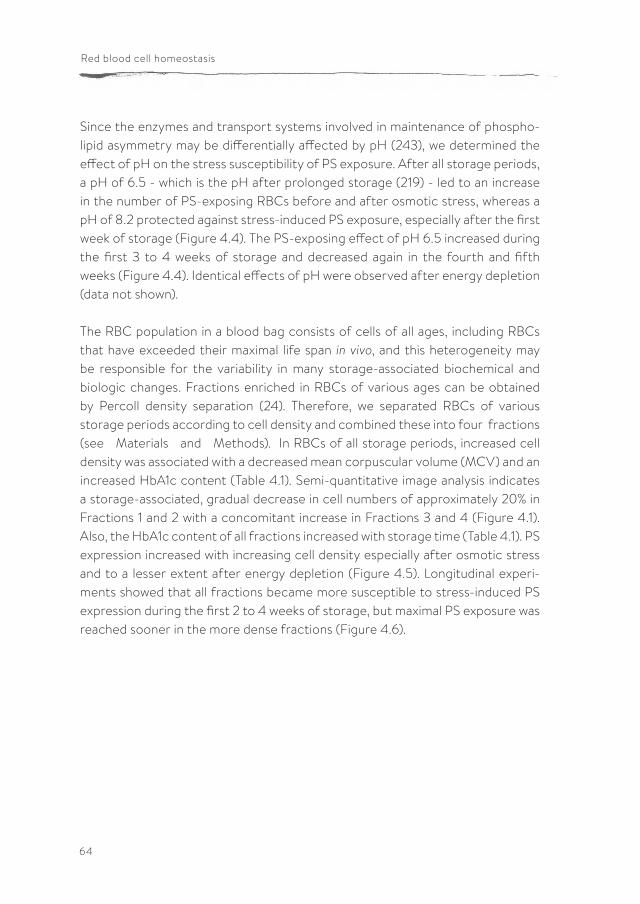
64
Red blood cell homeostasis
Since the enzymes and transport systems involved in maintenance of phospho-lipid asymmetry may be differentially affected by pH (243), we determined the effect of pH on the stress susceptibility of PS exposure. After all storage periods, a pH of 6.5 - which is the pH after prolonged storage (219) - led to an increase in the number of PS-exposing RBCs before and after osmotic stress, whereas a pH of 8.2 protected against stress-induced PS exposure, especially after the first week of storage (Figure 4.4). The PS-exposing effect of pH 6.5 increased during the first 3 to 4 weeks of storage and decreased again in the fourth and fifth weeks (Figure 4.4). Identical effects of pH were observed after energy depletion (data not shown).
The RBC population in a blood bag consists of cells of all ages, including RBCs that have exceeded their maximal life span in vivo, and this heterogeneity may be responsible for the variability in many storage-associated biochemical and biologic changes. Fractions enriched in RBCs of various ages can be obtained by Percoll density separation (24). Therefore, we separated RBCs of various storage periods according to cell density and combined these into four fractions (see Materials and Methods). In RBCs of all storage periods, increased cell density was associated with a decreased mean corpuscular volume (MCV) and an increased HbA1c content (Table 4.1). Semi-quantitative image analysis indicates a storage-associated, gradual decrease in cell numbers of approximately 20% in Fractions 1 and 2 with a concomitant increase in Fractions 3 and 4 (Figure 4.1). Also, the HbA1c content of all fractions increased with storage time (Table 4.1). PS expression increased with increasing cell density especially after osmotic stress and to a lesser extent after energy depletion (Figure 4.5). Longitudinal experi-ments showed that all fractions became more susceptible to stress-induced PS expression during the first 2 to 4 weeks of storage, but maximal PS exposure was reached sooner in the more dense fractions (Figure 4.6).
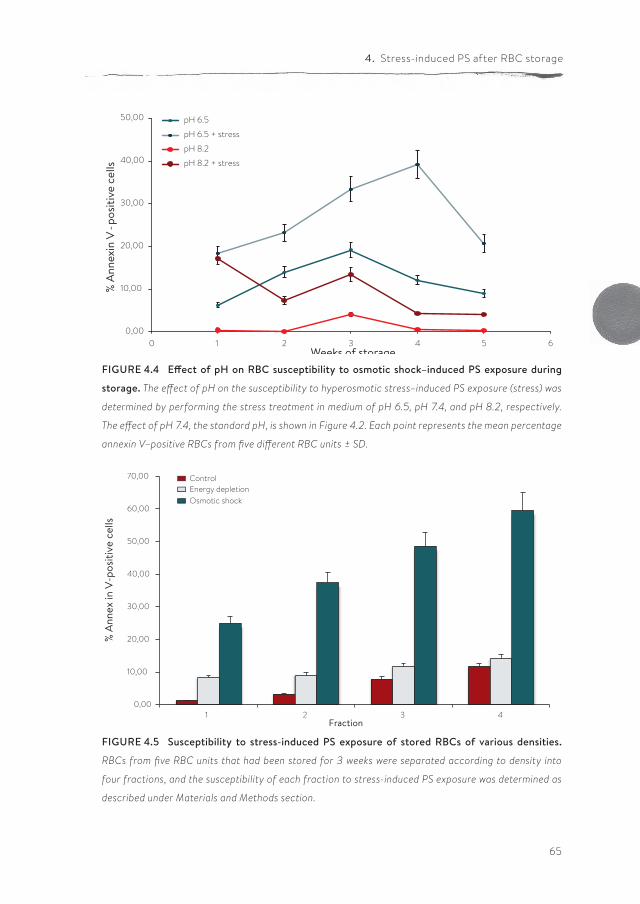
65
4. Stress-induced PS after RBC storage
FIGURE 4.4 Effect of pH on RBC susceptibility to osmotic shock–induced PS exposure during
storage. The effect of pH on the susceptibility to hyperosmotic stress–induced PS exposure (stress) was
determined by performing the stress treatment in medium of pH 6.5, pH 7.4, and pH 8.2, respectively.
The effect of pH 7.4, the standard pH, is shown in Figure 4.2. Each point represents the mean percentage
annexin V–positive RBCs from five different RBC units ± SD.
FIGURE 4.5 Susceptibility to stress-induced PS exposure of stored RBCs of various densities.
RBCs from five RBC units that had been stored for 3 weeks were separated according to density into
four fractions, and the susceptibility of each fraction to stress-induced PS exposure was determined as
described under Materials and Methods section.
0,00
10,00
20,00
30,00
40,00
50,00
0 1 2 3 4 5 6
% A
nnex
in V
-pos
itive
cel
ls
Weeks of storage
pH 6.5
pH 6.5 + stress
pH 8.2
pH 8.2 + stress
0,00
10,00
20,00
30,00
40,00
50,00
60,00
70,00
1 2 3 4
% A
nnex
in V
-pos
itive
cel
ls
Fraction
ControlEnergy depletionOsmotic shock
66
Red blood cell homeostasis
TABLE 4.1 Characteristics of the Percoll fractions
Fraction
HBA1C (%)
MCV (fL) 1 week 5 weeks
1 83 4.2 5.1
2 81 4.7 5.4
3 79 5.0 5.9
4 75 5.2 5.8
RBCs from 5-week-old RBCs were fractionated by discontinuous Percoll gradients, and MCV and
glycated Hb (HbA1c; expressed as percentage of the total Hb content) were determined as described
before (251).
FIGURE 4.6 Storage time–associated and cellular density–related changes in susceptibility to
stress-induced PS exposure. During storage, RBCs from five RBC units were separated according to
density into four fractions each week, and the susceptibility of each fraction to stress-induced PS expo-
sure was determined as a function of storage time. Data are shown as the mean ± SD of the percentage
annexin V–positive RBCs in each fraction. For the sake of clarity, only the data of fraction 2 and frac-
tion 3 are presented. The kinetics of the RBCs of fraction 1 were comparable to those of fraction 2, and
the kinetics of the RBCs of fraction 4 were similar to those of fraction 3.
0
10
20
30
40
50
60
70
0 1 2 3 4 5 6
Weeks of storage
Fraction 2 energy depletion Fraction 2 osmotic shockFraction 3 energy depletion Fraction 3 osmotic shock
µ
% A
nnex
in V
-pos
itive
cel
ls
67
4. Stress-induced PS after RBC storage
Discussion
The data presented here show that, during storage under blood bank conditions, some RBCs lose the capacity to maintain an asymmetric phospholipid distri-bution in their plasma membrane, as indicated by a storage period–associated increase in the percentage of RBCs that expose PS. This is probably due to a small but reversible decrease in aminophospholid translocase activity during storage, in combination with a virtually absent scramblase activity (243). This percentage does not exceed 5% of the total number of RBCs, even after 1 week beyond the maximal storage periods. Furthermore, restoration of ATP levels did not affect these numbers, but increased pH did (Figure 4.2 and 4.4), confirming earlier data (243). Thus, not only during aging in vivo (253), but also during storage, the majority of the RBCs are very proficient in preventing the accumulation of PS, even in circumstances in which the “storage lesions” become quite severe (122, 125, 243).
There is a conspicuous discrepancy between the apparently severe morphologic lesions and the low content of removal signals, such as PS, on the one hand, and the fast removal of up to 30% of the RBCs after transfusion on the other hand (137). The data we present here show that, during storage in routine blood bank conditions, RBCs become increasingly susceptible especially to hyperos-motic shock–induced PS exposure. Preliminary data suggest that this increase in susceptibility starts early during blood processing, either due to the biochem-ical stress upon the transfer of RBCs from plasma to the storage medium and/or due to the mechanical stress during the separation of the blood components. The PS-inducing effect of glucose depletion, which results in a rapid decrease in ATP concentration (243), was much less effective than hyperosmotic shock, and removal of extracellular chloride even resulted in a decrease in PS exposure (Figure 4.2). This is in contrast to the approximately equal effects of these treat-ments on freshly isolated RBCs (149), which implies that energy depletion and osmotic stress–induced shrinkage initiate parallel, not sequential mechanisms. The adaptation of RBC ion and water transport to the storage medium may expose this divergence. It has been shown that the activity of aminophospholipid translocase, one of the enzymes involved in PS transport across the membrane, decreases with decreasing pH (243). The PS-exposing effect of low pH, in combi-nation with the protective effect of a higher pH on stress-induced PS expression (Figure 4.4), suggests that especially this enzyme may become inactivated by
68
Red blood cell homeostasis
hyperosmotic conditions. The decrease in the effect of low pH after 4 weeks of storage (Figure 4.4) may be caused by storage-associated changes in the char-acteristics of aminophospholipid translocase.
During aging in vivo, RBCs discard damaged membrane patches enriched in removal signals in the form of vesicles, which is postulated to prevent untimely removal of otherwise functional cells (253). The same process may occur during storage, since the vesicles that accumulate in transfusion units almost all expose PS, contain IgG, and are enriched in senescent cell antigen-related Band 3 epitopes (29, 38). The kinetics of the susceptibility to energy depletion, chloride removal, and pH all suggest that RBCs undergo crucial changes after 3 weeks of storage. Around the same time, the protein composition and immunologic activity of the RBC membrane undergo major changes, and vesicle production increases (29, 35, 38, 144, 219). Thus, the storage-related and density-associated changes in the susceptibility to PS exposure may be associated with the capacity to generate PS-enriched vesicles.
The cause of the disappearance of up to 25% of the RBCs from the circulation within the first 24 hours after transfusion is unknown. Our present data suggest that the increase in susceptibility of RBCs to stress-induced PS exposure during blood bank storage may contribute to this fast removal. During its passage through the circulation, the RBC encounters deformation-associated mechanical stress in capillaries and spleen and osmotic stress during its passage through the kidney. Thus, incubation in a hyperosmotic medium in vitro may indeed be charac-terized as “near-physiological stress” (149). However, in view of its relatively slow kinetics, the increased PS expression observed upon hyperosmotic treatment in vitro may by itself not be relevant to removal in vivo, but rather expose a flaw in membrane organization that has been acquired during storage. The pathological situation in the recipient’s circulation may contribute to an increased PS expo-sure. Increased plasma sphingomyelinase concentrations that are associated with many inflammatory conditions may enhance PS exposure (150). Also, the transi-tion from a highly artificial storage medium to the blood may represent a major stress event.
Removal-prone RBCs may originate from the oldest cells present at the time of blood collection. In vivo, RBC aging is associated with a decrease in cell volume and an increase in cell density and in HbA1c (24, 251, 253). Increased PS expo-
69
4. Stress-induced PS after RBC storage
sure has been described before in the RBCs with the highest densities, and RBCs become more dense with storage time (57, 231, 243). In transfusion units, the most dense RBCs do not only have an increased PS exposure, but also an increased susceptibility to osmotic stress-triggered PS exposure (Figure 4.5). Also, higher cell density is associated with an increased rate of susceptibility during storage (Figure 4.6). It is not likely that the increase in susceptibility affects only the very old RBCs, since the fraction of RBCs that is removed within 24 hours after trans-fusion is much larger than the fraction of the most dense cells. Therefore, we conclude that during blood processing and storage in the blood bank, a consider-able fraction of the RBCs that are not yet physiologically old becomes damaged and thereby acquires an increased susceptibility to stress-induced PS exposure.
The RBCs that are rapidly cleared from the circulation after transfusion are the most likely cause of unwanted transfusion reactions, especially in patients who are dependent on frequent transfusions. Elucidation of the molecular cause of their increased susceptibility to PS exposure and removal may lead to the devel-opment of methods to prevent their generation or to remove them from the blood bag before transfusion.

71
PUBLISHED AS:
N. Gov1, J. Cluitmans2, P. Sens3 and G.J.C.G.M. Bosman2
1 Department of Chemical Physics, The Weizmann Institute of Science, P.O. Box 26, Rehovot
76100, Israel
2 Department of Biochemistry, Radboud University Medical Center Nijmegen, P.O. Box 9101,
6500 HB Nijmegen, The Netherlands
3 Physico-Chimie Théorique (CNRS UMR 7083), ESPCI, 10 rue Vauquelin, 75231 Paris Cedex
05, France
Adv. Planar Lipid Bilayers Liposomes, Volume 10, 2009; 10: 95–119
CYTOSKELETAL CONTROL OF RED BLOOD CELL SHAPE:
THEORY AND PRACTICE OF VESICLE fORMATION
72
Red blood cell homeostasis
Abstract
The erythrocyte cytoskeleton is composed of a two-dimensional network of flexible proteins that is anchored to the cell membrane, and determines cell shape. The cytoskeleton also affects the diffusion and distribution of membrane proteins and lipids through direct interactions and steric effects. Here, we present a unified model which describes how the coupling of the local interactions of the cytoskeleton with the bilayer exerts control over the process of membrane vesic-ulation. In this model, a disturbance of the band 3-ankyrin anchoring complexes leads to increased compression and rigidity of the spectrin cytoskeleton, leading to buckling of the phospholipid bilayer, resulting in vesicle formation. The predic-tions of this model on size and protein composition of vesicles are confirmed by the available data, especially data of vesicles that are generated during aging in vivo and in blood bank storage conditions. Finally, we suggest some future theo-retical elaborations of this model, as well as the experimental approaches for testing it.
73
5. Cytoskeletal control of red blood cell shape
Introduction
Microvesicles, also referred to as microparticles, are fragments that are shed from the plasma membrane of stimulated or apoptotic cells. They are associ-ated with various physiological processes involving intercellular communica-tion, hemostasis, and immunity. Variations in their number and/or characteristics are observed in pathophysiological circumstances. High shear stress, oxida-tive stress, inflammatory or procoagulant stimulation, and apoptosis all stimu-late vesicle generation (99, 127, 174). Stimulation leads to a redistribution of lipids and proteins in and associated with the cell membrane, leading to changes in (the kinetics of) microdomain organization, changes in phospholipid asymmetry, cytoskeleton reorganization, and vesicle release. Controlled inclusion or exclusion of specific molecule species into these microdomains results in vesicles with a particular membrane composition and content (127). This explains how microves-icles of the same cellular origin may have different protein and lipid compositions, be involved in the maintenance of homeostasis under physiological conditions, or initiate a deleterious process in case of excess or when carrying pathogenic constituents (99, 127).
Thus, vesicles constitute a disseminated storage pool of bioactive effectors. For example, antigen-presenting cells secrete MHC-carrying vesicles that stimu-late proliferation of T cells (77, 127). Microvesicles that are shed from activated platelets expose phosphatidylserine (PS), thereby providing a catalytic surface promoting the assembly of the enzyme complexes of the coagulation cascade. Furthermore, vesiculation is thought to represent a mechanism to eliminate cell waste products. This plays an important role in the problems around the immunity of cancer cells, as vesicles may be instrumental in the elimination of membrane proteins that are recognized by the immune system, and thereby facilitate escape and promote survival. Also, cancer cells may use vesicles to get rid of toxic drugs, accounting in part for the resistance to chemotherapy (127).
Classically, the erythrocyte has always been an important subject in research on the structure/function relationship of the plasma membrane, including vesicle formation (141). In the last few years, the interest in the ins and outs of eryth-rocyte vesiculation has increased, since vesiculation plays a role in all stages of the erythrocyte life. During erythropoiesis, iron is transported into the eryth-roblast for hemoglobin synthesis by receptor-mediated endocytosis of vesicles
74
Red blood cell homeostasis
containing complexes of transferrin receptor, transferrin, and iron. At a later point in erythroid terminal differentiation, vesiculation plays a crucial role in remodeling of the reticulocyte membrane, when a number of integral membrane proteins, including the transferrin receptor, are removed from the cell surface by exocytosis. Finally, vesiculation of the mature erythrocyte plasma membrane is not only an integral part of the physiological erythrocyte aging process but also constitutes one of the erythrocyte storage lesions in the blood bank, and also plays a role in the pathology of hemoglobinopathies and erythrocyte membranopathies (35).
In this chapter, we will present the recent data on erythrocyte microvesicle composition, and discuss these in the light of the mechanisms that have been postulated on the vesicle generation process. We will try to combine these into a new model, and will propose some experimental approaches that could falsify and/or refine this theory. In this model, we propose that a crucial role in the process of membrane vesiculation is played by the erythrocyte cytoskeleton. The erythrocyte cytoskeleton is composed of a two-dimensional network of flex-ible proteins that is anchored to the cell membrane, and determines the overall mechanical properties of the cell (15, 50, 181). On the cell level, this network plays a crucial role in determining the overall cell shape (156), by modifying the force balance (tension) at the membrane (105, 108). On a more local level, the cyto-skeleton affects the diffusion and distribution of membrane proteins and lipids through direct interactions and steric effects (‘membrane corrals’) (42, 73, 105, 108, 157). Here, we present a unified model, which describes how the coupling of the local interactions of the cytoskeleton with the bilayer can drive and exert some control over the process of membrane vesiculation.
The membrane/cytoskeleton model of the erythrocyte
During its life, the erythrocyte is squeezed through capillaries that are roughly one-third of its diameter, for approximately 100,000 times (170). Therefore, the erythrocyte must have a highly deformable as well as stable membrane. Membrane deformability gives the erythrocyte the capacity to deal with the shear forces in the circulation, and membrane stability provides the capacity to circulate without fragmentation. The ability of the erythrocyte membrane
75
5. Cytoskeletal control of red blood cell shape
to store energy during brief periods of deformation and to return to its orig-inal shape is associated with the maximal duration of its lifespan of 120 days in the human circulation (15, 50). The well-described biochemical characteristics of the erythrocyte membrane underlying these unique functional requirements have long been instrumental for the development of models of the generic cell membrane.
Phosphatidylcholine (PC) and sphingomyelin (SM) are the dominant lipid compo-nents of the outer leaflet of the lipid bilayer, and PS and phosphatidylethanol-amine (PE) are mainly found in the inner leaflet. This asymmetry is under control of a flippase, an inward-directed pump specific for PS and PE, an outward-di-rected pump referred to as floppase, and a lipid scramblase, which catalyzes unspecific, bidirectional redistribution of phospholipids across the bilayer. The asymmetry may be involved in erythrocyte homeostasis, as PS binds to the cyto-skeletal components spectrin and protein 4.1 (170). Also, erythrocyte stimulation accompanied by a significant, sustained increase in the cytosolic Ca2+ concentra-tion may lead to a collapse of the membrane asymmetry, with the most prom-inent change being the surface exposure of PS. PS is a recognition signal for macrophages, thereby promoting erythrocyte removal (147).
It was thought for a long time that the plasma membrane is a two- dimensional ‘fluid mosaic’, and that the membrane proteins are uniformly dispersed in the lipid solvent (233). However, in recent years, the existence of other lipid bilayer organization states, ‘liquid-ordered’ membranes, became clear (41, 89). These regions, also called rafts, are enriched in cholesterol and sphingolipids, making them more ordered, less fluid, and more resistant to solubilization by detergents than the bulk plasma membrane (89). Rafts are also distinguished by a specific assortment of proteins that are anchored by a glycosylphosphatidylinositol (GPI) anchor to the outer leaflet, such as acetylcholinesterase (227). Also, at the cyto-solic side, the proteins stomatin, flotillin-1, and flotillin-2 are concentrated in rafts (218). Rafts of different sizes are formed continuously, and their stability is a function of size, capture by raft-stabilizing protein, and protein–protein inter-actions (6, 114).
The main integral membrane protein is band 3, which constitutes 15–20% of the total membrane protein, and is present in a monomer/dimer/tetramer equilib-rium (7). The band 3 molecule consists of three dissimilar, functionally distinct
76
Red blood cell homeostasis
domains. The N-terminal, cytoplasmic domain binds with a variety of peripheral membrane and cytoplasmic proteins including some key glycolytic enzymes, peripheral proteins ankyrin, protein 4.2, and hemoglobin. The hydrophobic transmembrane domain functions as the chloride/bicarbonate exchanger, and forms a complex with other integral membrane proteins such as the Rhesus and Rhesus-associated proteins, and the glucose transporter. The C-terminal domain has a binding site for carbonic anhydrase II. Band 3 is crucial for a proper linking of the lipid bilayer to the membrane skeleton, through its interaction with ankyrin and binding to protein 4.2. Also, glycophorin C (GPC) functions as a bilayer–skeleton tethering point via its interaction with protein 4.1 within the junctional complex (see below), while glycophorin A (GPA) is partially associated with band 3 (7, 181).
The cytoskeleton is a filamentous network of peripheral proteins that is composed of three principal components: spectrin, actin, and protein 4.1. The cytoskeleton consists mainly of polymeric spectrin molecules, which are tied together by actin, protein 4.1 at nodes called junctional complexes. The skeleton is highly flexible and compressible (181). Spectrin, the main component of the skeleton, is a flex-ible, filamentous molecule and constitutes 20–25% of the mass of proteins that can be extracted from the membrane. Spectrin is composed of two non-iden-tical subunits (a and ß) intertwined side by side to form a heterodimer. Spectrin heterodimers self-associate at one end of the molecule to form tetramers. These self-associating heterodimers dominate in the cytoskeleton. At opposite ends, the tails of the dimers are associated with short oligomers of actin. The spec-trin–actin interactions are stabilized by the formation of a ternary complex with protein 4.1. Each actin oligomer can bind to six spectrin tetramer ends, thereby creating an approximately hexagonal lattice (181).
The structural model of a hexagonal lattice is supported by high-resolution elec-tron micrographs of isolated membranes (86). In order for the membrane to deform in the microcirculation, the skeletal network must be able to undergo rearrangement. In one model, deformation occurs with a change in geometric shape, but at a constant surface area. In the non-deformed state, the spectrin molecules exist in a folded confirmation, but with increased shear stress the membrane becomes increasingly extended as some spectrin molecules become uncoiled while others assume a more compressed and folded form. When the spectrin molecules attain their maximal extension, the limit of reversible deform-
77
5. Cytoskeletal control of red blood cell shape
ability is obtained. Further extension would result in an increase in surface area and the breaking of junction points and of the tetramers (8), at which stage membrane fragmentation is thought to occur (86).
Mechanical properties of the membrane/cytoskeleton of the erythrocyte
The filamentous spectrin proteins that compose the cytoskeletal net- work each have elastic spring-like properties (21, 22, 85, 106). Under moderate extension, these molecules behave as soft elastic spring (their elasticity is controlled by thermal fluctuations), giving the cytoskeleton network an elastic shear modulus: μ ≈ kBT / 4rg
2 ≈ 2 x 10⁻⁶ J m -2, where kBT is thermal energy and rg2
≈ 13 nm is the esti-
mated radius of gyration of a spectrin tetramer filament in water (85). This shear modulus of the erythrocyte depends on the entropic spring constant of each filament, and the average connectivity of the whole network. The entropic spring constant of each filament is given by: k ≈ 3kBT / 4rg
2. Under normal conditions, the spectrin filaments have their ends anchored to the membrane at a distance of 2r ≈ 80nm on average. This distance is larger than 2rg, and the filaments are under extension, experiencing a tensile force: F
cyto ≈ ( kBT/rg
) ( r / rg- 1 ). This force of the
individual filaments, which acts to stretch the spectrin filaments, is acting equally to compress the membrane bilayer, until the two components globally balance each other (108, 225). Note that there may be also an overall osmotic pressure difference across the cell membrane, which stretches both the bilayer and spec-trin network.
On a local scale, the membrane may slightly bend to balance the compres-sion force applied on it by the cytoskeleton. Over the whole cell, this compres-sion means that the cytoskeleton is pulling the membrane inwards, while the finite membrane area counteracts this inward-directed force (108). The overall compression applied by the cytoskeleton on the membrane is, therefore, a function of the proportion of connected filaments, and their average spring constant. The bending of the membrane caused by this inward compression can be described on the level of the whole cell as an induced spontaneous curvature, or equivalently an area difference between the inner and outer leaflets (156). We have shown, for example, that the calculated increase in cytoskeletal compres-sion of the bilayer when adenosine triphosphate (ATP) is depleted, is indeed large
78
Red blood cell homeostasis
enough to drive the discocyte–echinocyte shape transition observed under these conditions (22, 108). The effects of the cytoskeleton-induced compression of the bilayer on the local scale, where it may affect the vesiculation process, are discussed in the following sections.
Various factors can modify the entropic elasticity (spring constant) of the individual spectrin filaments: (i) adding or removing a band 3-ankyrin binding complex at the filament midpoints results in lowering or, respectively, increasing the entropic spring constant (42); (ii) unfolding of the spectrin protein under stretching of the cell (such as in shear flow) results in an increase of the molecular length (increase of rg
) and, therefore, lower tension (86, 134, 153); (iii) complete breakup of the spectrin tetramer into two dimers (8), or dissociation of the bound spectrin filament ends from the attachments at the actin–band 4.1 anchor complex, both result in a vanishing of the elasticity for that filament, since the mechanical linkage is broken. In addition to the main anchoring points at the fila-ment ends (actin–band 4.1 complex) and midpoints (band 3-ankyrin complex), the spectrin filaments have interactions with a variety of membrane compo-nents, that may give rise to further attachment points of the filament to the bilayer, of various strength. Examples of such interactions are between spectrin and PS, and a variety of raft components such as stomatin (218). Furthermore, the close association of lipids with band 3 and spectrin suggests that the lipid composition may also affect the stability of the anchoring complexes.
Vesiculation
In vivoDuring the lifespan of the mature erythrocyte, volume and hemoglobin content decrease by 30% and 20%, respectively (245). Also, the surface area and lipid content decrease by 20%, mainly by the release of hemoglobin- containing vesicles. This process occurs throughout the lifespan, but is accelerated in the second half, if a functional spleen is present (252). Vesicles are rapidly removed by the mononuclear phagocyte system, especially by Kupffer cells in the liver. This removal, which occurs very rapidly, is mediated by PS-binding scavenger receptors, and probably by autoantibodies as well (254). The presence of the latter on vesicles has been postulated to be caused by binding of autologous IgG to band 3-derived senescent cell antigens (253). Vesicle formation may serve as
79
5. Cytoskeletal control of red blood cell shape
a means to dispose of ‘bad’ membrane patches, thereby getting rid of nonfunc-tional proteins and potentially damaging autoantigens, and simultaneously saving an otherwise functional erythrocyte from an untimely death (253). From data obtained from patients who had undergone splenectomy, it is clear that the spleen plays an important role in vesicle formation, but the mechanism of this process is obscure (252).
In transfusion unitsAlso, vesiculation takes place during storage, resulting in the accumulation of vesi-cles in erythrocyte concentrates for transfusion, and contributing to irreversible cell shape change and membrane changes. The resulting dense, poorly deformable spherocytes are presumed to be quickly removed from the circulation after trans-fusion (179). The lipid component of vesicles might be the stimulus for the activa-tion of inflammatory genes in leukocytes in the recipient, possibly contributing to transfusion-related multiple organ failure (90). Also, removal signals on the most damaged erythrocytes and on storage vesicles may lead to an overload of the reticulo-endothelial system, and thereby to a depression of the immune defenses (125). In addition, a concentration of structurally altered membrane proteins such as band 3 on the vesicles in transfusion units could generate non-physiological neoantigens that may activate the recipient’s immune system to generate allo-antibodies and/or autoantibodies, and thereby lead to autoimmune hemolytic anemia, especially in transfusion-dependent patients (35).
In vitroShedding of vesicles is also observed under other conditions that trigger the transition from a discocyte into an echinocyte shape in vitro, such as ATP deple-tion and Ca2+ loading (1, 3, 189). In these conditions, shedding of vesicles has been described to occur at the tip of membrane spicules (112). Also, numerous membrane-active compounds, such as detergents, that disturb the lipid organi-zation of the membrane or agents that affect ion transport across the membrane induce vesicle formation (109) .
In patientsAltered vesicle formation has been associated with various abnormal erythro-cyte morphologies. Spherocytosis is one of the inherited erythrocyte disor-ders that result from mutations in various membrane and cytoskeletal proteins. The affected proteins are mainly ankyrin, spectrin, and band 3, and occasionally
80
Red blood cell homeostasis
protein 4.2 and the Rh protein. These proteins are all part of one of the complexes by which the cytoskeleton is anchored to the lipid bilayer (181). Hereditary ellipto-cytosis is caused mainly by mutations in the spectrins and protein 4.1, leading to decreased spectrin self-association and/or weakened junctional complexes, thereby decreasing the mechanical stability. Ovalocytosis is caused by a deletion in band 3, and is associated with increased membrane rigidity (132). One form of acanthocytosis has been linked with a mutation in band 3 (139). Finally, stomato-cytosis has been thought to result from defects in cell volume regulation, prob-ably by mutations in as yet unidentified cation transport systems (182). A decrease in the capacity to regulate erythrocyte water content and thereby volume and morphology has also been implicated in the pathophysiology of hemoglobinop-athies such as sickle cell disease and thalassemia. In these patients, the blood content of erythrocyte-derived vesicles was found to be increased, and related to the plasma hemoglobin concentrations (246). Electron micro- graphs show that vesicles are formed during spherocyte formation in patients with hered-itary spherocytosis (88). Also, the erythrocytes of trans- genic mice lacking band 3 have a spherocyte morphology, and show prominent vesicle production (203). Similarly, mutations leading to defects in the band 4.2 protein also lead to breakage of the band 3-ankyrin anchors of the spectrin filaments, and give rise to hereditary spherocytosis and vesicle shedding (88, 182). It has been suggested that, in patients with spherocytosis, an acceleration of vesicle formation leads to a membrane loss that cannot be compensated for by uptake of lipids from plasma proteins. The erythrocytes become more and more microspherocytic, and are thought to be hemolysed principally by the spleen, a serious anemia being the consequence (35, 245). A special case is constituted by patients with neuroacan-thocytosis. In all manifestations of this syndrome of basal ganglia degeneration, structural changes in band 3 are central in acanthocyte formation (27).
Vesicle composition
In vivoErythrocyte-derived (i.e., GPA-positive) vesicles obtained from the freshly drawn plasma of healthy donors are variable in size (200–800 nm), predominantly right-side-out, and contain all hemoglobin components in a pattern similar to that of old erythrocytes, that is, enriched in modified hemoglobins such as HbA1c (252). All the vesicles are positive for the complement- regulating, GPI-anchored
81
5. Cytoskeletal control of red blood cell shape
proteins CD55 and CD59, approximately 40% contain IgG, and 50–70% expose PS (252–254). Based on immunoblot analysis suggesting altered band 3 struc-tures in these vesicles, it was speculated that the IgG is bound to band 3-derived senescent cell-specific antigens (253). These data are all confirmed by proteomic analysis (Bosman et al., in preparation). Thus, vesicles contain aged cytoplasmic hemoglobin as well as aged membrane band 3. The presence of removal signals such as senescent cell antigens and PS are likely to be responsible for their very fast removal (179, 253). As yet, no data are available on the lipid composition of these vesicles.
In transfusion unitsIn contrast to the scarcity of information on erythrocyte-derived vesicles in vivo, many data are available on vesicles that are generated during storage (109). Very recently, a combination of proteomic and immunochemical investigations have provided an updated structural and functional inventory of the vesicles that orig-inate during processing and storage of erythrocyte concentrates under blood bank conditions (38, 144, 213, 219). These analyses partially confirm earlier data, such as a storage-associated increase in (aggregated) hemoglobin in the vesi-cles, and in aggregated and degraded band 3 in vesicle membranes. The size of the vesicles may vary with storage time and storage medium, but most vesicles have a diameter of 80–200 nm (144, 219). Vesicles contain hardly any of the major integral membrane proteins and cytoskeletal proteins, with the exception of band 3 and protein 4.1 (38). The concentration of carbonyl groups in vesicles increases with storage time relative to that in erythrocyte membrane fractions, indicating the accumulation of oxidized proteins, some of which could be iden-tified as band 3, actin, and stomatin (38, 144). Storage vesicles have also been described to contain proteins that are part of an apoptosis signaling cascade, such as Fas and caspase 3 (111). Storage vesicles are enriched in the raft protein stomatin, but contain less of the other raft proteins flotillin-1 and flotillin-2 (38, 219). Storage vesicles expose PS, and contain IgG. Reliable, detailed data on the phospholipid composition of vesicles generated in transfusion units are lacking (109), but the available data suggest that the phospholipid organization of the vesicle membrane is different from that of the erythrocyte, and that it varies depending on storage medium and storage time (111) (Bosman et al., unpublished observations). Immunoblot analysis of the vesicular proteins that are resistant to solubilization by Triton X-100 shows that most of the stomatin and almost all of the flotillins are associated with rafts. Also, the GPI-linked proteins acetylcho-
82
Red blood cell homeostasis
linesterase and CD55 in vesicles are associated with the vesicle rafts. Band 3 and the Duffy antigen, previously shown to be present in rafts from erythrocyte membranes, were absent from the vesicle rafts (213, 219).
In vitroUpon an increase of the intracellular calcium concentration by treatment with the cation ionophore A23187, a shape change from discocyte to echinocyte occurs. Furthermore, microvesicles bud off from the microvillous-like projec-tions of the echinocytes. Calcium-induced vesicles are depleted of PC, spectrin, actin, and glycophorin, while band 3 and acetylcholinesterase are retained (109). Vesicle formation is associated with activation of a calcium-dependent phospho-lipase C producing 1,2-diacylglycerol, and with translocation to the membrane and activation of the protease calpain. There is a significant negative correla-tion between erythrocyte ATP content and vesicle amount (219). ATP depletion induces the same morphological changes as calcium loading, but the protein compositions of the vesicles induced by ATP depletion, calcium loading, and storage differ (109). The spectrin-free vesicles induced by nutrient deprivation bind IgG in much higher quantities than the erythrocytes they are derived from, suggesting a selective enrichment of autoantigens in vesicles (188). The raft proteins stomatin, acetylcholinesterase, and CD55 are enriched in calcium-in-duced vesicles, but other raft proteins such as flotillin-1 and flotillin-2 are absent (217, 219). Together with the differences in protein and phospholipid composi-tion as well as in size and shape of vesicles induced by various membrane- active compounds such as amphiphiles or lysophosphatidic acid (113, 129), these in vitro data emphasize an earlier conclusion that the composition of vesicles differs depending on the manner by which they were produced (109). These data also support and highlight the theory that multiple pathways are likely to be involved in the mechanism of vesicle generation.
In patientsMany data are available on the differences in membrane protein composition and/or organization between pathological and healthy erythrocytes, but only scarce data are available on the composition of erythrocyte-derived vesicles from the blood of inpatients with membranopathies and hemoglobinopathies described earlier. These vesicles contain hemoglobin and 50% of these vesicles express PS at their surface as do the vesicles in healthy controls. PS exposure is associated with a promotion of thrombin generation (219). Erythrocytes with
83
5. Cytoskeletal control of red blood cell shape
sickle cell hemoglobin shed vesicles upon unsickling in vitro. Such vesicles are devoid of spectrin, ankyrin, and protein 4.1, and their membranes contain exten-sive regions of non-bilayer phase regions (2, 247).
Mechanism(s)
A summary of the presently available data on the composition of vesicles as compiled above may serve as the framework for our present theory on the mechanism by which erythrocytes generate vesicles in health and (erythrocyte) disease, and during storage under blood bank conditions. The main character-istic of all vesicles is the virtual absence of spectrin and ankyrin, the main compo-nents of the erythrocyte cytoskeleton, and of an intact cytoskeletal spectrin–actin network. The observation that vesicle membranes are highly enriched in a variety of proteins, compared to their concentration in the intact erythrocyte membrane, suggests that there is a relationship between their protein composi-tion and the vesiculation process.
Generically, membrane vesiculation can be achieved either by an asymmetry in the membrane leaflet composition that favor membrane curvature, or by the generation of forces (e.g. from the cytoskeleton). While the lipid composition of the plasma membrane of cells is always asymmetric, the increase of this asym-metry, for instance under the action of proteins such as flippase, can increase steric torques within the bilayer and trigger the formation of vesicles (80, 224).
The cytoskeleton is likely to play an important role in erythrocyte vesiculation. By segregating the erythrocyte membrane into ‘‘corrals,’’ the cytoskeleton affects both the rate of diffusion of the membrane components, and the physical extent of free membrane patches. The spectrin filaments affect membrane proteins by steric repulsion, which tends to segregate some proteins away from the fila-ments, and by attractive interactions with other membrane components, which therefore aggregate near the filaments. The result is a mosaic of membrane compositions (155), which reflects the network geometry of the cytoskeleton, and the chemical affinities of the membrane components (Figure 5.1A).
The most obvious process driving vesicle formation is the aggregation of membrane proteins of specific types that have mutual affinity, forming membrane
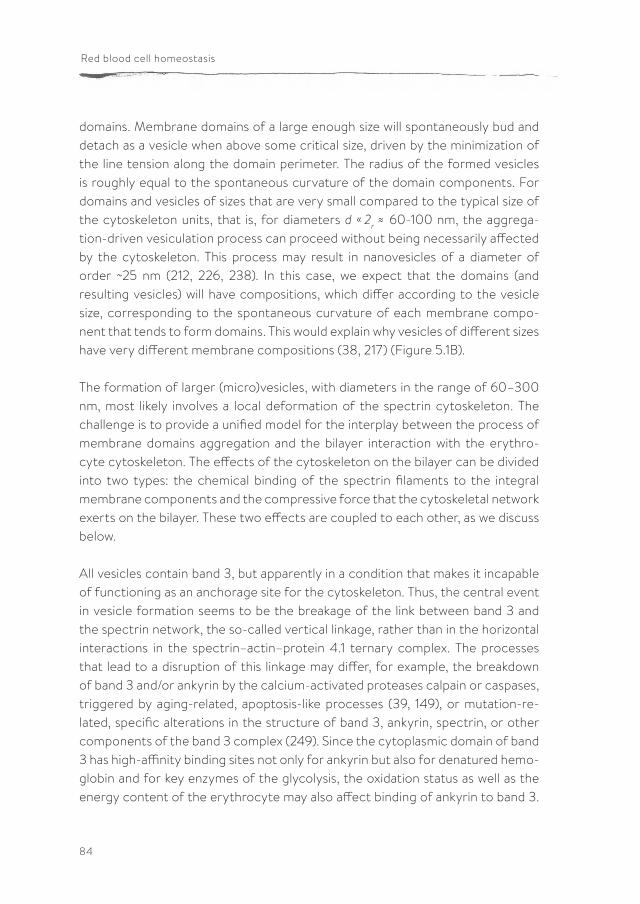
84
Red blood cell homeostasis
domains. Membrane domains of a large enough size will spontaneously bud and detach as a vesicle when above some critical size, driven by the minimization of the line tension along the domain perimeter. The radius of the formed vesicles is roughly equal to the spontaneous curvature of the domain components. For domains and vesicles of sizes that are very small compared to the typical size of the cytoskeleton units, that is, for diameters d « 2r
≈ 60-100 nm, the aggrega-tion-driven vesiculation process can proceed without being necessarily affected by the cytoskeleton. This process may result in nanovesicles of a diameter of order ˜25 nm (212, 226, 238). In this case, we expect that the domains (and resulting vesicles) will have compositions, which differ according to the vesicle size, corresponding to the spontaneous curvature of each membrane compo-nent that tends to form domains. This would explain why vesicles of different sizes have very different membrane compositions (38, 217) (Figure 5.1B).
The formation of larger (micro)vesicles, with diameters in the range of 60–300 nm, most likely involves a local deformation of the spectrin cytoskeleton. The challenge is to provide a unified model for the interplay between the process of membrane domains aggregation and the bilayer interaction with the erythro-cyte cytoskeleton. The effects of the cytoskeleton on the bilayer can be divided into two types: the chemical binding of the spectrin filaments to the integral membrane components and the compressive force that the cytoskeletal network exerts on the bilayer. These two effects are coupled to each other, as we discuss below.
All vesicles contain band 3, but apparently in a condition that makes it incapable of functioning as an anchorage site for the cytoskeleton. Thus, the central event in vesicle formation seems to be the breakage of the link between band 3 and the spectrin network, the so-called vertical linkage, rather than in the horizontal interactions in the spectrin–actin–protein 4.1 ternary complex. The processes that lead to a disruption of this linkage may differ, for example, the breakdown of band 3 and/or ankyrin by the calcium-activated proteases calpain or caspases, triggered by aging-related, apoptosis-like processes (39, 149), or mutation-re-lated, specific alterations in the structure of band 3, ankyrin, spectrin, or other components of the band 3 complex (249). Since the cytoplasmic domain of band 3 has high-affinity binding sites not only for ankyrin but also for denatured hemo-globin and for key enzymes of the glycolysis, the oxidation status as well as the energy content of the erythrocyte may also affect binding of ankyrin to band 3.
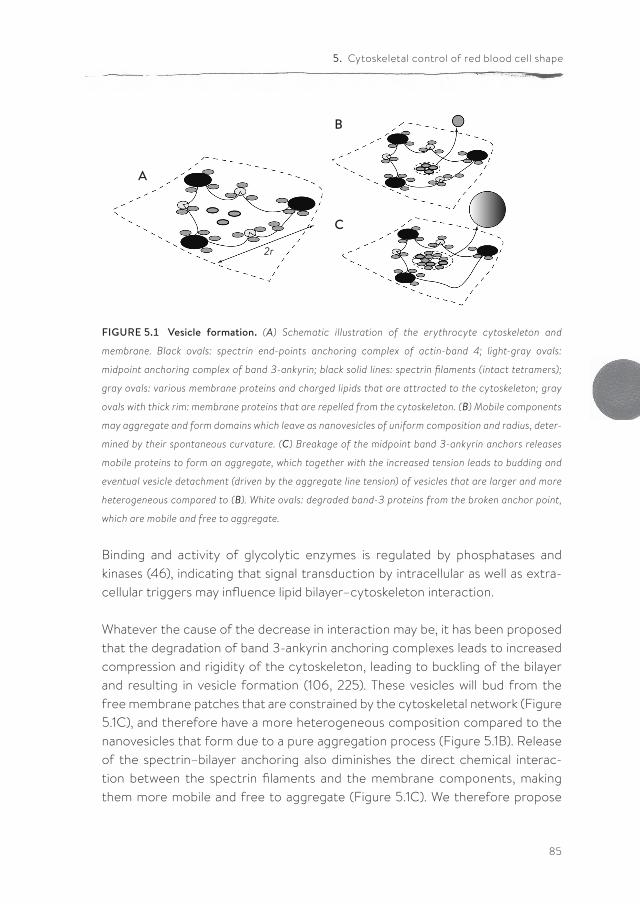
85
5. Cytoskeletal control of red blood cell shape
FIGURE 5.1 Vesicle formation. (A) Schematic illustration of the erythrocyte cytoskeleton and
membrane. Black ovals: spectrin end-points anchoring complex of actin-band 4; light-gray ovals:
midpoint anchoring complex of band 3-ankyrin; black solid lines: spectrin filaments (intact tetramers);
gray ovals: various membrane proteins and charged lipids that are attracted to the cytoskeleton; gray
ovals with thick rim: membrane proteins that are repelled from the cytoskeleton. (B) Mobile components
may aggregate and form domains which leave as nanovesicles of uniform composition and radius, deter-
mined by their spontaneous curvature. (C) Breakage of the midpoint band 3-ankyrin anchors releases
mobile proteins to form an aggregate, which together with the increased tension leads to budding and
eventual vesicle detachment (driven by the aggregate line tension) of vesicles that are larger and more
heterogeneous compared to (B). White ovals: degraded band-3 proteins from the broken anchor point,
which are mobile and free to aggregate.
Binding and activity of glycolytic enzymes is regulated by phosphatases and kinases (46), indicating that signal transduction by intracellular as well as extra-cellular triggers may influence lipid bilayer–cytoskeleton interaction.
Whatever the cause of the decrease in interaction may be, it has been proposed that the degradation of band 3-ankyrin anchoring complexes leads to increased compression and rigidity of the cytoskeleton, leading to buckling of the bilayer and resulting in vesicle formation (106, 225). These vesicles will bud from the free membrane patches that are constrained by the cytoskeletal network (Figure 5.1C), and therefore have a more heterogeneous composition compared to the nanovesicles that form due to a pure aggregation process (Figure 5.1B). Release of the spectrin–bilayer anchoring also diminishes the direct chemical interac-tion between the spectrin filaments and the membrane components, making them more mobile and free to aggregate (Figure 5.1C). We therefore propose
2r
A
B
C
86
Red blood cell homeostasis
that both an increased cytoskeleton rigidity and the release of mobile membrane components drive the formation of microvesicles in response to degradation of the spectrin–bilayer anchoring through the band 3-ankyrin complex.
We start with the relationship between the elastic rigidity of the spectrin fila-ments and the removal of the midpoint anchoring (Figures 5.1C and 5.2). The effect of the latter can be understood as a direct manifestation of the entropic nature of the elasticity of the spectrin filaments; the larger the configu-rational entropy of the flexible proteins, the larger the spring constant of this filament, and therefore decreasing this configurational entropy by the addi-tion of midpoint anchoring leads to a lower elasticity. The increased cytoskele-ton-induced tension when the midpoint anchoring is removed can be demon-strated by the following estimate of this force; F
cyto ≈ ( kBT/rg
) ( r / rg- 1 ). When the
midpoint anchor is present, the effective r becomes half that of the end-points, and similarly rg is reduced by a factor of ˜ √2 (for pure Gaussian chains). If we use the values for r and rg given above for the spectrin network of the erythro-cyte, the reduction in the tension can be estimated to be of order 2. Another demonstration of the effect of anchoring on the spring constant of the filament is by considering the theoretical limit of many anchoring points, such that the filament becomes effectively two- dimensional, moving only in the plane of the bilayer (Figure 5.2C). Using the description of a Gaussian chain in 2D, we find that the effective spring constant is smaller compared to 3D (no midpoint anchors) by a factor of k2D
= (2/3) k3D. This is the maximal softening that we can get, and this is a weaker effect than for fixed attachment points, since the conformational entropy of the anchor points inside the bilayer plane is maintained.
It is important to note the opposite effects on the cytoskeleton stiffness of the band 3–ankyrin and actin–band 4 anchoring complexes; the removal of the first kind increases the stiffness of the spectrin bond, while removal of the second kind results in a vanishing of the stiffness of the bond, since the mechanical linkage is broken. Some agents may affect both types of complexes, in opposite manners; calcium loading seems to lead to band 3-ankyrin breakage as described earlier, while it strengthens the spectrin–actin–band 4 anchoring complexes (158) .Both these modifications result in a stiffer cytoskeleton, which we propose to play a role in the overall shape transitions of the cell (discocyte to echinocyte) and in increased vesiculation.
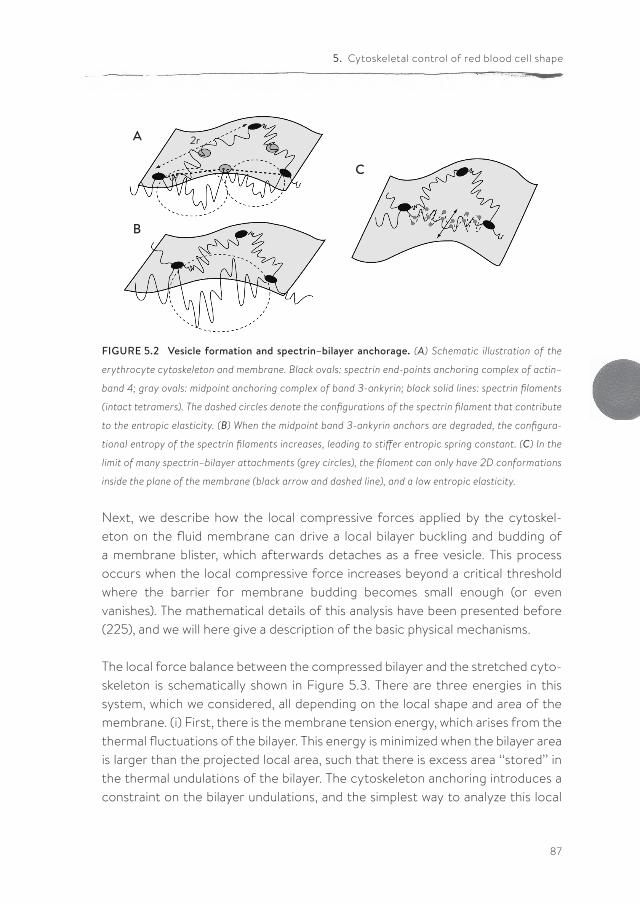
87
5. Cytoskeletal control of red blood cell shape
Next, we describe how the local compressive forces applied by the cytoskel-eton on the fluid membrane can drive a local bilayer buckling and budding of a membrane blister, which afterwards detaches as a free vesicle. This process occurs when the local compressive force increases beyond a critical threshold where the barrier for membrane budding becomes small enough (or even vanishes). The mathematical details of this analysis have been presented before (225), and we will here give a description of the basic physical mechanisms.
The local force balance between the compressed bilayer and the stretched cyto-skeleton is schematically shown in Figure 5.3. There are three energies in this system, which we considered, all depending on the local shape and area of the membrane. (i) First, there is the membrane tension energy, which arises from the thermal fluctuations of the bilayer. This energy is minimized when the bilayer area is larger than the projected local area, such that there is excess area ‘‘stored’’ in the thermal undulations of the bilayer. The cytoskeleton anchoring introduces a constraint on the bilayer undulations, and the simplest way to analyze this local
FIGURE 5.2 Vesicle formation and spectrin–bilayer anchorage. (A) Schematic illustration of the
erythrocyte cytoskeleton and membrane. Black ovals: spectrin end-points anchoring complex of actin–
band 4; gray ovals: midpoint anchoring complex of band 3-ankyrin; black solid lines: spectrin filaments
(intact tetramers). The dashed circles denote the configurations of the spectrin filament that contribute
to the entropic elasticity. (B) When the midpoint band 3-ankyrin anchors are degraded, the configura-
tional entropy of the spectrin filaments increases, leading to stiffer entropic spring constant. (C) In the
limit of many spectrin–bilayer attachments (grey circles), the filament can only have 2D conformations
inside the plane of the membrane (black arrow and dashed line), and a low entropic elasticity.
A
B
C
2r
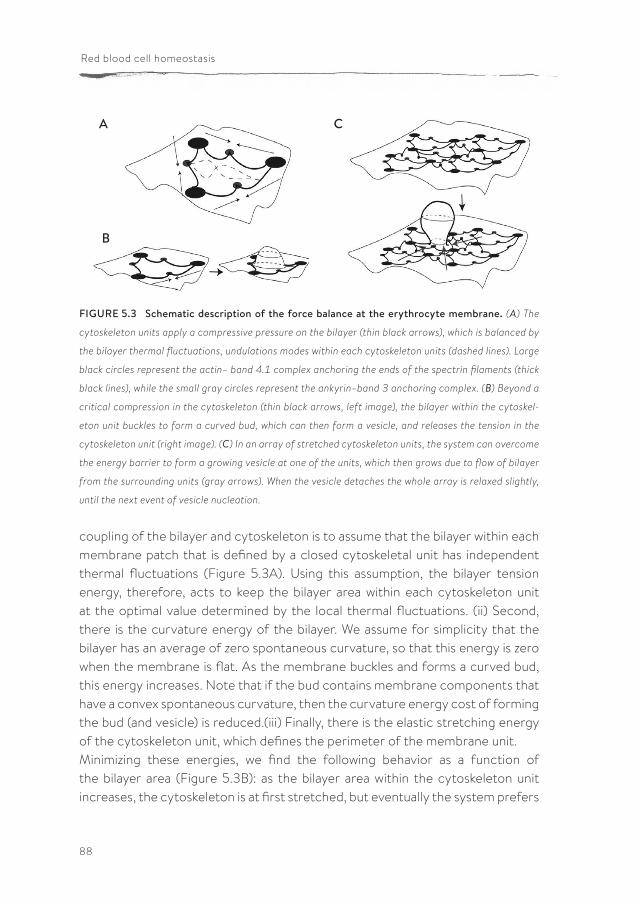
88
Red blood cell homeostasis
coupling of the bilayer and cytoskeleton is to assume that the bilayer within each membrane patch that is defined by a closed cytoskeletal unit has independent thermal fluctuations (Figure 5.3A). Using this assumption, the bilayer tension energy, therefore, acts to keep the bilayer area within each cytoskeleton unit at the optimal value determined by the local thermal fluctuations. (ii) Second, there is the curvature energy of the bilayer. We assume for simplicity that the bilayer has an average of zero spontaneous curvature, so that this energy is zero when the membrane is flat. As the membrane buckles and forms a curved bud, this energy increases. Note that if the bud contains membrane components that have a convex spontaneous curvature, then the curvature energy cost of forming the bud (and vesicle) is reduced.(iii) Finally, there is the elastic stretching energy of the cytoskeleton unit, which defines the perimeter of the membrane unit.Minimizing these energies, we find the following behavior as a function of the bilayer area (Figure 5.3B): as the bilayer area within the cytoskeleton unit increases, the cytoskeleton is at first stretched, but eventually the system prefers
FIGURE 5.3 Schematic description of the force balance at the erythrocyte membrane. (A) The
cytoskeleton units apply a compressive pressure on the bilayer (thin black arrows), which is balanced by
the bilayer thermal fluctuations, undulations modes within each cytoskeleton units (dashed lines). Large
black circles represent the actin– band 4.1 complex anchoring the ends of the spectrin filaments (thick
black lines), while the small gray circles represent the ankyrin–band 3 anchoring complex. (B) Beyond a
critical compression in the cytoskeleton (thin black arrows, left image), the bilayer within the cytoskel-
eton unit buckles to form a curved bud, which can then form a vesicle, and releases the tension in the
cytoskeleton unit (right image). (C) In an array of stretched cytoskeleton units, the system can overcome
the energy barrier to form a growing vesicle at one of the units, which then grows due to flow of bilayer
from the surrounding units (gray arrows). When the vesicle detaches the whole array is relaxed slightly,
until the next event of vesicle nucleation.
A
B
C
89
5. Cytoskeletal control of red blood cell shape
to release the cytoskeleton tension at the cost of membrane bending energy, and the membrane buckles. The instability from flat to buckled bilayer occurs as the area mismatch between the bilayer and unstretched cytoskeleton unit is increased, or as the cytoskeleton stiffness increases. Alternatively, decreasing the bilayer bending modulus or increasing its spontaneous curvature, also gives rise to a buckling instability.
The behavior we have just described can now be implemented for an array of identical units, where we consider a transition from all units being flat, to one unit that buckles and relieves the tension throughout the array (Figure 5.3C). The fluid bilayer can easily flow between the cytoskeleton units, so that the entire excess area can be (theoretically) concentrated at one unit, which buds and vesiculates. This picture allows us to calculate the equilibrium configuration of such a system, and find the critical area mismatch leading to vesiculation.
In reality, this process of membrane flow and vesicle growth leads to formation of vesicles with some size distribution, with typical diameters 80–300 nm, and of both spherical and cylindrical shapes. This observation indicates that as the vesi-cles grow there are various forces that destabilize the growing vesicle, leading to its detachment. The most dominant force leading to vesicle pinching and detach-ment arises from line tension due to the different composition of the bilayer at the growing bud as compared to the surrounding membrane (Figure 5.1C) (128). Note that the bending modulus of the bilayer in the growing bud is lowered due to the aggregation of membrane proteins (97), further lowering the energy cost of vesicle formation. In vivo, the vesicles may furthermore be detached from the cell due to the forces of the shear flow.
The location of the growing vesicle in the array may be random, as nucleation is driven by thermal fluctuation over an energy barrier. The local shape of the membrane does play a role, as there is evidence that vesicle is shed preferentially from highly curved regions such as the tips of spicules (97, 129, 154, 160, 207). The high curvature of the membrane at the tips of spicules lowers the energy cost to form a vesicle, making these regions have a lower energy barrier and increased vesicle nucleation rate.The rate of vesicle formation depends on the slowest process, which drives their formation. The two processes that determine the vesicle growth when it is driven by the cytoskeleton compression are (i) the rate of increase of stiff-
90
Red blood cell homeostasis
ness, which determines the rate of vesicle nucleation and (ii) the rate of vesicle growth, which is limited by the flow of membrane to the budded unit from the surrounding units. For example, during the natural aging process of the cell, the observed rate of membrane shedding is 20% of the area in 100 days, which translates to about one 100-nm-sized vesicle an hour. We can give a rough esti-mate of the rate at which membrane can flow in order to concentrate enough material at the budded unit to form a vesicle of this size; the number of units needed to be ‘‘drained’’ in order to form a vesicle of diameter of 100 nm is Nv
≈
SV / δs, where SV ≈5S0 is the area of the vesicle and δs ≈ S0 /10 is the excess area per unit cytoskeleton–membrane (S0 is the equilibrium area of the unstretched cytoskeleton units). The time it takes to concentrate the bilayer at the growing bud can therefore be estimated as: tv ≈ Nv /v where the flow velocity of the bilayer can be estimated as: v≈∆F/γ S0 where ∆F ≈10kBT is the energy barrier for the vesicle formation and γ is an effective friction coefficient of the bilayer as it flows past the cytoskeleton anchors (proportional to the membrane viscosity). Putting all these numbers together we get that the flow time-scale is tv≈ Nv
S03/2 ŋm/ ∆F≈ 0.1 - 1s, where ŋm is the membrane viscosity. The slowest time-
scale giving rise to one vesicle per hour during normal aging is therefore the rate of stiffness increase. Note that this estimation, based on dimensional analysis, only gives the approximate time-scale for the vesicle rate of formation.
In experiments where the stiffness increases more rapidly, for example, due to calcium loading, or by changing the membrane fluidity of the whole erythrocyte (e.g., through the cholesterol content) so that the flow time- scale increases, the two timescales may be closer and both affect the rate of vesiculation.
The model we present here predicts that membrane vesicles are effectively ‘‘extruded’’ in between the filaments of the cytoskeletal network, and are there-fore free of any spectrin cytoskeleton components. The sizes of such vesicles are also predicted to be of order 80–200 nm, corresponding to the range of sizes of network compartments in the erythrocyte cytoskeleton. Both these predictions are in agreement with the observed properties of these vesicles, as described earlier.
Integrating the models presented earlier we now suggest the following chain of events that lead to the shedding of membrane vesicles when components of the band 3-ankyrin anchors are modified and/or degraded in the erythrocyte:
91
5. Cytoskeletal control of red blood cell shape
i) Degraded or otherwise aging-modified proteins of the anchor complex, such as band 3 and band 4.2, loose the ability to bind ankyrin and spectrin, which releases the midpoint anchoring of the spectrin filament.
ii) The increased tension lowers the energy barrier for local membrane budding. Note that the estimated increase in local stiffness of an individual spectrin filament is by a factor of 1.5–2, which is much larger than the overall 50% increase in stiffness of the whole network observed in the senescent eryth-rocyte. This indicates that the overall network connectivity also decreases, through dissociation of the spectrin tetramers.
iii) The modified, released band 3 molecules are free to diffuse in the membrane, and to aggregate at regions that are far from the spectrin filaments, that is, at the middle of the membrane patch. The degraded band 3 can be linked by oxidatively damaged hemoglobin; denatured hemoglobin has a high affinity for the cytoplasmic domain of band 3, and aggregation of damaged hemo-globin leads to aggregation of band 3. This leads to conformational changes in band 3 that are antigenic. Binding of damaged hemoglobin to band 3 further leads to conformational changes in both the cytoplasmic and membrane domains, leading to increased sensitivity to proteases and thereby to aggre-gation and senescent cell antigen activity.
iv) Furthermore, the degraded proteins aggregated at the free membrane patch in the budding unit may further drive the vesicle formation due to an emergent convex spontaneous curvature. This may arise from the formation of an aggregate with strong asymmetry between the proteins at the inner and outer bilayer leaflets (see step iii). Molecules such as IgG, found in high concentrations on vesicles, may also induce spontaneous curvature due to their asymmetric form. A convex spontaneous curvature further lowers the energy barrier toward local budding and vesicle growth.
v) Finally, the aggregated proteins and lipids at the growing bud drive the pinching of the bud and its detachment as a free vesicle, due to the line tension that forms along the perimeter of the domain aggregate.
Thus, we have described an interesting self-regulating system in which the process of aging-related modification and/or degradation of some key proteins
92
Red blood cell homeostasis
such as band 3 initiate the physical process of membrane vesiculation, which allows the cell to shed defective components.
Also, the asymmetric lipid composition of the erythrocyte bilayer may play an additional role in vesicle formation. In the normal cell, PS is biased toward the inner leaflet of the plasma membrane due to the activity of various enzymes and to their attractive interactions with the spectrin filaments. Similar to the role played by the band 3-ankyrin anchors, the negatively charged PS on the inner leaflet of the bilayer increases the attraction between the spectrin filaments and the bilayer. Releasing these attractive interactions through the flip-flop of PS will have an effect that is similar to the breakage of the band 3-ankyrin anchors, that is, an increase in cytoskeleton stiffness and compression. Furthermore, as the spectrin anchors break and the filaments become, on average, more distant from the bilayer their interaction with the charged lipids weakens, lowering the local asymmetry between the leaflets further. Indeed, the lipid asymmetry in vesicles is lower than in the membrane of the healthy, intact erythrocyte. The distinct protein and lipid composition of the bilayer at the growing bud and consequent vesicle may be instrumental in driving the vesicle detachment, as discussed earlier.
Conclusions
The model described above has several biological implications: (i) vesicle forma-tion is a relevant biomarker for erythrocyte homeostasis, both in vivo and in vitro; (ii) manipulation of the lipid composition of the erythrocyte membrane may be instrumental in improving erythrocyte quality, for example, in blood bank conditions; (iii) manipulation of protein modification, including but possibly not restricted to prevention of oxidation and/or proteolysis, may result in a more robust erythrocyte; (iv) more detailed, molecular elucidation of the vesicle composition is necessary to falsify our hypotheses.
The physicochemical mechanisms that we have proposed to drive the vesicula-tion process in the eythrocyte can be tested experimentally. For example, to test our proposal that the compressive force of the cytoskeleton on the bilayer can drive the vesicle formation, one could apply calcium loading which drives vesic-ulation, while balancing it by swelling the cell through osmotic pressure. If there
93
5. Cytoskeletal control of red blood cell shape
is an osmotic swelling that cancels the effect of the increased calcium concen-tration, this will show that indeed the force balance at the membrane plays a crucial role in driving the vesicle formation. The relationship between the rate of compression increase at the membrane and the rate of vesicle shedding has not been well studied so far, and can also be compared to the theoretical calcu-lations.
From a theoretical point of view, the challenges that remain for a complete description of the complex dynamics of the erythrocyte membrane are numerous. Regarding the vesiculation processes we discussed here, we can chart the following tentative directions for future theoretical progress. On a micro-scopic scale, future numerical simulations that describe the individual spectrin filaments as worm-like chains can be extended to include the fluid and flexible nature of the bilayer. These simulations will then allow a detailed testing of the coarse-grained models we presented here for the cytoskeleton-induced budding and vesicle formation. These models can then be further elaborated by including the complex composition of the bilayer, allowing for the segregation and aggre-gation of membrane domains, and the consequences these have on the vesicu-lation process.
At the coarse-grained level, one could combine the models that we presented into a single model that describes the stiffness of the spectrin filaments by their anchoring state, together with the bilayer deformation. The local membrane composition is then added using standard Ginzburg–Landau formalism to capture the phase separation of the bilayer components into domains, and to describe how these domains are coupled to the local bilayer shape. These combined models can then be used to chart the equilibrium states of the system, or dynamically using a linear stability analysis, and using simulations for the full nonlinear evolu-tion. As one elaborates the theoretical models of this system, either through detailed molecular-scale simulations or using coarse-grained descriptions, there will be a need for detailed experimental data to supply the necessary values for the parameters appearing in the models. The validity of such models will have to be tested experimentally, and they will hopefully provide us with a comprehen-sive understanding of the key mechanisms that dominate the evolution of this complex biological system.

95
PUBLISHED AS:
JCA Cluitmans1, F Gevi2, A Matte3, JK Freitas Leal1, L DeFranceschi3, L Zolla2, R Brock1,
MJW Adjobo-Hermans1, GJGCM Bosman1
1 Department of Biochemistry, Radboud University Nijmegen Medical Centre,
Nijmegen Centre for Molecular Life Sciences, Nijmegen, the Netherlands;
2 Department of Translational Physiology, Academic Medical Centre, University of
Amsterdam, The Netherlands;
3 Department of Laboratory Medicine - Laboratory of Medical Immunology, Radboud Univer-
sity Nijmegen Medical Centre, Nijmegen Institute for Infection, Inflammation and Immunity,
Nijmegen, The Netherlands.
Frontiers in Molecular Biosciences; doi: 10.3389/fmolb.2016.00010
Red blood cell homeostasis:
pharmacological interventions to explore biochemical, morphological and mechanical properties
96
Red blood cell homeostasis
Abstract
During their passage through the circulation, red blood cells (RBCs) encounter severe physiological conditions consisting of mechanical stress, oxidative damage and fast changes in ionic and osmotic conditions. In order to survive for 120 days, RBCs adapt to their surroundings by subtle regulation of membrane organization and metabolism. RBC homeostasis depends on interactions between the integral membrane protein band 3 with other membrane and cytoskeletal proteins, and with key enzymes of various metabolic pathways. These interactions are regu-lated by the binding of deoxyhemoglobin to band 3, and by a signaling network revolving around Lyn kinase and Syk kinase-mediated phosphorylation of band 3. Here we show that band 3-centered manipulation of the interaction between the lipid bilayer and the cytoskeleton, using various treatments that interfere with tyrosine phosphorylation, has various effects on: (1) morphology, as shown by high resolution microscopy and quantitative image analysis; (2) organization of membrane proteins, as indicated by immunofluorescence confocal micros-copy and quantitative as well as qualitative analysis of vesicle generation; (3) membrane lipid organization, as indicated by flow cytometric analysis of phos-phatidylserine exposure; (4) deformability, as assessed in capillary-mimicking circumstances using a microfluidics system; (5) deformability as determined using a spleen-mimicking device; (6) metabolic activity as indicated by metab-olomics. Our data show that there is a complex relationship between red cell morphology, membrane organization and deformability. Also, our data show that red blood cells have a relatively high resistance to disturbance of membrane organization in vitro, which may reflect their capacity to withstand mechanical, oxidative and osmotic stress in vivo.
97
6. RBC homeostasis, morphology and deformability
Introduction
Despite constant exposure to oxidative and mechanical stress and fast changes in ionic and osmotic conditions, red blood cells survive for approximately 120 days in the circulation. In healthy individuals, physiological wear and tear leads to the appearance of immune recognition and removal signals, resulting in phago-cytosis. This physiological aging process is disturbed by mutations in hemoglobin, membrane proteins or metabolic enzymes (26, 62, 142), and by various multifac-torial, systemic pathological conditions such as inflammation (84).
RBC homeostasis is regulated by interactions between proteins in and associ-ated with the plasma membrane. These interactions revolve around band 3. As the main component of the two complexes that link the cytoskeleton to the lipid bilayer (the ‘ankyrin complex’ and the ‘junctional complex’), band 3 plays a central role in the control of cell morphology and deformability. Also, as a binding partner of both deoxyhemoglobin and key enzymes of the glycolysis, band 3 is the link between the oxygen-dependent, metabolic tradeoff between the use of glucose either in glycolysis for production of ATP or in the pentose phos-phate pathway for protection against oxidation by production of NADPH (87). A signaling network revolving around Lyn and Syk kinase-mediated phosphory-lation of band 3 is involved in the regulation of many, if not all these processes. Activation of Syk is the initial signal of this pathway and leads to tyrosine phos-phorylation of band 3. Consecutively, Lyn is activated and translocates to the membrane where it phosphorylates its target residues on band 3 (46, 95).
Mutations in the main RBC proteins are associated with altered morphology, decreased stability, and/or increased removal, many of which result in anemia (182). It has been proposed that mutations in membrane proteins that affect horizontal or lateral interactions, such as the spectrin dimer-dimer structure and the spectrin-actin-protein 4.1R junctional complex, lead to elliptocytosis and membrane fragmentation. Mutations in proteins involved in vertical inter-actions, such as the binding of the spectrin cytoskeleton to the band 3-ankyrin complex, are thought to induce vesiculation-associated membrane loss, and the concomitant appearance of spherocytes (182, 239). However, there is no clear association, not even for a protein as central in membrane organization as band 3, between genotype, RBC morphology and clinical phenotype. Also, there is only a limited number of data on the effect of a disturbance of membrane protein inter-
98
Red blood cell homeostasis
actions on RBC metabolism. Thus, there is an unmet need for a molecular frame-work that explains the effect of alterations in one protein on the interaction with its partners and the concomitant effects on RBC morphology and function. Such a framework would be of great benefit for understanding the causes of anemia, including the role of vesiculation and the spleen (252).
It was the aim of this study to improve our understanding of the structure-func-tion relationship of the RBC membrane morphology by treating RBCs with agents that disturb the organization of the RBC cytoskeleton-membrane complex through their effect on band 3. DIDS is an inhibitor of band 3-cata-lyzed anion exchange that, upon binding to its membrane domain, reduces the linkage between the lipid bilayer and the cytoskeleton, resulting in an echinocyte cell shape (242). Treatment of RBCs with the thiol-alkylating reagent N-ethyl-maleimide (NEM) modifies thiol groups in the N-terminal cytoplasmic domain of band 3, and thereby disturbs the ankyrin-band 3 interaction (19, 115). NEM also affects the phosphorylation status of band 3, by acting as a protein phospha-tase inhibitor (23). Finally, phosphorylation of band 3 was manipulated by treating RBCs with the phosphatase inhibitor orthovanadate and the Src family kinase-in-hibitor PP2, both affecting the association of band 3 with the cytoskeleton (43, 44, 95, 162, 197).
We compared the morphological, structural and functional effects of these treatments. Even for interventions that all affect the band 3 complex, a diver-sity of structural and functional changes was observed. Our data show that the main current theories, in which changes in cell morphology are directly linked to disturbances in horizontal linkage within the lipid bilayer, or to vertical linkages between the lipid bilayer and the cytoskeleton, do not have sufficient heuristic power to explain all the structural and functional changes.
Materials and methods
Sample collection and ethical issues Fresh RBCs were isolated from five ml whole blood (EDTA) from healthy volun-teers. RBCs were washed using Ringer solution (125 mmol/L NaCl, 5 mmol/L KCl, 1 mmol/L MgSO4, 2.5 mmol/L CaCl2, 5 mmol/L glucose, 32 mmol/L HEPES/NaOH, pH7.4) by repeated centrifugation (5 min, 1550 x g). Written informed
99
6. RBC homeostasis, morphology and deformability
consent was obtained from all donors participating in this study. The study was performed following the guidelines of the local medical ethical committee and in accordance with the declaration of Helsinki.
Treatments of the RBCs RBCs (2% hematocrit) were incubated for 30 min at 37°C in Ringer solu-tion containing 100 µM 4,4'-diisothiocyanostilbene-2,2'-disulfonic acid (DIDS, Sigma-Aldrich, St. Louis MO, USA) or 50 µM N-ethylmaleimide (NEM, Sigma-Al-drich, St. Louis MO, USA). Phosphorylation was manipulated by incubation with 100 µM orthovanadate (Sigma-Aldrich, St. Louis MO, USA) or 20 µM PP2 (Sigma-Aldrich, St. Louis MO, USA). PP2 was solved in DMSO and then diluted in Ringer to a solution with a final concentration of 0.1% DMSO. After treatment, the RBCs were washed twice in Ringer solution by centrifugation (3 minutes, 400 x g) before analysis.
Cell classification Cells were resuspended in Ringer solution, poured into Lab-Tek chambered cover-glass (Thermo Fisher Scientific, Rochester NY, USA) and random field pictures were taken for morphological classification. Microscopy was performed on a TCS SP5 confocal laser scanning microscope (Leica Microsystems, Mannheim, Germany) equipped with an HCX Plan-Apochromat 63X/N.A. 1.2 water immer-sion lens. Image J version 1.45j (U. S. National Institutes of Health, Bethesda MD, USA, http://imagej.nih.gov/ij/) was used for image analyses.
Immunofluorescence After treatment, the RBCs were fixated and stained as described before (175). 1% BSA was used instead of fish skin gelatin for blocking purposes. Primary antibodies and relative dilutions were: mouse anti-stomatin (GARP-50, kindly provided by Rainer Prohaska, University of Vienna, Austria) at 1:200, mouse anti-band 3 N-terminal domain (B3-136, Sigma-Aldrich, St. Louis MO, USA) at 1:100 and mouse anti-band 3 C-terminal domain (IVF12, Developmental Studies Hybridoma Bank, Iowa City, IA, USA) at 1:100. The secondary antibody was goat anti-mouse Alexa-488 (Invitrogen, Carlsbad CA, USA) at 1:1000 dilution. Image analysis and single cell fluorescence determination were carried out using ImageJ version 1.45J.
100
Red blood cell homeostasis
Phosphatidylserine exposure After treatment, two million RBCs were resuspended in 25 µL of Ringer and incubated for 45 minutes at room temperature in the dark with Fluos–labeled annexin V (1:25, Roche, Indianapolis, IN) to label exposed phosphatidylserine (PS). After washing, the RBCs were analyzed with a flow cytometer (FACSCalibur, BD Biosciences, Franklin Lakes NJ, USA) and Cellquest Pro software version 6.0 (BD Biosciences, Franklin Lakes NJ, USA) was used. Data analysis was performed with Cyan Summit software v4.3 (Beckman-Coulter, Fullerton CA, USA). Results are expressed as percentages of annexin V–positive RBCs.
Measurement of acetylcholinesterase activity Acetylcholinesterase (AChE) activity was measured using Ellman’s method (217), using 2x10⁶ cells or, for vesicle measurements, the supernatant of 2x10⁷ cells.
Microfluidics RBC deformation within the microcapillaries was simulated with a microfluidic device as described before (53). Cells were diluted to a hematocrit of 2% in Ringer solution with 1% BSA. Perfusion of the cell suspension through the microfluidic channels was done with computer-controlled syringe pumps (neMESYS, Cetoni, Germany) for accurate adjustment of the flow rates. In all experiments a constant volumetric flow rate of 25 µl/h was used, which corresponds to a flow velocity of 0.63 cm/s in the narrow channel. Images of up to 1250 frames per second of the field-of-view were recorded for quantitative image processing. Cell flow was observed through a 100X oil immersion objective (Olympus UPLFLN 100X, N.A. 1.30) using an optical microscope (IX71, Olympus B.V., The Netherlands) equipped with a high speed CMOS camera (Phantom high speed camera, Vision Research, UK). Snapshots of RBC shape were obtained using a short exposure time of 10 µs. A sequence of images of 20,000 in each run was recorded. The RBCs in these images were analyzed using the length and width of a rectangular box enclosing the deformed RBC measured by a macro developed for automated image processing using ImageJ. With these values, the deformation index (DI), defined as the ratio between the sides (DI=length/width) was calculated. Bead-sorting device RBC deformability was assessed using a bead-sorting device that mimics the mechanical deformation that RBCs experience in the spleen (78). RBCs were treated as described above, after which the RBCs (1x10⁸) were labeled with
101
6. RBC homeostasis, morphology and deformability
CFSE diacetate (Thermo Fisher Scientific). A 2% hematocrit suspension(600 μl) consisting of 5% treated/labeled and 95% untreated/unlabeled RBCs in Ringer with 1% BSA was passed through the bead-sorting device at a flow rate of 60 ml/h. The untreated/unlabeled RBCs acted as both facilitators of steady perfusion of the cells of interest, and as an internal control for deformability. The percentages of CFSE-positive cells in the various samples were determined by flow cytometry (100,000 cells), and the percentages in the retained and downstream fractions were normalized to the labeled cells in the upstream samples.
Phospho-immunoblotting Membrane fractions from control and treated red cells were prepared as previ-ously reported (71, 72, 130). Proteins were separated by 1D-electrophoresis, transferred to membranes, and probed with the following specific antibodies: anti-Lyn antibody (2732, Cell Signaling, USA), anti-phospho-Lyn (P-Lyn; Cell Signaling, USA), anti-Syk (Cell Signaling; USA) and anti-phospho-Syk (P-Syk; Cell Signaling; USA); anti-SH-PTP1 (SantaCruz; USA); Phospho-Tyr 564 SH-PTP1 (anti-P-SH-PTP1 564; Cell Signaling, USA). Densitometric analysis of band inten-sities was carried out by Quantity One analysis software (Bio-Rad, Hercules, CA, USA) (69, 71, 164, 201).
Metabolomic analysis Metabolomes were charted as described before (60). In short, packed RBCs were lysed, extracted with chloroform/methanol, and treated with acetonitrile to precipitate proteins. Metabolites in the lysate were separated on an Ulti-mate 3000 Rapid Resolution HPLC system with a Reprosil C18 column. MS analysis was performed, both at downstream negative and positive ion mode, on an electrospray hybrid quadropole time-of-flight mass spectrometer Micro-TOF-Q (Bruker-Daltonik, Germany) equipped with an ESI-ion source. Data were acquired with a stored mass range of m/z 50-1200. The SmartFormula3D TM software (Bruker Daltonics) was used to calculate molecular formulae based on the isotopic and fragmentation patterns.
102
Red blood cell homeostasis
Results
Cell morphology and membrane organizationTo better define the structure-activity relationship of band 3 and RBC morphology, we subjected RBCs to a series of treatments known to interfere with band 3 function. Remarkably, in spite of this restriction in the choice of compounds, very different effects were observed. Incubation with DIDS at concentrations known to induce band 3 crosslinking as well as the loss of low and high affinity ankyrin-binding sites, induced the formation of stable echinocytes, as described before (95, 187, 242). In contrast, NEM, that affects the conformation of the cyto-plasmic domain did not have a distinct effect on morphology (Figure 6.1A), which is in agreement with previous observations (19). An overall increase in phosphor-ylation status induced by the phosphatase inhibitor orthovanadate resulted in the appearance of echinocytes as well as spherocytes (95). Inhibition of Src-family kinase activity by PP2 did not show an effect on cell morphology (Figure 6.1A).
In order to assess the effect of these treatments on the interactions of band 3 with its partners in the membrane-cytoskeleton complex, we investigated concomitant changes in protein and lipid organization using immunofluores-cence confocal microscopy. Remarkably, membrane organization was changed at the molecular level also after treatments that did not have a visible effect on cell morphology. Staining with an antibody against the N-terminal domain of band 3 shows a punctuated pattern in control cells, that, upon treatment with NEM, becomes much more diffuse (Figure 6.1). Treatment with DIDS, which had a profound impact on morphology, induced a similar pattern, at least in some cells. In contrast, the actin antibody stains the control cells, but not the NEM-treated or some of the DIDS-treated RBCs (Figure 6.1B).
Lipid distribution can also be influenced by changes in the membrane-cytoskel-eton complex organization, with phospatidylserine (PS) exposure on the outside of the cell membrane being the most prominent change, and associated with vesiculation and aging (147). However, only orthovanadate led to an increase in PS exposure, indicating that the disruption of the organization of band 3 complexes had no dramatic effect on phospholipid asymmetry (Figure 6.1C).
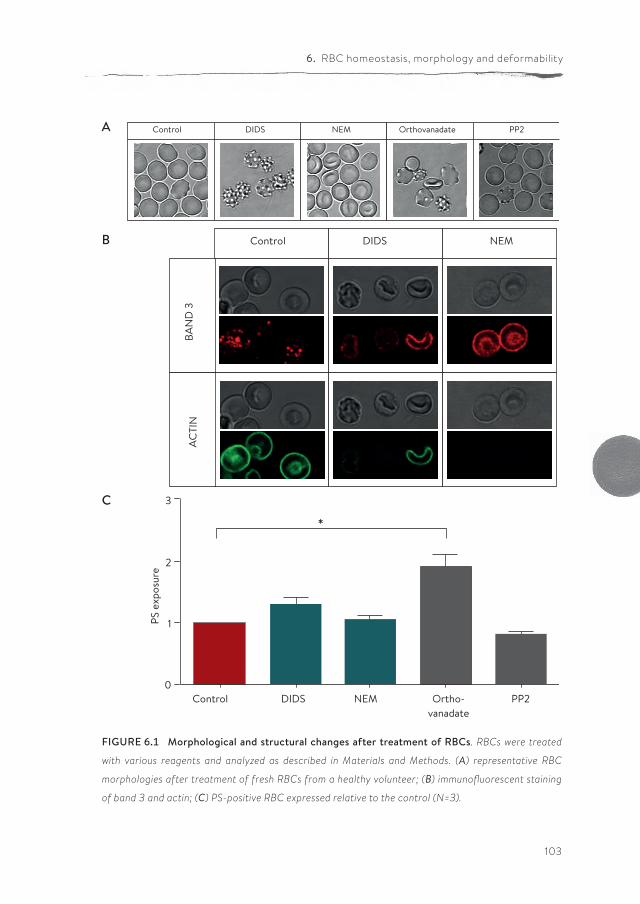
103
6. RBC homeostasis, morphology and deformability
FIGURE 6.1 Morphological and structural changes after treatment of RBCs. RBCs were treated
with various reagents and analyzed as described in Materials and Methods. (A) representative RBC
morphologies after treatment of fresh RBCs from a healthy volunteer; (B) immunofluorescent staining
of band 3 and actin; (C) PS-positive RBC expressed relative to the control (N=3).
Control DIDS NEM Orthovanadate PP2
Control DIDS NEM
BAN
D 3
ACTI
N
PS e
xpos
ure
Control
*
0
2
3
1
DIDS NEM Ortho-vanadate
PP2
A
B
C
104
Red blood cell homeostasis
PhosphorylationWe previously showed that the Syk-Lyn pathway plays a key role in the modulation of membrane-cytoskeleton protein-protein and protein-lipid bilayer interactions (71, 164, 195). Using cell fractionation and immunoblot analysis, we evaluated the effect of various treatments on membrane translocation of phospho-Syk (P-Syk) and phospho-Lyn (P-Lyn), the active forms of these kinases (71). DIDS, NEM and orthovanadate led to Syk and Lyn activation (Figure 6.2). In PP2-treated cells we found a significant reduction in the membrane association of P-Lyn compared to control cells, whereas no differences in membrane association of P-Syk were observed (Figure 6.2). This finding is in agreement with previous reports (71, 197). We then evaluated the phosphorylation status of SH-protein tyrosine phospha-tase-1 (SH-PTP1), as this enzyme has been functionally linked to Lyn in various cell models (58, 67, 191). Interestingly, we observed a reduction in SH-PTP1 activa-tion (P-SH-PTP1 Tyr 564) in RBCs treated with the Lyn inhibitor PP2 (Figure 6.2), suggesting that Lyn may be a downstream regulator of SH-PTP1 in human RBCs.
Deformability Deformability plays a key role in RBC functioning in vivo and is closely related to the cytoskeleton-membrane interactions. To further complement the morpho-logical studies with a dynamic assessment of deformability, we studied changes in deformation capacity with two techniques that simulate circulation through microcapillaries and passage through the spleen in vivo.
Treatment with DIDS and NEM led to a decrease in deformability in the micro-channels of a microfluidic device mimicking the microcapillaries (53), as did treatment with the Lyn kinase inhibitor PP2 (Figure 6.3A). In contrast, an increase in the phosphorylation state upon treatment with orthovanadate resulted in an increase in deformability (Figure 6.3A). When RBCs were passed through a bead-sorting device, mimicking the inter-endothelial slits in the spleen, the capacity to deform was significantly impaired after treatment with DIDS, whereas the other treatments had no effect (Figure 6.3B). On the other hand, incubation with DIDS was the only treatment that did not impair the capacity of RBCs to elon-gate under large shear stress in the LORCA ektacytometer or in the ARCA rheo-scope (data not shown). These findings are similar to those previously reported for DIDS and NEM (19, 50, 242). Vesiculation may be an important factor that influences deformability by its effects on the surface-to-volume ratio. The latter also affects osmotic fragility. Therefore, in order to assess if changes in deform-
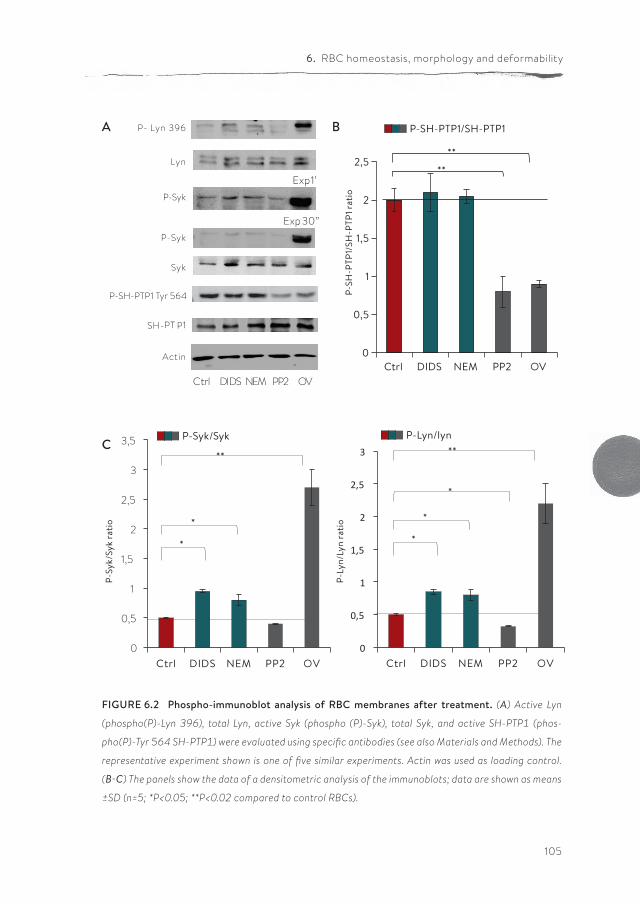
105
6. RBC homeostasis, morphology and deformability
FIGURE 6.2 Phospho-immunoblot analysis of RBC membranes after treatment. (A) Active Lyn
(phospho(P)-Lyn 396), total Lyn, active Syk (phospho (P)-Syk), total Syk, and active SH-PTP1 (phos-
pho(P)-Tyr 564 SH-PTP1) were evaluated using specific antibodies (see also Materials and Methods). The
representative experiment shown is one of five similar experiments. Actin was used as loading control.
(B-C) The panels show the data of a densitometric analysis of the immunoblots; data are shown as means
±SD (n=5; *P<0.05; **P<0.02 compared to control RBCs).
*
*
**
*
*
**
0
0,5
1
1,5
2
2,5
3
3,5
Ctrl DIDS NEM PP2 OV0
0,5
1
1,5
2
2,5
3
Ctrl DIDS NEM PP2 OV
*
Ctrl DIDS NEM PP2 OV
Exp. 30”
Exp. 1’
0
0,5
1
1,5
2
2,5
Ctrl DIDS NEM PP2 OV
P-SH-PTP1/SH-PTP1
**
**
P-SH-PTP1 Tyr 564
P- Lyn 396
Lyn
P-Syk
P-Syk
Syk
SH-PT P1
ActinP-
SH-P
TP1/
SH-P
TP1 r
atio
P-Sy
k/Sy
k ra
tio
P-Ly
n/Ly
n ra
tio
P-Syk/Syk P-Lyn/lyn
A
C
B
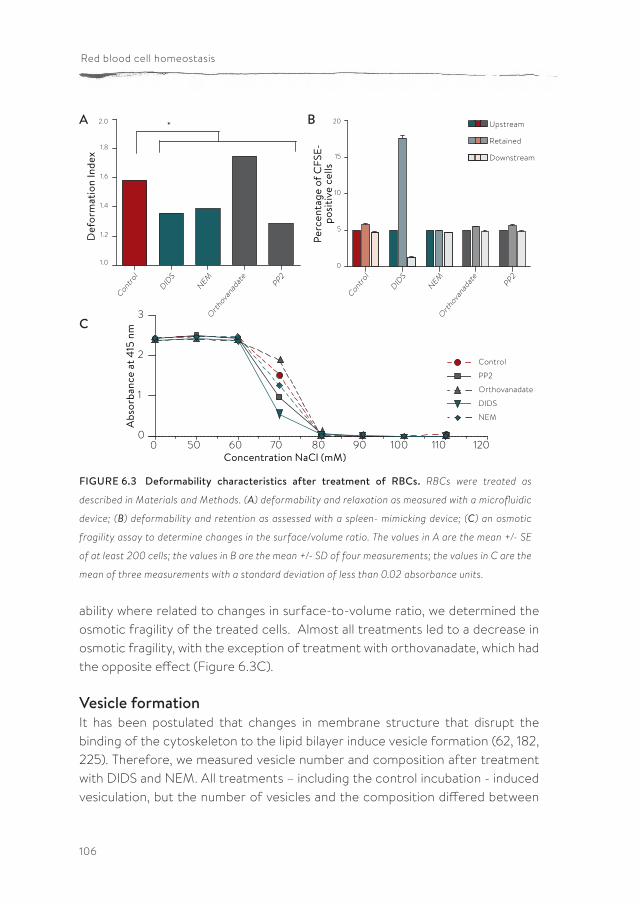
106
Red blood cell homeostasis
ability where related to changes in surface-to-volume ratio, we determined the osmotic fragility of the treated cells. Almost all treatments led to a decrease in osmotic fragility, with the exception of treatment with orthovanadate, which had the opposite effect (Figure 6.3C).
Vesicle formationIt has been postulated that changes in membrane structure that disrupt the binding of the cytoskeleton to the lipid bilayer induce vesicle formation (62, 182, 225). Therefore, we measured vesicle number and composition after treatment with DIDS and NEM. All treatments – including the control incubation - induced vesiculation, but the number of vesicles and the composition differed between
FIGURE 6.3 Deformability characteristics after treatment of RBCs. RBCs were treated as
described in Materials and Methods. (A) deformability and relaxation as measured with a microfluidic
device; (B) deformability and retention as assessed with a spleen- mimicking device; (C) an osmotic
fragility assay to determine changes in the surface/volume ratio. The values in A are the mean +/- SE
of at least 200 cells; the values in B are the mean +/- SD of four measurements; the values in C are the
mean of three measurements with a standard deviation of less than 0.02 absorbance units.
Contro
lDID
SNEM
Orth
ovanad
ate
PP2
1.0
1.2
1.4
1.6
1.8
2.0 *
Def
orm
atio
n In
dex
Contro
lDID
SNEM
Orth
ovanad
ate
PP20
5
10
15
20 Upstream
Retained
Downstream
Perc
enta
ge o
f CFS
E-po
sitiv
e ce
lls
50 60 70 80 90 100 110 1200
1
2
3
Control
PP2
Orthovanadate
DIDS
NEM
0Concentration NaCl (mM)
Abs
orba
nce
at 4
15 n
mA
C
B
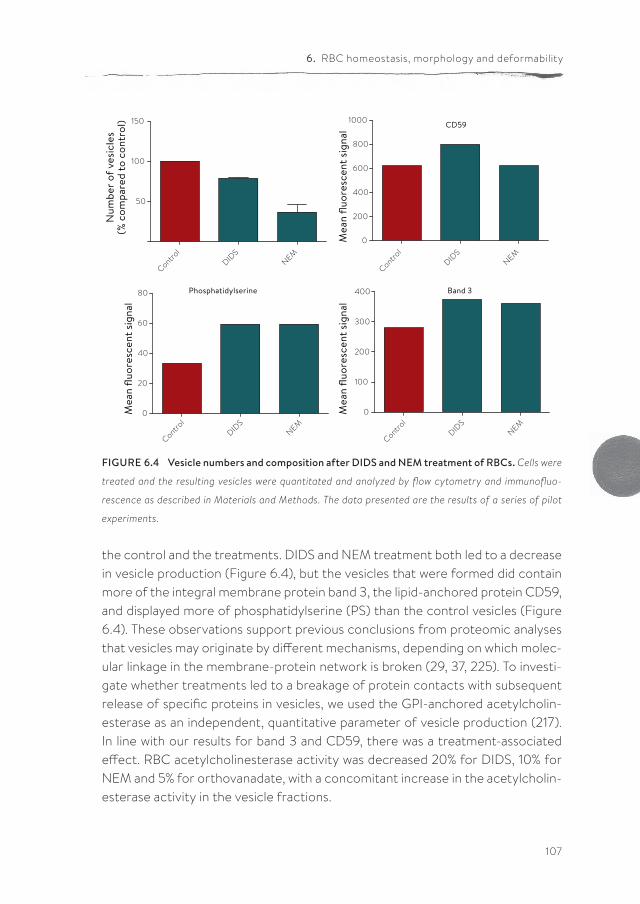
107
6. RBC homeostasis, morphology and deformability
the control and the treatments. DIDS and NEM treatment both led to a decrease in vesicle production (Figure 6.4), but the vesicles that were formed did contain more of the integral membrane protein band 3, the lipid-anchored protein CD59, and displayed more of phosphatidylserine (PS) than the control vesicles (Figure 6.4). These observations support previous conclusions from proteomic analyses that vesicles may originate by different mechanisms, depending on which molec-ular linkage in the membrane-protein network is broken (29, 37, 225). To investi-gate whether treatments led to a breakage of protein contacts with subsequent release of specific proteins in vesicles, we used the GPI-anchored acetylcholin-esterase as an independent, quantitative parameter of vesicle production (217). In line with our results for band 3 and CD59, there was a treatment-associated effect. RBC acetylcholinesterase activity was decreased 20% for DIDS, 10% for NEM and 5% for orthovanadate, with a concomitant increase in the acetylcholin-esterase activity in the vesicle fractions.
FIGURE 6.4 Vesicle numbers and composition after DIDS and NEM treatment of RBCs. Cells were
treated and the resulting vesicles were quantitated and analyzed by flow cytometry and immunofluo-
rescence as described in Materials and Methods. The data presented are the results of a series of pilot
experiments.
Control
DIDS
NEM
50
100
150N
umbe
r of v
esic
les
(% c
ompa
red
to c
ontr
ol) CD59
Control
DIDS
NEM
0
200
400
600
800
1000
Mea
n flu
ores
cent
sig
nal
Phosphatidylserine
Control
DIDS
NEM0
20
40
60
80
Mea
n flu
ores
cent
sig
nal
Band 3
Control
DIDS
NEM
0
100
200
300
400
Mea
n flu
ores
cent
sig
nal
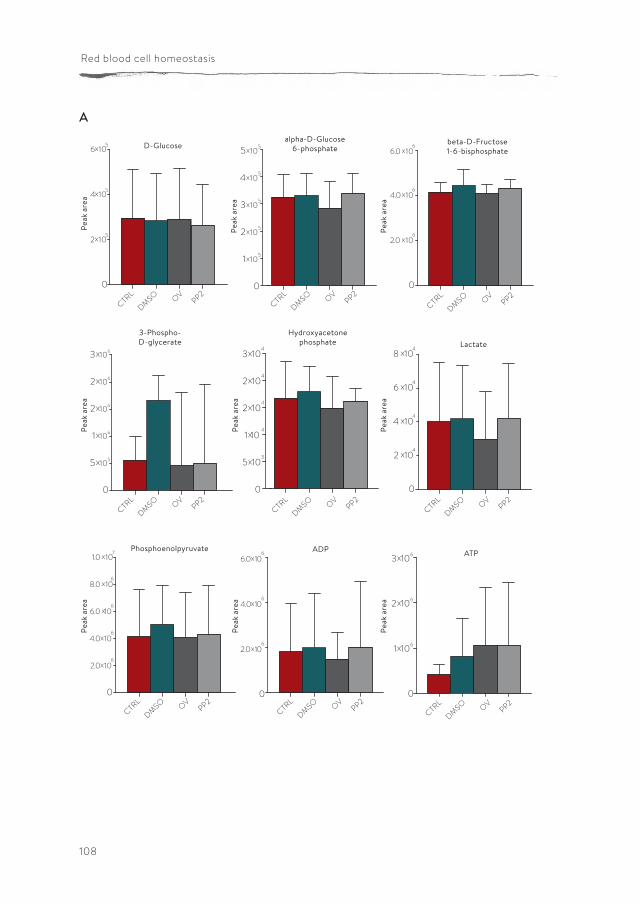
108
Red blood cell homeostasis
0
2.0 x10
4.0x10
6.0 x10beta-D-Fructose1-6-bisphosphate
0
x105
x105
x105
x105
1
2
3
4
5x10⁵
alpha-D-Glucose6-phosphate
0
2x10⁵
4x10⁵
6x10⁵ D-Glucose
Peak
are
a
Peak
are
a
Peak
are
a
Peak
are
a
Peak
are
a
Peak
are
a
Peak
are
a
Peak
are
a
Peak
are
a
0
5x10⁵
1x10⁶
2x10⁶
2x10⁶
3x10⁶
3-Phospho-D-glycerate
0
5x10³
1x10⁴
2x10⁴
2x10⁴
3x10⁴
Hydroxyacetonephosphate
0
2 x10⁴
4 x10⁴
6 x10⁴
8 x10⁴ Lactate
0
2.0x10⁶
4.0x10⁶
6.0 x10⁶
8.0 x10⁶
1.0 x10⁷
Phosphoenolpyruvate
0
2.0x10⁶
4.0x10⁶
6.0x10⁶ ADP
0
1x10⁶
2x10⁶
3x10⁶ ATP
6
6
6
CTRL
DMSO OVPP2
CTRL
DMSO OVPP2
CTRL
DMSO OVPP2
CTRL
DMSO OVPP2
CTRL
DMSO OVPP2
CTRL
DMSO OVPP2
CTRL
DMSO OVPP2
CTRL
DMSO OVPP2
CTRL
DMSO OVPP2
A
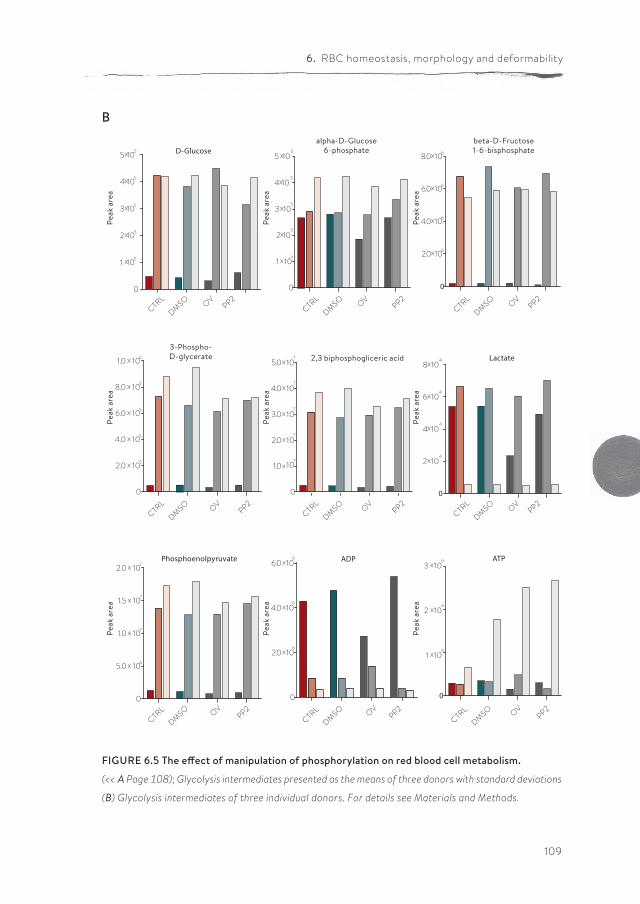
109
6. RBC homeostasis, morphology and deformability
D-Glucose
0
1 x10⁵
2x10⁵
3x10⁵
4x10⁵
5x10⁵
0
1 x10⁵
2x10⁵
3x10⁵
4x10⁵
5 x10⁵
0
2.0x10⁶
4.0x10⁶
6.0x10⁶
8.0x10⁶
0
2.0 x 10⁵
4.0 x 10⁵
6.0 x 10⁵
8.0 x 10⁵
1.0 x 10⁶ 2,3 biphosphogliceric acid
0
1.0x10⁷
2.0x10⁷
3.0x10⁷
4.0x10⁷
5.0x10⁷ Lactate
0
2x10⁴
4x10⁴
6x10⁴
8x10⁴
Phosphoenolpyruvate
0
5.0 x 10⁶
1.0 x 10⁷
1.5 x 10⁷
2.0 x 10⁷ADP
0
2.0x10⁶
4.0x10⁶
6.0x10⁶ ATP
0
1 x10⁶
2 x10⁶
3 x10⁶
beta-D-Fructose1-6-bisphosphate
alpha-D-Glucose6-phosphate
CTRL
DMSO OVPP2
CTRL
DMSO OVPP2
CTRL
DMSO OVPP2
CTRL
DMSO OVPP2
CTRL
DMSO OVPP2
CTRL
DMSO OVPP2
CTRL
DMSO OVPP2
CTRL
DMSO OVPP2
CTRL
DMSO OVPP2
3-Phospho-D-glycerate
Peak
are
aPe
ak a
rea
Peak
are
a
Peak
are
aPe
ak a
rea
Peak
are
a
Peak
are
aPe
ak a
rea
Peak
are
a
FIGURE 6.5 The effect of manipulation of phosphorylation on red blood cell metabolism.
(<< A Page 108); Glycolysis intermediates presented as the means of three donors with standard deviations
(B) Glycolysis intermediates of three individual donors. For details see Materials and Methods.
B
110
Red blood cell homeostasis
MetabolismNext to having an impact on RBC morphology and dynamic behavior, changes in band 3 conformation and phosphorylation may affect glycolysis as well as the pentose phosphate pathway (PPP) (46, 87, 95). In a series of pilot experi-ments, we found that incubation of RBCs with DIDS had an inhibitory effect on glycolysis (Cluitmans et al., unpublished). In physiological circumstances, i.e. at ample glucose supply, a decrease in the rate of the glycolysis is accompanied by an increase in the activity of the pentose phosphate pathway (87). In line with this mutual interdependence, the same preliminary data indicated that incuba-tion with DIDS resulted in an increase in NADPH, the primary product of the pentose phosphate pathway. In order to explore the underlying, physiological signaling mechanisms, we examined the effect of manipulation of phosphory-lation signaling on the metabolomic profile, using the RBCs of three individuals. In contrast to our findings for DIDS, our data did not show significant effects of manipulation of phosphorylation on the concentration of glycolysis metab-olites (Figure 6.5). Orthovanadate increased the concentration of cyclic AMP, indicating an overall effect on intracellular signaling, but had no effect on inosi-tol-1-phosphate and phosphatidylinositol-3,4,5,-trisphosphate levels (Cluitmans et al., data not shown). Also, we found no consistent effects of orthovanadate or PP2 on the pentose phosphate pathway intermediates, nor on the reduced gluthation (GSH)/oxidized gluthation (GSSG) ratios. Incubation with PP2 did not result in any significant changes in the concentrations of the glycolysis or pentose phoshate pathway intermediates (Figure 6.5). However, our data indi-cate that there may be considerable inter-individual variability in the suscepti-bility to such manipulations. This susceptibility extends to the effects of DMSO, as a solvent control for PP2 (Figure 6.5).
Discussion
Various mechanisms have been postulated for the generation of abnormally shaped RBCs. These theories revolve around a weakening of the linkage between the cytoskeleton and the lipid bilayer. After an initial screening of a number of compounds, we analyzed the effects of the band 3-directed agents DIDS, NEM, PP2 and orthovanadate on various morphological and functional RBC charac-teristics, protein localization at the plasma membrane and RBC-derived vesicles. Overall, our data warrant a critical revision of the current paradigms.
111
6. RBC homeostasis, morphology and deformability
Cell morphology and membrane organization A comparison of the cell morphology and confocal immunofluorescence data shows that changes in organization of the membrane-cytoskeleton network are not always accompanied by changes in cell morphology, and vice versa (Figure 6.1). Immunoblot analyses of band 3 and spectrin did not reveal any clear concomitant differences in membrane protein composition (data not shown), but did show differences in membrane protein phosphorylation state (Figure 6.2). The effects of DIDS and NEM on phosphorylation are remarkable, as both treat-ments do not directly interfere with kinase activity. The absence of a relation between structural changes at the membrane protein level and RBC morphology has been reported before, most notably in the case of aging-associated changes in band 3 conformation (253).
Measurement of PS exposure indicated that only treatment with orthovanadate resulted in a significant disturbance of lipid organization (Figure 6.1C). Again, a comparison of PS exposure with cell morphology (Figure 6.1A), showing the same echinocytic effect of both DIDS and orthovanadate, indicates the absence of a consistent correlation between cell morphology and membrane organization.
It has been stated that changes in cell morphology are mainly caused by surface area loss, due to loss of vertical linkage between the lipid bilayer and the cyto-skeleton and/or to loss of lateral protein interactions (62). The results of our vesicle analyses suggest that changes in cell morphology may not always be due to loss of membrane per se. A combination of quantitative and qualitative vesicle analyses strongly indicates that proteins are lost from the cell membrane as a result of breaking contacts in the membrane-cytoskeleton complex. Each distur-bance of membrane organization results in a specific vesicle population, and an associated loss of specific proteins. A similar conclusion, that was based on theo-retical considerations, has been substantiated by a comparison of the vesicles generated during aging in vivo with those generated during aging in vitro in blood bank storage conditions (29, 37, 107, 225). In addition, comparison of the vesicle data with the PS data show that changes in membrane lipid organization may be associated with, but are not essential for, vesicle generation.
112
Red blood cell homeostasis
Cell morphology, membrane organization and deformabilityThere is a notable lack of correlation between morphology and deformability in the capillary-mimicking circumstances of the microfluidic device. For example, an echinocytic morphology induced by DIDS is associated with a decrease in deformability, whereas the deformability of the morphologically indistinguish-able echinocytes induced by orthovanadate is increased (Figure 6.1A, Figure 6.3). It should also be noted that, although DIDS and orthovanadate did not induce a shape change in all the cells, deformability was changed for the whole cell population. Furthermore, after treatment, misshapen cells behaved the same as cells with a normal morphology, suggesting that the effect on deformability is the direct result of changes in membrane organization and that shape is not a predictor of dynamic RBC behavior. In the data we have obtained so far, no consistent correlation can be found for changes in morphology, deformability, or PS exposure (54), while the latter parameters are expected to correlate with retention in the spleen. The same conclusion was drawn before for the RBCs of patients with neuroacanthocytosis. Acanthocytes did not show any differences in deformability compared to control cells (55).
Conclusions on the effect of a change in membrane organization on deforma-bility are likely to depend on the degree and type of mechanical stress employed. All treatments, except for DIDS, decreased deformability when measured under high shear stress in an ektacytometer (Cluitmans et al., data not shown), while in the spleen-mimicking device only DIDS led to a decrease in deformability. These differences trigger the question on the biological relevance of the commonly used deformability measurement techniques. Since the bead-sorting and the microfluidic device measure deformability under physiological conditions-mim-icking circumstances, these techniques seem to be preferable. It remains to be established if and how the method of analysis itself contributes to the observed effects. For example, high mechanical or osmotic stress may themselves induce vesiculation (95), and thereby reduce deformability in susceptible RBCs, that have a normal deformability in less stressful conditions. This could explain the strongly reduced capacity of the DIDS-treated cells to pass the spleen-mimicking device (Figure 6.1), and normal behavior in an ektacytometer. Echinocytes may be more susceptible to vesicle formation in these circumstances, which would lead to loss of membrane and cell surface and thereby of deformation capacity.
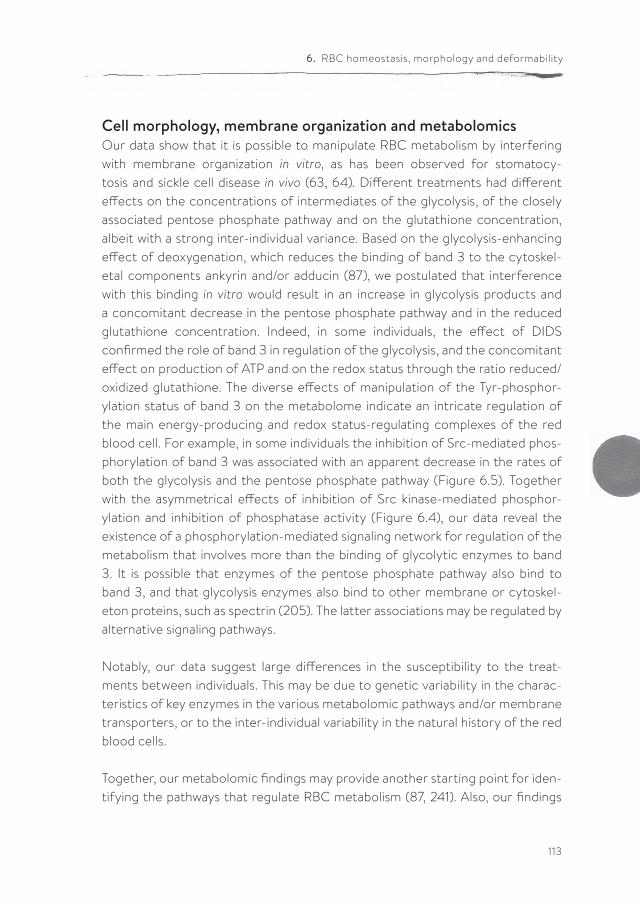
113
6. RBC homeostasis, morphology and deformability
Cell morphology, membrane organization and metabolomicsOur data show that it is possible to manipulate RBC metabolism by interfering with membrane organization in vitro, as has been observed for stomatocy-tosis and sickle cell disease in vivo (63, 64). Different treatments had different effects on the concentrations of intermediates of the glycolysis, of the closely associated pentose phosphate pathway and on the glutathione concentration, albeit with a strong inter-individual variance. Based on the glycolysis-enhancing effect of deoxygenation, which reduces the binding of band 3 to the cytoskel-etal components ankyrin and/or adducin (87), we postulated that interference with this binding in vitro would result in an increase in glycolysis products and a concomitant decrease in the pentose phosphate pathway and in the reduced glutathione concentration. Indeed, in some individuals, the effect of DIDS confirmed the role of band 3 in regulation of the glycolysis, and the concomitant effect on production of ATP and on the redox status through the ratio reduced/oxidized glutathione. The diverse effects of manipulation of the Tyr-phosphor-ylation status of band 3 on the metabolome indicate an intricate regulation of the main energy-producing and redox status-regulating complexes of the red blood cell. For example, in some individuals the inhibition of Src-mediated phos-phorylation of band 3 was associated with an apparent decrease in the rates of both the glycolysis and the pentose phosphate pathway (Figure 6.5). Together with the asymmetrical effects of inhibition of Src kinase-mediated phosphor-ylation and inhibition of phosphatase activity (Figure 6.4), our data reveal the existence of a phosphorylation-mediated signaling network for regulation of the metabolism that involves more than the binding of glycolytic enzymes to band 3. It is possible that enzymes of the pentose phosphate pathway also bind to band 3, and that glycolysis enzymes also bind to other membrane or cytoskel-eton proteins, such as spectrin (205). The latter associations may be regulated by alternative signaling pathways.
Notably, our data suggest large differences in the susceptibility to the treat-ments between individuals. This may be due to genetic variability in the charac-teristics of key enzymes in the various metabolomic pathways and/or membrane transporters, or to the inter-individual variability in the natural history of the red blood cells.
Together, our metabolomic findings may provide another starting point for iden-tifying the pathways that regulate RBC metabolism (87, 241). Also, our findings
114
Red blood cell homeostasis
stress the putative value of the RBC as a model for studying regulation of energy metabolism, with emphasis on the possibility to study glycolysis as an isolated ATP-producing process in situ.
Conclusions
Our main conclusions are:1. The main current theories on the linkage between (changes in) red blood
cell morphology and disturbances in horizontal or vertical associations in the membrane/ cytoskeleton complex, require a re-evaluation, since they do not explain all the structural and functional observations;
2. Healthy RBCs have a large capacity to withstand disturbance of membrane organization before this has functional consequences in vitro; this may very well be a consequence of the capacity to function in fast-changing conditions in vivo, including mechanical, chemical and osmotic stress;
3. In order to understand the molecular mechanisms underlying RBC-medi-ated pathology, more physiologically relevant techniques are needed, such as spleen-mimicking and capillary-mimicking devices, which reveal functional changes even if the morphology is unaffected;
4. Detailed analysis of the composition and organization of RBC-derived vesi-cles is likely to yield more specific and sensitive information than membrane organization-centered research only;
5. Metabolomic analysis may turn out to be an efficient approach for the iden-tification of the signaling routes that regulate the interaction between the RBC and it’s organism-wide environment, both in healthy and in pathological circumstances.

115
6. RBC homeostasis, morphology and deformability


117
PUBLISHED AS:
Judith C.A. Cluitmans1, Carlo Tomelleri2, Zuhal Yapici3, Sip Dinkla1, Petra Bovee-Geurts1,
Venkatachalam Chokkalingam4, Lucia De Franceschi2, Roland Brock1, Giel J.G.C.M. Bosman1
1 Department of Biochemistry, Radboud Institute for Molecular Life Sciences, Radboud
University Medical Center, Geert Grooteplein 28, 6525 GA, Nijmegen, The Netherlands
2 Department of Medicine, University of Verona-AOUI-Verona, Policlinico GB Rossi, P.le L
Scuro, 10, 37134 Verona, Italy
3 Division of Child Neurology, Department of Neurology, Istanbul Faculty of Medicine, Istanbul
University, Istanbul, Turkey
4 Department of Physical Organic Chemistry, Radboud University Nijmegen, Institute for
Molecules and Materials, Heyendaalseweg 135, 6525 AJ, Nijmegen, The Netherlands
PlosOne, 2015. DOI: 10.1371/journal.pone.0125580
ABNORMAL RED CELL STRUCTURE ANDFUNCTION IN NEURO-ACANTHOCYTOSIS
118
Red blood cell homeostasis
Abstract BackgroundPanthothenate kinase-associated neurodegeneration (PKAN) belongs to a group of hereditary neurodegenerative disorders known as neuroacanthocytosis (NA). This genetically heterogeneous group of diseases is characterized by degenera-tion of neurons in the basal ganglia and by the presence of deformed red blood cells with thorny protrusions, acanthocytes, in the circulation.
ObjectiveThe goal of our study is to elucidate the molecular mechanisms underlying this aberrant red cell morphology and the corresponding functional consequences. This could shed light on the etiology of the neurodegeneration.
MethodsWe performed a qualitative and semi-quantitative morphological, immunofluo-rescent, biochemical and functional analysis of the red cells of several patients with PKAN and, for the first time, of the red cells of their family members.
ResultsWe show that the blood of patients with PKAN contains not only variable numbers of acanthocytes, but also a wide range of other misshapen red cells. Immunoflu-orescent and immunoblot analyses suggest an altered membrane organization, rather than quantitative changes in protein expression. Strikingly, these changes are not limited to the red blood cells of PKAN patients, but are also present in the red cells of heterozygous carriers without neurological problems. Further-more, changes are not only present in acanthocytes, but also in other red cells, including discocytes. The patients’ cells, however, are more fragile, as observed in a spleen-mimicking device.
ConclusionThese morphological, molecular and functional characteristics of red cells in patients with PKAN and their family members offer new tools for diagnosis and present a window into the pathophysiology of neuroacanthocytosis.
119
7. Red cell structure and function in neuroacanthocytosis
Introduction
Panthothenate kinase-associated neurodegeneration (PKAN) belongs to the family of hereditary neurodegenerative disorders known as neuroacanthocy-tosis (NA), which includes chorea-acanthocytosis (ChAc), McLeod syndrome (MLS) and Huntington’s disease-like 2 (HDL2) (135). NA is a genetically heteroge-neous group of diseases, characterized by neurodegeneration, affecting mainly the basal ganglia and leading to progressive movement disorders, with cogni-tive and psychiatric features (135, 204). PKAN has been recently included in NA as a recessive NBIA disorder (neurodegeneration with brain iron accumulation), displaying clinical manifestations similar to those of NA, but characterized by the accumulation of iron in the basal ganglia (118).
One of the biological hallmarks of NA is the presence of acanthocytes, red blood cells (RBCs) with thorny protrusions, in the blood (135, 204). The association of acanthocytosis and neurodegeneration of the basal ganglia suggests a common pathogenic pathway, which can easily be explored by studying NA red cells. Changes in the structure and function of band 3, a key integral protein of the red cell membrane, as well as abnormalities in a band 3-regulating signaling network occupy a central position in our knowledge on the RBCs from NA patients (27, 68). However, the relation between the disease-causing mutations, the abnormal red cell shape, the structural changes and their effects on the function of the acanthocytic red cells remains mainly unknown.
In comparison with ChAc and MLS, only limited data are available on the charac-teristics of the RBCs of PKAN patients (118). Only recently, a reduced response of acanthocytic PKAN RBCs to drug-induced endovesiculation has been described to suggest a perturbation of red cell membrane function in patients with PKAN (232).
Here, we describe for the first time a qualitative and semi-quantitative morpho-logical, structural and functional analysis of the RBCs from clinically diagnosed PKAN patients and their relatives. Our results show the presence of morpholog-ical, structural and functional changes in RBCs not only of patients, but also in the RBCs of some of their relatives.
120
Red blood cell homeostasis
Materials and Methods
Design of the study and ethical considerations Blood was donated by healthy volunteers, patients and their relatives after written informed consent, using venipuncture and EDTA as anticoagulant. Control donors and patients had the same ethnic background. Patients were clinically diagnosed with PKAN (118), which could be confirmed by mutational analysis for some patients (Sup. Figure 7.1). Family trees are shown in Figure 7.1A (family A and O) and Sup. Figure 7.1 for other PKAN patients and their family members (family C, N, UL, U), for which a complete set of analyses could not be obtained. RBCs were isolated from 5-10 ml blood and separated from platelets and white blood cells using Ficoll (GE Healthcare, Waukesha, WI, USA) density centrifu-gation. The study was performed following the guidelines of the local medical ethical committees and in accordance with the declaration of Helsinki. As a part of the EMINA project, funded by E-Rare (40-41905-98-9005), this study was approved by the ethics committee of the Ludwig-Maximillius-Universität, Münich.
Cell counts and classificationCells were resuspended in Ringer solution (125 mM NaCl, 5 mM KCl, 1 mM MgSO4, 2.5 mM CaCl2, 5 mM glucose, 32 mM HEPES, pH7.4), poured into Lab-Tek cham-bered cover glass (Thermo Fisher Scientific, Rochester NY, USA), and random field pictures were taken for each sample. Counting and classification were performed on at least 400 cells by two independent operators, using the clas-sifiers discocyte, echinocyte, acanthocyte and otherwise misshapen cell (Figure 7.1B). All microscopy was performed using a TCS SP5 confocal laser scanning microscope (Leica Microsystems, Mannheim, Germany) equipped with an HCX Plan-Apochromat 63X NA 1.2 water immersion lens.
Plasma microparticle analysisMicroparticle (MP) purification from plasma and analysis was performed as previ-ously described (82). MPs were stained with monoclonal anti-Glycophorin A-PE (clone KC16, Beckman Coulter, Fullerton, CA, USA) at a 1:100 dilution to specifi-cally identify RBC-derived MPs.
121
7. Red cell structure and function in neuroacanthocytosis
MP formation in vitroRBCs were suspended in Ringer to a hematocrit of 4% and incubated for 4 or 24 hours at 37°C in a humidified incubator. MPs were isolated from the supernatant by centrifugation at 21,000xg for 30 minutes (30). Counting and staining of MPs was performed as described previously (82), with staining for Band 3, using the K2N6B antiserum (30) at 1:500 dilution.
ImmunofluorescenceRBCs were fixed and stained as described previously (175). For blocking purposes, 1% BSA was used. Primary antibodies and dilutions were mouse anti-stomatin (GARP-50) at a 1:100 dilution, mouse anti-band 3 N-terminal domain (B3-136, Sigma-Aldrich, St. Louis MO, USA) at a 1:100 dilution and mouse anti-ß-spectrin (Acris, Herford, Germany) at a 1:50 dilution. The secondary antibody was goat anti-mouse Alexa 488 (Invitrogen, Carlsbad CA, USA) at a 1:1000 dilution. As internal controls, RBCs of one healthy control donor were stained with a rabbit antibody against the membrane domain of band 3 (IVF12, dilution 1:100 (133)) and these RBCs were mixed 1:1 with all patient, relative and all other healthy control samples. RBCs were imaged by confocal microscopy as described above. Image analysis was carried out using ImageJ version 1.45J. Cells were categorized by shape and total cell-associated fluorescence was calculated by adding the signals from all the planes composing the Z-stacks. From these data the mean fluo-rescence intensity (MFI) was measured per cell. In order to adjust for variance between different slides, the fluorescence of each sample was related to the same internal control.
RBC membrane preparation and immunoblot analysis RBC membranes were obtained by lysing one volume of packed RBCs in 10 volumes of ice-cold lysis buffer (5 mM Na2HPO4, pH 8.0 with protease inhibi-tors (cocktail tablet; Roche, Basel, Switzerland), 3 mM benzamidine and 1 mM Na3VO4) for 10 min on ice. The membrane fraction was washed repeatedly by centrifugation at 21,000xg for 10 min to remove free hemoglobin and solubi-lized 1:1 with Laemmli buffer (Bio-Rad Laboratories, Hercules CA, USA) supple-mented with 100 mM ß-mercaptoethanol for SDS-PAGE. SDS-PAGE was carried out according to Laemmli (148) on 10% polyacrylamide gels. Proteins were trans-ferred to PVDF membranes using the iBlot system (Invitrogen, Carlsbad CA, USA). These membranes were blocked with Odyssey Blocking Buffer (LI-COR, Lincoln NE, USA) and probed with 1:2000 mouse anti-band 3 N-terminal domain
122
Red blood cell homeostasis
(BIII-136, Sigma-Aldrich, St. Louis MO, USA), 1:5000 mouse anti-ß-spectrin (Acris, Herford, Germany), or 1:10000 anti-ß-actin (Sigma-Aldrich). As secondary antibodies 1:10000 goat anti-rabbit IgG-Alexa Fluor 680 (Invitrogen, Carlsbad CA, USA), and/or goat anti-mouse IgG-IRDye 800 (LI-COR, Lincoln NE, USA) were used. The blots were scanned with the Odyssey Infrared Imaging System (LI-COR, Lincoln NE, USA) and the images were analyzed using the Odyssey Software version 2.1.
MicrofluidicsRBC deformation within the microcapillaries was simulated with a microfluidic device with narrow, 7 µm width, channels as described previously (53). Flow of cells was observed through a UPLFLN 100X, NA 1.3 oil immersion objective (Olympus, The Netherlands) using an optical microscope (IX71, Olympus) equipped with a high-speed CMOS camera (Phantom high speed camera, Vision Research, UK). In each run, a sequence of approximately 20,000 images was recorded.
Spleen-mimicking device RBC deformability was further assessed using a bead-sorting device that mimics the mechanical deformation that RBCs experience in the spleen, as described previously (78). RBCs from the donor of interest were labeled with CFSE diac-etate (84). A 2% hematocrit suspension in Ringer with 1% BSA (6 ml), consisting of 5% labeled patient RBCs and 95% unlabeled RBCs from a healthy control donor, was passed through the bead-sorting device at a flow rate of 60 ml/h. Flow cytometry analysis of the upstream fraction, the retained fraction, and the downstream fraction was performed to determine the ratio of labeled versus unlabeled RBCs in each separate sample.
Percoll separation RBC fractionation according to cell density was performed using a discontin-uous Percoll gradient consisting of six layers ranging from 40% Percoll to 80% Percoll, as described previously (24). The RBCs were combined into four frac-tions: Fraction 1, 61% Percoll + 64.5% Percoll; Fraction 2, 67.5% Percoll; Fraction 3, 71% Percoll; and Fraction 4, 80% Percoll.
HbA1c and HbF measurements Red cell lysates were analyzed on an HA 8160 hemoglobin analyzer (Menarini Diagnostics, Italy) to determine the HbA1c and HbF concentrations.
123
7. Red cell structure and function in neuroacanthocytosis
Results
Abnormally shaped red cells are present in the blood of PKAN patients and their relatives In order to acquire a better understanding of the morphological and functional characteristics of PKAN red blood cells, we performed a detailed morpholog-ical analysis of red cells from patients with PKAN as well as from their family members without neurological symptoms.
This analysis showed that the presence of acanthocytes was always accompa-nied by that of echinocytes and other misshapen cells (Figure 7.1B; see also Sup. Figure 7.1). Although not all PKAN patients had acanthocytes, most patient’s blood samples contained a high percentage of morphologically abnormal RBCs. Furthermore, the blood of some relatives without neurological symptoms contained abnormally shaped red cells (e.g. family A in Figure 7.1B; see also family UL in Sup. Figure 7.1).
In order to obtain more insight into the molecular cause(s) underlying these aber-rant morphologies, we evaluated the distribution and organization of the integral membrane protein band 3, the cytoskeleton protein spectrin, and the raft-as-sociated stomatin with confocal microscopy. The total fluorescence intensity of the various antibody stainings was measured per cell and the cells were catego-rized by shape (Figure 7.2A). A quantitative analysis (see Materials and Methods) showed no differences in the amounts of band 3 in the RBCs of the controls, patients or relatives. However, the spectrin signal was decreased, whereas the stomatin signal was increased in the RBCs of PKAN patients and their relatives (Figure 7.2B). These changes were present in all red cells, independent of their shape. Immunoblots showed aberrant degradation of band 3 in some patients and their relatives (Figure 7.2C family O; Sup. Figure 7.2 family N, C), but normal stomatin and spectrin staining patterns (Sup. Figure 7.3). Taken together, these data suggest perturbation in membrane protein organization, rather than protein abundance, in the RBCs of PKAN patients.
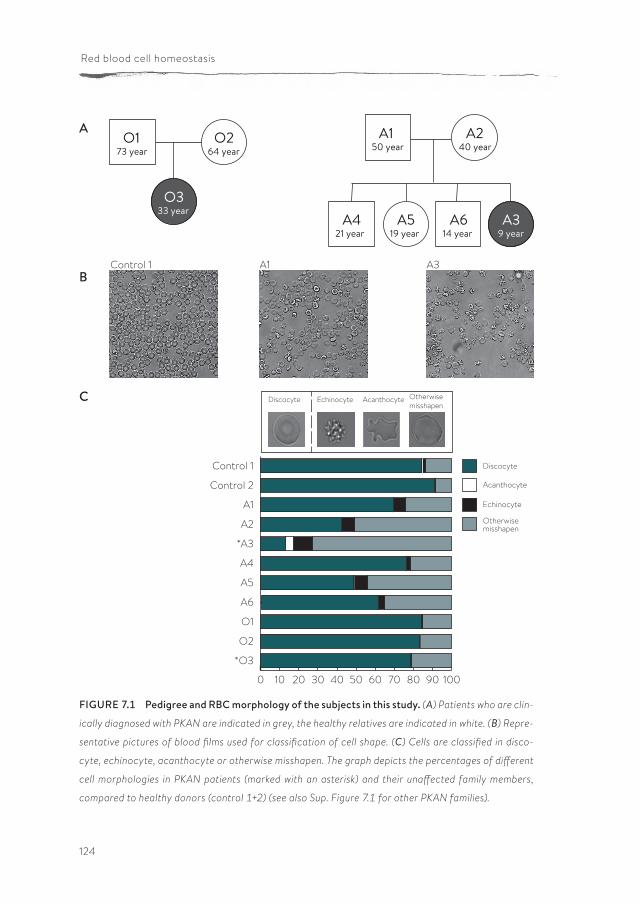
124
Red blood cell homeostasis
FIGURE 7.1 Pedigree and RBC morphology of the subjects in this study. (A) Patients who are clin-
ically diagnosed with PKAN are indicated in grey, the healthy relatives are indicated in white. (B) Repre-
sentative pictures of blood films used for classification of cell shape. (C) Cells are classified in disco-
cyte, echinocyte, acanthocyte or otherwise misshapen. The graph depicts the percentages of different
cell morphologies in PKAN patients (marked with an asterisk) and their unaffected family members,
compared to healthy donors (control 1+2) (see also Sup. Figure 7.1 for other PKAN families).
Discocyte Echinocyte Acanthocyte Otherwise misshapen
0 10 20 30 40 50 60 70 80 90 100
*O3
O2
O1
A6
A5
A4
*A3
A2
A1
Control 2
Control 1
O1 73 year
O2 64 year
O3 33 year
A3 9 year
A2 40 year
A1 50 year
A5 19 year
A4 21 year
A6 14 year
Control 1 A1 A3
Discocyte
Acanthocyte
Echinocyte
Otherwisemisshapen
A
B
C
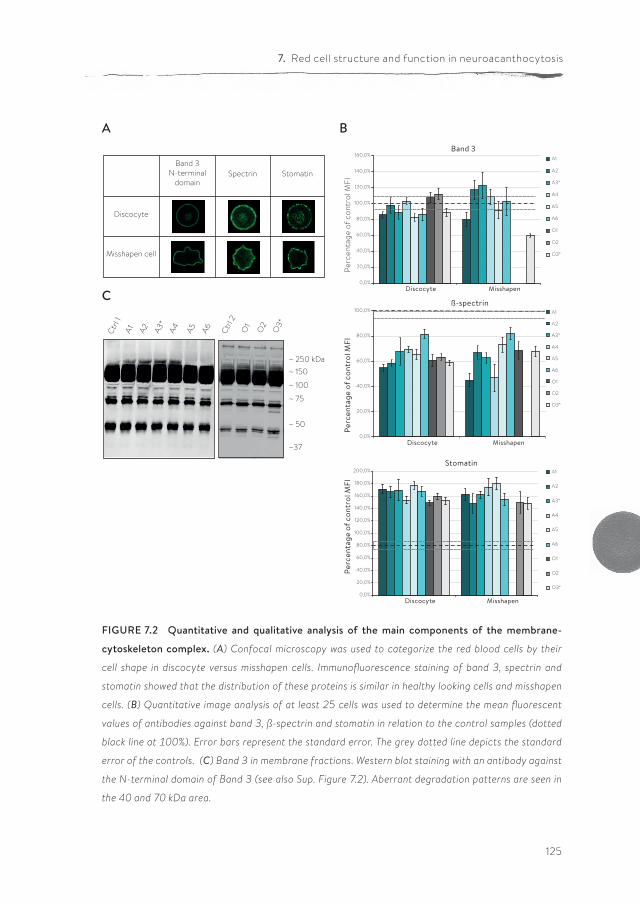
125
7. Red cell structure and function in neuroacanthocytosis
FIGURE 7.2 Quantitative and qualitative analysis of the main components of the membrane-
cytoskeleton complex. (A) Confocal microscopy was used to categorize the red blood cells by their
cell shape in discocyte versus misshapen cells. Immunofluorescence staining of band 3, spectrin and
stomatin showed that the distribution of these proteins is similar in healthy looking cells and misshapen
cells. (B) Quantitative image analysis of at least 25 cells was used to determine the mean fluorescent
values of antibodies against band 3, ß-spectrin and stomatin in relation to the control samples (dotted
black line at 100%). Error bars represent the standard error. The grey dotted line depicts the standard
error of the controls. (C) Band 3 in membrane fractions. Western blot staining with an antibody against
the N-terminal domain of Band 3 (see also Sup. Figure 7.2). Aberrant degradation patterns are seen in
the 40 and 70 kDa area.
Band 3N-terminal
domainSpectrin Stomatin
Discocyte
Misshapen cell
Ctrl
1A1 A2 A3
*A4 A5 A6 Ct
rl 2
O1
O2
O3*
~ 250 kDa~ 150
~ 100 ~ 75
~ 50
~37
0,0%
20,0%
40,0%
60,0%
80,0%
100,0%
120,0%
140,0%
160,0%
Discocyte Misshapen
A1
A2
A3*
A4
A5
A6
O1
O2
O3*
0,0%
20,0%
40,0%
60,0%
80,0%
100,0%
Discocyte Misshapen
Perc
enta
ge o
f con
trol
MFI
Pe
rcen
tage
of c
ontr
ol M
FI
ß-spectrin
Band 3
A1
A2
A3*
A4
A5
A6
O1
O2
O3*
0,0%
20,0%
40,0%
60,0%
80,0%
100,0%
120,0%
140,0%
160,0%
180,0%
200,0%Stomatin
Perc
enta
ge o
f con
trol
MFI
Discocyte Misshapen
A1
A2
A3*
A4
A5
A6
O1
O2
O3*
A B
C
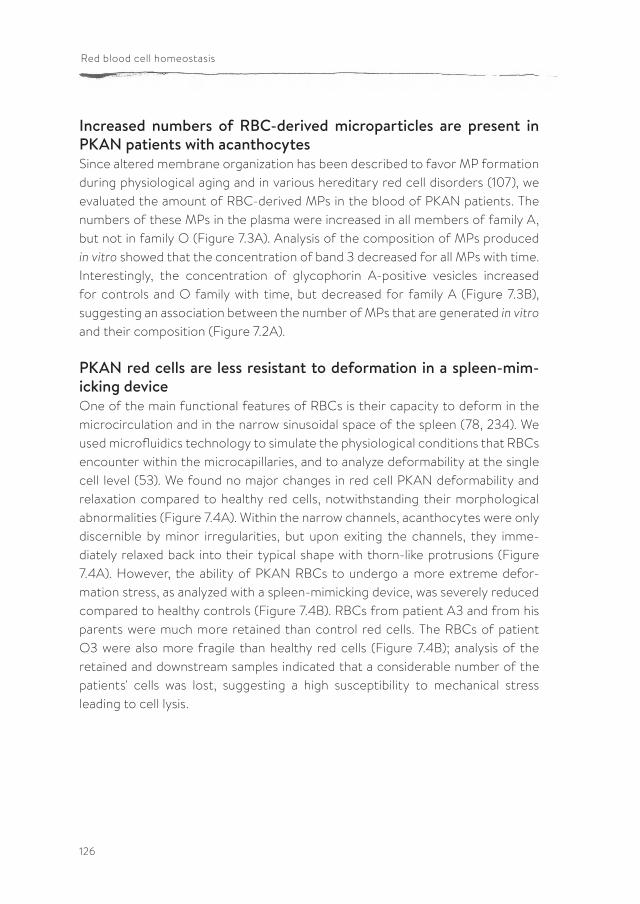
126
Red blood cell homeostasis
Increased numbers of RBC-derived microparticles are present in PKAN patients with acanthocytesSince altered membrane organization has been described to favor MP formation during physiological aging and in various hereditary red cell disorders (107), we evaluated the amount of RBC-derived MPs in the blood of PKAN patients. The numbers of these MPs in the plasma were increased in all members of family A, but not in family O (Figure 7.3A). Analysis of the composition of MPs produced in vitro showed that the concentration of band 3 decreased for all MPs with time. Interestingly, the concentration of glycophorin A-positive vesicles increased for controls and O family with time, but decreased for family A (Figure 7.3B), suggesting an association between the number of MPs that are generated in vitro and their composition (Figure 7.2A).
PKAN red cells are less resistant to deformation in a spleen-mim-icking device One of the main functional features of RBCs is their capacity to deform in the microcirculation and in the narrow sinusoidal space of the spleen (78, 234). We used microfluidics technology to simulate the physiological conditions that RBCs encounter within the microcapillaries, and to analyze deformability at the single cell level (53). We found no major changes in red cell PKAN deformability and relaxation compared to healthy red cells, notwithstanding their morphological abnormalities (Figure 7.4A). Within the narrow channels, acanthocytes were only discernible by minor irregularities, but upon exiting the channels, they imme-diately relaxed back into their typical shape with thorn-like protrusions (Figure 7.4A). However, the ability of PKAN RBCs to undergo a more extreme defor-mation stress, as analyzed with a spleen-mimicking device, was severely reduced compared to healthy controls (Figure 7.4B). RBCs from patient A3 and from his parents were much more retained than control red cells. The RBCs of patient O3 were also more fragile than healthy red cells (Figure 7.4B); analysis of the retained and downstream samples indicated that a considerable number of the patients' cells was lost, suggesting a high susceptibility to mechanical stress leading to cell lysis.
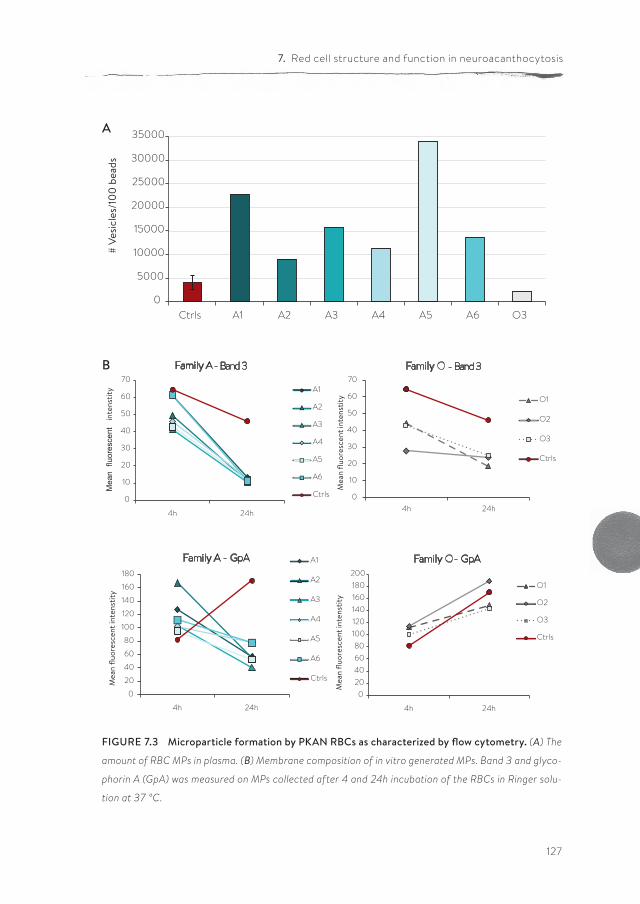
127
7. Red cell structure and function in neuroacanthocytosis
FIGURE 7.3 Microparticle formation by PKAN RBCs as characterized by flow cytometry. (A) The
amount of RBC MPs in plasma. (B) Membrane composition of in vitro generated MPs. Band 3 and glyco-
phorin A (GpA) was measured on MPs collected after 4 and 24h incubation of the RBCs in Ringer solu-
tion at 37 °C.
0
5000
10000
15000
20000
25000
30000
35000
Ctrls A1 A2 A3 A4 A5 A6 O3
# Ve
sicle
s/10
0 be
ads
0
10
20
30
40
50
60
70
4h 24h
Mea
nflu
ores
cent
in
tens
tity
- Band 3
A1
A2
A3
A4
A5
A6
Ctrls 0
10
20
30
40
50
60
70
4h 24h
Mea
n flu
ores
cent
inte
nstit
y
- Band 3
O1
O2
O3
Ctrls
0
20
40
60
80
100
120
140
160
180
4h 24h
Mea
n flu
ores
cent
inte
nstit
y
Family A - GpA A1
A2
A3
A4
A5
A6
Ctrls
020406080
100120140160180200
4h 24h
Mea
n flu
ores
cent
inte
nstit
y
O1
O2
O3
Ctrls
Family - GpA
Family Family A
A
B
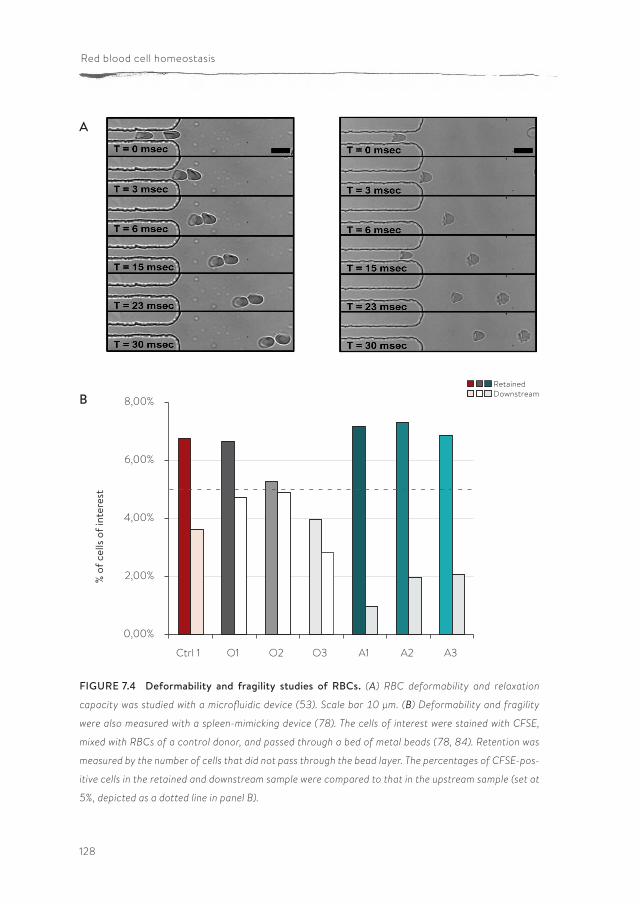
128
Red blood cell homeostasis
FIGURE 7.4 Deformability and fragility studies of RBCs. (A) RBC deformability and relaxation
capacity was studied with a microfluidic device (53). Scale bar 10 µm. (B) Deformability and fragility
were also measured with a spleen-mimicking device (78). The cells of interest were stained with CFSE,
mixed with RBCs of a control donor, and passed through a bed of metal beads (78, 84). Retention was
measured by the number of cells that did not pass through the bead layer. The percentages of CFSE-pos-
itive cells in the retained and downstream sample were compared to that in the upstream sample (set at
5%, depicted as a dotted line in panel B).
A
B
0,00%
2,00%
4,00%
6,00%
8,00%
Ctrl 1 O1 O2 O3 A1 A2 A3
% o
f cel
ls of
inte
rest
RetainedDownstream
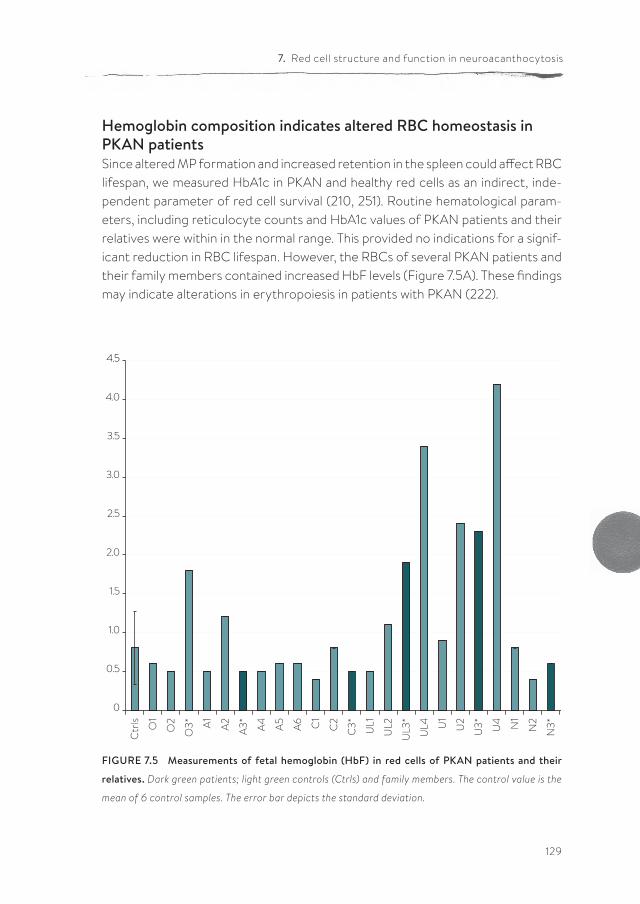
129
7. Red cell structure and function in neuroacanthocytosis
0
0.5
1.0
1.5
2.0
2.5
3.0
3.5
4.0
4.5
Ctr
ls O1
O2
O3* A1 A2 A3
*
A4 A5 A6 C1
C2
C3* UL1
UL2
UL3
*
UL4 U
1
U2
U3* U4 N1
N2
N3*
FIGURE 7.5 Measurements of fetal hemoglobin (HbF) in red cells of PKAN patients and their
relatives. Dark green patients; light green controls (Ctrls) and family members. The control value is the
mean of 6 control samples. The error bar depicts the standard deviation.
Hemoglobin composition indicates altered RBC homeostasis in PKAN patients Since altered MP formation and increased retention in the spleen could affect RBC lifespan, we measured HbA1c in PKAN and healthy red cells as an indirect, inde-pendent parameter of red cell survival (210, 251). Routine hematological param-eters, including reticulocyte counts and HbA1c values of PKAN patients and their relatives were within in the normal range. This provided no indications for a signif-icant reduction in RBC lifespan. However, the RBCs of several PKAN patients and their family members contained increased HbF levels (Figure 7.5A). These findings may indicate alterations in erythropoiesis in patients with PKAN (222).
130
Red blood cell homeostasis
Discussion
Here we report an extensive morphological and functional description of the red cells of patients with PKAN and their relatives, which presents a unique opportu-nity to investigate the pathophysiology of this rare neurodegenerative disorder.
Our data suggest that the acanthocytic shape is only one of the various possible abnormal morphologies of RBCs in patients with PKAN. The presence of increased levels of misshapen red blood cells in the blood of relatives without any neurological symptoms indicates that perturbation of membrane organization may not be limited to the homozygous state of the disease. Together with the immunofluorescence and immunoblot data, this suggests that the membrane organization of RBCs may be more sensitive to the presence of pathological NA proteins than that of neuronal cells. An extensive morphological analysis of the red cells of patients with other forms of NA and their relatives is required to test the general applicability of this conclusion. At present, we cannot exclude that the misshapen red cells represent a stage before the acanthocytes, and that the transition occurs as a consequence of aging and/or stress experienced during their life (27). However, this theory is not supported by the HbA1c levels, which were not significantly different for acanthocyte-rich fractions. Instead, our finding that HbF is increased in RBCs from patients with NA may suggest that acanthocytes are already formed during erythropoiesis. Increased HbF levels have been associated with altered erythropoiesis (199, 210). Indeed, a mild hemo-lytic anemia is described in many NA patients (206), which could induce stress erythropoiesis resulting in increased HbF (185). Thus, our data may imply that especially erythropoiesis is sensitive to pantothenate kinase-associated alter-ations in coenzyme A synthesis.
The decreased spectrin content in PKAN RBCs as detected by our immuno-fluorescence analysis may be due to a PKAN-related reduction in the spectrin content or to a reduced accessibility of epitopes for the anti-spectrin antibody. Discrepancies between immune assays and other semi-quantitative methods have been noted before in molecular studies on red blood cells and acanthocy-tosis (27, 71). The immunoblots showed no indications for degradation, but any breakdown products may have been degraded and removed from the cells (27, 192). An altered epitope accessibility may be related to changes in phosphoryla-tion-sensitive protein-protein interactions underlying abnormal cell morphology
131
7. Red cell structure and function in neuroacanthocytosis
(71, 96). The available data do not enable us to distinguish between an innate lower spectrin content in newly matured red blood cells and a loss of spectrin during their stay in the circulation. Since these alterations were not associated with the number of acanthocytes, it is likely that all red cells in PKAN patients present abnormal features, which result in abnormally shaped red cells and acan-thocytes only in a fraction of the cells.
The changes in staining for the raft marker stomatin, possibly in close associa-tion with altered microparticle generation (Salzer et al., 2002), constitute other indications for a perturbation of the membrane organization in PKAN red blood cells. Since misshapen red cells are generally associated with decreased red cell deformability (182), we analyzed the deformation of PKAN red cells in a micro-fluidic device. The deformability of discocytes and misshapen cells from PKAN patients was similar to that of red cells from healthy controls. However, the decreased deformability and/or the increased fragility of PKAN red cells in the spleen-mimicking device suggest an anomaly in the intrinsic membrane deform-ability of PKAN red cells (Figure 7.4B) This fragility could explain the slight hemo-lytic anemia in NA patients (206).
In conclusion, we report for the first time an extensive characterization of red cells from PKAN patients and family members. We showed increased numbers of misshapen red cells together with acanthocytes in PKAN subjects, but also in some of their relatives without neurological symptoms. The morphological abnormalities were associated with indications for perturbation in cytoskeleton and lipid bilayer organization, possibly underlying altered microparticle formation and reduced deformability in the spleen.
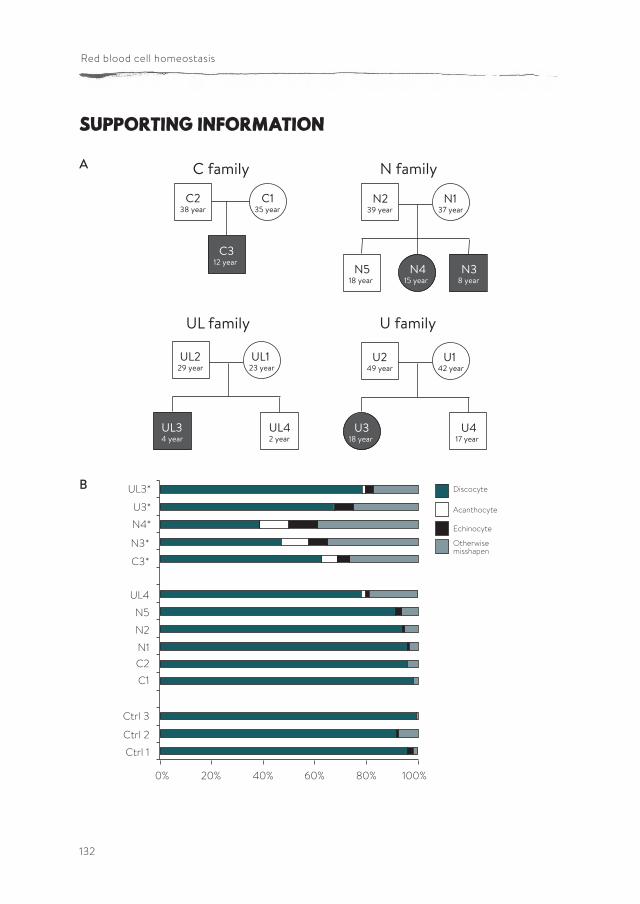
132
Red blood cell homeostasis
Supporting information
N family
N1 37 year
N2 39 year
N4 15 year
N5 18 year
N3 8 year
C family
C2 38 year
C1 35 year
C3 12 year
UL family
UL1 23 year
UL2 29 year
UL3 4 year
UL4 2 year
U family
U1 42 year
U2 49 year
U4 17 year
U3 18 year
0% 20% 40% 60% 80% 100%
Ctrl 1
Ctrl 2
Ctrl 3
C1C2N1
N2
N5
UL4
C3*
N3*
Discocyte
Acanthocyte
Echinocyte
Otherwisemisshapen
N4*
U3*
UL3*
A
B
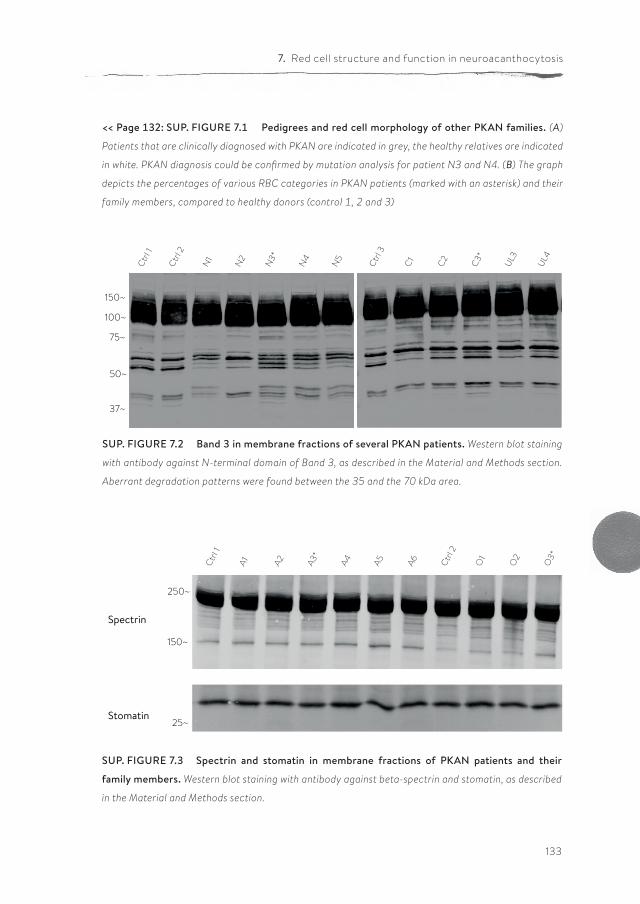
133
7. Red cell structure and function in neuroacanthocytosis
<< Page 132: SUP. FIGURE 7.1 Pedigrees and red cell morphology of other PKAN families. (A)
Patients that are clinically diagnosed with PKAN are indicated in grey, the healthy relatives are indicated
in white. PKAN diagnosis could be confirmed by mutation analysis for patient N3 and N4. (B) The graph
depicts the percentages of various RBC categories in PKAN patients (marked with an asterisk) and their
family members, compared to healthy donors (control 1, 2 and 3)
SUP. FIGURE 7.2 Band 3 in membrane fractions of several PKAN patients. Western blot staining
with antibody against N-terminal domain of Band 3, as described in the Material and Methods section.
Aberrant degradation patterns were found between the 35 and the 70 kDa area.
150~
100~
75~
50~
37~
Ctrl
1
Ctrl
2
Ctrl
3
C1 C2N1
N2
N3*
N4
N5
C3*
UL3
UL4
250~
150~
25~
Spectrin
Ctrl
1
A1 Ctrl
2
O1
O2
A2 A3*
A4 A5 A6 O3*
Spectrin
Stomatin
SUP. FIGURE 7.3 Spectrin and stomatin in membrane fractions of PKAN patients and their
family members. Western blot staining with antibody against beta-spectrin and stomatin, as described
in the Material and Methods section.

135
SUMMARY AND GENERAL DISCUSSION

136
Red blood cell homeostasis
137
8. Summary and general discussion
The RBC constitutes a prototypic example of the intricate relationship between cell structure and function. The RBC’s structure is optimal for its main function: efficient oxygen delivery and CO2 removal. It lacks organelles and a nucleus, thereby providing more space for the oxygen-carrying protein hemoglobin. Furthermore, its typical biconcave, flexible shape does not only maximize the surface/volume ratio for gas exchange, but also makes it capable of withstanding the mechanical stress it experiences during the many times it travels the circula-tory system. Often, RBCs have been oversimplified as a ‘bag of hemoglobin’, while in reality they are much more complex. Their membrane-cytoskeleton build-up enables the cell to resist fragmentation while undergoing extensive deforma-tion in the microcapillaries and the spleen. Furthermore, RBCs contain important enzymes and substrates for several metabolic pathways and antioxidant defense mechanisms. These pathways are elegantly controlled by interactions between the integral membrane protein band 3 with other membrane and cytoskeletal proteins, and with key enzymes of various metabolic pathways. These interac-tions are regulated by the binding of deoxyhemoglobin to band 3, and thereby by the physiological changes in oxygen concentration that the RBCs experience during their passage through the circulation.
Mutations in the main RBC proteins are associated with altered morphology, decreased stability, and/or increased removal, and many of these mutations lead to anemia. It is generally thought that mutations in membrane proteins that affect horizontal or lateral interactions lead to elliptocytosis and membrane fragmentation, while mutations in proteins involved in vertical interactions are thought to induce vesiculation-associated membrane loss, and the concomi-tant appearance of spherocytes (62). Even though spherocytes and elliptocytes are the most common pathological RBC shapes, there is a wide variety of other malformations (Figure 1.6). A critical review of the literature does not reveal a clear association between RBC morphology, the affected protein and functional changes. Moreover, there is only a limited number of data on the effect of a disturbance of membrane protein interactions on RBC metabolism. Thus, there is an unmet need for a molecular framework that explains the effect of alterations in a membrane protein on the interaction with its partners, and the concomi-tant effects on RBC morphology and function. Such a framework would be of great benefit for understanding the causes of anemia and the side effects of RBC transfusion products. Furthermore, this may generate new insights in the role of RBC vesiculation.
138
Red blood cell homeostasis
The main aim of the research described in this thesis was to gain a better under-standing of the structural features that determine the function and morphology of the red blood cell in health and disease.
Chapter 1 provides a general introduction to RBCs and their structure-function relationship in health, as well as in pathological and transfusion-related circum-stances.
Red cell survival after transfusion
In chapter 2, we review the available data on aging-associated and storage-asso-ciated alterations in RBC deformability. During storage, RBCs undergo various metabolic, structural and morphological changes, the so-called storage lesions. The consequences of these changes for RBC survival after transfusion are mostly unknown. Strikingly, it still has not been determined which changes acquired during storage are responsible for the disappearance of up to 30 percent of the transfused RBCs within the first hours after transfusion in the patient. Since the changes in most metabolic parameters such as 2,3-DPG, ATP, and pH are rapidly reversible, the metabolic events underlying these parameters are not likely to contribute to most adverse transfusion effects. The storage-associated morpho-logical changes suggest that alterations in membrane structure are more likely to cause a decrease in transfusion efficacy and an increase in harmful effects. The last few years have witnessed a strong increase in proteomic and biochem-ical data on RBC biology during blood bank storage. Especially the data on stor-age-related exposure of removal signals such as PS and band 3-derived senes-cent cell antigens support the theory that physiological aging-related changes in the RBC membrane are major, functionally relevant quality determinants of RBC concentrates.
The review, together with preliminary data from our own laboratory, support the theory that changes in the RBC membrane during blood bank processing and especially in the first two weeks of storage are responsible for the accompanying changes in deformability. After two to three weeks of storage, functionally rele-vant molecular changes are likely to become irreversible, since they comprise progressive proteolysis and vesicle formation. Uncovering the triggering events and the underlying signaling pathways will be instrumental in understanding and
139
8. Summary and general discussion
preventing the untimely disappearance of a considerable fraction of the trans-fused RBCs within the first hours after transfusion.
In our perspective, the most fruitful approach to elucidate the basis for reduced RBC survival after transfusion starts with investigating the effects of signal-ing-based manipulation of RBCs in vitro on physiological relevant parameters. These parameters should be informative on the activation of, and recognition and removal by the immune system, on deformability in the capillaries and in the spleen, and on the susceptibility to osmotic stress, as this may be critical during passage of transfused RBCs through the kidneys. Proteomic and metab-olomic information will be important in assessing the accompanying changes in membrane structure and homeostasis. The main challenge consists of the devel-opment of biologically relevant read-out systems, and the more consequent correlation in blood bank research between quality control in the blood bag and quality control in the patient.
Relevant read-out systems of physiological indicators of RBC survival
In chapters 3 and 4 we present the data of our research on two physiologically relevant parameters for red cell survival after transfusion, deformability and exposure of removal signals. During its passage through the circulation, the RBC encounters deformation-associated mechanical stress in the capillaries and in the spleen, and osmotic stress during its passage through the kidney. Therefore, we used a microfluidic device to test the deformation capacity in capillary-mim-icking circumstances, and we assessed the effects of osmotic stress on the expo-sure of the removal signal phosphatidylserine (PS).
Deformability, the combined result of properties of the membrane-cytoskeleton complex, the surface area-to-volume ratio, and the hemoglobin content, is a crit-ical determinant of capillary blood flow (183). During blood bank storage as well as in many pathophysiological conditions, RBC morphology changes, and these changes have been suggested to be associated with decreased deformability and removal (20, 94, 98, 235). While various techniques provide information on the rheological properties of stored RBCs, their clinical significance is controversial. We developed a microfluidic approach for evaluating RBC deformability in a phys-
140
Red blood cell homeostasis
iologically meaningful and clinically significant manner. Unlike other techniques, our method enables a high-throughput determination of changes in deformation capacity to provide statistically significant data, while providing morphological information at the single-cell level. In addition, the visual aspect of this method makes it possible to study subpopulations within one sample, making it an attrac-tive method to study red cell pathologies. By parallelization of several microchan-nels, sufficient throughput can be generated for off-line analysis, for example with flow cytometry. In chapter 3, we use this technique to demonstrate that high temporal resolution imaging of RBCs at the exit zone of narrow channels provides comprehensive information on their capacity to deform and subsequently relax to a discoid shape. A simultaneous detection of a deformed and relaxing RBC can be performed, thereby correlating deformation behavior to the morphology of mechanically unstressed RBCs. Our data show that, under conditions that closely mimic capillary dimensions and flow, the capacity to deform and the capacity to relax are not affected during storage in the blood bank. Our data also show that altered cell morphology by itself does not necessarily affect deformability.
During storage in blood bags, RBCs undergo a series of structural changes that include the exposure of phosphatidylserine (PS), a potent removal signal in vivo. In chapter 4, we postulate that, during blood bank storage, the suscep-tibility to stress-induced PS exposure increases, thereby rendering a consider-able fraction of the RBCs susceptible to rapid removal after transfusion. There-fore, we exposed RBCs of different storage times to various near-physiological stress conditions, such as hyperosmotic shock and energy depletion. The effect of these treatments on PS exposure was measured by flow cytometric anal-ysis of annexin V binding. We show that during storage under blood bank condi-tions, RBCs become increasingly susceptible to loss of phospholipid asymmetry. These effects are most prominent when induced by hyperosmotic shock, such as RBCs experience in vivo in the kidneys. Particularly the RBCs of higher densities become increasingly susceptible with storage time. These cells have a smaller volume and an increased HbA1c content, as is typical of aged RBCs. We conclude that during blood processing and storage in the blood bank, some RBCs become damaged and thereby acquire an increased susceptibility to stress-induced PS exposure. This increased susceptibility may be responsible for the rapid disap-pearance of a considerable fraction of the RBCs during the first 24 hours after transfusion. The RBCs that are rapidly cleared from the circulation after trans-fusion are the most likely cause of unwanted transfusion reactions, especially
141
8. Summary and general discussion
in patients who depend on frequent transfusions. Elucidation of the molecular cause of this increased susceptibility to PS exposure and removal may lead to the development of methods to prevent their generation, or to remove them from the blood bag before transfusion.
During its time in the circulation, as well as during storage in the blood bank, RBCs lose membrane surface due to continuous vesiculation (38, 252). In general, vesi-cles are associated with various physiological processes involving intercellular communication, hemostasis, and immunity (99, 127). In the last few years, the interest in the ins and outs of RBC vesiculation has increased, since vesiculation plays a role in all stages of the RBC’s life, constitutes one of the RBC storage lesions, and is involved in RBC pathologies. Therefore, the formation of vesicles, their quantity and their composition constitute a relevant biomarker for RBC homeostasis, both in vivo and in vitro. In chapter 5, we give an overview of the available data on the vesicle composition of RBCs and the hypotheses that have been proposed for the vesicle generation process. We combine these data into a new model and postulate some experimental approaches to confirm and/or enhance this theory. In our model, a disturbance of the band 3-ankyrin anchoring complexes leads to increased compression and rigidity of the spectrin cytoskel-eton, leading to buckling of the phospholipid bilayer, which then results in vesicle formation. The predictions of this model on size and protein composition of vesi-cles are confirmed by the available data, especially data of vesicles that are gener-ated during aging in vivo and in blood bank storage conditions. Manipulation of the lipid composition of the RBC membrane may be instrumental in improving RBC quality, for example, in blood bank conditions. Also, manipulation of protein modification, including but possibly not restricted to prevention of oxidation and/or proteolysis, may result in a more robust RBC. A more detailed, molec-ular elucidation of the vesicle composition is necessary to falsify our hypotheses.
Regulation of red blood cell homeostasis through structural changes
During their passage through the circulation, human red blood cells encounter severe conditions. Yet, they survive for 120 days, and also adapt to their surround-ings by subtle regulation of membrane organization and metabolism. RBC homeo-stasis depends heavily on interactions between the integral membrane protein
142
Red blood cell homeostasis
band 3 with other membrane and cytoskeletal proteins, and with key enzymes of various metabolic pathways. These interactions are regulated by the binding of deoxyhemoglobin to band 3, and by a signaling network revolving around Lyn and Syk kinase-mediated phosphorylation of band 3.
Triggered by the data discussed in chapter 2, we investigated the effects of signal-ing-based manipulation of RBCs in vitro on physiologically relevant parameters in chapter 6. After an initial screening of a number of compounds, we determined the effects of the band 3-affecting reagents DIDS, NEM, PP2 and orthovana-date on a number of morphological and functional RBC characteristics, protein localization at the plasma membrane, and generation and composition of vesi-cles. We show that band 3-centered manipulation of the interaction between the lipid bilayer and the cytoskeleton has various effects on: 1) morphology as shown by high resolution microscopy and quantitative image analysis; 2) orga-nization of membrane proteins as indicated by immunofluorescence confocal microscopy and quantitative as well as qualitative analysis of vesicle genera-tion; (3) membrane lipid organization as indicated by flow cytometric analysis of phosphatidylserine exposure; 4) deformability as assessed in capillary-mimicking circumstances using a microfluidics system; 5) deformability as determined using a spleen-mimicking bead-sorting device; 6) metabolic activity as indicated by metabolomic analysis.
Changes in organization of the membrane-cytoskeleton proteins are not neces-sarily accompanied by changes in cell morphology, and vice versa, indicating the absence of a consistent correlation between cell morphology and membrane organization. Furthermore, in our experience, changes in morphology, deforma-bility, and PS exposure are not always correlated, as has been commonly surmised, based on pathological conditions such as HE and HS.
Conclusions on the effect of a change in membrane organization on deforma-bility are likely to depend on the degree and type of mechanical stress employed during analysis. Because different techniques yield different data on RBC deformability, we propose a critical appraisal on the biological relevance on the commonly used methods to measure deformability. Since the bead-sorting device and the microfluidic device measure deformability under physiological circumstances-mimicking conditions, these seem to be more biologically rele-vant than the standard ektacytometry or micropipette aspiration methods.
143
8. Summary and general discussion
Furthermore, it remains to be established if and how the method of analysis itself contributes to the observed effects. For example, high shear stress, as expe-rienced in the spleen-mimicking device and in the ektacytometer, may induce vesiculation and thereby reduce deformability in susceptible RBCs that display a normal deformability in the less stressful conditions of the microfluidic system.
Overall our data show that there is a complex relationship between red cell morphology, membrane organization and deformability. The data demonstrate that RBCs have a relatively high resistance to disturbance of membrane organi-zation in vitro, which may reflect their capacity to withstand mechanical, oxida-tive and osmotic stress in vivo. Furthermore, they show that the main current theories in which disturbances in horizontal or vertical linkage between the lipid bilayer and the cytoskeleton are directly linked to changes in cell morphology require a re-evaluation, since they are insufficient to explain all structural and functional observations.
One of the main conclusions we draw from our metabolomics data is the signif-icant influence of donor variability on the metabolome of the red blood cell. Our data suggest large differences between individuals in the susceptibility of the main metabolic pathways of the RBC to disturbance of band 3 conforma-tion. This may be due to genetic variability in the characteristics of key enzymes in the various metabolomic pathways and/or membrane transporters, or to the variability in the natural history of the red blood cells. These interindividual differ-ences could well influence other RBC homeostatic processes, such as suscepti-bility to oxidative damage.
Neuroacanthocytosis
Neuroacanthocytosis (NA) is a family of rare hereditary neurodegenerative disorders, which includes chorea-acanthocytosis (ChAc), McLeod syndrome (MLS), Huntington’ s disease-like 2 (HDL2) and panthothenate kinase-associ-ated neurodegeneration (PKAN). Patients affected by these progressive, fatal disorders suffer from devastating movement disorders as well as a variety of other symptoms, caused by neurodegeneration of the basal ganglia. One of the biological hallmarks of NA is the presence of acanthocytes in the blood, RBCs with thorny protrusions. The association of acanthocytosis and neurodegenera-
144
Red blood cell homeostasis
tion of the basal ganglia suggests a common pathogenic pathway. Therefore, a key to the understanding of underlying mechanisms of these disorders may be found in the RBCs of NA patients.
Changes in the structure and function of band 3, as well as abnormalities in a band 3-regulating signaling network occupy a central position in our knowledge on the RBCs from NA patients. However, the relation between the disease-causing mutations, the abnormal RBC shape, the structural changes and their effects on the function of the acanthocytic red cells remains mainly unknown.
In chapter 7 we measure the earlier described physiologically relevant parame-ters (deformability, vesiculation and PS exposure) in RBCs from PKAN patients. In a large collaborative study to elucidate the molecular mechanisms underlying the aberrant red cell morphology and the corresponding functional consequences, we analyzed the RBCs of several PKAN families. PKAN has been recently included in NA as a recessive NBIA disorder (neurodegeneration with brain iron accumula-tion), displaying clinical manifestations similar to those of NA, but characterized by the accumulation of iron in the basal ganglia. In comparison with ChAc and MLS, only limited data are available on the characteristics of the RBCs of PKAN patients.
We performed a qualitative and semi-quantitative morphological, immunoflu-orescent, biochemical and functional analysis of the RBCs of several patients with PKAN and, for the first time, also of the RBCs of their family members. We show that the blood of patients with PKAN contains not only variable numbers of acanthocytes, but also a wide range of other misshapen RBCs. Immunofluores-cent and immunoblot analyses suggest an altered membrane organization, rather than quantitative changes in protein expression. Strikingly, these changes are not limited to the red blood cells of PKAN patients, but are also present in the RBCs of heterozygous carriers without neurological problems. Moreover, changes are not only present in acanthocytes, but also in other RBCs, including discocytes. The morphological abnormalities were associated with perturbations in cyto-skeleton and lipid bilayer organization, possibly underlying altered microparticle formation and reduced deformability in the spleen. Furthermore, we found that fetal hemoglobin (HbF) is increased in RBCs from patients. Since increased HbF levels have been associated with altered erythropoiesis, this suggests that acan-thocytes are already formed during erythropoiesis.
145
8. Summary and general discussion
These morphological, molecular and functional characteristics of red cells in patients with PKAN and their family members offer new tools for diagnosis and present a window on the pathophysiology of neuroacanthocytosis.
Future directions
As ‘simple’ as the red cell is, it still requires considerable scrutiny before its most fundamental characteristics are fully understood. Various mechanisms have been postulated for the generation of abnormally shaped RBCs. These theo-ries center around a weakening of the linkage between the cytoskeleton and the lipid bilayer. Current theories on disturbance of the horizontal or vertical linkages seem to be insufficient to explain all structural and functional observations. Our data in chapter 5 show that the structure-morphology linkage is more complex. Moreover, the homeostasis of red cells is a refined process, with more regula-tory systems than may be expected at first sight. Phosphorylation seems to be of great importance in an active signal transduction network in the RBC membrane, regulating membrane organization, and thereby RBC homeostasis (70, 95, 197, 208). Therefore, it may be worthwhile to invest in phosphoproteomic analyses in order to establish a better picture of these signaling pathways. On top of that, metabolomic analysis may turn out to be instrumental in the identification of players in the signaling routes that regulate the RBC’s homeostasis, and of the interaction between the RBC and its organism-wide environment, both in healthy and in pathological circumstances. Especially metabolomics analysis of patient RBCs and plasma in comparison with healthy controls could lead to new insights.
Chemical reagents that interact with membrane proteins or that inhibit kinases or phosphatases have a low specificity. Finding a more specific method to manip-ulate the interaction of membrane proteins could help in a better understanding of fundamental RBC processes. For this goal two strategies could be used. First, protein-protein interactions could be disturbed by means of specific peptides. For this, recently developed methods to introduce peptides and proteins into RBCs could be used (93), instead of the more artificial ghost resealing tech-niques used so far (8, 19). Second, genetically encoded tools may be used to study dynamic signaling processes in living cells. Innovative techniques, such as inducible protein dimerization tools, can be applied to activate specific signaling proteins in cells on demand with a chemical or light-induced stimulus (79, 198,
146
Red blood cell homeostasis
200). Since RBCs do not have a genetic machinery which can be exploited for such a strategy, this approach should be applied to red cell progenitor cells or to iPS cells, which then can be differentiated in vitro.
The latter strategy may also be of interest in the research on the pathophysi-ology of NA. There are several indications that, in NA patients, critical processes may be altered during erythropoiesis, resulting in the appearance of acantho-cytes and other misshapen RBCs in the circulation. Therefore, studying the different steps of erythroblast maturations instead of RBCs may be a worthwhile strategy. Furthermore, since patient material is very rare, it might be worthwhile to invest in the generation of induced pluripotent stem (iPS) cells, in order to have an unlimited source of research material. Human patient-specific iPS cells are believed to be an ideal cell model of neurodegenerative diseases. Since iPS cells behave similar to embryonic stem cells, these cells do not only provide a nearly unlimited cell source for pathophysiological studies, but also allow direct studies of all major cell types affected in NA, such as brain cells (astrocytes and neurons) and peripheral cells (RBCs, myocytes). Moreover, the generated cell model would eventually also be suitable for high-throughput drug screening for innovative NA treatment approaches.
Furthermore, in order to understand the molecular mechanisms underlying RBC-mediated pathology, we need to employ more physiologically relevant tools. The spleen-mimicking and capillary-mimicking devices are good first steps, revealing for example functional changes even if the morphology is unaffected. Nevertheless, they can be improved. With our current microfluidic system, RBCs pass only once through a capillary constriction. This single passage may be insufficient to reveal how differences in membrane protein composition and protein-protein interaction affect the function of RBCs in the constantly recur-ring shear stress in vivo. Moreover, we do not know if and how deformability of RBCs is influenced by differences in oxygen pressure such as the cells encounter in the circulation. In order to address these issues, the microfluidics system could be expanded with an oxygen level control unit and a loop. To make the system resembling the situation in vivo even more, the walls of the device could be coated with vascular endothelial cells. Abnormal interactions between RBCs and endothelial cells are crucial in causing vascular pathology in several diseases (230). So, by refining the microfluidic set-up, a full range of conditions that a RBC encounters in the circulation, could be simulated.
147
8. Summary and general discussion
Finally, the spleen plays a vital role in RBC ageing, vesiculation and clearance (35, 176, 252). The red pulp macrophages are phagocytically very active and seem to play a role in the removal of old and damaged RBCs (49, 176). Therefore, adding red pulp macrophages to the bead compartment of the spleen-mimicking device, would make the device a better resemblance to the situation in vivo. That way, not only mechanical retention can be observed, but the role of cell-cell interaction and phagocytosis can be studied as well.
Conclusion
In this thesis, we introduce several physiologically relevant read-out systems and new techniques to study RBC characteristics, which can be helpful in assessing the survival of transfused or pathologically disturbed RBCs. Furthermore, we provide some new insights into the effects of changes in plasma membrane organization on red cell morphology and function. Although we are just discov-ering the complexity of the red blood cell, these and other new techniques and approaches will help to understand the fundamental structural characteristics that shape red blood cell function.


149
Nederlandse samenvatting

150
Red blood cell homeostasis
151
9. Nederlandse samenvatting
De rode bloedcel (RBC) is een duidelijk voorbeeld van een cel waarbij structuur en functie perfect op elkaar afgestemd zijn. Haar belangrijkste functie is het effi-ciënt leveren van zuurstof aan de organen en het verwijderen van CO2. De rode bloedcel heeft geen organellen of een celkern, waardoor er meer ruimte is voor hemoglobine, het molecuul dat zuurstof bindt en vervoert. Bovendien zorgt de typische biconcave, flexibele vorm niet alleen voor een optimale oppervlakte/volume ratio voor gaswisseling, maar maakt die ook dat de cel bestand is tegen de mechanische krachten in de bloedsomloop.
Rode bloedcellen worden vaak ten onrechte voorgesteld als een ‘zak met hemoglobine’. In werkelijkheid zijn ze echter zeer complex georganiseerd. Het membraan-cytoskelet zorgt ervoor dat de cel niet fragmenteert wanneer ze wordt vervormd in de microcapillairen en milt. Verder bevatten rode bloedcellen belangrijke enzymen en substraten voor meerdere metabole routes en bescher-mingsmechanismen tegen oxidatieve schade. Deze processen worden elegant gestuurd door interacties van het integrale membraaneiwit band 3 met andere membraan- en cytoskeleteiwitten (zie figuur 1.1) en met sleutelenzymen van de verschillende metabole routes. Deze interacties worden op hun beurt geregu-leerd door de binding van deoxyhemoglobine aan band 3 en dus door de fysi-ologische veranderingen in zuurstofconcentratie die de rode bloedcel ervaart tijdens de circulatie door het lichaam.
Veranderingen in de belangrijkste rode bloedceleiwitten zijn geassocieerd met veranderde morfologie, verminderde stabiliteit en/of verhoogde verwijdering van cellen uit de circulatie en leiden dan ook vaak tot anemie. Er is een breed scala aan malformaties van de rode bloedcel (figuur 1.6), waarbij sferocyten en elliptocyten het meest voorkomen. Er is nog geen duidelijk verband aange-toond tussen de RBC morfologie, de aangedane eiwitten en functionele veran-deringen. Bovendien is op dit moment maar weinig kennis over het effect van verstoringen van membraaneiwit-interacties op het metabolisme van de rode bloedcel. Er is dus een behoefte aan een moleculair raamwerk dat het effect van veranderingen in een membraaneiwit op de interactie met zijn partners, en de bijkomende effecten op RBC morfologie en functie verklaart. Zo'n raamwerk zou van groot nut zijn voor het begrijpen van de oorzaak van anemie en de effecten van bloedtransfusie.
152
Red blood cell homeostasis
Het belangrijkste doel van het in dit proefschrift beschreven onderzoek was een beter begrip te krijgen van de structurele kenmerken die de functie en morfol-ogie van de rode bloedcel in gezondheid en ziekte bepalen. Hoofdstuk 1 geeft een algemene inleiding over de rode bloedcel en hoe structuur en functie aan elkaar gerelateerd zijn.
Overleving van de rode bloedcelna transfusie
In hoofdstuk 2 worden de in de literatuur beschreven veranderingen in vervorm-baarheid van de RBC als gevolg van veroudering en opslag in de bloed-bank besproken. Tijdens opslag in de bloedbank ondergaan rode bloedcellen verscheidene metabole, structurele en morfologische veranderingen. Opval-lend genoeg is het niet bekend welke van deze veranderingen verantwoordelijk zijn voor het verdwijnen van een aanzienlijk percentage van de getransfundeerde cellen in de patiënt binnen de eerste uren na transfusie. Aangezien veranderingen in de meeste metabole parameters zoals 2,3-DPG, ATP en pH reversibel zijn, zijn veranderingen daarin waarschijnlijk niet verantwoordelijk voor de snelle verwi-jdering van deze cellen. De morfologische veranderingen tijdens de opslag die gepaard gaan met veranderingen in de membraanstructuur zouden wél kunnen leiden tot een afname in transfusie effectiviteit en een toename van de schade-lijke bijeffecten.
De afgelopen jaren is er een sterke toename geweest van data over de staat van de rode bloedcel tijdens opslag in de bloedbank. Onderzoek naar het ontstaan van verwijderingssignalen zoals fosfatidylserine en band 3-afgeleide verouder-ingsantigenen bevestigt de theorie dat veranderingen die gerelateerd zijn aan fysiologische veroudering in de RBC membraan relevante determinanten zijn voor de kwaliteit van transfusie-RBC’s.
Ons literatuuronderzoek ondersteunt de theorie dat veranderingen in de RBC membraan tijdens bewaren in de bloedbank, met name in de eerste twee weken van opslag, verantwoordelijk zijn voor veranderingen in vervormbaarheid. Na twee tot drie weken worden de relevante moleculaire veranderingen waarschijn-lijk irreversibel, omdat ze een gevolg zijn van progressieve proteolyse en vorming van vesikels. Het aan het licht brengen van de omstandigheden die dit activeren,
153
9. Nederlandse samenvatting
alsook de onderliggende signaalroutes, zal het begrip én op termijn het voor-komen bevorderen van het vroegtijdig verdwijnen van een aanzienlijk deel van de getransfundeerde rode bloedcellen.
Om de verminderde RBC overleving na transfusie op te helderen is het zinvol de effecten van manipulatie van signaleringsprocessen in de cel in vitro op fysi-ologisch relevante parameters te onderzoeken. Deze parameters moeten infor-matief zijn over de activatie van, en herkenning en verwijdering door het immu-unsysteem, over de vervormbaarheid van de cellen in de capillairen en de milt, en over de gevoeligheid voor osmotische stress. Informatie uit de proteomica en metabolomica zal belangrijke bijdragen leveren aan het vaststellen van de bijbe-horende veranderingen in de membraanstructuur en homeostase van de cel.
Relevante indicatoren voor RBC overleving
In hoofdstuk 3 en 4 presenteren we de gegevens van ons onderzoek naar twee fysiologisch relevante parameters voor de rode bloedcel overleving na transfusie: vervormbaarheid en het verschijnen van verwijderingssignalen. Tijdens de bloed-somloop, ervaart de RBC extreme mechanische stress als gevolg van vervorming in de capillairen en in de milt, alsook osmotische stress tijdens de passage door de nieren. Daarom hebben we een opstelling gemaakt met op capillairen lijkende microkanalen, waarmee we in vitro de vervormingscapaciteit van cellen konden testen. Daarnaast onderzochten we de effecten van osmotische stress op het verwijderingssignaal fosfatidylserine.
VervormbaarheidGoede vervormbaarheid is belangrijk voor een succesvolle passage door de capillairen en de milt. Deze wordt bepaald door drie factoren: de eigenschappen van het membraan-cytoskelet complex, de oppervlakte/volume-verhouding van de cel en het hemoglobinegehalte. Tijdens het bewaren van rode bloedcellen in de bloedbank en bij veel rode-bloedcelaandoeningen verandert de morfologie van de cel. In de literatuur wordt verondersteld dat deze veranderingen gepaard gaan met een verminderde vervormbaarheid en verhoogde verwijdering uit de circulatie. Terwijl verschillende technieken informatie geven over de reolo-gische eigenschappen van de RBC, is de klinische betekenis van deze informatie twijfelachtig. Daarom ontwikkelden wij een opstelling met microkanalen om
154
Red blood cell homeostasis
RBC vervormbaarheid te bestuderen onder voor de kliniek relevante omstan-digheden. In tegenstelling tot andere technieken levert onze methode statistisch relevante gegevens op basis van analyse van grote hoeveelheden cellen, waarbij ook analyse van individuele cellen mogelijk is. Door het visuele aspect van deze methode is het mogelijk om subpopulaties te analyseren. Hierdoor is het ook een aantrekkelijke methode om ziektebeelden van de rode bloedcel te bestud-eren. In hoofdstuk 3 passen we deze techniek toe op rode bloedcellen uit trans-fusie-eenheden. Daarvoor hebben we monsters genomen van verschillende bewaartijden en geanalyseerd in een proefopstelling die de capillaire afmetingen en stroming in het lichaam nabootst. Onze resultaten laten zien dat het vermogen van de cellen om te vervormen én het vermogen om daarna weer te ontspannen niet aangetast worden tijdens de opslag in de bloedbank. Onze gegevens tonen ook aan dat een verandering in celmorfologie op zich niet gerelateerd is met de vervormbaarheid.
Omdat verschillende technieken voor het meten van vervormbaarheid verschil-lende uitkomsten opleveren, zou er kritisch moeten worden gekeken naar de biologische relevantie van de tot nu toe gangbare methodes om vervormbaar-heid te meten. Aangezien de opstelling met microkanalen, evenals een milt-na-bootsende techniek, de vervormbaarheid onder fysiologische omstandigheden simuleren, lijken deze meer relevant dan de standaard ektacytometrie- of de micropipet-methoden.
Fosfatidylserine Tijdens de opslag in bloedzakken ondergaan rode bloedcellen veranderingen. Een hiervan is het verlies van de asymmetrische verdeling van fosfolipiden in de membraan en het verschijnen van fosfatidylserine aan de buitenkant van het celmembraan. Fosfatidylserine is een krachtig verwijderingssignaal in vivo. In hoofdstuk 4 veronderstellen we dat tijdens de opslag in de bloedbank de gevoe-ligheid voor het stress-geïnduceerde verschijnen van fosfatidylserine toeneemt, wat ertoe leidt dat een aanzienlijk deel van de rode bloedcellen gevoelig wordt voor snelle verwijdering. Om dit te testen hebben we rode bloedcellen van verschillende bewaartijden blootgesteld aan enkele stressomstandigheden die de fysiologie nabootsen, zoals een hyperosmotische shock en glucosetekort. Het effect van deze behandelingen op de verschijning van fosfatidylserine werd gemeten door flowcytometrische analyse van annexine V binding. We tonen aan dat tijdens bewaren onder bloedbankomstandigheden rode bloedcellen in toen-
155
9. Nederlandse samenvatting
emende mate vatbaar worden voor verlies van fosfolipidenasymmetrie. Deze effecten zijn het meest uitgesproken na een hyperosmotische shock, zoals de rode bloedcellen ook ervaren in de nieren. Met name oudere rode bloedcellen worden gevoeliger met de bewaartijd. We concluderen dat tijdens de verwerking van bloed en de opslag van rode bloedcellen in de bloedbank, sommige rode bloedcellen beschadigd raken en daardoor een verhoogde gevoeligheid verw-erven voor het laten verschijnen van fosfatidylserine aan de buitenkant. Deze verhoogde gevoeligheid kan de reden zijn voor het snelle verdwijnen van een aanzienlijk deel van de rode bloedcellen gedurende de eerste uren na trans-fusie. Rode bloedcellen die snel na transfusie worden verwijderd uit de circulatie zijn de meest waarschijnlijke oorzaak van ongewenste transfusiereacties. Dit is voornamelijk een probleem bij patiënten die transfusie-afhankelijk zijn. Ophel-dering van de moleculaire oorzaak van deze verhoogde gevoeligheid kan leiden tot de ontwikkeling van methoden om dit te voorkómen, of om de cellen met een verhoogde gevoeligheid uit de bloedzak te verwijderen vóór transfusie.
Vorming van vesikels Zowel in de bloedsomloop als tijdens de opslag in de bloedbank verliezen rode bloedcellen membraanoppervlak door de vorming van vesikels. In het algemeen worden vesikels geassocieerd met verschillende fysiologische processen waar-onder intercellulaire communicatie, hemostase en reacties van het immuunsys-teem. In de afgelopen jaren is de interesse in vorming van vesikels door de RBC toegenomen, omdat dit proces een rol speelt in alle stadia van het leven van de RBC. Bovendien speelt vesikelvorming een negatieve rol bij bloedtransfusies en bij RBC pathologieën. Daarom is de vorming van vesikels, zowel wat betreft de hoeveelheid als de samenstelling, een relevante biomarker voor RBC homeo-stase in vivo en in vitro. In hoofdstuk 5 geven we een overzicht van de beschik-bare gegevens over de samenstelling van RBC vesikels en de hypotheses voor de manier waarop ze gevormd worden. Aan de hand hiervan stellen we een nieuw model voor, alsook enkele experimentele benaderingen waarmee dit kan worden getoetst. In ons model leidt een verstoring van de band 3-ankyrine complexen tot meer compressie en stijfheid van het spectrinecytoskelet, hetgeen leidt tot het kromtrekken van de fosfolipide bilaag. Dit resulteert in vesikelvorming (Figuur 5.3). Van dit model afgeleide aannames over de grootte en eiwitsamenstelling van vesikels worden bevestigd door de in de literatuur beschikbare gegevens.
156
Red blood cell homeostasis
Regulering van de homeostase van de RBCdoor middel van veranderingen in de structuur
Ondanks de zware omstandigheden die rode bloedcellen ervaren tijdens hun tocht door het lichaam, bedraagt hun levensduur toch 120 dagen. Ze passen zich aan hun omgeving aan door subtiele regulatie van membraan-organisatie en metabolisme. Naar aanleiding van de bevindingen in hoofdstuk 2 onderzoeken we in hoofdstuk 6 de effecten van manipulaties van signaleringsroutes op fysi-ologisch relevante parameters in vitro. Na een eerste screening van een aantal chemische stoffen, bepaalden we het effect van reagentia die de structuur van het membraaneiwit band 3 beïnvloeden. Onze resultaten tonen aan dat manipu-latie van de interactie tussen de lipide bilaag en het cytoskelet via band 3 effecten heeft op: 1) celmorfologie; 2) organisatie van membraaneiwitten; (3) organisatie van membraanlipiden; 4) vervormbaarheid; 5) metabolisme. Ook concluderen we dat veranderingen in de organisatie van de eiwitten in het cytoskelet-membraan complex niet noodzakelijkerwijs gepaard gaan met veranderingen in celmorfol-ogie en vice versa. Er is dus geen consistent, eenduidig verband tussen celmor-fologie en membraanorganisatie. Bovendien blijken veranderingen in morfologie, vervormbaarheid en fosfatidylserine-expressie niet altijd gecorreleerd te zijn. Dit weerspreekt het heersende beeld, dat vooral berust op waarnemingen bij pathol-ogische rode bloedcelaandoeningen zoals elliptocytose en sferocytose.
Uit onze studie blijkt ook dat er een complexe relatie bestaat tussen morfol-ogie, membraan-organisatie en vervormbaarheid. RBCs hebben een grote weer-stand tegen verstoring van membraanorganisatie in vitro. Dit kan hun vermogen weerspiegelen om mechanische, oxidatieve en osmotische stress te weerstaan in vivo. Bovendien zien we dat de belangrijkste huidige theorieën, die stellen dat verstoringen in horizontale of verticale verbindingen tussen de lipide bilaag en het cytoskelet rechtstreeks verband houden met specifieke veranderingen in de celmorfologie, een herevaluatie vereisen, omdat ze niet alle structurele en func-tionele observaties kunnen verklaren.
Een van de belangrijkste conclusies die we trekken uit onze metabole data is de aanmerkelijke invloed van donor variabiliteit op het metaboloom van de rode bloedcel. Onze gegevens suggereren dat grote interindividuele verschillen bestaan in de gevoeligheid van de belangrijkste metabole routes van de RBC voor
157
9. Nederlandse samenvatting
verstoring van de band 3 conformatie. Dit kan het gevolg zijn van genetische vari-abiliteit in de eigenschappen van sleutelenzymen in de diverse metabole paden en/of membraan transport eiwitten. Deze interindividuele verschillen zouden ook andere processen om de homeostase te bewaken kunnen beïnvloeden, zoals het voorkomen van oxidatieve schade.
Neuroacanthocytose
Neuroacanthocytose (NA) is de aanduiding voor een groep zeldzame erfe-lijke neurodegeneratieve aandoeningen, waar chorea-acanthocytosis (ChAc), McLeod syndroom (MLS), ‘Huntingtons disease-like 2’ (HDL2) en pantothenaat-ki-nase geassocieerde neurodegeneratie (PKAN) onder vallen. Patiënten met deze progressieve, fatale aandoeningen lijden aan ernstige bewegingsstoornissen alsmede een verscheidenheid aan andere symptomen, veroorzaakt door neuro-degeneratie van de basale ganglia. Een van de biologische kenmerken van NA is de aanwezigheid van acanthocyten in het bloed. Dit zijn rode bloedcellen met opval-lende, doornachtige uitsteeksels. De combinatie van acanthocytose en neurode-generatie suggereert een gemeenschappelijke pathogene route. Daarom kunnen rode bloedcellen van NA patiënten een sleutelrol spelen in het begrijpen van de onderliggende moleculaire oorzaken van de ziekteverschijnselen.
Onze huidige kennis over de rode bloedcellen van NA patiënten betreft vooral veranderingen in de structuur en functie van band 3, alsmede afwijkingen in een met band 3 geassocieerd signaleringsnetwerk. Echter, over de relatie tussen de mutaties die de ziekte veroorzaken, de abnormale RBC morfologie, structurele veranderingen en hun mogelijke effecten op de functie van de acanthocyt is nog heel weinig bekend.
In hoofdstuk 7 meten we de eerder beschreven fysiologisch relevante parame-ters (vervormbaarheid, vorming van vesikels en verschijning van fosfatidylserine) in de rode bloedcellen van leden van verschillende PKAN families. In vergeli-jking met ChAc en MLS is er slechts beperkte informatie beschikbaar over de kenmerken van de rode bloedcellen van PKAN patiënten.
We hebben kwalitatieve en semi-kwantitatieve morfologische, immunofluo-rescente, biochemische en functionele analyses uitgevoerd op de rode bloed-
158
Red blood cell homeostasis
cellen van verschillende patiënten met PKAN én, voor het eerst, ook op de rode bloedcellen van hun familieleden. Onze resultaten laten zien dat het bloed van patiënten met PKAN niet alleen variabele aantallen acanthocyten bevat, maar ook een breed scala aan andere misvormde rode bloedcellen. Immunofluores-centie- en immunoblot-analyses suggereren een verandering in de membraan organisatie, maar geen kwantitatieve veranderingen in eiwitexpressie. Opvallend is dat deze veranderingen niet beperkt zijn tot de rode bloedcellen van patiënten, maar ook aanwezig zijn in de rode bloedcellen van heterozygote dragers die geen neurologische problemen hebben. Bovendien zijn de veranderingen niet alleen aanwezig in acanthocyten, maar ook in andere rode bloedcellen, waar-onder de normale discocyten. De morfologische abnormaliteiten gaan gepaard met verstoringen van de organisatie van het cytoskelet en de lipide bilaag. Dit zou de veranderde vorming van vesikels en verminderde vervormbaarheid in de milt kunnen verklaren. Bovendien vonden we dat het foetaal hemoglobine (HbF) is verhoogd bij enkele patiënten. Aangezien toegenomen HbF niveaus een gevolg zijn van veranderde erythropoiese, kan dit betekenen dat acanthocyten al tijdens de erytropoiese in het beenmerg gevormd worden.
Deze morfologische, moleculaire en functionele eigenschappen van rode bloed-cellen van patiënten met PKAN en hun familieleden bieden nieuwe aanknoping-spunten voor diagnose en inzichten in de pathofysiologie van neuroacanthocytose.
Conclusie
In dit proefschrift introduceren we een aantal fysiologisch relevante parame-ters en nieuwe technieken om de rode bloedcel te bestuderen. Deze kunnen een belangrijke rol spelen bij het inschatten van de overleving van getransfundeerde of pathologische RBCs. Bovendien presenteren we een aantal nieuwe inzichten in de effecten van veranderingen in de organisatie van de celmembraan op morfol-ogie en functie. Het lijkt erop dat we pas net beginnen te ontdekken hoe complex de rode bloedcel is. De in dit proefschrift beschreven technieken en daarmee geproduceerde resultaten kunnen helpen om de structurele kenmerken te begri-jpen die de functie van rode bloedcellen vorm geven.

159
9. Nederlandse samenvatting


161
Appendices

162
Red blood cell homeostasis
163
10. Appendices - Bibliography
Bibliography
1. Allan D, Billah M, Finean J, Michell R.
1976. Release of diacylglycerol-en-
riched vesicles from erythrocytes with
increased intracellular (ca2+). Nature.
261(5555):58–60
2. Allan D, Limbrick AR, Thomas P,
Westerman MP. 1981. Microvesicles from
sickle erythrocytes and their relation
to irreversible sickling. Br J Haematol.
47(3):383–90.
3. Allan D, Michell R. 1975. Accumulation
of 1,2-diacylglycerol in the plasma mem-
brane may lead to echinocyte trans-
formation of erythrocytes. Nature.
258(5533):348–49
4. Allison A. 1960. Turnovers of erythro-
cytes and plasma proteins in mammals.
Nature. 188:37–40
5. Almac E, Ince C. 2007. The impact of
storage on red cell function in blood
transfusion. Best Pract. Res. Clin.
Anaesthesiol. 21(2):195–208
6. Alonso MA, Millan J. 2001. The role of lip-
id rafts in signalling and membrane traf-
ficking in t lymphocytes. J Cell Sci. 114(Pt
22):3957–65
7. Alper SL. 2006. Molecular physiology
of slc4 anion exchangers. Exp. Physiol.
91(1):153–61
8. An X, Lecomte MC, Chasis JA, Mohandas
N, Gratzer W. 2002. Shear-response of
the spectrin dimer-tetramer equilibrium
in the red blood cell membrane. J. Biol.
Chem. 277(35):31796–800
9. Antonelou MH, Kriebardis AG, Stamoulis
KE, Economou-Petersen E, Margaritis
LH, Papassideri IS. 2010. Red blood
cell aging markers during storage in ci-
trate-phosphate-dextrose-saline-ad-
enine-glucose-mannitol. Transfusion.
50(2):376–89
10. Arabo EYM. 2011. Shear and extension-
al viscosities of hard wheat flour dough
using a capillary rheometer. J. Food Eng.
103(3):294–98
11. Asano K, Osawa Y, Yanagisawa
N, Takahashi Y, Oshima M. 1985.
Erythrocyte membrane abnormalities in
patients with amyotrophic chorea with
acanthocytosis. part 2. abnormal degra-
dation of membrane proteins. J. Neurol.
Sci. 68(2-3):161–73
12. Atkinson JP, Frank MM. 1974. Studies on
the in vivo effects of antibody. interac-
tion of igm antibody and complement in
the immune clearance and destruction
of erythrocytes in man. J. Clin. Invest.
54(2):339–48
13. Ballas SK, Bator SM, Aubuchon JP, Marsh
WL, Sharp DE, Toy EM. 1990. Abnormal
membrane physical properties of red
cells in mcleod syndrome. Transfusion.
30(8):722–27
14. Barshtein G, Manny N, Yedgar S. 2011.
Circulatory risk in the transfusion of red
blood cells with impaired flow properties
induced by storage. Transfus. Med. Rev.
25(1):24–35
15. Bennett V. 1985. The membrane skel-
eton of human erythrocytes and its
164
Red blood cell homeostasis
implications for more complex cells. Ann
Rev Biochem. 54:273–304
16. Bennett-Guerrero E, Veldman TH,
Doctor A, Telen MJ, Ortel TL, et al.
2007. Evolution of adverse changes in
stored rbcs. Proc. Natl. Acad. Sci. U. S. A.
104(43):17063–68
17. Berezina TL, Zaets SB, Morgan C, Spillert
CR, Kamiyama M, et al. 2002. Influence
of storage on red blood cell rheological
properties. J. Surg. Res. 102(1):6–12
18. Betin VMS, Singleton BK, Parsons SF,
Anstee DJ, Lane JD. 2013. Autophagy
facilitates organelle clearance during dif-
ferentiation of human erythroblasts: evi-
dence for a role for atg4 paralogs during
autophagosome maturation. Autophagy.
9(6):881–93
19. Blanc L, Salomao M, Guo X, An X, Gratzer
W, Mohandas N. 2010. Control of
erythrocyte membrane-skeletal cohe-
sion by the spectrin-membrane linkage.
Biochemistry. 49(21):4516–23
20. Blasi B, D’Alessandro a, Ramundo N, Zolla
L. 2012. Red blood cell storage and cell
morphology. Transfus. Med. 22(2):90–96
21. Boal DH. 1994. Computer simulation of
a model network for the erythrocyte cy-
toskeleton. Biophys. J. 67(2):521–29
22. Boey SK, Boal DH, Discher DE. 1998.
Simulations of the erythrocyte cytoskel-
eton at large deformation. i. microscopic
models. Biophys. J. 75:1573–83
23. Bordin L. 2002. Band 3 is an anchor pro-
tein and a target for shp-2 tyrosine phos-
phatase in human erythrocytes. Blood.
100(1):276–82
24. Bosch FH, Werre JM, Roerdinkholder-
Stoelwinder B, Huls TH, Willekens F,
Halie MR. 1992. Characteristics of red
blood cell populations fractionated with
a combination of counterflow centrif-
ugation and percoll separation. Blood.
79(1):254–60
25. Bosch FH, Werre JM, Schipper L,
Roerdinkholder-Stoelwinder B, Huls T, et
al. 1994. Determinants of red blood cell
deformability in relation to cell age. Eur.
J. Haematol. 52(1):35–41
26. Bosman G. 2004. Erythrocyte ag-
ing in sickle cell disease. Cell Mol Biol.
50(1):81–86
27. Bosman G, De Franceschi L. 2008.
Neuroacanthocytosis-related changes in
erythrocyte membrane organization and
function. Neuroacanthocytosis Syndr. II,
pp. 133–42
28. Bosman G, Klaarenbeek JM, Luten M,
Bos HJ. 2005. Storage-related changes
in erythrocyte band 3: not a case for the
diego blood group antigens. Cell Mol Biol.
51(2):195–200
29. Bosman G, Lasonder E, Groenen-Döpp
Y, Willekens F, Werre J, Novotný V. 2010.
Comparative proteomics of erythrocyte
aging in vivo and in vitro. J. Proteomics.
73(3):396–402
30. Bosman G, Visser F, AJ DM, IG B, WJ DG.
1993. Erythrocyte membrane changes of
individuals with down’s syndrome in var-
ious stages of alzheimer-type dementia.
Neurobiol. Aging. 14(3):223–28
31. Bosman GJ. 2013. Survival of red blood
cells after transfusion: processes and
165
consequences. Front Physiol. 4:376
32. Bosman GJ, Bartholomeus IG, De Grip
WJ, Horstink MW. 1994. Erythrocyte
anion transporter and antibrain immu-
noreactivity in chorea-acanthocytosis.
a contribution to etiology, genetics, and
diagnosis. Brain Res Bull. 33(5):523–28
33. Bosman GJ, Kay MM. 1988. Erythrocyte
aging: a comparison of model systems
for simulating cellular aging in vitro.
Blood Cells. 14:19–46
34. Bosman GJ, Stappers M, Novotny VM.
2010. Changes in band 3 structure as
determinants of erythrocyte integrity
during storage and survival after trans-
fusion. Blood Transfus. 8 Suppl 3:s48–52
35. Bosman GJ, Werre JM, Willekens FL,
Novotny VM. 2008. Erythrocyte ageing
in vivo and in vitro: structural aspects
and implications for transfusion. Transfus.
Med. 18(6):335–47
36. Bosman GJCGM, Cluitmans JCA,
Groenen YAM, Werre JM, Willekens
FLA, Novotný VMJ. 2011. Susceptibility
to hyperosmotic stress-induced phos-
phatidylserine exposure increases during
red blood cell storage. Transfusion.
51(5):1072–78
37. Bosman GJCGM, Lasonder E, Groenen-
Döpp YAM, Willekens FLA, Werre JM.
2012. The proteome of erythrocyte-de-
rived microparticles from plasma: new
clues for erythrocyte aging and vesicu-
lation. J. Proteomics. 76(286):203–10
38. Bosman GJCGM, Lasonder E, Luten M,
Roerdinkholder-Stoelwinder B, Novotný
VMJ, et al. 2008. The proteome of red
cell membranes and vesicles during stor-
age in blood bank conditions. Transfusion.
48(5):827–35
39. Bosman GJCGM, Willekens FLA, Werre
JM. 2005. Erythrocyte aging : a more
than superficial resemblance to apopto-
sis? Cell Physiol Biochem. 16:1–8
40. Braunmüller S, Schmid L, Franke T. 2011.
Dynamics of red blood cells and vesicles
in microchannels of oscillating width. J.
Phys. Condens. Matter. 23:184116 p.1–8
41. Brown D, London E. 1997. Structure of
detergent-resistant membrane domains:
does phase separation occur in biologi-
cal membranes? Biochem. Biophys. Res.
Commun. 240(1):1–7
42. Brown FLH. 2003. Regulation of protein
mobility via thermal membrane undula-
tions. Biophys. J. 84(2 Pt 1):842–53
43. Brunati a M, Bordin L, Clari G, James
P, Quadroni M, et al. 2000. Sequential
phosphorylation of protein band 3 by syk
and lyn tyrosine kinases in intact human
erythrocytes: identification of primary
and secondary phosphorylation sites.
Blood. 96(4):1550–57
44. Brunati AM, Bordin L, Clari G, Moret V.
1996. The lyn-catalyzed tyr phosphor-
ylation of the transmembrane band-3
protein of human erythrocytes. Eur. J.
Biochem. 240(2):394–99
45. Burger P, Hilarius-Stokman P, de Korte D,
van den Berg TK, van Bruggen R. 2012.
Cd47 functions as a molecular switch
for erythrocyte phagocytosis. Blood.
119(23):5512–21
46. Campanella ME, Chu H, Low PS. 2005.
10. Appendices - Bibliography
166
Red blood cell homeostasis
Assembly and regulation of a glycolytic
enzyme complex on the human erythro-
cyte membrane. Proc. Natl. Acad. Sci. U.
S. A. 102(7):2402–7
47. Campbell N, Reece J. 2002. Circulation
and gas exchange. In Biology, pp. 871–99.
Pearson Education International. sixth
edit ed.
48. Caprari P, Tarzia A, Mojoli G, Cianciulli
P, Mannella E, Martorana MC. 2009.
Hereditary spherocytosis and ellipto-
cytosis associated with prosthetic heart
valve replacement: rheological study
of erythrocyte modifications. Int. J.
Hematol. 89(3):285–93
49. Cesta M. 2006. Normal structure, func-
tion, and histology of the spleen. Toxicol.
Pathol. 34(5):455–65
50. Chasis JA, Mohandas N. 1986.
Erythrocyte membrane deformability
and stability: two distinct membrane
properties that are independently regu-
lated by skeletal protein associations. J.
Cell Biol. 103(2):343–50
51. Chu H, Breite A, Ciraolo P, Franco R,
Low P. 2008. Characterization of the
deoxyhemoglobin binding site on human
erythrocyte band 3: implications for o2
regulation of erythrocyte properties.
Blood. 111(2):932–38
52. Chu H, Low PS. 2006. Mapping of gly-
colytic enzyme-binding sites on hu-
man erythrocyte band 3. Biochem. J.
400(1):143–51
53. Cluitmans JCA, Chokkalingam V, Janssen
AM, Brock R, Huck WTS, Bosman
GJCGM. 2014. Alterations in red blood
cell deformability during storage: a mi-
crofluidic approach. Biomed Res. Int.
2014:764268
54. Cluitmans JCA, Hardeman MR, Dinkla
S, Brock R, Bosman GJCGM. 2012. Red
blood cell deformability during stor-
age: towards functional proteomics and
metabolomics in the blood bank. Blood
Transfus. 10 Suppl 2:s12–18
55. Cluitmans JCA, Tomelleri C, Yapici Z,
Dinkla S, Bovee-Geurts P, et al. 2015.
Abnormal red cell structure and func-
tion in neuroacanthocytosis. PLoS One.
10(5):e0125580
56. Coltel N, Combes V, Wassmer SC,
Chimini G, Grau GE. 2006. Cell vesicu-
lation and immunopathology: implica-
tions in cerebral malaria. Microbes Infect.
8(8):2305–16
57. Connor J, Pak CC, Schroit AJ. 1994.
Exposure of phosphatidylserine in the
outer leaflet of human red blood cells:
relationship to cell density, cell age, and
clearance by mononuclear cells. J. Biol.
Chem. 269(4):2399–2404
58. Contri A, Brunati AM, Trentin L, Cabrelle
A, Miorin M, et al. 2005. Chronic lym-
phocytic leukemia b cells contain anom-
alous lyn tyrosine kinase, a putative con-
tribution to defective apoptosis. J. Clin.
Invest. 115(2):369–78
59. D’Alessandro A, D’Amici GM, Vaglio S,
Zolla L. 2012. Time-course investigation
of sagm-stored leukocyte-filtered red
bood cell concentrates: from metab-
olism to proteomics. Haematologica.
97:107–15
167
60. D’Alessandro A, Gevi F, Zolla L. 2013.
Red blood cell metabolism under pro-
longed anaerobic storage. Mol Biosyst.
9(6):1196–1209
61. D’Amici GM, Rinalducci S, Zolla L. 2007.
Proteomic analysis of rbc membrane
protein degradation during blood stor-
age. J. Proteome Res. 6(8):3242–55
62. Da Costa L, Galimand J, Fenneteau O,
Mohandas N. 2013. Hereditary sphero-
cytosis, elliptocytosis, and other red
cell membrane disorders. Blood Rev.
27(4):167–78
63. Darghouth D, Koehl B, Heilier JF,
Madalinski G, Bovee P, et al. 2011.
Alterations of red blood cell metabolome
in overhydrated hereditary stomatocyto-
sis. Haematologica. 96(12):1861–65
64. Darghouth D, Koehl B, Madalinski
G, Heilier JF, Bovee P, et al. 2011.
Pathophysiology of sickle cell disease is
mirrored by the red blood cell metabo-
lome. Blood. 117(6):e57–66
65. Dasgupta SK, Abdel-Monem H, Guchhait
P, Nagata S, Thiagarajan P. 2008. Role of
lactadherin in the clearance of phospha-
tidylserine-expressing red blood cells.
Transfusion. 48(11):2370–76
66. de Back DZ, Kostova EB, van Kraaij M, van
den Berg TK, van Bruggen R. 2014. Of
macrophages and red blood cells; a com-
plex love story. Front. Physiol. 5:9
67. De Franceschi L, Biondani A, Carta F,
Turrini F, Laudanna C, et al. 2008. Ptpε
has a critical role in signaling transduc-
tion pathways and phosphoprotein net-
work topology in red cells. Proteomics.
8(22):4695–4708
68. De Franceschi L, Bosman GJCGM,
Mohandas N. 2014. Abnormal red cell
features associated with hereditary neu-
rodegenerative disorders: the neuro-
acanthocytosis syndromes. Curr. Opin.
Hematol. 21(3):201–9
69. De Franceschi L, Fumagalli L, Olivieri
O, Corrocher R, Lowell CA, Berton G.
1997. Deficiency of src family kinases fgr
and hck results in activation of eryth-
rocyte k/cl cotransport. J. Clin. Invest.
99(2):220–27
70. De Franceschi L, Scardoni G, Tomelleri
C, Danek A, Walker RH, et al. 2012.
Computational identification of phos-
pho-tyrosine sub-networks related to
acanthocyte generation in neuroacan-
thocytosis. PLoS One. 7(2):e31015
71. De Franceschi L, Tomelleri C, Matte A,
Brunati AM, Bovee-Geurts PH, et al.
2011. Erythrocyte membrane changes
of chorea-acanthocytosis are the re-
sult of altered lyn kinase activity. Blood.
118(20):5652–63
72. De Franceschi L, Turrini F, del Giudice
EM, Perrotta S, Olivieri O, et al. 1998.
Decreased band 3 anion transport activ-
ity and band 3 clusterization in congeni-
tal dyserythropoietic anemia type ii. Exp.
Hematol. 26(9):869–73
73. De Matteis MA, Morrow JS. 2000.
Spectrin tethers and mesh in the biosyn-
thetic pathway. J. Cell Sci. 113:2331–43
74. De Oliveira S, Silva-Herdade AS,
Saldanha C. 2008. Modulation of eryth-
rocyte deformability by pkc activity. Clin.
10. Appendices - Bibliography
168
Red blood cell homeostasis
Hemorheol. Microcirc. 39(1-4):363–73
75. Delaunay J. 1995. Genetic disorders
of the red cell membranes. FEBS Lett.
369(1):34–37
76. Delaunay J. 2007. The molecular basis of
hereditary red cell membrane disorders.
Blood Rev. 21(1):1–20
77. Denzer K, Kleijmeer MJ, Heijnen HF,
Stoorvogel W, Geuze HJ. 2000. Exosome:
from internal vesicle of the multivesicu-
lar body to intercellular signaling device.
J. Cell Sci. 113 Pt 19:3365–74
78. Deplaine G, Safeukui I, Jeddi F, Lacoste
F, Brousse V, et al. 2011. The sensing of
poorly deformable red blood cells by the
human spleen can be mimicked in vitro.
Blood. 117(8):e88–95
79. Derose R, Miyamoto T, Inoue T. 2013.
Manipulating signaling at will: chemical-
ly-inducible dimerization (cid) techniques
resolve problems in cell biology. Pflugers
Arch. Eur. J. Physiol. 465(3):409–17
80. Devaux PF. 2000. Is lipid translocation
involved during endo- and exocytosis?
Biochimie. 82:497–509
81. Dinkla S. 2014. Erythrocyte aging and
disease. a tale of membranes and micro-
particles. Thesis
82. Dinkla S, Brock R, Joosten I, Bosman G.
2013. Gateway to understanding micro-
particles: standardized isolation and iden-
tification of plasma membrane-derived
vesicles. Nanomedicine. 8(10):1657–68
83. Dinkla S, Peppelman M, Van Der Raadt
J, Atsma F, Novotný VMJ, et al. 2014.
Phosphatidylserine exposure on stored
red blood cells as a parameter for
donor-dependent variation in product
quality. Blood Transfus. 12(2):204–9
84. Dinkla S, Wessels K, Verdurmen WPR,
Tomelleri C, Cluitmans JC a, et al. 2012.
Functional consequences of sphingomy-
elinase-induced changes in erythrocyte
membrane structure. Cell Death Dis.
3(10):e410
85. Discher DE, Boal DH, Boey SK. 1998.
Simulations of the erythrocyte cytoskel-
eton at large deformation. ii. micropipette
aspiration. Biophys. J. 75(3):1584–97
86. Discher DE, Carl P. 2001. New insights
into red cell network structure, elasticity,
and spectrin unfolding--a current review.
Cell. Mol. Biol. Lett. 6(July):593–606
87. Dzik WH. 2011. The air we breathe: three
vital respiratory gases and the red blood
cell: oxygen, nitric oxide, and carbon di-
oxide. Transfusion. 51(April):676–85
88. Eber S, Lux SE. 2004. Hereditary sphero-
cytosis--defects in proteins that connect
the membrane skeleton to the lipid bilay-
er. Semin Hematol. 41(2):118–41
89. Edidin M. 2003. The state of lipid rafts:
from model membranes to cells. Annu.
Rev. Biophys. Biomol. Struct. 32:257–83
90. Escobar G a, Cheng AM, Moore EE,
Johnson JL, Tannahill C, et al. 2007.
Stored packed red blood cell transfusion
up-regulates inflammatory gene expres-
sion in circulating leukocytes. Ann. Surg.
246(1):129–34
91. Fadok V a, Bratton DL, Rose DM, Pearson
a, Ezekewitz R a, Henson PM. 2000. A
receptor for phosphatidylserine-specif-
ic clearance of apoptotic cells. Nature.

169
405(6782):85–90
92. Farges E, Grebe R, Baumann M. 2002.
Viscoelastic and biochemical proper-
ties of erythrocytes during storage with
sag-m at +4 degrees c. Clin Hemorheol
Microcirc. 27(1):1–11
93. Favretto ME, Cluitmans JC a, Bosman
GJCGM, Brock R. 2013. Human eryth-
rocytes as drug carriers: loading effi-
ciency and side effects of hypotonic
dialysis, chlorpromazine treatment and
fusion with liposomes. J. Control. Release.
170(3):343–51
94. Fens MH a M, van Wijk R, Andringa G,
van Rooijen KL, Dijstelbloem HM, et al.
2012. A role for activated endothelial
cells in red blood cell clearance: implica-
tions for vasopathology. Haematologica.
97(4):500–508
95. Ferru E, Giger K, Pantaleo A, Campanella
E, Grey J, et al. 2011. Regulation of mem-
brane-cytoskeletal interactions by ty-
rosine phosphorylation of erythrocyte
band 3. Blood. 117(22):5998–6006
96. Föller M, Hermann A, Gu S, Alesutan I,
Qadri SM, et al. 2012. Chorein-sensitive
polymerization of cortical actin and sui-
cidal cell death in chorea-acanthocyto-
sis. FASEB J. 26(4):1526–34
97. Fošnarič M, Iglič A, May S. 2006.
Influence of rigid inclusions on the bend-
ing elasticity of a lipid membrane. Phys.
Rev. E. 74(5):1–12
98. Frank SM, Abazyan B, Ono M, Hogue CW,
Cohen DB, et al. 2013. Decreased eryth-
rocyte deformability after transfusion
and the effects of erythrocyte storage
duration. Anesth. Analg. 116(5):975–81
99. Freyssinet JM. 2003. Cellular micropar-
ticles: what are they bad or good for? J.
Thromb. Haemost. 1(7):1655–62
100. Gallagher PG. 2005. Red cell membrane
disorders. Hematology Am. Soc. Hematol.
Educ. Program, pp. 13–18
101. Geldwerth D, Kuypers F a, Bütikofer P,
Allary M, Lubin BH, Devaux PF. 1993.
Transbilayer mobility and distribution of
red cell phospholipids during storage. J.
Clin. Invest. 92(1):308–14
102. Gevi F, D’Alessandro A, Rinalducci S,
Zolla L. 2012. Alterations of red blood
cell metabolome during cold liquid stor-
age of erythrocyte concentrates in cpd-
sagm. J Proteomics. 76 Spec No:168–80
103. Glodek AM, Mirchev R, Golan DE, Khoory
J a, Burns JM, et al. 2010. Ligation of
complement receptor 1 increases eryth-
rocyte membrane deformability. Blood.
116(26):6063–71
104. Goodman SR, Kurdia A, Ammann L,
Kakhniashvili D, Daescu O. 2007. The
human red blood cell proteome and in-
teractome. Exp. Biol. Med. (Maywood).
232(11):1391–1408
105. Gov NS. 2007. Active elastic network:
cytoskeleton of the red blood cell. Phys.
Rev. E - Stat. Nonlinear, Soft Matter Phys.
75(September 2006):1–6
106. Gov NS. 2007. Less is more: removing
membrane attachments stiffens the rbc
cytoskeleton. New J. Phys. 9(11):429–429
107. Gov NS, Cluitmans J, Sens P, Bosman
GJCGM. 2009. Cytoskeletal control
of red blood cell shape : theory and
10. Appendices - Bibliography
170
Red blood cell homeostasis
practice of vesicle formation. In Advances
in Planar Lipid Bilayers and Liposomes, Vol.
10. 10:95–119
108. Gov NS, Safran S a. 2005. Red blood
cell membrane fluctuations and shape
controlled by atp-induced cytoskeletal
defects. Biophys. J. 88(3):1859–74
109. Greenwalt TJ. 2006. The how and
why of exocytic vesicles. Transfusion.
46(1):143–52
110. Gregory A, Hayflick SJ. 2005.
Neurodegeneration with brain iron ac-
cumulation. Folia Neuropathol. 43(4):
286–96
111. Hagelberg C, Allan D. 1990. Restricted
diffusion of integral membrane pro-
teins and polyphosphoinositides leads to
their depletion in microvesicles released
from human erythrocytes. Biochem. J.
271(3):831–34
112. Hägerstrand H, Danieluk M, Bobrowska-
Hägerstrand M, Iglic A, Wrobel A, et al.
2000. Influence of band 3 protein ab-
sence and skeletal structures on am-
phiphile- and ca(2+)-induced shape
alterations in erythrocytes: a study
with lamprey (lampetra fluviatilis), trout
(onchorhynchus mykiss) and human
erythrocytes. Biochim Biophys Acta.
1466(1-2):125–38
113. Hägerstrand H, Isomaa B. 1994. Lipid and
protein composition of exovesicles re-
leased from human erythrocytes follow-
ing treatment with amphiphiles. Biochim.
Biophys. Acta - Biomembr. 1190(2):409–15
114. Hancock JF. 2006. Lipid rafts: conten-
tious only from simplistic standpoints.
Nat. Rev. Mol. Cell Biol. 7(6):456–62
115. Haratake M, Hongoh M, Ono M,
Nakayama M. 2009. Thiol-dependent
membrane transport of selenium
through an integral protein of the red
blood cell membrane. Inorg. Chem.
48(16):7805–11
116. Hardeman M, Goedhart P, Dobbe J,
Lettinga K. 1994. Laser-assisted optical
rotational cell analyzer (l.o.r.c.a) i. a new
instrument for measurement of various
structural hemorheological parameters.
Clin Hemorheol. 14:605–18
117. Hardeman MR, Ince C. 1999. Clinical
potential of in vitro measured red cell
deformability, a myth? Clin. Hemorheol.
Microcirc. 21(3-4):277–84
118. Hayflick SJ, Westaway SK, Levinson
B, Zhou B, Johnson MA, et al. 2003.
Genetic, clinical, and radiographic delin-
eation of hallervorden–spatz syndrome.
N. Engl. J. Med. 348(1):33–40
119. Henkelman S, Dijkstra-Tiekstra M, de
Wildt-Eggen J, Graaff R, Rakhorst G, van
Oeveren W. 2010. Is red blood cell rheol-
ogy preserved during routine blood bank
storage? Transfusion. 50(4):941–48
120. Hess JR. 2010. Red cell changes during
storage. Transfus. Apher. Sci. 43(1):51–59
121. Hess JR. 2012. Scientific problems in the
regulation of red blood cell products.
Transfusion. 52(August):1827–35
122. Hess JR, Greenwalt TG. 2002. Storage
of red blood cells: new approaches.
Transfus. Med. Rev. 16(4):283–95
123. Hess JR, Sparrow RL, Van Der Meer
PF, Acker JP, Cardigan R a., Devine D V.
171
2009. Red blood cell hemolysis during
blood bank storage: using national
quality management data to answer
basic scientific questions. Transfusion.
49(12):2599–2603
124. Ho M, Chelly J, Carter N, Danek A,
Cracker P, Monaco AP. 1994. Isolation of
the gene for mcleod syndrome that en-
codes a novel membrane transport pro-
tein. Cell. 77(6):869–80
125. Högman CF, Meryman HT. 1999. Storage
parameters affecting red blood cell
survival and function after transfusion.
Transfus. Med. Rev. 13(4):275–96
126. Huang Y-X, Wu Z-J, Mehrishi J, Huang
B-T, Chen X-Y, et al. 2011. Human red
blood cell aging: correlative changes in
surface charge and cell properties. J.
Cell. Mol. Med. 15(12):2634–42
127. Hugel B, Martínez M, Kunzelmann C,
Freyssinet J. 2005. Membrane micro-
particles: two sides of the coin. Physiol.
20:22–27
128. Iglič A, Hägerstrand H, Veranic P,
Plemenitas A, Kralj-Iglic V. 2006.
Curvature-induced accumulation of
anisotropic membrane components and
raft formation in cylindrical membrane
protrusions. J. Theor. Biol. 240(3):368–73
129. Iglič A, Veranič P, Jezernik K, Fošnarič M,
Kamin B, et al. 2004. Spherocyte shape
transformation and release of tubular
nanovesicles in human erythrocytes.
Bioelectrochemistry. 62:159–61
130. Iolascon A, De Falco L, Borgese F,
Esposito MR, Avvisati RA, et al. 2009. A
novel erythroid anion exchange variant
(gly796arg) of hereditary stomatocy-
tosis associated with dyserythropoiesis.
Haematologica. 94(8):1049–59
131. Jacobs ME, DeSouza L V., Samaranayake
H, Pearlman RE, Siu KWM, Klobutcher L
a. 2006. The tetrahymena thermophila
phagosome proteome. Eukaryot. Cell.
5(12):1990–2000
132. Jarolim P, Palek J, Amato D, Hassan K,
Sapak P, et al. 1991. Deletion in eryth-
rocyte band 3 gene in malaria-resistant
southeast asian ovalocytosis. Proc. Natl.
Acad. Sci. U. S. A. 88(24):11022–26
133. Jennings ML, Anderson MP, Monaghan
R. 1986. Monoclonal antibodies against
human erythrocyte band 3 protein. .
261(19):9002–10
134. Johnson CP, Tang H-Y, Carag C, Speicher
DW, Discher DE. 2007. Forced unfold-
ing of proteins within cells. Science.
317(August):663–66
135. Jung HH, Danek A, Walker RH. 2011.
Neuroacanthocytosis syndromes.
Orphanet J. Rare Dis. 6(1):68
136. Kaoui B, Biros G, Misbah C. 2009. Why do
red blood cells have asymmetric shapes
even in a symmetric flow? Phys. Rev. Lett.
103(18):1–4
137. Kay M. 2005. Immunoregulation of
cellular life span. Ann. N. Y. Acad. Sci.
1057:85–111
138. Kay M, Goodman J. 2003. Immuno-
regulation of cellular lifespan: physiolog-
ic autoantibodies and their peptide anti-
gens. Cell Mol Biol. 49(2):217–4
139. Kay MM, Bosman GJ, Lawrence C. 1988.
Functional topography of band 3: specific
10. Appendices - Bibliography
172
Red blood cell homeostasis
structural alteration linked to functional
aberrations in human erythrocytes. Proc.
Natl. Acad. Sci. U. S. A. 85(2):492–96
140. Kim-Shapiro DB, Lee J, Gladwin MT. 2011.
Storage lesion: role of red blood cell
breakdown. Transfusion. 51:844–51
141. Knowles DW, Tilley L, Mohandas N, Chasis
J a. 1997. Erythrocyte membrane vesicu-
lation: model for the molecular mecha-
nism of protein sorting. Proc. Natl. Acad.
Sci. U. S. A. 94(November):12969–74
142. Koralkova P, van Solinge WW, van Wijk
R. 2014. Rare hereditary red blood cell
enzymopathies associated with hemo-
lytic anemia - pathophysiology, clinical
aspects, and laboratory diagnosis. Int. J.
Lab. Hematol. 36(3):388–97
143. Koutsiaris AG, Tachmitzi S V, Batis N,
Kotoula MG, Karabatsas CH, et al. 2007.
Volume flow and wall shear stress quan-
tification in the human conjunctival cap-
illaries and post-capillary venules in vivo.
Biorheology. 44(5-6):375–86
144. Kriebardis AG, Antonelou MH, Stamoulis
KE, Economou-Petersen E, Margaritis
LH, Papassideri IS. 2007. Storage-
dependent remodeling of the red blood
cell membrane is associated with in-
creased immunoglobulin g binding, lipid
raft rearrangement, and caspase activa-
tion. Transfusion. 47(7):1212–20
145. Kriebardis AG, Antonelou MH, Stamoulis
KE, Economou-Petersen E, Margaritis
LH, Papassideri IS. 2008. Rbc-derived
vesicles during storage: ultrastruc-
ture, protein composition, oxidation,
and signaling components. Transfusion.
48(9):1943–53
146. Kulicke W, Clasen C. 2004. Viscosimetry
of polymers and polyelectrolytes. Springer,
London, UK
147. Kuypers FA, de Jong K. 2004. The role
of phosphatidylserine in recognition and
removal of erythrocytes. Cell. Mol. Biol.
(Noisy-le-grand). 50(2):147–58
148. Laemmli U. 1970. Cleavage of struc-
tural proteins during the assembly of
the head of bacteriophage t4. Nature.
227(5259):680–85
149. Lang F, Lang KS, Lang PA, Huber SM,
Wieder T. 2006. Mechanisms and signifi-
cance of eryptosis. Antioxid. Redox Signal.
8(7-8):1183–92
150. Lang PA, Schenck M, Nicolay JP, Becker
JU, Kempe DS, et al. 2007. Liver cell
death and anemia in wilson disease in-
volve acid sphingomyelinase and cera-
mide. Nat. Med. 13(2):164–70
151. Lanotte L, Tomaiuolo G, Misbah C,
Bureau L, Guido S. 2014. Red blood cell
dynamics in polymer brush-coated mi-
crocapillaries: a model of endothelial gly-
cocalyx in vitro. Biomicrofluidics. 8(1):1–10
152. Larsen KE, Sulzer D. 2002. Autophagy
in neurons: a review. Histol. Histopathol.
17(3):897–908
153. Lee JC, Discher DE. 2001. Deformation-
enhanced fluctuations in the red cell
skeleton with theoretical relations to
elasticity, connectivity, and spectrin un-
folding. Biophys. J. 81(6):3178–92
154. Li J, Lykotrafitis G, Dao M, Suresh S.
2007. Cytoskeletal dynamics of human
erythrocyte. Proc. Natl. Acad. Sci. U. S. A.

173
104(12):4937–42
155. Lillemeier BF, Pfeiffer JR, Surviladze
Z, Wilson BS, Davis MM. 2006. Plasma
membrane-associated proteins are clus-
tered into islands attached to the cyto-
skeleton. Proc. Natl. Acad. Sci. U. S. A.
103(50):18992–97
156. Lim H W G, Wortis M, Mukhopadhyay
R. 2002. Stomatocyte-discocyte-echi-
nocyte sequence of the human red
blood cell: evidence for the bilayer-
couple hypothesis from membrane
mechanics. Proc. Natl. Acad. Sci. U. S. A.
99(26):16766–69
157. Lin LC-L, Brown FLH. 2004. Dynamics
of pinned membranes with application
to protein diffusion on the surface of red
blood cells. Biophys. J. 86(2):764–80
158. Liu F, Mizukami H, Sarnaik S, Ostafin
A. 2005. Calcium-dependent human
erythrocyte cytoskeleton stability anal-
ysis through atomic force microscopy. J.
Struct. Biol. 150(2):200–210
159. Liu J, Guo X, Mohandas N, Chasis J a.,
An X. 2010. Membrane remodeling
during reticulocyte maturation. Blood.
115(10):2021–27
160. Liu SC, Derick LH, Duquette MA, Palek J.
1989. Separation of the lipid bilayer from
the membrane skeleton during disco-
cyte-echinocyte transformation of hu-
man erythrocyte ghosts. Eur J Cell Biol.
49(2):358–65.
161. Liu SC, Derick LH, Palek J. 1987.
Visualization of the hexagonal lattice in
the erythrocyte membrane skeleton. J.
Cell Biol. 104(3):527–36
162. Low PS, Allen DP, Zioncheck TF, Chari
P, Willardson BM, et al. 1987. Tyrosine
phosphorylation of band 3 inhibits pe-
ripheral protein binding. J. Biol. Chem.
262(10):4592–96
163. Low PS, Rathinavelu P, Harrison ML. 1993.
Regulation of glycolysis via reversible en-
zyme binding to the membrane protein
band 3. J. Biol. Chem. 268(20):14627–31
164. Lupo F, Russo R, Iolascon A, Ieluzzi D,
Siciliano A, et al. 2015. Protease inhib-
itors-based therapy induces acquired
spherocytic-like anaemia and ineffective
erythropoiesis in chronic hepatitis c virus
patients. Liver Int.
165. Luten M, Roerdinkholder-Stoelwinder
B, Bost HJ, Bosman GJCGM. 2004.
Survival of the fittest?--survival of stored
red blood cells after transfusion. Cell.
Mol. Biol. (Noisy-le-grand). 50(2):197–203
166. Luten M, Roerdinkholder-Stoelwinder
B, Rombout-Sestrienkova E, de Grip WJ,
Bos HJ, Bosman GJCGM. 2008. Red cell
concentrates of hemochromatosis pa-
tients comply with the storage guidelines
for transfusion purposes. Transfusion.
48(3):436–41
167. Luten M, Roerdinkholder-Stoelwinder
B, Schaap NPM, De Grip WJ, Bos HJ,
Bosman GJCGM. 2008. Survival of red
blood cells after transfusion: a compar-
ison between red cells concentrates of
different storage periods. Transfusion.
48(7):1478–85
168. Lutz HU. 2004. Innate immune and
non-immune mediators of erythrocyte
clearance. Cell. Mol. Biol. (Noisy-le-grand).
10. Appendices - Bibliography
174
Red blood cell homeostasis
50(2):107–16
169. MacDonald R. 1977. Red cell 2,3-di-
phosphoglycerate and oxygen affinity.
Anaesthesia. 32(6):544–53
170. Manno S, Takakuwa Y, Mohandas N.
2002. Identification of a functional role
for lipid asymmetry in biological mem-
branes: phosphatidylserine-skeletal pro-
tein interactions modulate membrane
stability. Proc. Natl. Acad. Sci. U. S. A.
99(4):1943–48
171. Manno S, Takakuwa Y, Mohandas N.
2005. Modulation of erythrocyte mem-
brane mechanical function by pro-
tein 4.1 phosphorylation. J. Biol. Chem.
280(9):7581–87
172. Manno S, Takakuwa Y, Nagao K,
Mohandas N. 1995. Modulation of eryth-
rocyte membrane mechanical func-
tion by beta-spectrin phosphorylation
and dephosphorylation. J. Biol. Chem.
270(10):5659–65
173. Margolis RL, O’Hearn E, Rosenblatt A,
Willour V, Holmes SE, et al. 2001. A dis-
order similar to huntington’s disease is
associated with a novel cag repeat ex-
pansion. Ann. Neurol. 50(6):373–80
174. Martínez MC, Tesse A, Zobairi F,
Andriantsitohaina R. 2005. Shed mem-
brane microparticles from circulating
and vascular cells in regulating vascu-
lar function. Am. J. Physiol. Heart Circ.
Physiol. 288(3):H1004–9
175. Matte A, Low PS, Turrini F, Bertoldi
M, Campanella ME, et al. 2010.
Peroxiredoxin-2 expression is increased
in beta-thalassemic mouse red cells but
is displaced from the membrane as a
marker of oxidative stress. Free Radic.
Biol. Med. 49(3):457–66
176. Mebius RE, Kraal G. 2005. Structure and
function of the spleen. Nat. Rev. Immunol.
5(8):606–16
177. Messana I, Ferroni L, Misiti F, Girelli G,
Pupella S, et al. 2000. Blood bank con-
ditions and rbcs: the progressive loss
of metabolic modulation. Transfusion.
40(3):353–60
178. Messana I, Orlando M, Cassiano L,
Pennacchietti L, Zuppi C, et al. 1996.
Human erythrocyte metabolism is mod-
ulated by the o2-linked transition of he-
moglobin. FEBS Lett. 390(1):25–28
179. Mitrofan-Oprea L, Palii C, Tissier J-P,
Héron A, Verpoort T, et al. 2007. [novel
criteria for assessing red blood cell via-
bility in blood banks]. Transfus. Clin. Biol.
14(4):393–401
180. Mohandas N, Chasis JA. 1993. Red blood
cell deformability, membrane materi-
al properties and shape: regulation by
transmembrane, skeletal and cytoso-
lic proteins and lipids. Semin. Hematol.
30(3):171–92
181. Mohandas N, Evans E. 1994. Mechanical
properties of the red cell membrane in
relation to molecular structure and ge-
netic defects. Annu. Rev. Biophys. Biomol.
Struct. 23:787–818
182. Mohandas N, Gallagher PG. 2008. Red
cell membrane: past, present, and future.
Blood. 112(10):3939–48
183. Mokken FC, Kedaria M, Henny CP,
Hardeman MR, Gelb a. W. 1992. The clinical

175
importance of erythrocyte deformability,
a hemorrheological para-meter
184. Mortensen M, Ferguson DJP, Edelmann
M, Kessler B, Morten KJ, et al. 2010. Loss
of autophagy in erythroid cells leads to
defective removal of mitochondria and
severe anemia in vivo. Proc. Natl. Acad.
Sci. U. S. A. 107(2):832–37
185. Mosca A, Paleari R, Leone D, Ivaldi G.
2009. The relevance of hemoglobin f
measurement in the diagnosis of thalas-
semias and related hemoglobinopathies.
Clin. Biochem. 42(18):1797–1801
186. Moutzouri a G, Athanassiou G a,
Dimitropoulou D, Skoutelis a T, Gogos C
a. 2008. Severe sepsis and diabetes mel-
litus have additive effects on red blood
cell deformability. J. Infect. 57(2):147–51
187. Mrówczyńska L, Lindqvist C, Iglič A,
Hägerstrand H. 2012. Spontaneous
curvature of ganglioside gm1 - effect
of cross-linking. Biochem. Biophys. Res.
Commun. 422(4):776–79
188. Müller H, Lutz HU. 1983. Binding of au-
tologous igg to human red blood cells
before and after atp-depletion. selec-
tive exposure of binding sites (autoanti-
gens) on spectrin-free vesicles. Biochim.
Biophys. Acta. 729(2):249–57
189. Müller H, Schmidt U, Lutz H. 1981. On
the mechanism of vesicle release from
atp-depleted human red blood cells.
Biochim Biophys Acta. 649(2):462–70
190. Musielak M. 2009. Red blood cell-de-
formability measurement: review of
techniques. Clin. Hemorheol. Microcirc.
42(1):47–64
191. Nagao T, Kurosu T, Umezawa Y, Nogami
A, Oshikawa G, et al. 2014. Proliferation
and survival signaling from both jak2-
v617f and lyn involving gsk3 and mtor/
p70s6k/4ebp1 in pvtl-1 cell line newly
established from acute myeloid leukemia
transformed from polycythemia vera.
PLoS One. 9(1):e84746
192. Neelam S, Kakhniashvili DG, Wilkens
S, Levene SD, Goodman SR. 2011.
Functional 20s proteasomes in mature
human red blood cells. Exp. Biol. Med.
(Maywood). 236(5):580–91
193. Oldenborg PA. 2000. Role of cd47 as a
marker of self on red blood cells. Science
(80-. ). 288(5473):2051–54
194. Op den Kamp J. 1979. Lipid asymmetry in
membranes. Annu Rev Biochem. 48:47–71
195. Pantaleo A, De Franceschi L, Ferru E,
Vono R, Turrini F. 2010. Current knowl-
edge about the functional roles of phos-
phorylative changes of membrane pro-
teins in normal and diseased red cells. J.
Proteomics. 73(3):445–55
196. Pantaleo A, Ferru E, Carta F, Mannu F,
Simula LF, et al. 2011. Irreversible ae1
tyrosine phosphorylation leads to mem-
brane vesiculation in g6pd deficient red
cells. PLoS One. 6(1):e15847
197. Pantaleo A, Ferru E, Giribaldi G, Mannu
F, Carta F, et al. 2009. Oxidized and
poorly glycosylated band 3 is selective-
ly phosphorylated by syk kinase to form
large membrane clusters in normal and
g6pd-deficient red blood cells. Biochem.
J. 418(2):359–67
198. Pathak GP, Strickland D, Vrana JD,
10. Appendices - Bibliography
176
Red blood cell homeostasis
Tucker CL. 2014. Benchmarking of op-
tical dimerizer systems. ACS Synth. Biol.
3(11):832–38
199. Paulson R, Shi L, Wu D. 2011. Stress eryth-
ropoiesis: new signals and new stress
progenitor cells. Curr. Opin. Hematol.
18(3):139–45
200. Peel N, Larijani B, Parker PJ. 2013.
Localised interventions in cellular pro-
cesses. Biochim. Biophys. Acta - Proteins
Proteomics. 1834(7):1364–70
201. Perrotta S, Borriello A, Scaloni A, De
Franceschi L, Brunati AM, et al. 2005.
The n-terminal 11 amino acids of human
erythrocyte band 3 are critical for al-
dolase binding and protein phosphory-
lation: implications for band 3 function.
Blood. 106(13):4359–65
202. Perrotta S, Gallagher PG, Mohandas N.
2008. Hereditary spherocytosis. Lancet.
372(9647):1411–26
203. Peters L, Shivdasani R, Liu S, Hanspal
M, John K, et al. 1996. Anion exchanger
1 (band 3) is required to prevent eryth-
rocyte membrane surface loss but not
to form the membrane skeleton. Cell.
86(6):917–27
204. Prohaska R, Sibon OCM, Rudnicki DD,
Danek A, Hayflick SJ, et al. 2012. Brain,
blood, and iron: perspectives on the roles
of erythrocytes and iron in neurodegen-
eration. Neurobiol. Dis. 46(3):607–24
205. Puchulu-Campanella E, Chu H, Anstee
DJ, Galan J a., Tao WA, Low PS. 2013.
Identification of the components of a
glycolytic enzyme metabolon on the
human red blood cell membrane. J. Biol.
Chem. 288(2):848–58
206. Rampoldi L, Danek A, Monaco AP. 2002.
Clinical features and molecular bases of
neuroacanthocytosis. J. Mol. Med. (Berl).
80(8):475–91
207. Reinhart WH, Chien S. 1987. Echinocyte-
stomatocyte transformation and shape
control of human red blood cells: mor-
phological aspects. Am. J. Hematol.
24(1):1–14
208. Rinalducci S, Longo V, Ceci LR, Zolla L.
2015. Targeted quantitative phosphopro-
teomic analysis of erythrocyte mem-
branes during blood bank storage. J.
Mass Spectrom. 50(2):326–35
209. Rios JA, Hambleton J, Viele M, Rugg N,
Sindermann G, et al. 2006. Viability of
red cells prepared with s-303 patho-
gen inactivation treatment. Transfusion.
46(10):1778–86
210. Rochette J, Craig J, Thein S. 1994. Fetal
hemoglobin levels in adults. Blood Rev.
8(4):213–24
211. Rosenbluth MJ, Lam W a, Fletcher D a.
2008. Analyzing cell mechanics in he-
matologic diseases with microfluidic
biophysical flow cytometry. Lab Chip.
8(7):1062–70
212. Roux A, Cuvelier D, Nassoy P, Prost J,
Bassereau P, Goud B. 2005. Role of cur-
vature and phase transition in lipid sort-
ing and fission of membrane tubules.
EMBO J. 24(8):1537–45
213. Rubin O, Crettaz D, Canellini G, Tissot
JD, Lion N. 2008. Microparticles in
stored red blood cells: an approach using
flow cytometry and proteomic tools. Vox

177
Sang. 95:289–97
214. Safeukui I, Buffet P a., Deplaine G, Perrot
S, Brousse V, et al. 2012. Quantitative as-
sessment of sensing and sequestration
of spherocytic erythrocytes by the hu-
man spleen. Blood. 120(2):424–30
215. Salomao M, Chen K, Villalobos J,
Mohandas N, An X, Chasis JA. 2010.
Hereditary spherocytosis and hereditary
elliptocytosis: aberrant protein sorting
during erythroblast enucleation. Blood.
116(2):267–69
216. Salomao M, Zhang X, Yang Y, Lee S,
Hartwig JH, et al. 2008. Protein 4.1r-de-
pendent multiprotein complex: new in-
sights into the structural organization of
the red blood cell membrane. Proc. Natl.
Acad. Sci. U. S. A. 105(23):8026–31
217. Salzer U, Hinterdorfer P, Hunger U,
Borken C, Prohaska R. 2002. Ca(++)-
dependent vesicle release from eryth-
rocytes involves stomatin-specific lipid
rafts, synexin (annexin vii), and sorcin.
Blood. 99(7):2569–77
218. Salzer U, Prohaska R. 2001. Stomatin,
flotillin-1, and flotillin-2 are major integral
proteins of erythrocyte lipid rafts. Blood.
97(4):1141–43
219. Salzer U, Zhu R, Luten M, Isobe H,
Pastushenko V, et al. 2008. Vesicles
generated during storage of red cells
are rich in the lipid raft marker stomatin.
Transfusion. 48(3):451–62
220. Samaranayake HS, Cowan AE, Klobutcher
LA. 2011. Vacuolar protein sorting protein
13a, ttvps13a, localizes to the tetrahyme-
na thermophila phagosome membrane
and is required for efficient phagocyto-
sis. Eukaryot. Cell. 10(9):1207–18
221. Sanquin. 2015. Bloedtransfusie - infor-
matie voor patienten
222. Schaeffer EK, West RJ, Conine SJ, Lowrey
CH. 2014. Multiple physical stresses in-
duce γ-globin gene expression and fe-
tal hemoglobin production in erythroid
cells. Blood Cells. Mol. Dis. 52(4):214–24
223. Schloesser LL, Korst DR, Clatanoff D V,
Schilling RF. 1957. Radioactivity over the
spleen and liver following the transfu-
sion of chromium51-labelled erythro-
cytes in hemolytic anemia. J Clin Invest.
36(10):1470–85
224. Sens P. 2004. Dynamics of membrane
budding driven by lipid translocation.
Phys Rev Lett. 93:108103
225. Sens P, Gov N. 2006. Force balance and
membrane shedding at the red blood cell
surface. Phys. Rev. Lett. 98(1):4
226. Sens P, Turner MS. 2006. Budded mem-
brane microdomains as tension regula-
tors. Phys. Rev. E - Stat. Nonlinear, Soft
Matter Phys. 73:1–4
227. Sharom FJ, Lehto MT. 2002. Glyco-
sylphosphatidylinositol-anchored pro-
teins: structure, function, and cleavage by
phosphatidylinositol-specific phospholi-
pase c. Biochem. Cell Biol. 80(5): 535–49
228. Shemin D, Rittenberg D. 1946. The life
span of the human red blood cell. J. Biol.
Chem.
229. Shevkoplyas SS, Yoshida T, Gifford SC,
Bitensky MW. 2006. Direct measure-
ment of the impact of impaired eryth-
rocyte deformability on microvascular
10. Appendices - Bibliography
178
Red blood cell homeostasis
network perfusion in a microfluidic de-
vice. Lab Chip. 6(7):914–20
230. Shiu Y-T, McIntire L V. 2003. In vitro
studies of erythrocyte–vascular endo-
thelium interactions. Ann. Biomed. Eng.
31(11):1299–1313
231. Shukla S, Hanahan D. 1982. Membrane
alterations in cellular aging : susceptibil-
ity of phospholipids in density (age)-sep-
arated human erythrocytes to phos-
pholipase a2. Arch Biochem Biophys.
214(1):335–41
232. Siegl C, Hamminger P, Jank H, Ahting U,
Bader B, et al. 2013. Alterations of red
cell membrane properties in neuroacan-
thocytosis. PLoS One. 8(10):e76715
233. Singer SJ, Nicolson GL. 1972. The flu-
id mosaic model of the structure
of cell membranes. Science (80-. ).
175(4023):720–31
234. Skalak R, Branemark PI. 1969. De-
formation of red blood cells in capillaries.
Science. 164(3880):717–19
235. Straat M, Van Bruggen R, De Korte D,
Juffermans NP. 2012. Red blood cell
clearance in inflammation. Transfus. Med.
Hemotherapy. 39(5):353–60
236. Tomaiuolo G, Barra M, Preziosi V,
Cassinese A, Rotoli B, Guido S. 2011.
Microfluidics analysis of red blood cell
membrane viscoelasticity. Lab Chip.
11(3):449–54
237. Tomaiuolo G, Guido S. 2011. Start-up
shape dynamics of red blood cells in mi-
crocapillary flow. Microvasc. Res. 82(1):
35–41
238. Tsai F-C, Chen H-Y. 2008. Adsorp-
tion-induced vesicle fission. Phys. Rev. E.
78(5):051906
239. Tse WT, Lux SE. 1999. Red blood cell
membrane disorders. Br. J. Haematol.
104:2–13
240. Ueno S, Maruki Y, Nakamura M,
Tomemori Y, Kamae K, et al. 2001. The
gene encoding a newly discovered pro-
tein, chorein, is mutated in chorea-acan-
thocytosis. Nat. Genet. 28(2):121–22
241. van ’t Erve TJ, Wagner BA, Martin SM,
Knudson CM, Blendowski R, et al. 2014.
The heritability of metabolite concen-
trations in stored human red blood cells.
Transfusion. 54(8):2055–63
242. Van Dort HM, Knowles DW, Chasis J
a, Lee G, Mohandas N, Low PS. 2001.
Analysis of integral membrane protein
contributions to the deformability and
stability of the human erythrocyte mem-
brane. J. Biol. Chem. 276(50):46968–74
243. Verhoeven AJ, Hilarius PM, Dekkers
DWC, Lagerberg JWM, de Korte D.
2006. Prolonged storage of red blood
cells affects aminophospholipid translo-
case activity. Vox Sang. 91(3):244–51
244. Vince JW, Reithmeier RA. 1998. Carbonic
anhydrase ii binds to the carboxyl ter-
minus of human band 3, the erythro-
cyte c1-/hco3- exchanger. J. Biol. Chem.
273(43):28430–37
245. Werre JM, Willekens FLA, Bosch FH, de
Haans LD, van der Vegt SGL, et al. 2004.
The red cell revisited--matters of life and
death. Cell. Mol. Biol. (Noisy-le-grand).
50(2):139–45
246. Westerman M, Pizzey A, Hirschman J,
179
Cerino M, Weil-Weiner Y, et al. 2008.
Microvesicles in haemoglobinopathies
offer insights into mechanisms of hyper-
coagulability, haemolysis and the effects
of therapy. Br. J. Haematol. 142(1):126–35
247. Westerman MP, Unger L, Kucuk O, Quinn
P, Lis LJ. 1998. Phase changes in mem-
brane lipids in sickle red cell shed-vesi-
cles and sickle red cells. Am. J. Hematol.
58(3):177–82
248. Wiedeman MP. 1963. Dimensions of
blood vessels from distributing artery to
collecting vein. Circ. Res. 12:375–78
249. Wilkinson DK, Turner EJ, Parkin ET,
Garner AE, Harrison PJ, et al. 2008.
Membrane raft actin deficiency and al-
tered ca2+-induced vesiculation in sto-
matin-deficient overhydrated hereditary
stomatocytosis. Biochim. Biophys. Acta.
1778(1):125–32
250. Willekens F. 2010. Erythrocyte vesicula-
tion a survival strategy
251. Willekens F, Bosch F, Roerdinkholder-
Stoelwinder B, Groenen-Dopp Y, Werre
J. 1997. Quantification of loss of haemo-
globin components from the circulating
red blood cell in vivo. Eur. J. Haematol.
58(4):246–50
252. Willekens F, Roerdinkholder-Stoelwinder
B, Groenen-Döpp YAM, Bos H, Bosman
GJCGM, et al. 2003. Hemoglobin loss
from erythrocytes in vivo results from
spleen-facilitated vesiculation. Blood.
101(2):747–51
253. Willekens F, Werre JM, Groenen-Döpp
Y a M, Roerdinkholder-Stoelwinder B,
De Pauw B, Bosman GJCGM. 2008.
Erythrocyte vesiculation: a self-pro-
tective mechanism? Br. J. Haematol.
141(4):549–56
254. Willekens FLA, Werre JM, Kruijt JK,
Roerdinkholder-Stoelwinder B, Groenen-
Döpp YAM, et al. 2005. Liver kupffer cells
rapidly remove red blood cell-derived
vesicles from the circulation by scaven-
ger receptors. Blood. 105(5):2141–45
255. Xia Y, Whitesides GM. 1998. Soft lithogra-
phy. Angew. Chemie Int. Ed. 37(5):550–75
256. Xia Y, Whitesides GM. 1998. Soft lithog-
raphy. Annu. Rev. Mater. Sci. 28(1):153–84
257. Ye T, Li H, Lam KY. 2010. Modeling and
simulation of microfluid effects on de-
formation behavior of a red blood cell in
a capillary. Microvasc. Res. 80(3):453–63
258. Zheng Y, Chen J, Cui T, Shehata N, Wang
C, Sun Y. 2014. Characterization of red
blood cell deformability change during
blood storage. Lab Chip. 14(3):577–83
259. Zhou B, Westaway SK, Levinson B,
Johnson M a, Gitschier J, Hayflick SJ.
2001. A novel pantothenate kinase gene
(pank2) is defective in hallervorden-spatz
syndrome. Nat. Genet. 28(4):345–49
10. Appendices - Bibliography

180
Red blood cell homeostasis
181
Curriculum Vitae
Judith Cluitmans was born in Waalwijk, the Netherlands, on June 27, 1986. After receiving her bachelor degree in Medical Biology in 2007 from the Radboud University Nijmegen, she continued with the Management & Technology master track of the Master Medical Biology. She performed her first Master internship at the Department of Biochemistry of the Radboud University Medical Center (Radboudumc) under the supervision of Dr. Giel Bosman, where she started to work on red blood cell function after transfusion. For her second master intern-ship, she went to TNO in Leiden to study the genetics of physical activity and the market value of a possible genetic test under the supervision of Prof. Dr. Marijke Hopman. After she graduated in 2010, she started as a PhD student at the Radboudumc at the department of Biochemistry in the group of Prof. Dr. Roland Brock on the topic of red blood cell homeostasis. During her PhD-project she participated in the European Multidisciplinary Initiative on Neuroacanthocy-tosis (EMINA) and helped with the organization of NANBIA 2012, the world-wide conference on Neuroacanthocytosis (NA) en Neurodegeneration with Brain Iron Accumulation (NBIA). Following her appointment as a PhD student, she worked as a researcher on EMINA 2, on the molecular pathophysiology of Chorea-Acan-thocytosis from 2013 – 2015.
10. Appendices - Curriculum Vitae

182
Red blood cell homeostasis
183
List of publications
JCA Cluitmans, F Gevi, A Matte, JK Freitas Leal, L DeFranceschi, L Zolla, R Brock, MJW Adjobo-Hermans, GJGCM Bosman. Red blood cell homeostasis: the effect of phosphorylation-mediated membrane protein interactions on morphology and deformability. Frontiers in Molecular Biosciences; doi: 10.3389/fmolb.2016.00010
MJW Adjobo-Hermans, JCA Cluitmans, GJCGM Bosman. Neuroacanthocytosis: Observations, Theories and Perspectives on the Origin and Significance of Acan-thocytes. Tremor and Other Hyperkinetic Movements 2015; 5 (328) doi: 10.7916/D8VH5N2M. eCollection 2015.
JCA Cluitmans, C Tomelleri, Z Yapici, S Dinkla, V Chokkalingam, L Franceschi, R Brock, GJCGM Bosman. Abnormal red cell structure and function in neuroacan-thocytosis. PlosOne, 2015. DOI: 10.1371/journal.pone.0125580
JCA Cluitmans*, V Chokkalingam*, AM Janssen, GJCGM Bosman, WTS Huck, R Brock. Alterations in red blood cell deformability during storage: a microfluidic approach. Biomed Research International 2014; Article ID 764268.* These authors contributed equally
A Chakrabarti, JJ Witsenburg, MD Sinzinger, M Richter, R Wallbrecher, JCA Cluitmans, WP Verdurmen, S Tanis, MJ Adjobo-Hermans, J Rademann, R Brock. Multivalent presentation of the cell-penetrating peptide nona-arginine on a linear scaffold strongly increases its membrane-perturbing capacity. Biochim Biophys Acta. 2014; 1838 (12): 3097-106
M Favretto, JCA Cluitmans, GJCGM Bosman, R Brock. Human erythrocytes as drug carriers: Loading efficiency and side effects of hypotonic dialysis, chlor-promazine treatment and fusion with liposomes. Journal of Controlled Release 2013; 170 (3): 343-51.
S Dinkla, K Wessels, WPR Verdurmen, C Tomelleri, JCA Cluitmans, J Fransen, B Fuchs, J Schiller, I Joosten, R Brock and GJCGM Bosman. Functional conse-quences of sphingomyelinase-induced changes in erythrocyte membrane struc-ture. Cell Death and Disease 2012; 3, e410; doi:10.1038/cddis.2012.143
10. Appendices - List of publications
184
Red blood cell homeostasis
JCA Cluitmans, MR Hardeman, S Dinkla, R Brock, GJCGM Bosman. Red blood cell deformability during storage: towards functional proteomics and metabolo-mics in the Blood Bank. Blood Transfusion 2012; 10 Suppl 2: s12-8
M Ghashghaeinia, JCA Cluitmans, A Akel, P Dreischer, M Toulany, M Köberle, Y Skabytska, M Saki, T Biedermann, M Duszenko, F Lang, T Wieder, GJCGM Bosman. The impact of erythrocyte age on eryptosis. Br J Haematol. 2012; 157 (5): 606-14
GJCGM Bosman, JCA Cluitmans, Y Groenen, J Werre, F Willekens, V Novotny. Susceptibility to hyperosmotic stress-induced phosphatidylserine exposure increases during erythrocyte storage. Transfusion 2011; 51 (5): 1072-107
N Gov, JCA Cluitmans, P Sens, GJCGM Bosman. Cytoskeletal control of red blood cell shape: theory and practice of vesicle formation. Adv. Planar Lipid Bilayers Liposomes, Volume 10, 2009; 10: 95–119

185
10. Appendices - List of publications

187
Dankwoord
Ter afsluiting van dit proefschrift wil ik mijn dank uiten aan velen met wie ik heb samengewerkt en die mij op enige wijze hebben gesteund tijdens mijn promotie-traject. Enkele mensen wil ik in het bijzonder bedanken.
Beste Giel, bedankt voor alles de afgelopen jaren. Het is alweer 9 jaar geleden dat ik mijn masterstage bij jou begon op de afdeling Biochemie. Nadat ik een korte tijd buiten de wetenschap had gewerkt, wist jij mij in 2010 weer te strikken voor het onderzoek. Ik kon vanaf de eerste dag altijd bij je binnenlopen en overal met je over praten. Ik heb altijd op jouw hulp kunnen rekenen, inhoudelijk bij het onderzoek, maar onder andere ook bij mijn zoektocht naar een tweede master-stage of die keer dat ik in Wenen zonder portemonnee kwam te zitten. Bedankt dat jij en Marionne er toen voor mij waren! Ik had me geen betere begeleider kunnen wensen de afgelopen jaren.
Beste Roland, bedankt dat je mij de mogelijkheid bood te promoveren binnen jouw groep op een onderwerp dat (indertijd) ver af stond van het meeste onder-zoek dat bij BIS plaatsvond. Jouw inbreng en ideeën waren een goede toevoeging aan het ery-onderzoek waar ik met Giel aan begonnen was. Ook hielp je mij er aan herinneren dat het onderzoek moest leiden tot genoeg output voor een proef-schrift. Dat hield mij scherp.
Merel, bedankt dat je mij de kans gaf langer te blijven op de afdeling, zowel om mijn proefschrift af te ronden als ook om bredere onderzoekservaring op te doen, door mijn uitstap naar het lab in Bristol en het opzetten van het erythro-poiesis-onderzoek. Bedankt voor jouw directe hulp en input bij het labwerk en het lezen en corrigeren van mijn proefschrift.
Anders dan in mijn stageperiode, was ik tijdens mijn promotieonderzoek niet meer de enige op het lab die aan de rode bloedcel werkte. Het ery-groepje was verrijkt met Sip en Carlo. Dear Sip and Carlo, it has been a real pleasure working with you guys on the red blood cell. It was nice to have colleagues understan-ding the why, how and what of these peculiar cells. And thank you helping me out those times that I had more work with my patient material or chemical treatment experiments than I could handle by myself.
10. Appendices - Dankwoord
188
Red blood cell homeostasis
Liebe Rike, in 2011 kwam jij als PhD student bij BIS. De afgelopen jaren bracht je niet alleen veel gezelligheid op het lab, maar was je ook een enthousiast sportmaatje en ben je een zeer goede vriendin geworden. Dankjewel dat jij mijn paranimf wil zijn!
The last years working at BIS were also a pleasure because of my other colleagues: Alokta, Cristiane, Dirk, Jenny, Joames, Joris, Jurgen, Lisanne, Lisette, Marco, Michael, Nazhat, Omar, Petra, Samuel, Sander, Theo and Wouter. Thanks for the ‘gezelligheid’ and support at work, as well as the social activities outside the lab (from pubquizes to cooking courses, and from playing paintball to nights out during the vierdaagse). Jenny en Petra, bedankt voor jullie hulp en ondersteu-ning de afgelopen jaren op het lab. Jullie jarenlange ervaring kwam goed van pas als ik ergens zelf niet uit kwam. I was also lucky to meet some new friends at the RIMLS. Julia and Silvia, although you are both (going) abroad, let’s stay in touch!
Mijn dank gaat ook uit naar alle patiënten en gezonde deelnemers die vrijwillig bloed hebben afgestaan voor mijn onderzoek.
Dear collaborators from the EMINA projects. I enjoyed the yearly meetings where we exchanged the results of our diverse projects, all with the same goal: increasing our knowledge on the pathophysiology of neuroacanthocytosis for better patient care in the future. Thank you for your inspiration and feedback.
Furthermore, I would like to thank everybody with whom I have worked with the last years in several projects. Allereerst de mensen van ‘NACEA’. Frans, Jan, Brecht, Yvonne en Věra, bedankt voor jullie hulp en feedback tijdens mijn stage. Jullie enthousiasme voor het rode bloedcel onderzoek werkte aanstekelijk en heeft er mede toe geleid dat ik aan mijn promotieonderzoek ben begonnen. Beste Wilhelm, bedankt voor onze samenwerking om de vervormbaarheid van rode bloedcel onder fysiologische omstandigheden beter in kaart te brengen. Venkat, thanks for your enthusiasm and effort in designing and optimizing our microfluidics set-up and spending countless hours with me looking at the cells floating by in the channels and analyzing the data. Max, bedankt voor de Lorca metingen die ik bij jou in Amsterdam heb mogen doen. Pierre en Alioune, thank you for teaching me how to prepare and work with the bead-sorting device. Prof. Zolla, Federica and Sara, thank you for your metabolomics measurements. Lucia and everyone from the Verona lab who helped us with the (phospho)Lyn/Syk analysis, thank you for our nice collaboration the last years.
189
Ik wil ook de studenten bedanken die ik heb mogen begeleiden en die een bijdrage hebben geleverd aan mijn onderzoek
Lieve vrienden en (schoon)familie, bedankt voor de belangstelling, afleiding en ondersteuning de afgelopen jaren.
Lieve zussen en (schoon)ouders, bedankt voor jullie steun en betrokkenheid de afgelopen jaren, en het vele oppassen op Sara de afgelopen maanden, zodat Arno en ik bezig konden zijn met de laatste loodjes van onze proefschriften. Mama en papa, bedankt voor het meelezen met de laatste onderdelen van dit proefschrift.
Lieve Sara, jij was de beste motivatie die ik me kon wensen om de laatste fase van dit proefschrift af te ronden.
Lieve Arno, het was fijn om aan het eind van de dag thuis te komen bij iemand die precies begrijpt wat promoveren inhoudt en waarmee ik alle ups-and-downs van het onderzoek kon delen. Natuurlijk ben ik je ook dankbaar voor je inhoudelijke bijdrage aan dit boekje. Het voelt dan ook niet meer dan logisch dat jij een van mijn paranimfen bent. Daarnaast ben ik blij dat we onze promoties op dezelfde dag af mogen ronden, zodat we dit hoofdstuk samen feestelijk kunnen afsluiten!
10. Appendices - Dankwoord