experimental study of in situ combustion...
TRANSCRIPT

EXPERIMENTAL STUDY OF IN SITU COMBUSTION WITH DECALIN AND
METALLIC CATALYST
A Thesis
by
DAUREN MATESHOV
Submitted to the Office of Graduate Studies of
Texas A&M University
in partial fulfillment of the requirements for the degree of
MASTER OF SCIENCE
December 2010
Major Subject: Petroleum Engineering

EXPERIMENTAL STUDY OF IN SITU COMBUSTION WITH DECALIN AND
METALLIC CATALYST
A Thesis
by
DAUREN MATESHOV
Submitted to the Office of Graduate Studies of
Texas A&M University
in partial fulfillment of the requirements for the degree of
MASTER OF SCIENCE
Approved by:
Chair of Committee, Daulat D. Mamora
Committee Members, Jerome Schubert
Yuefeng Sun
Head of Department, Stephen A. Holditch
December 2010
Major Subject: Petroleum Engineering
iii
ABSTRACT
Experimental Study of In Situ Combustion with
Decalin and Metallic Catalyst. (December 2010)
Dauren Mateshov, B.S., Kazakh-British Technical University
Chair of Advisory Committee: Dr. Daulat D. Mamora
Using a hydrogen donor and a catalyst for upgrading and increasing oil recovery
during in situ combustion is a known and proven technique. Based on research conducted
on this process, it is clear that widespread practice in industry is the usage of tetralin as a
hydrogen donor. The objective of the study is to find a cheaper hydrogen donor with
better or the same upgrading performance. Decalin (C10H18) is used in this research as a
hydrogen donor. The experiments have been carried out using field oil and water
saturations, field porosity and crushed core for porous medium.
Four in situ combustion runs were performed with Gulf of Mexico heavy oil, and
three of them were successful. The first run was a control run without any additives to
create a base for comparison. The next two runs were made with premixed decalin (5%
by oil weight) and organometallic catalyst (750 ppm). The following conditions were
kept constant during all experimental runs: air injection rate at 3.1 L/min and combustion
tube outlet pressure at 300 psig. Analysis of the performance of decalin as a hydrogen
donor in in-situ combustion included comparison of results with an experiment where
tetralin was used. Data from experiments of Palmer (Palmer-Ikuku, 2009) was used for
this purpose, where the same oil, catalyst and conditions were used.

iv
Results of experiments using decalin showed better quality of produced oil, higher
recovery factor, faster combustion front movement and higher temperatures of oxidation.
API gravity of oil in a run with decalin is higher by 4 points compared to a base run and
increased 5 points compared to original oil. Oil production increased by 7% of OOIP in
comparison with base run and was 2% higher than the experiment with tetralin. The time
required for the combustion front to reach bottom flange decreased 1.6 times compared to
the base run. The experiments showed that decalin and organometallic catalysts perform
successfully in in situ combustion, and decalin is a worthy replacement for tetralin.

v
DEDICATION
I would like to dedicate this thesis to my parents and my siblings who have
always given me strength to achieve my goals.
vi
ACKNOWLEDGEMENTS
I would like to express my gratitude and respect to my advisor, Dr. Daulat D.
Mamora, for his support and advice through studying at Texas A&M University. I would
like to thank my committee members, Dr. J. Schubert and Dr. Y. Sun, for serving on my
committee. I would also like to thank Dr. Marco Ramirez and Dr. Persi Schacht for
assistance and consultations on research.
I would also like to thank my friends and colleagues and the department’s faculty
and staff for making my time at Texas A&M University a great experience.
vii
TABLE OF CONTENTS
Page
ABSTRACT ...................................................................................................................... iii
DEDICATION .....................................................................................................................v
ACKNOWLEDGEMENTS ............................................................................................... vi
TABLE OF CONTENTS ................................................................................................. vii
LIST OF FIGURES ........................................................................................................... ix
LIST OF TABLES ............................................................................................................ xii
1 INTRODUCTION .......................................................................................................1
1.1 Overview .............................................................................................................. 1
1.2 Research objectives .............................................................................................. 5
2 LITERATURE REVIEW ............................................................................................7
3 EXPERIMENTAL APPARATUS AND PROCEDURE ..........................................12
3.1 Experimental apparatus ...................................................................................... 12
3.1.1 Gas injection system ................................................................................... 12
3.1.1.1 Nitrogen injection ................................................................................ 12
3.1.1.2 Air injection ......................................................................................... 12
3.1.2 Combustion tube ......................................................................................... 13
3.1.3 Fluid production system .............................................................................. 16
3.1.4 Gas chromatograph and wet test meter system ........................................... 25
3.1.5 Data measurement and recording system ................................................... 25
3.2 Experimental procedure ..................................................................................... 31
4 EXPERIMENTAL RESULTS ..................................................................................35
viii
Page
4.1 Overview ............................................................................................................ 35
4.2 Combustion run 1 – base run.............................................................................. 37
4.3 Combustion run 2 - decalin and catalyst ............................................................ 46
4.4 Combustion run 3 - decalin and catalyst ............................................................ 54
4.5 Comparison and discussion of results ................................................................ 62
5 SUMMARY, CONCLUSIONS, AND RECOMMENDATIONS ............................68
5.1 Summary ............................................................................................................ 68
5.2 Conclusions ........................................................................................................ 68
5.3 Recommendations .............................................................................................. 70
REFERENCES ..................................................................................................................72
VITA ..................................................................................................................................74

ix
LIST OF FIGURES
Page
Fig. 1.1 - Schematic diagram of dry, forward in-situ combustion.. .................................. 3
Fig. 3.1 - Schematic diagram of experimental apparatus.. .............................................. 14
Fig. 3.2 - Combustion tube. ............................................................................................. 17
Fig. 3.3 - Dual-thermowell assembly.. ............................................................................ 18
Fig. 3.4 - Vacuum jacket. ................................................................................................ 19
Fig. 3.5 - Thermocouple sheaths. .................................................................................... 20
Fig. 3.6 - Backpressure regulator. .................................................................................... 21
Fig. 3.7 - Two-stage separator system. ............................................................................ 22
Fig. 3.8 - Condenser unit.. ............................................................................................... 23
Fig. 3.9 - Acid scrubber and drierite columns. ................................................................ 24
Fig. 3.10 - Wet test meter. ................................................................................................. 26
Fig. 3.11 - HP 5890 Series II gas chromatograph. ............................................................ 27
Fig. 3.12 - Data logger unit and PC................................................................................... 28
Fig. 3.13 - Complete view of apparatus. ........................................................................... 29
Fig. 3.14 - Hobart A200 electric mixer.. ........................................................................... 30
Fig. 4.1 - Produced gas composition for run no. 1 (base run). ........................................ 38
Fig. 4.2 - Gas composition and temperature profile for run no. 1 (base run). ................ 38
Fig. 4.3 - Apparent H/C ratio and m-ratio for run no. 1 (base run). ................................ 39
Fig. 4.4 - Temperature profiles for run no. 1 (base run).................................................. 40
Fig. 4.5 - Combustion front velocity for run no. 1 (base run). ........................................ 41
Fig. 4.6 - Temperature profile from fixed thermocouples for run no. 1 (base run)......... 41
x
Page
Fig. 4.7 - Injection and production pressures and air flow rate for run no. 1. ................. 42
Fig. 4.8 - Cumulative fluid production for run no. 1 (base run)...................................... 44
Fig. 4.9 - Cumulative produced gas volume and produced gas rates for run no. 1. ........ 44
Fig. 4.10 - Produced oil gravity and viscosity for run no. 1 (base run). ........................... 45
Fig. 4.11 - Produced gas composition for run no. 2. ......................................................... 47
Fig. 4.12 - Apparent H/C ratio and m-ratio for run no. 2. ................................................. 47
Fig. 4.13 - Temperature profiles for run no. 2. .................................................................. 49
Fig. 4.14 - Combustion front velocity for run no. 2. ......................................................... 49
Fig. 4.15 - Temperature profile from fixed thermocouples for run no. 2. ......................... 50
Fig. 4.16 - Injection and production pressures and air flow rate for run no. 2. ................. 51
Fig. 4.17 - Cumulative fluid production for run no. 2. ...................................................... 52
Fig. 4.18 - Cumulative produced gas volume and produced gas rates for run no. 2. ........ 52
Fig. 4.19 - Produced oil gravity and viscosity for run no. 2.............................................. 53
Fig. 4.20 - Produced gas composition for run no. 3. ......................................................... 55
Fig. 4.21 - Apparent H/C ratio and m-ratio for run no. 3. ................................................. 55
Fig. 4.22 - Temperature profiles for run no. 3. .................................................................. 56
Fig. 4.23 - Combustion front velocity for run no. 3. ......................................................... 57
Fig. 4.24 - Temperature profile from fixed thermocouples for run no. 3. ......................... 58
Fig. 4.25 - Injection and production pressures and air flow rate for run no. 3. ................. 58
Fig. 4.26 - Cumulative fluid production for run no. 3. ...................................................... 59
Fig. 4.27 - Cumulative produced gas volume and produced gas rates for run no. 3. ........ 60
Fig. 4.28 - Produced oil gravity and viscosity for run no. 3.............................................. 61

xi
Page
Fig. 4.29 - Recovery factors for all runs. .......................................................................... 63
Fig. 4.30 - Recovery factors for runs with decalin and tetralin. ........................................ 63
Fig. 4.31 - Cumulative oil production for runs with decalin and tetralin. ......................... 64
Fig. 4.32 - Produced oil gravity for all runs. ..................................................................... 65
Fig. 4.33 - Combustion front temperatures for all runs. .................................................... 66

xii
LIST OF TABLES
Page
Table 4.1 - Sand pack mixture properties......................................................................... 36
Table 4.2 - Flue gas composition and properties.............................................................. 39
Table 4.3 - Flue gas composition and properties.............................................................. 46
Table 4.4 - Flue gas composition and properties.............................................................. 54
Table 4.5 - Summary of experimental result .................................................................... 67
1
1 INTRODUCTION
1.1 Overview
The focus of industry is turning to unconventional resources with increasing demand
for oil, and declining production from conventional sources. Heavy oil is part of the
unconventional resources, which also includes tight gas, coalbed methane, shales and gas
hydrates. Heavy oil promises to play a major role in the future of the oil industry and
many countries are looking for ways to increase their production from heavy oil sources,
investing in new technologies and testing them. Heavy oil and extraheavy oil make up
about 40% of the world’s total oil resources of 9-13 trillion bbl.(Alboudwarej H, 2006)
Heavy oil is specified as dark black, highly viscous liquid (greater than 1000 cp) with
low API gravity (less than 20oAPI). It has low hydrogen to carbon ratio along with a high
amount of carbon residues, asphaltenes, heavy metals and sulfur.
High viscosity creates difficulties with production, transportation and processing of
heavy oils. All these difficulties decrease profitability of production from heavy oil
reservoirs. As viscosity of crude is extremely temperature dependent, thermal recovery
methods should be implemented to produce from such reservoirs. Thermal recovery
methods are techniques where you introduce heat into a reservoir and include Hot Water
injection, Steam Flooding, Steam Assisted Gravity Drainage (SAGD), Cyclic Steam
Injection and In-Situ combustion. In steam flooding process steam is generated on
surface while in in-situ combustion it is generated inside the reservoir from combustion
and formation water. 1
The thesis follows the style of Journal of Petroleum Science and Engineering.

2
In-situ combustion is one of the first thermal Enhanced Oil Recovery (EOR)
processes developed. Laboratory experiments with combustion tube were performed in
1947. The method involves ignition in the reservoir and injection of air to support a
firefront moving to production well. Small amount of in-situ oil is burned during
combustion.
The main advantage of in-situ combustion is that the heat is created inside the
reservoir, so there is no heat loss from the wellbore. This feature makes possible in-situ
combustion in deep reservoirs where steam condenses to hot water due to wellbore heat
loss. Heat of the steam can be lost not only from the wellbore, but to overburden and
underburden of reservoir as well. This effect creates problem with steam flooding in thin
reservoirs, because most of the heat is simply conducted to bordering formation near the
injection well. So, thin reservoir makes in-situ combustion the prefered thermal EOR
method. Producing steam requires a large amount of energy, which can be saved if in situ
combustion is used where fuel for combustion is the heavy fractions of oil in the
reservoir. In-situ combustion has less environmental impact because combustion takes
place inside the reservoir and the process requires less equipment, so smaller is the
footprint on surface.
In-situ combustion however has disadvantages compared to other thermal EOR
methods. The most important of them is a safety issue. The problem is that it’s
impossible to control the process which is exaggerated by the high temperatures and
chemical reactions occurring within the reservoir and inside the wells. Combustion front
tends to move more unpredictably than steam fronts, and it is harder to get an even sweep
of the reservoir. Another problem is corrosion inside production and injection wells due

3
to high concentration of carbon dioxide in flue gas and poorly dehydrated injection gas.
Combustion process is very dependent on continuous air supply, if there is a problem
with compressors combustion front dies due to lack of air.
Dry, forward combustion is a most commonly used type of in situ combustion.
During this process air is injected into reservoir through injection well and oil formation
is ignited. Resulting combustion front moves away from injection well. The heat
generated at the combustion front propagates through the reservoir towards the
production well by conduction and convection. As the combustion front moves, the oil
viscosity is reduced, and thereby the oil production rate and recovery is increased.
Schematic diagram illustrating dry, forward combustion is given in Fig 1.1.
Fig. 1.1 - Schematic diagram of dry, forward in-situ combustion (Wu and Fulton,
1971).

4
Another type of combustion is wet combustion, where water and air are injected
simultaneously or alternately. The heat in this method is transported from the burned
zone to colder regions ahead by water. Water moving through the burned and combustion
zones absorbs heat and turn into steam during this process and starts releasing heat after
passing combustion front, where it starts condensing back into water. This method is
suitable for thin reservoirs where heat loss to the adjacent formation is significant
compared to that contained in the reservoir.
Next type of in situ combustion is reverse combustion, where combustion front
moves from production well to injection well. Combustion is initialized in production
well and combustion front moves countercurrent to the air. The oil in this method flows
through the combustion front, and since the oil bank is not formed, production decreases
with time. This method is unstable and has a high probability for spontaneous ignition
near the injector.
Another type of combustion is quite new and called Toe-to-Heel Air Injection
(THAI). One horizontal producing well and one vertical injection well is used in this
method. The reservoir is ignited in the vertical well and the combustion front moves
along horizontal part of the production well. Heated oil and with reduced viscosity drains
to production well by gravity force.
Catalysts have been used in refineries for a long time as supporting agents to upgrade
the oil in processes such as hydro-cracking and hydro-treating. The final product of these
processes is lighter oil with a higher value. Studies investigating in-situ heavy oil
upgrading by using catalysts or metallic additives showed modification of the reaction
kinetics in a favorable way: increasing temperature of combustion, greater oxygen
5
consumption, more complete oxidation and more uniform combustion. Previous works
show upgrading of heavy oil by application of thermal and catalytic hydro-cracking.
Thermal hydro-cracking results in a significant increase in API gravity of the heavy oil
produced, including an undesirable high coke formation (25 wt%), and a decreasing
content of contaminations. The catalytic hydrocracking showed not only an increase of
API gravity, but also a better product quality, because of its decreasing content of coke,
sulfur, and metal compounds (Nares et al., 2007).
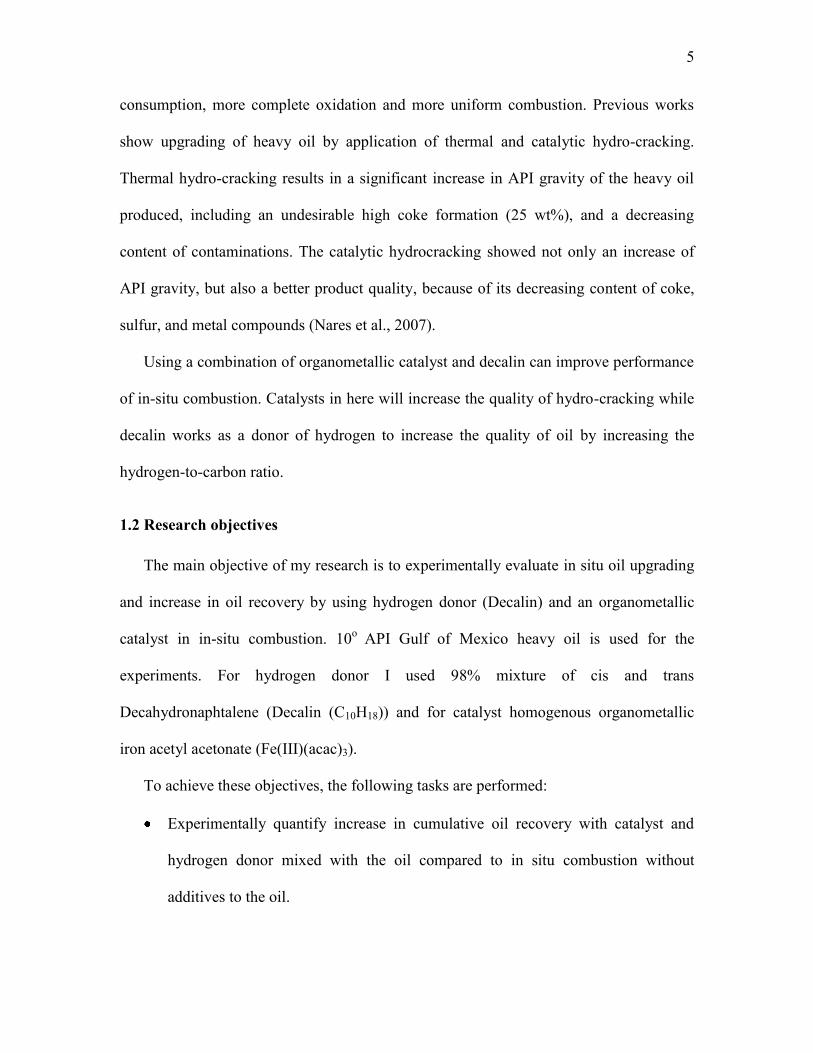
Using a combination of organometallic catalyst and decalin can improve performance
of in-situ combustion. Catalysts in here will increase the quality of hydro-cracking while
decalin works as a donor of hydrogen to increase the quality of oil by increasing the
hydrogen-to-carbon ratio.
1.2 Research objectives
The main objective of my research is to experimentally evaluate in situ oil upgrading
and increase in oil recovery by using hydrogen donor (Decalin) and an organometallic
catalyst in in-situ combustion. 10o
API Gulf of Mexico heavy oil is used for the
experiments. For hydrogen donor I used 98% mixture of cis and trans
Decahydronaphtalene (Decalin (C10H18)) and for catalyst homogenous organometallic
iron acetyl acetonate (Fe(III)(acac)3).
To achieve these objectives, the following tasks are performed:
Experimentally quantify increase in cumulative oil recovery with catalyst and
hydrogen donor mixed with the oil compared to in situ combustion without
additives to the oil.

6
Analyze influence of hydrogen donor and catalyst in upgrading of produced crude
oil by comparing densities and viscosities with that of the original oil.
To achieve research objective I have conducted the following experiments:
1. One base run (original heavy oil from Gulf of Mexico, 10o API gravity)
2. Two runs with a mixture of heavy oil, decalin and metallic catalyst
The extent of upgrading will be evaluated through various analyses of the produced
and initial crude oil. Following measurements will be included in these analyses:
Cumulative oil recovered
Produced oil API gravity
Produced oil viscosity
Flue gas composition
H-C ratio and m-ratio
Temperature profile of combustion
Combustion front velocity
Injection/production rates and pressures
All these measurements will help in analyzing effectiveness of decalin and catalyst on
in-situ upgrading and lead to appropriate conclusion.

7
2 LITERATURE REVIEW
Many experimental studies have been performed to improve the in-situ combustion
process. Adding different types of hydrogen donors and catalysts to upgrade heavy oil in-
situ have been investigated. In this section, reviews of some of these studies are
presented.
Ovalles et al. (2003) studied downhole heavy oil upgrading by using hydrogen donors
–tetralin and methane injected with steam. Natural formation was used as a catalyst in
these experiments. Experiments used Hamaca oil sands with water, tetralin and
pressurized with methane in a batch reactor. Each experiment took at least 24 hours at
280-315oC and 1600 psi pressure. Laboratory experiments showed 4
o increase in the API
gravity (from 9 to 12o) of the upgraded product, a two-fold reduction in the viscosity and
approximately 8% decrease in asphaltene content. (Ovalles et al., 2003)
Zhong et al. (2003) performed experiments on aquathermolysis of Liaohe heavy oil
which involved the addition of catalyst and hydrogen donors under steam injection
conditions. Laboratory experiments were carried out in a reactor with the Liaohe heavy
oil, distilled water, catalyst (Fe(II)) and hydrogen donor (tetralin) at different
temperatures and reaction times. It was found that experiments in which only water and
hydrogen donor were added showed approximately a 40% oil viscosity reduction.
Addition of catalyst alone lead to 60% decrease of oil viscosity compared with the
original crude oil. Combination of catalyst and hydrogen donor decreased oil viscosity
further up to 90%. Molecular weight of oil, sulfur, resin and asphaltene contents were
decreased, while H/C ratio, saturated and aromatic hydrocarbons content increased by
adding catalyst and hydrogen donor to aquathermolysis process. Field testing of the
8
process using catalyst and hydrogen donor was carried out at five wells of Liaohe field
and resulted in oil recovery improvement and oil upgrade. (Zhong et al., 2003)
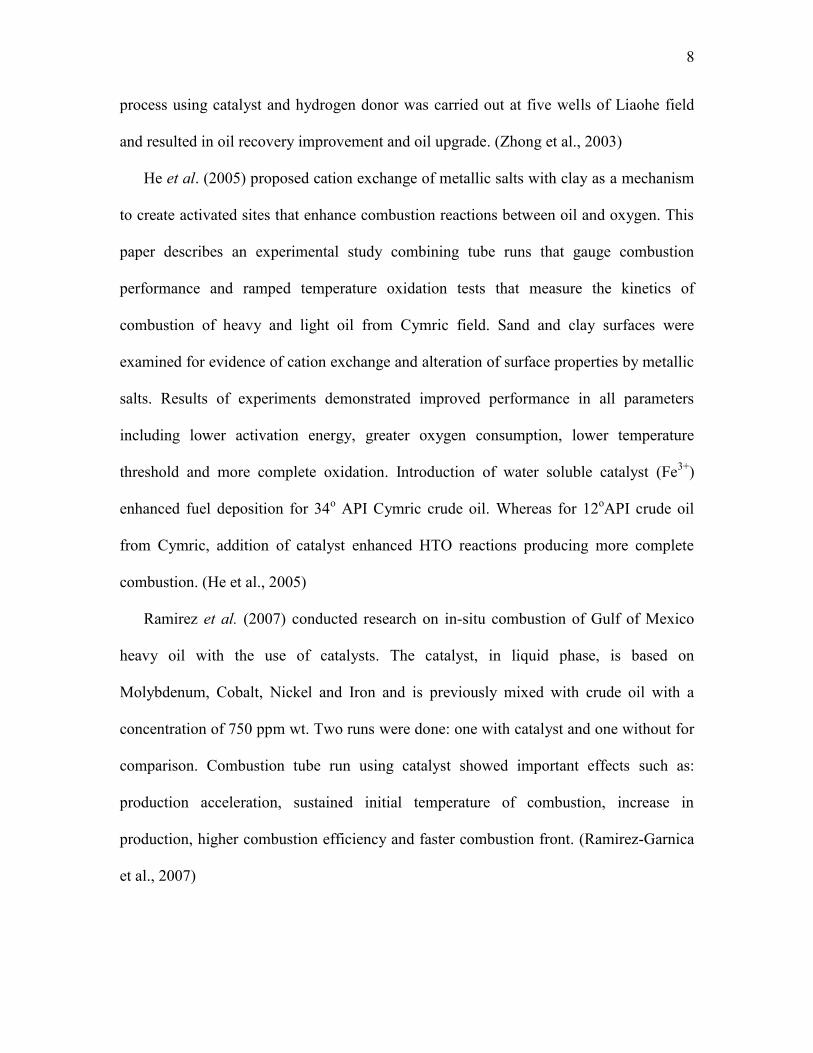
He et al. (2005) proposed cation exchange of metallic salts with clay as a mechanism
to create activated sites that enhance combustion reactions between oil and oxygen. This
paper describes an experimental study combining tube runs that gauge combustion
performance and ramped temperature oxidation tests that measure the kinetics of
combustion of heavy and light oil from Cymric field. Sand and clay surfaces were
examined for evidence of cation exchange and alteration of surface properties by metallic
salts. Results of experiments demonstrated improved performance in all parameters
including lower activation energy, greater oxygen consumption, lower temperature
threshold and more complete oxidation. Introduction of water soluble catalyst (Fe3+
)
enhanced fuel deposition for 34o API Cymric crude oil. Whereas for 12
oAPI crude oil
from Cymric, addition of catalyst enhanced HTO reactions producing more complete
combustion. (He et al., 2005)
Ramirez et al. (2007) conducted research on in-situ combustion of Gulf of Mexico
heavy oil with the use of catalysts. The catalyst, in liquid phase, is based on
Molybdenum, Cobalt, Nickel and Iron and is previously mixed with crude oil with a
concentration of 750 ppm wt. Two runs were done: one with catalyst and one without for
comparison. Combustion tube run using catalyst showed important effects such as:
production acceleration, sustained initial temperature of combustion, increase in
production, higher combustion efficiency and faster combustion front. (Ramirez-Garnica
et al., 2007)

9
Nares et al. (2007) investigated upgrading effects of metallic oxides on heavy crude
oils during thermal hydrocracking. Gulf of Mexico heavy crude oil with 12.5oAPI gravity
was used in the experiments. Experiments were carried out in a batch reactor with a
capacity of 1800 ml. Two supported catalysts were used for upgrading: MoCoP/Al2O3
and MoCoNiWP/Al2O3. Organometallic catalysts were dissolved in a hydrogen donor
(tetralin), and it was activated with the heavy oil at 543 K. This work showed upgrading
of heavy oil through thermal and catalytic hydrocracking. Strong hydrogenation
properties of tetralin reduce the high coke formation. Using a catalyst in hydrocracking
showed not only an increase in API gravity, but also better product quality due to lower
content of coke, sulfur and metal compounds. (Nares et al., 2007)
Cristofari et al. (2008) investigated applicability of cyclic solvent injection into heavy
and viscous oil followed by in-situ combustion of heavy residues. Both solvent injection
and in-situ combustion are technically effective: the solvent reduces oil viscosity in-situ
and extracts the lighter crude-oil fractions, combustion cleans the near well region and
stimulates thermally the oil production. Hamaca (Venezuela) and West Sak (Alaska)
crude oils were employed. Pentane, decane and kerosene were used as solvents. Hamaca
oil showed good burning properties, especially after pentane injection. Pentane extracted
lighter components of the crude and deposited preferentially effective fuel for
combustion. West Sak did not exhibit stable combustion properties without solvent
injection, following solvent injection and even with added metallic additives. These
experiments showed applicability of this method to the broad range of reservoirs with
properties similar to Hamaca. (Cristofari et al., 2008)

10
Ramirez et al. (2008) investigated the effect of using ionic liquid base Nickel catalyst
and tetralin on combustion of heavy oil. The objective of the research is to increase
mobility and quality of oil inside the reservoir during the combustion. The catalyst is
mixed with 12.5o API Mexican Gulf heavy crude oil with a concentration 500 ppm wt.
Triturated dolomite carbonate of 40-mesh is used as the matrix in the sandmix. Two runs
were done: one with catalyst and one without. Experiments in combustion tubes using
this Nickel ionic solution as catalyst showed important effects as follows: production
acceleration, sustained initial temperature of combustion, increase in production,
enhanced oil production, higher combustion efficiency and faster combustion front. The
authors came to the conclusion that using Nickel ionic solution catalyst at low
concentration resulted in an increase in the oil recovery factor and oil upgrade. (Ramirez-
Garnica et al., 2008)
Mohammad and Mamora (2008) conducted experiments to verify the feasibility of in-
situ upgrading of heavy crude oil by using a hydrogen donor (tetralin) and an
organometallic catalyst, Fe(CH3COCHCOCH3)3. Three cases were considered in
experiments: pure steam injection, steam injection with tetralin and steam injection with
tetralin and catalyst. The catalyst was dissolved in tetralin at a concentration of 750 ppm.
Two types of runs with steam additives were conducted: additives premixed with
sandmix and additives injected as a slug. The Jobo oil used had a 12.4o API gravity and
viscosity of 7800 cp at 30oC. Acceleration of oil production and increased oil recovery
were observed in all runs. Using tetralin alone as an additive at 5 wt% increased oil
recovery by 15%.Premixed tetralin and catalyst run showed 20% increase of oil recovery.
(Mohammad and Mamora, 2008)

11
Decalin is a hydrogen donor which has not been used in in-situ combustion. My main
research objective is to investigate the upgrading abilities of decalin with a catalyst, and
their applicability to Gulf of Mexico heavy oil.

12
3 EXPERIMENTAL APPARATUS AND PROCEDURE
3.1 Experimental apparatus
The experimental apparatus consists of five main parts: gas injection system,
combustion tube, fluid production system, gas chromatograph and wet test meter system,
and data logging system. Descriptions of each part of apparatus and procedures are given
in this section. Schematic diagram of experimental apparatus is presented in Fig 3.1.
3.1.1 Gas injection system
The gas injection system consists of two parts: nitrogen injection and air injection.
Both paths go through ¼ in. tubing and are independent of each other. They are opened
or closed to the system by valves on the control panel. The injected air or nitrogen rate is
controlled by a mass flow controller, installed before the injection pressure transducer.
The ¼ in. tubing line is reduced with Swagelok fittings to 1/8 in. tubing line, which is the
gas inlet to the combustion tube.
3.1.1.1 Nitrogen injection
Nitrogen is used to flush the system, to remove any free oxygen from it, before any
combustion run. Nitrogen is also used to pressurize the combustion tube by closing the
pressure regulator at the end of the production stream. At the end of an experiment,
nitrogen is injected into the system to kill the combustion and cool down the tube.
3.1.1.2 Air injection
Air is injected at a constant rate of 3 L/min throughout the combustion run. The
cylinder with chromatography quality air is connected to the injection system. When the
13
temperature at the igniter level reaches 570oF (300
oC) nitrogen injection is changed to air
injection at 3 L/min flow rate. Air injection will continue until the front reaches the
bottom of combustion tube. At this instance, injection is switched to nitrogen to kill the
combustion and flush the combustion tube.
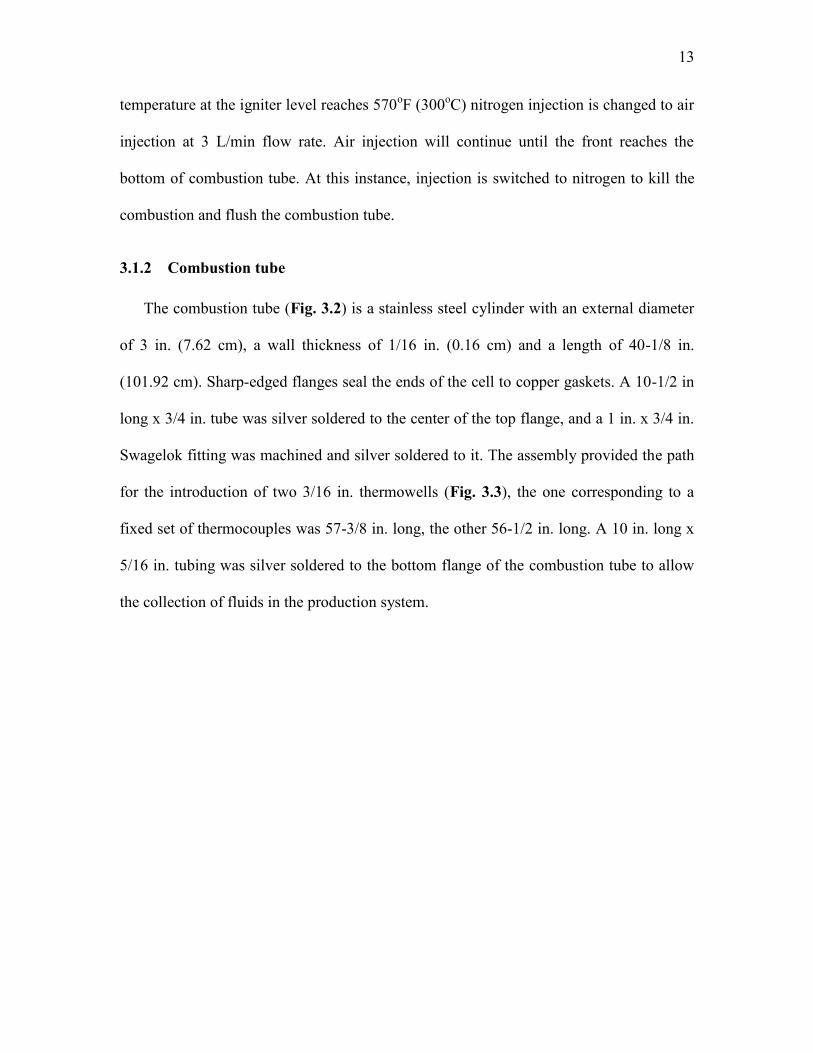
3.1.2 Combustion tube
The combustion tube (Fig. 3.2) is a stainless steel cylinder with an external diameter
of 3 in. (7.62 cm), a wall thickness of 1/16 in. (0.16 cm) and a length of 40-1/8 in.
(101.92 cm). Sharp-edged flanges seal the ends of the cell to copper gaskets. A 10-1/2 in
long x 3/4 in. tube was silver soldered to the center of the top flange, and a 1 in. x 3/4 in.
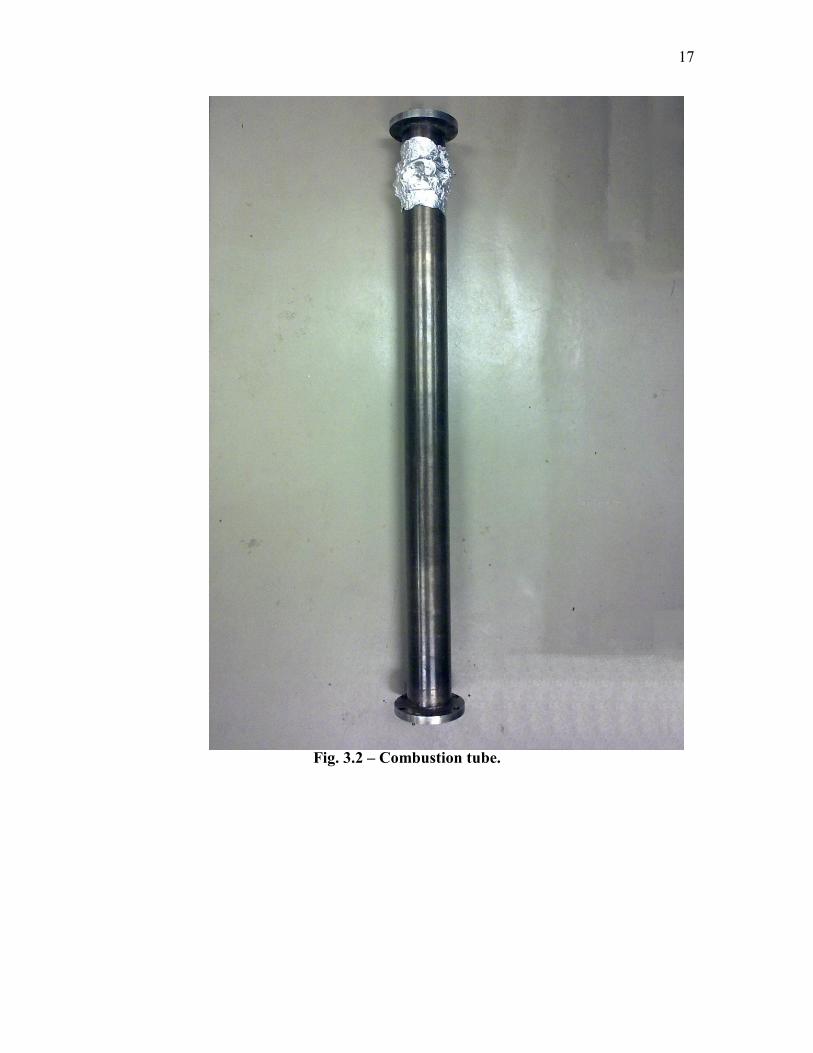
Swagelok fitting was machined and silver soldered to it. The assembly provided the path
for the introduction of two 3/16 in. thermowells (Fig. 3.3), the one corresponding to a
fixed set of thermocouples was 57-3/8 in. long, the other 56-1/2 in. long. A 10 in. long x
5/16 in. tubing was silver soldered to the bottom flange of the combustion tube to allow
the collection of fluids in the production system.

14
Fig. 3.1 – Schematic diagram of experimental apparatus.
N 2 N 2 + O 2
1
2
3 4
5
6
8 9
11
12
13
1 Air Filter 2 Mass Flow Controller 3 Injection Pressure Transducer 4 Combustion Tube Assembly 5 Separator System 6 Condenser 7 Production Pressure Transducer 8 Acid Scrubber 9 Drierite 10 Wet test meter 11 Gas Chromatograph 12 Data Logger 13 PC
Ice
7
10
12
13 N 2 Air
1
2
3 4
5
6
8 9
11
12
13
1 Air Filter 2 Mass Flow Controller 3 Injection Pressure Transducer 4 Combustion Tube Assembly 5 Separator System 6 Condenser 7 Production Pressure Transducer 8 Acid Scrubber 9 Drierite 10 Wet test meter 11 Gas Chromatograph 12 Data Logger 13 PC
Ice
7
10
12
13

15
The combustion tube is placed inside the vacuum jacket (Fig. 3.4), a 6-1/2 in. internal
diameter tube (8 in. external diameter) 46 in. long. The jacket is wrapped with electric
band heaters and covered with a one inch thick insulation. Flanges seal the ends of the
vacuum jacket to rubber o-rings. A connection installed at the top flange of the jacket
provides electric current to the resistance igniter, and drilled holes allow the insertion of
the top tubing end of the combustion cell. The bottom flange also allows the insertion of
the bottom end of the combustion cell and also provides a tubing connection for vacuum
purposes. The vacuum jacket is isolated from the combustion cell with Teflon ferrules
installed in both flange ends. The exterior of the vacuum jacket is an aluminum cover
with respective aluminum end caps. The center of the jacket is connected to a swivel that
allows it to be rotated from the horizontal to vertical position.
One set of eight fixed J-type thermocouples (spaced 14.1 cm apart) runs through the
assigned thermowell end and a set of six movable J-type thermocouples spaced 0.5 cm
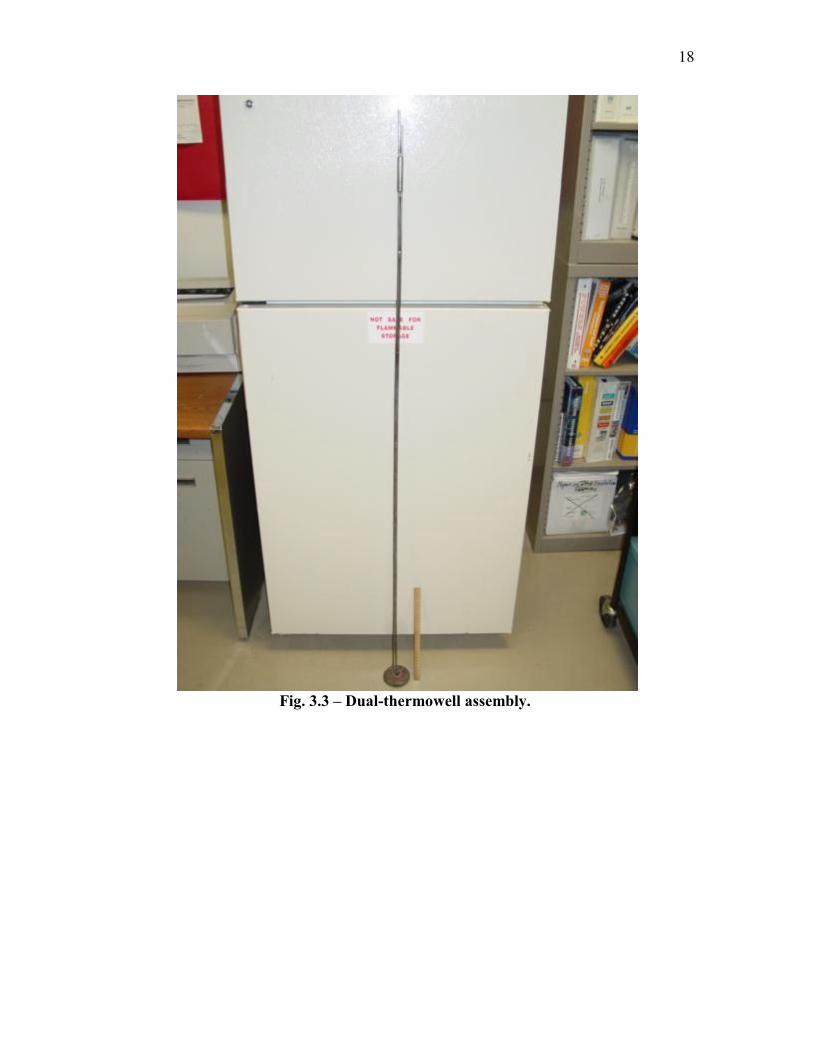
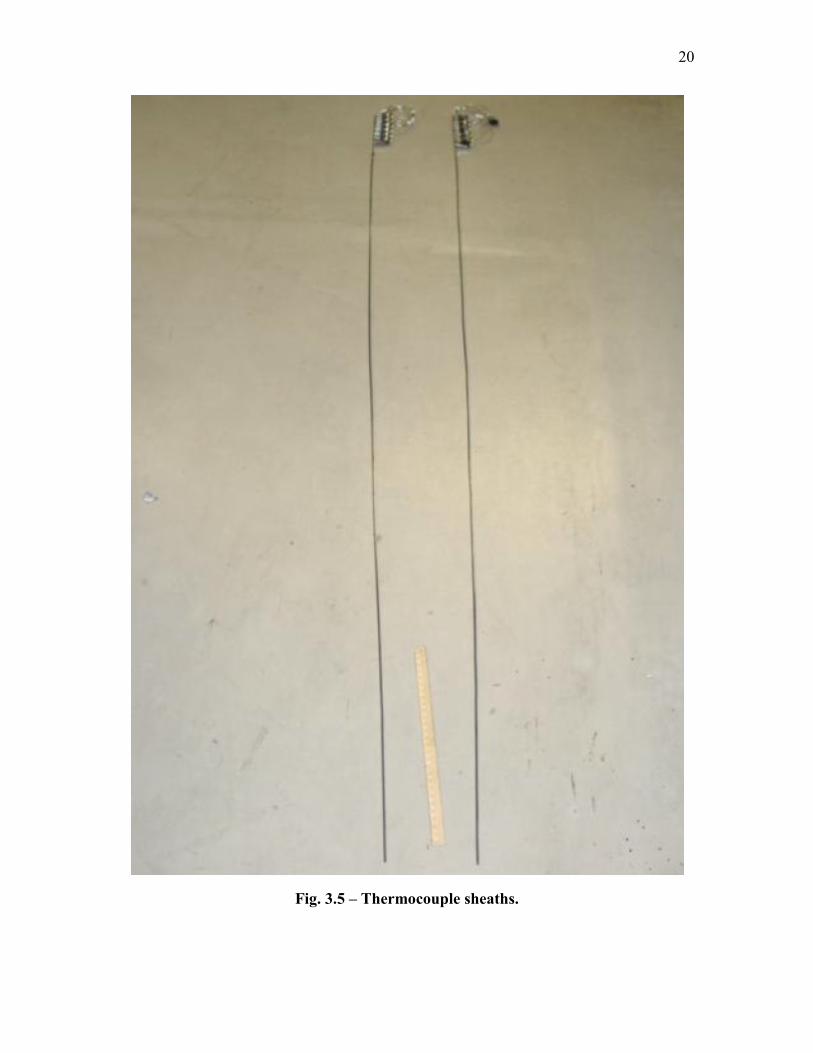
apart runs though the other end. All thermocouples used are 0.002 in. diameter. The set of
eight thermocouples was inserted inside a 1/8 in. diameter x 63-1/2 in. long thermocouple
sheath (Fig 3.5) at the following depths: 1.4, 11.0, 25.1, 53.3, 67.4, 81.5, and 95.6 cm
respectively measured from the top of the combustion tube. The other set of
thermocouples was inserted inside a 1/8 in diameter x 62-1/8 in long thermocouple sheath
(Fig 3.5). In this set the bottom thermocouple was set at 91.0 cm and the rest were spread
0.5 cm apart in a 2.5 cm length.

16
The combustion tube system is placed vertically and is secured to the production end
and to the arm of the motor of the movable thermocouple set. Each one of the
thermocouples is connected to its terminal to display or register its signal to the data
logger and/or the control panel and/or PC monitor.
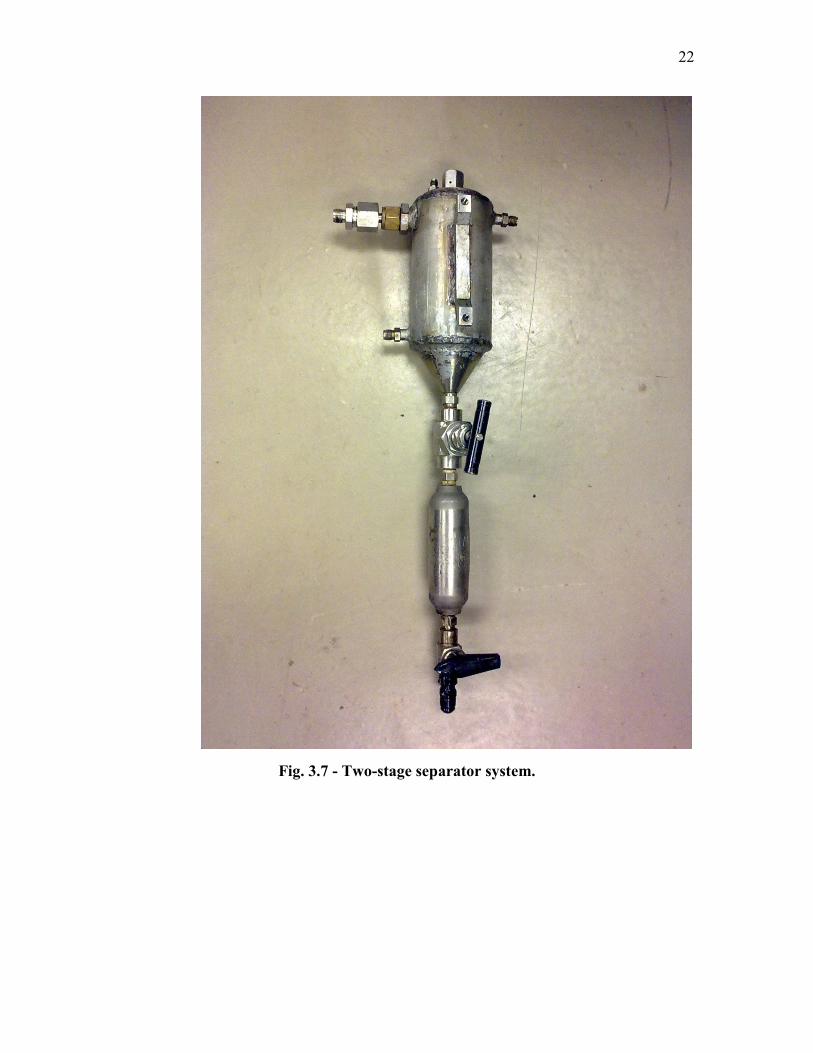
3.1.3 Fluid production system
A backpressure regulator (Fig. 3.6) maintains the outlet pressure of the combustion
tube at a constant predetermined level during the experiment. The liquids leaving the
combustion tube pass through a two-stage separator system (Fig. 3.7) where they are
collected at the production outlet. Gases pass through a condenser unit (Fig. 3.8)
containing ice to recover any volume of liquid in this stream. Gases flowing to the gas
chromatograph are scrubbed of acid, using a column of permanganate, and dehydrated,
using a column of calcium sulfite, before entering the next system (Fig. 3.9).
17
Fig. 3.2 – Combustion tube.
18
Fig. 3.3 – Dual-thermowell assembly.

19
Fig. 3.4 – Vacuum jacket.
20
Fig. 3.5 – Thermocouple sheaths.

21
Fig. 3.6 – Backpressure regulator.
22
Fig. 3.7 - Two-stage separator system.

23
Fig. 3.8 – Condenser unit.

24
Fig. 3.9 – Acid scrubber and drierite columns.

25
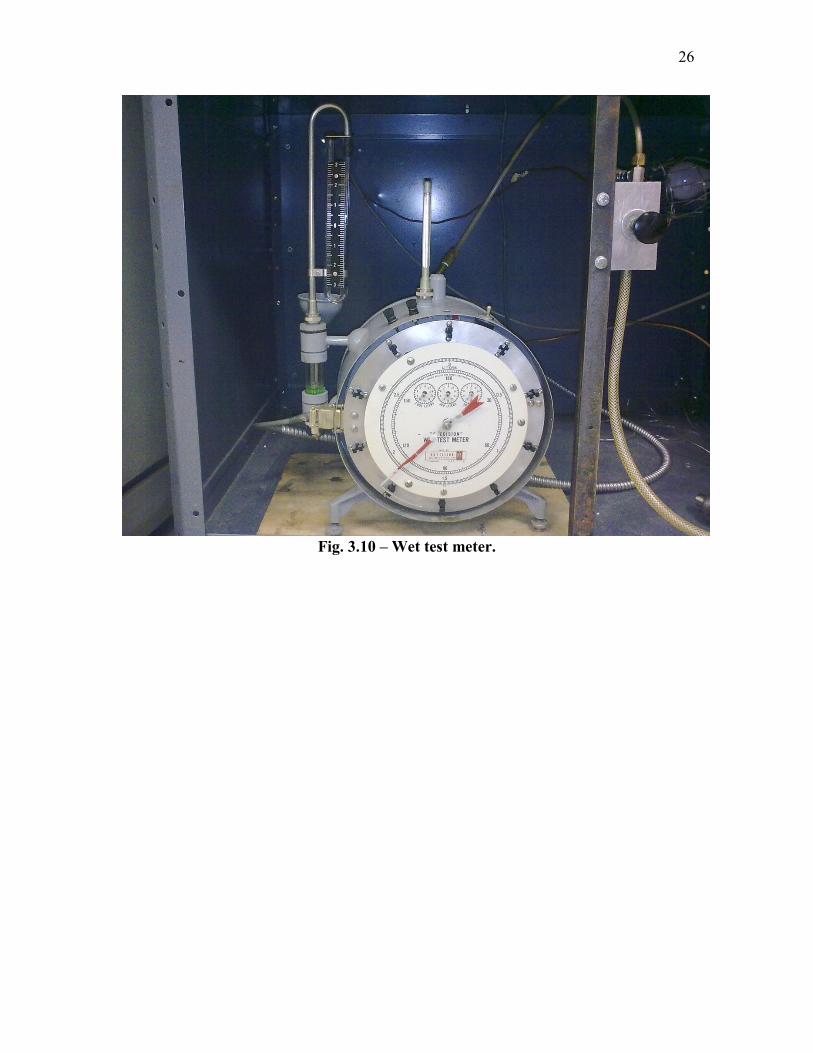
3.1.4 Gas chromatograph and wet test meter system
Scrubbed and dehydrated gas flows to the wet test meter (Fig 3.10) where the volume
of produced combustion gas is measured and recorded using the data logger/PC. A small
fraction of produced gas is injected into the HP 5890 Series II gas chromatograph (Fig.
3.11) where the gas is analyzed for carbon dioxide, oxygen, nitrogen, and carbon
monoxide about every 15 minutes. This data is registered by a HP 3966A Integrator.
3.1.5 Data measurement and recording system
Two data loggers and two personal computers (Fig. 3.12) are used to record the
following parameters: time, jacket temperatures, fixed thermocouple temperatures,
movable thermocouple temperatures, injection pressure, production pressure, depth of
bottom movable thermocouple, gas injection rate, average produced gas rate, cumulative
produced gas rate. The parameters are recorded at 30-second intervals and most of them
are displayed on the PC monitors for monitoring purposes. A complete view of the
apparatus can be seen in Fig. 3.13.
26
Fig. 3.10 – Wet test meter.

27
Fig. 3.11 – HP 5890 Series II gas chromatograph.

28
Fig. 3.12 – Data logger unit and PC.

29
Fig. 3.13 – Complete view of apparatus.

30
Fig. 3.14 – Hobart A200 electric mixer.

31
3.2 Experimental procedure
The bottom flange of the combustion tube was installed. Two 3/16 in. thermowells
connected to meshed steel screens at the bottom, to prevent sand blocking, were
introduced into the tube. After this, the top flange of the combustion tube was installed
and the flange bolts fastened. Then the weight of the combustion tube was weighed. After
this combustion tube was filled with water. The injection assembly was installed in
preparation for a pressure test of the fastenings at the bottom flange. The cell was
pressure tested for leaks at 300 psig for about 20 mins. Once the pressure test was
successfully completed, the pressure in the combustion tube was allowed to drop to
atmospheric. After draining out the water, the top flange was removed and combustion
tube is dried by injecting air.
A mixture of decalin, ferric acetyllaacetonate and n-butanol was prepared to be
premixed with 10o API Mexican Gulf heavy crude oil. Next, a mixture of carbonate rock,
water and oil was made in a large mixing bowl. About 7780 g. of 40 mesh carbonate and
180 g. of water were mixed in an electric mixer until the mixture was evenly moist. The
Hobart A200 electric mixer (Fig. 3.14) is used. Then 1315 g. of oil premixed with decalin
(5% concentration by oil weight) and iron catalyst (750 ppm) were added and mixed
thoroughly to obtain a uniform mixture. The final mixture was weighted to determine the
loss due to mixing.
After this, portions of about 200 g. of mixture were introduced into the tube once the
combustion tube was safely fastened in a vertical position. A heavy metal plunger that
passed over the thermowells was used to tamp the sample into the tube. The process of
adding sample and tamping was repeated until the tube was filled to about 10 cm from

32
the top. Top flange was installed again and the weight of the combustion tube filled with
mixture was weighed and compared to the weight of the empty tube earlier measured to
determine the amount of mixture in the combustion tube. Top flange was uninstalled
again and about 5 ml of linseed oil was placed on the top of the sample to accelerate
ignition. The combustion tube was then filled to the top with clean 100-mesh sand. The
pure sand acts as an air diffuser for uniform air injection into the sandmix.
The top flange of the combustion tube was installed and the flange bolts fastened. A
pressure test was performed on tamping site to check the fastening on top flange. The
injection assembly was carefully installed, passing through the thermowells, and Teflon
ferrules passed through them and tightened. Nitrogen was introduced at the injection inlet
and with the outlet of the combustion tube plugged, the cell was pressure tested for leaks
at 350 psig for 20 minutes. Once the pressure test was performed successfully, the outlet
plug of the combustion cell was slowly opened and the pressure in the tube is released.
The injection assembly was dismantled and an electric igniter was placed and tightened at
the exterior of the combustion tube at the same depth where the linseed oil was placed.
The bottom flange of the combustion tube was wrapped with insulation. The tube was
then placed carefully inside the vacuum jacket which was tilted to about 30º from the
horizontal to allow better handling of the combustion tube. The electric igniter was
connected to the ignition terminals of the top flange of the vacuum jacket and the latter
was tightened. Teflon ferrules were tightened to the outlet and injection assembly to seal
the vacuum jacket from the combustion tube. The injection assembly was replaced in its
position and combustion tube was pressure tested to check connection of injection
assembly and ferrules of thermowells. Then the fixed and movable thermocouple sheaths
33
were inserted in their respective thermowells. The vacuum jacket was placed in a vertical
position and the outlet of the combustion tube fastened to the production section. The
movable thermocouple sheath was fixed to the motor arm and all thermocouples were
connected to their terminals. The vacuum jacket was tested for thirty minutes with a
vacuum of about -28 inches Hg. The injection line was connected to the assembly, and
the vacuum jacket heater was set to about 122ºF (50ºC) and left overnight to allow the
temperature of the sandmix to stabilize. A band heater set at 30oC was wrapped around
the separator so as to ensure unobstructed flow of produced oil through the separator into
the sample bottles.
Prior to the beginning of the experimental run, the mass flow controller was
calibrated to the injection rate, the gas chromatograph was also calibrated, the bottom of
the movable thermocouple sheath was raised to the linseed oil depth, and the sandpack
was pressurized with nitrogen to 300 psig. Electric current was gradually introduced into
the igniter using a variable power transformer. Approximately 60 minutes later, the
temperature in the combustion tube at the igniter level (movable thermowell placed at the
linseed oil depth) reached about 570ºF (300ºC) and air injection was initiated at 3 L/min.
The backpressure regulator was adjusted to maintain a tube outlet pressure of 300 psig.
The movable thermocouple reading in the instruments panel and PC activated to record
data was observed to increase rapidly to about 986ºF (530ºC), a clear indication that
ignition occurred inside the combustion tube. Combustion gas composition was measured
about every 15 minutes; temperature profiles approximately every 2 in. (5 cm), and
production liquids every 10-15 minutes. Accurate readings of temperature profiles were
taken with the set of six movable thermocouples, spaced 0.5 cm from each other, which

34
allowed the recording of 6 entries just behind and ahead of the combustion front. These
entries were made by pressing the enter key on the PC component of the data logger.
Liquids were collected in graduated sample bottles which were capped for subsequent
analysis. The end of the combustion run occurred when no oil production was attained, in
other words, the sandpack was burned to the bottom flange of the combustion tube.
Combustion runs varied between 6-10 hours.

35
4 EXPERIMENTAL RESULTS
4.1 Overview
For all the runs conducted in this research several experimental parameters were kept
constant to allow for a valid comparison between runs. Parameters kept constant for all
runs were:
Initial cell temperature: 50oC
Air injection rate: 3 SL/min
Production pressure: 300 psi
Rock, water and oil weights in the sandmix were kept as constant as possible to have
the same oil, water and gas saturations for a mixture. Consistent mixing and tamping
process help ensure the porosity of sandmix is the same for all runs. The properties of the
mixture inside the combustion tube are shown in Table 4.1.
In this section I will analyze each run and report summaries of them separately as a
section. Comparison between all these cases will be given as a review at the end of the
section. Runs that will be discussed are as follows:
Run 1: Combustion of Gulf of Mexico original heavy crude oil.
Run 2: Combustion of Gulf of Mexico heavy crude oil with decalin and iron catalyst.
Run 2: Combustion of Gulf of Mexico heavy crude oil with decalin and iron catalyst.

36
Table 4.1 – Sand pack mixture properties.
Run 1 Run 2 Run 3
Weight of mixture, g 7471 7072.51 7090
Sand, g 6266.5 5932.26 5946.93
Water, g 147.12 139.28 139.62
Oil, g 1057.37 1000.97 1003.44
So, % 61.35 54.3 54.59
Sw, % 8.52 7.54 7.58
Sg, % 30.12 38.15 37.82
Φ, % 43.36 46.38 46.25
For each run I calculated the apparent hydrogen-carbon (H/C) ratio and m-ratio from
analysis of composition of the effluent gas. If CO2 and CO are the mole percent of carbon
dioxide and carbon monoxide, respectively, in the produced gas, the m-ratio is given by
Eq. 1 (Mamora and Brigham, 1995).
(1)
If O2p and N2 represent the mole percent of oxygen and nitrogen in the effluent gas,
then the mole percent of consumed oxygen, O2c, can be calculated from a nitrogen
material balance and is given in Eq. 2.
(2)
Based on oxygen material balance, and using Eq. 2, the apparent atomic H/C ratio is
calculated (Mamora and Brigham, 1995):
(3)
It is called apparent because calculated values are not directly measured but inferred
from stochimetry. It was assumed that all of the oxygen disappearance in combustion gas
is due to production of water. This is not always the case; at low temperatures (lower than
345oC) oxygen combines with the residuum as additional reactions.

37
4.2 Combustion run 1 – base run
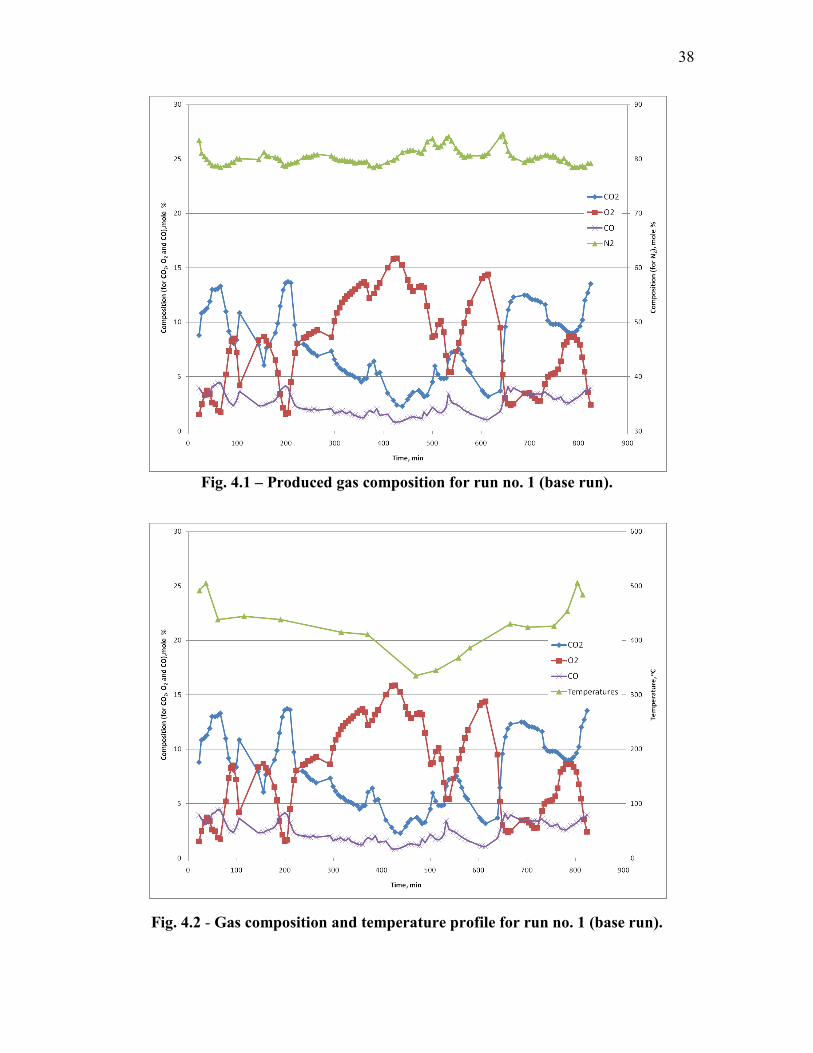
From gas compositions graph (Fig 4.1) we can see that composition of flue gas is
very inconsistent. In some parts we produce more oxygen than carbon dioxide. For some
reason we don’t have proper combustion. It can be that channeling was created in this
segment and injected air was not used for combustion, and bypassing the flame went
directly to bottom flange. So I constructed a graph with compositions of oxygen and
carbon dioxide on y-axis, and temperatures of combustion front on given time versus
time on the secondary y-axis (Fig 4.2). This graph can help understand dependence
between temperature and flue gas composition. Fig 4.2 shows the temperature is minimal
at 470 minutes and is at about 330oC while the oxygen concentration reaches a maximum
of about 15%. This indicates the development of low temperature oxidation (LTO).
Unlike combustion which produces CO2, CO, and H2O as its primary reaction products,
LTO yields water and oxygenated hydrocarbons, such as carboxylic acids, aldehydes,
ketones, alcohols, and hydroperoxides. The resulting oxygenated oils can have
significantly higher viscosities, lower volatilities, and lower gravities than the virgin oils.
Compositionally, LTO has been found to increase the asphaltene content of the oil and to
decrease its aromatic and resin contents. The mechanisms of LTO are extremely
complex, but condensation to higher-molecular-weight material has been proposed by
several researchers. (Fassihi et al., 1990)
38
Fig. 4.1 – Produced gas composition for run no. 1 (base run).
Fig. 4.2 - Gas composition and temperature profile for run no. 1 (base run).
39
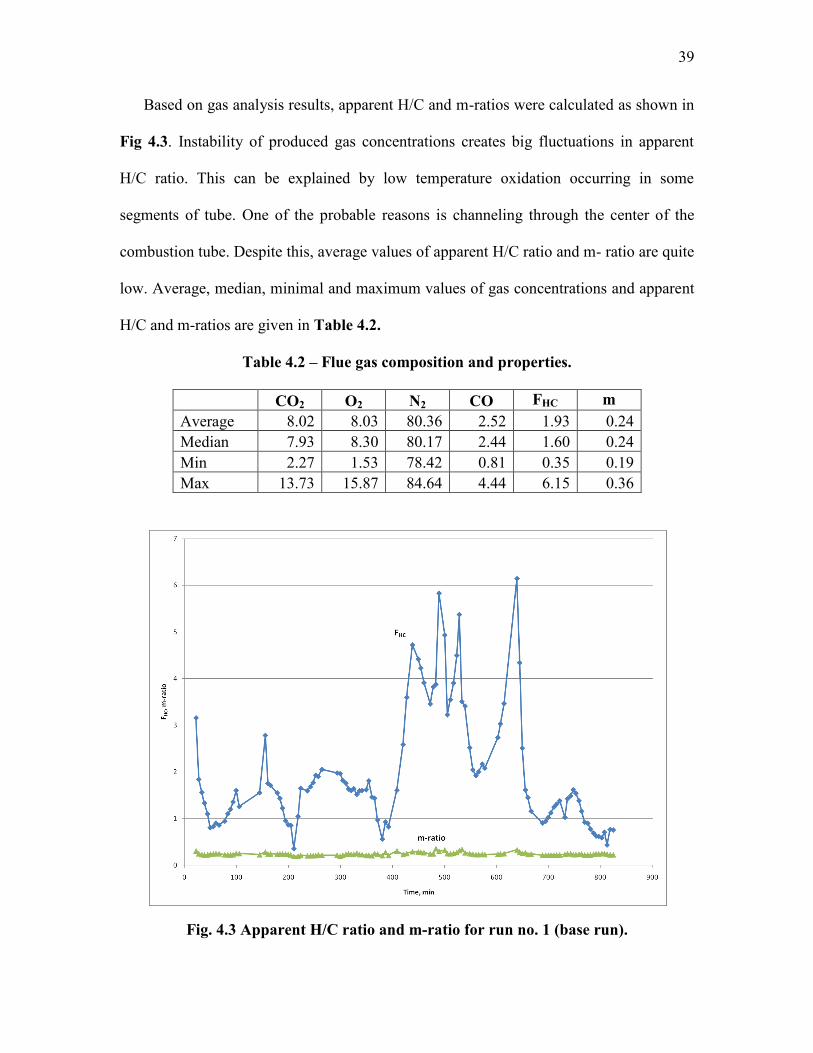
Based on gas analysis results, apparent H/C and m-ratios were calculated as shown in
Fig 4.3. Instability of produced gas concentrations creates big fluctuations in apparent
H/C ratio. This can be explained by low temperature oxidation occurring in some
segments of tube. One of the probable reasons is channeling through the center of the
combustion tube. Despite this, average values of apparent H/C ratio and m- ratio are quite
low. Average, median, minimal and maximum values of gas concentrations and apparent
H/C and m-ratios are given in Table 4.2.
Table 4.2 – Flue gas composition and properties.
CO2 O2 N2 CO FHC m
Average 8.02 8.03 80.36 2.52 1.93 0.24
Median 7.93 8.30 80.17 2.44 1.60 0.24
Min 2.27 1.53 78.42 0.81 0.35 0.19
Max 13.73 15.87 84.64 4.44 6.15 0.36
Fig. 4.3 Apparent H/C ratio and m-ratio for run no. 1 (base run).

40
Temperature profile of the combustion run is given in Fig 4.4. Temperatures of
combustion front are not stable and vary from 506oC to 335
oC. The reason for this
temperature drop was described earlier. The average temperature of the combustion front
is 430oC. The movement of the combustion front and its velocity is indicated in Fig 4.5.
Velocity of combustion is not uniform, and changes with time. The average combustion
front velocity is about 0.1 cm/min. This number is calculated from added trendline, and is
quite low. In Fig 4.6 I constructed temperature profile of combustion from data of fixed
thermocouples. As you can see this graph confirms my assumption that there was a
problem with combustion at certain time frame. An ideal case temperature should rise
without plateaus or declines as we can see it on second and third points.
Fig. 4.4 – Temperature profiles for run no. 1 (base run).

41
Fig. 4.5 – Combustion front velocity for run no. 1 (base run).
Fig. 4.6 – Temperature profile from fixed thermocouples for run no. 1 (base run).

42
Air injection rate, production and injection pressures versus time graph is built and
presented in Fig 4.7. Air injection rate is almost constant through all the time of
combustion and is about 3.1 L/min. Injection pressure increases up to 350 psi and drops
slowly to normal ranges of about 300 psi. I think that it caused by oil bank that is created
on the top layers of the tube. This oil bank got stuck in the layers before combustion front
and limited air flow. This oil bank could also be the reason for the slow combustion front
velocity. Difference of pressures comes to normal range at about 500 min, and exactly at
the same time temperature of combustion front starts increasing (Fig 4.4 and Fig. 4.6).
Average injection and production temperatures are 316 psi and 296 psi respectively.
Fig. 4.7 – Injection and production pressures and air flow rate for run no. 1.

43
Water saturation for this run was only 12%. This amount of water is too low and part
of it was withdrawn with flue gas. Remaining part of it created emulsion with oil and
couldn’t be separated. Therefore it was not possible to measure exact volume of produced
oil and gas. Produced liquid weights were measured and presented as a graph in Fig 4.8.
Cumulative volume of produced liquid is 972 g which is 81% of original fluid in place.
Original fluid in place here is a volume of oil and water together inside the combustion
tube. Cumulative volume of produced gas and its average rate versus time graph is shown
in Fig 4.9. Average rate of produced gas is 2.7 L/min which is lower than the injection
rate. This difference is created due to gas losses from separator while producing oil.
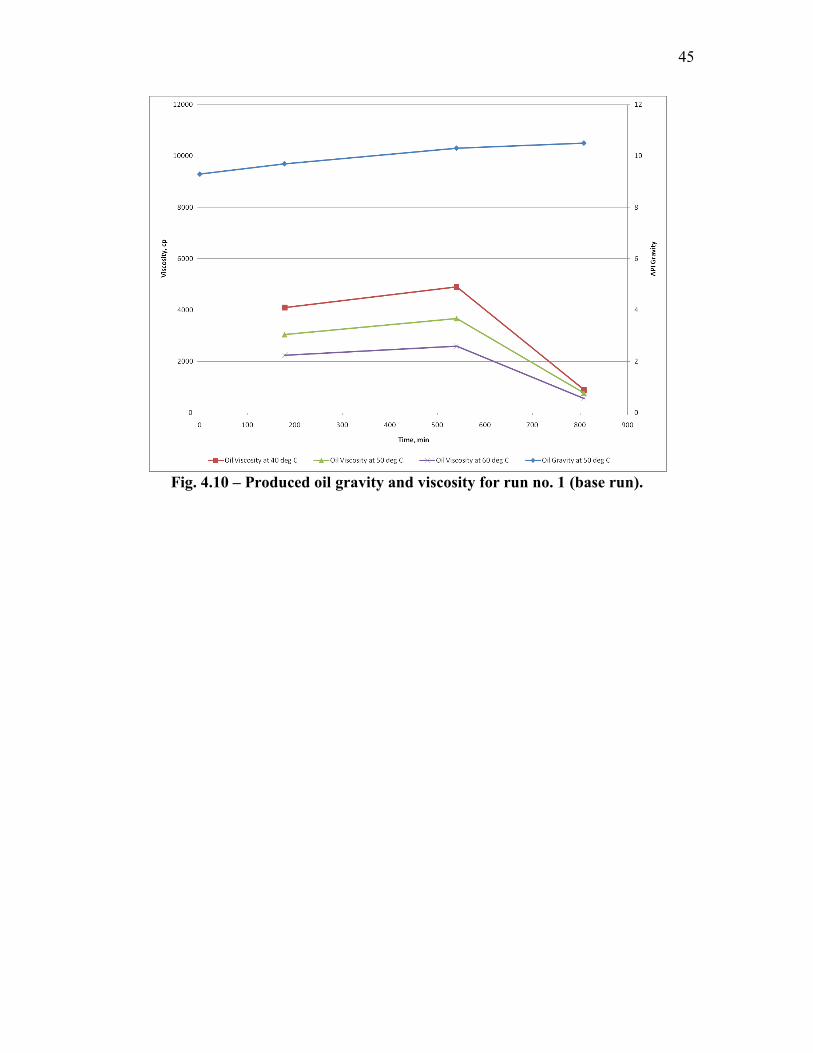
The densitometer was set at 50oC to enable the oil samples to be introduced into the
instrument. Oil gravity was measured, while oil viscosity was measured at three different
temperatures: 40oC, 50
oC and 60
oC. Produced oil gravity at the end of the run was
1.3oAPI higher than that in the original crude oil (Fig 4.10). The viscosity of the
produced oil is calculated and constructed as a chart. As you can see from the graph
viscosities are different for different temperatures. It also varies depending on time when
oil samples were taken. There is a tendency that oil viscosities are higher in second point
in comparison with other two points. In the last point we have the lowest viscosities as
well as the highest oil gravity. The results indicate oil fractions distilled off at the
combustion front, travel to and condense ahead.

44
Fig. 4.8 – Cumulative fluid production for run no. 1 (base run).
Fig. 4.9 – Cumulative produced gas volume and produced gas rates for run no. 1.
45
Fig. 4.10 – Produced oil gravity and viscosity for run no. 1 (base run).

46
4.3 Combustion run 2 - decalin and catalyst
Produced flue gas composition versus time graph is constructed and presented in Fig
4.11. As we can see from the chart, concentrations of oxygen and carbon dioxide
fluctuate a lot. In one of the sections we produce more oxygen than carbon dioxide. The
reason for this is probably due to air channeling which is created in the zone near to front
and further. A portion of air is not used for combustion and bypasses the flame. The
concentration of carbon monoxide decreases at the same time. Apparent H/C ratio and m-
ratio versus time graph is shown in Fig 4.12. Apparent H/C ratio is more constant in
comparison with base run which shows improvement of process. If we look at apparent
H/C curve, we can see it increases rapidly at the same time (between 200 min and 300
min). The higher the apparent H/C ratio, the lower the oxidation temperature which leads
to incomplete combustion. But overall image of combustion is fine, because apparent
H/C is mostly less than 1. And average value of it is 1.14 which is way lower than base
run without additives. From data of these two graphs we can clearly see that oxidation in
this run is much more efficient compared to the first run. Average, median, minimum and
maximum values of gas concentrations and apparent H/C and m-ratios are given in Table
4.3.
Table 4.3 - Flue gas composition and properties.
CO2 O2 N2 CO FHC m
Average 11.11 4.75 78.97 3.36 1.14 0.23
Median 12.11 3.51 78.95 3.66 1.00 0.23
Min 4.95 1.12 76.56 1.51 0.14 0.21
Max 15.47 12.27 82.32 4.40 3.25 0.28

47
Fig. 4.11 – Produced gas composition for run no. 2.
Fig. 4.12 Apparent H/C ratio and m-ratio for run no. 2.
48
Temperature profile of the combustion run is presented in Fig 4.13. Combustion front
temperatures are quiet uniform and mostly higher than 500oC. The average temperature
of combustion front is 508oC. Improvement of temperature profile of combustion
compared to first run is noticeable. One thing we really try to avoid in in-situ combustion
is low temperature oxidation. LTO causes condensation reactions, which results in longer
hydrocarbon chains and higher viscosity of oil. Catalyst brings to lower the activation
energy which is required for combustion.
The movement of the combustion front and its velocity are shown in Fig 4.14.
Velocity of the combustion is not uniform, and changes with time. Combustion front
movement can be divided into three phases. In the first phase, the first 42 cm of the tube
is considered where the average velocity of combustion front was 0.2 cm/min. Next
phase is a segment between 52 cm and 56 cm where velocity of front is 0.04 cm/min.
Combustion front recovers its initial velocity and next 34 cm goes at average velocity of
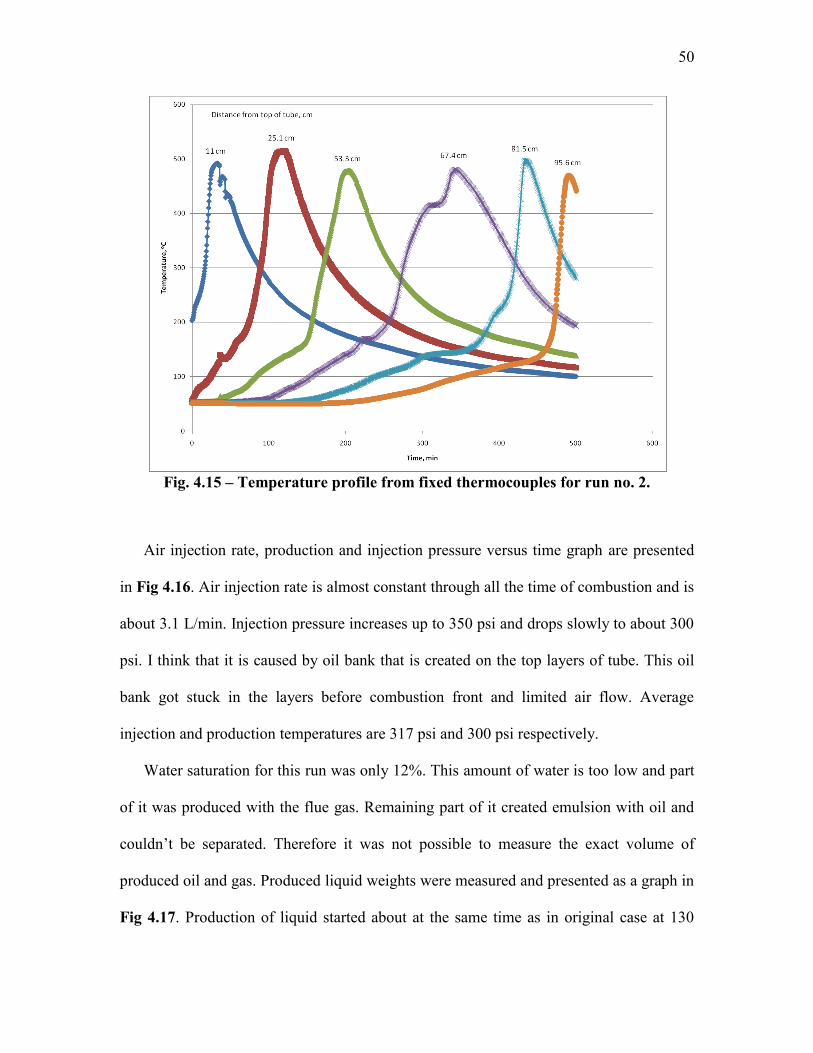
0.22 cm/min. I put the temperature profile of combustion from data of fixed
thermocouples in Fig 4.15. From this graph we can see that at 300 min there is a plateau
where temperature stopped increasing. It happened at the same time when combustion
got stuck in the graph of combustion front velocity. There are two possible reasons for it.
First, an oil bank was formed in this area which did not move further. It took time to burn
all this deposition. Second possible reason is that most part of the oil moved through a
channel to the bottom flange without assisting combustion.

49
Fig. 4.13 – Temperature profiles for run no. 2.
Fig. 4.14 – Combustion front velocity for run no. 2.
50
Fig. 4.15 – Temperature profile from fixed thermocouples for run no. 2.
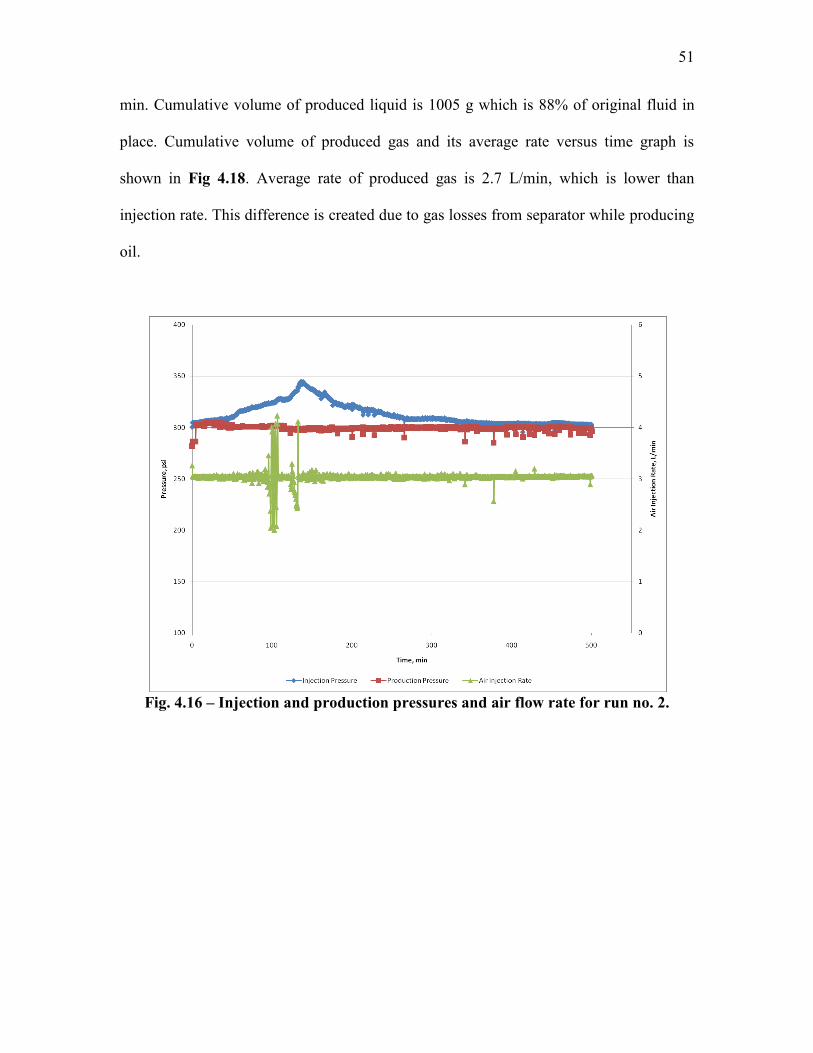
Air injection rate, production and injection pressure versus time graph are presented
in Fig 4.16. Air injection rate is almost constant through all the time of combustion and is
about 3.1 L/min. Injection pressure increases up to 350 psi and drops slowly to about 300
psi. I think that it is caused by oil bank that is created on the top layers of tube. This oil
bank got stuck in the layers before combustion front and limited air flow. Average
injection and production temperatures are 317 psi and 300 psi respectively.
Water saturation for this run was only 12%. This amount of water is too low and part
of it was produced with the flue gas. Remaining part of it created emulsion with oil and
couldn’t be separated. Therefore it was not possible to measure the exact volume of
produced oil and gas. Produced liquid weights were measured and presented as a graph in
Fig 4.17. Production of liquid started about at the same time as in original case at 130
51
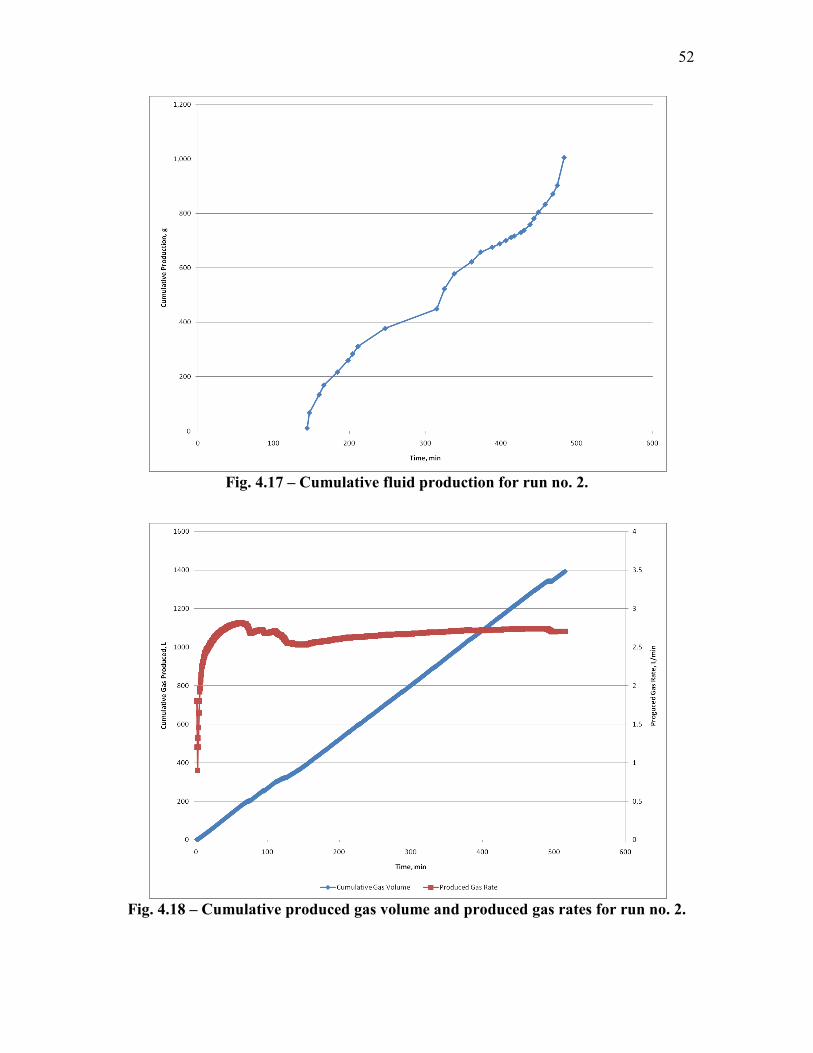
min. Cumulative volume of produced liquid is 1005 g which is 88% of original fluid in
place. Cumulative volume of produced gas and its average rate versus time graph is
shown in Fig 4.18. Average rate of produced gas is 2.7 L/min, which is lower than
injection rate. This difference is created due to gas losses from separator while producing
oil.
Fig. 4.16 – Injection and production pressures and air flow rate for run no. 2.
52
Fig. 4.17 – Cumulative fluid production for run no. 2.
Fig. 4.18 – Cumulative produced gas volume and produced gas rates for run no. 2.

53
The densitometer was set at 50oC to enable the oil samples to be introduced into the
instrument. Oil gravity was measured, while oil viscosity was measured at three different
temperatures: 40oC, 50
oC and 60
oC. Produced oil gravity at the end of run was 3.2
oAPI
higher than at the original crude (Fig 4.19). The viscosity of the produced oil decreased
compared to the base run. The graph of viscosities also changed its shape, and viscosity
of second point is lower than first one now. Decrease of viscosity and increase of gravity
occurs due to upgrading of oil during combustion. Light hydrocarbon content increase
because of cracking and hydrogen supplied by decalin.
This run took only 480 min, which is great improvement in comparison with previous
run. It is almost two times faster, and gives better results in recovery of hydrocarbons and
in upgrading of oil.
Fig. 4.19 – Produced oil gravity and viscosity for run no. 2.

54
4.4 Combustion run 3 - decalin and catalyst
Stable composition of produced flue gases is observed during the run as shown in Fig
4.20. Average concentration of oxygen is 2.3%. Fig 4.21 I presents apparent H/C ratio
and m-ratio versus time graph. Apparent H/C ratio is more constant in comparison with
two previous runs which show improvement in combustion. Apparent H/C ratio is much
lower even in comparison with the second experiment. This result indicates the absence
of low temperature oxidation and the predominance of distillation as the fuel deposition
mechanism. The average value of the ratio is 0.69 and maximum value is 1.55. And
average value of it is 1.14 which is lower than the base run without additives. The m-ratio
is constant and has an average value of 0.22. From data of these two graphs we can
clearly see that oxidation in this run is much more efficient compared to the first two
runs. Average, median, minimum and maximum values of gas concentrations and
apparent H/C and m-ratios are given in Table 4.4.
Table 4.4 - Flue gas composition and properties.
CO2 O2 N2 CO FHC m
Average 14.20 2.27 79.79 3.91 0.69 0.22
Median 14.46 1.69 79.93 4.06 0.69 0.22
Min 9.84 0.81 77.09 2.61 0.04 0.18
Max 17.42 6.95 82.11 4.74 1.55 0.25

55
Fig. 4.20 – Produced gas composition for run no. 3.
Fig. 4.21 Apparent H/C ratio and m-ratio for run no. 3.

56
From the temperature profile (Fig 4.22) we notice that temperatures of this
combustion are markedly higher than in the previous two runs. Combustion front
temperatures go as high as 635oC and the average temperature of combustion front is
563oC which excludes the existence of LTO. One thing we really try to avoid in in-situ
combustion is low temperature oxidation. LTO causes condensation reactions, which
results in longer hydrocarbon chains and higher viscosity of oil. Catalyst brings to lower
activation energy required for combustion.
Fig. 4.22 – Temperature profiles for run no. 3.
Combustion front velocity and its movement are indicated in Fig 4.23. The movement
of combustion is stable and has a uniform velocity unlike the previous two experiments.
The combustion front velocity is 0.16 cm/min. The temperature profile of combustion
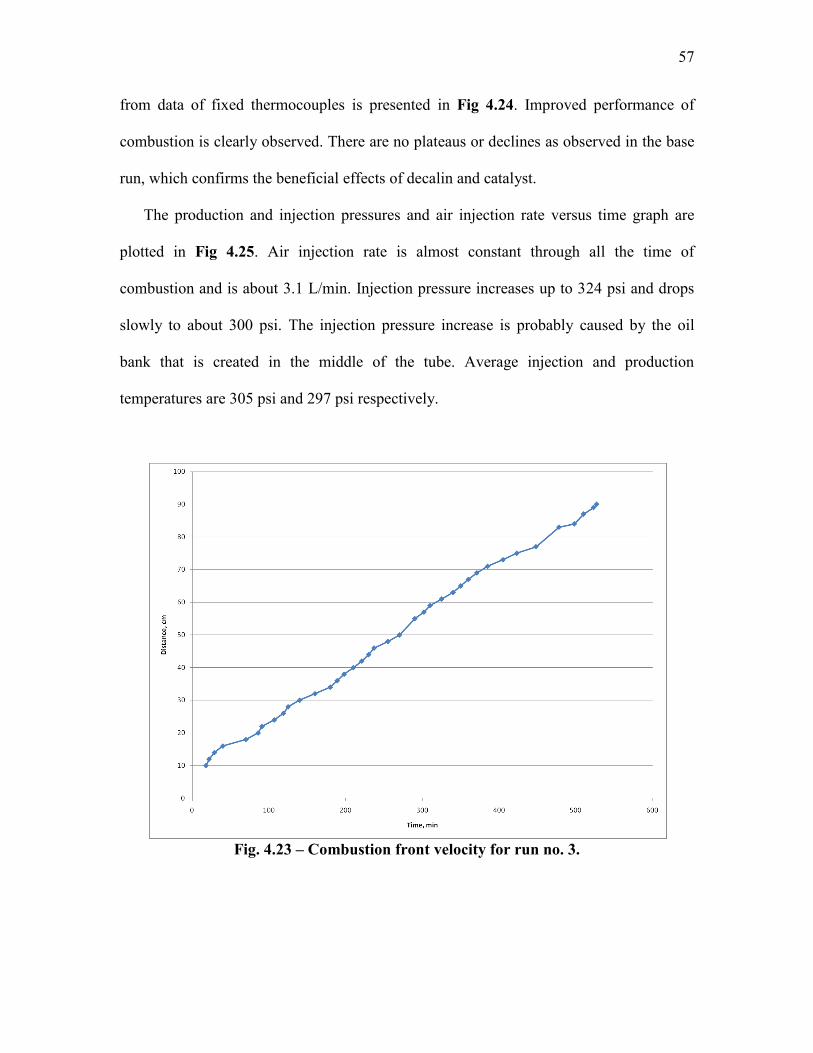
57
from data of fixed thermocouples is presented in Fig 4.24. Improved performance of
combustion is clearly observed. There are no plateaus or declines as observed in the base
run, which confirms the beneficial effects of decalin and catalyst.
The production and injection pressures and air injection rate versus time graph are
plotted in Fig 4.25. Air injection rate is almost constant through all the time of
combustion and is about 3.1 L/min. Injection pressure increases up to 324 psi and drops
slowly to about 300 psi. The injection pressure increase is probably caused by the oil
bank that is created in the middle of the tube. Average injection and production
temperatures are 305 psi and 297 psi respectively.
Fig. 4.23 – Combustion front velocity for run no. 3.

58
Fig. 4.24 – Temperature profile from fixed thermocouples for run no. 3.
Fig. 4.25 – Injection and production pressures and air flow rate for run no. 3.

59
Water saturation for this run was only 12%. This amount of water is quite low and
part of it was produced with the flue gas. Remaining part of it created emulsion with oil
and couldn’t be separated. Therefore produced liquid weights were measured and
presented as a graph in Fig 4.26. Production started at 180 min which is late in
comparison with the previous two runs. If we do not consider the base run, we can see
analogy in the two last runs. In both of them production started when combustion front
was at 35 cm from the top flange. Due to differences in velocities production times were
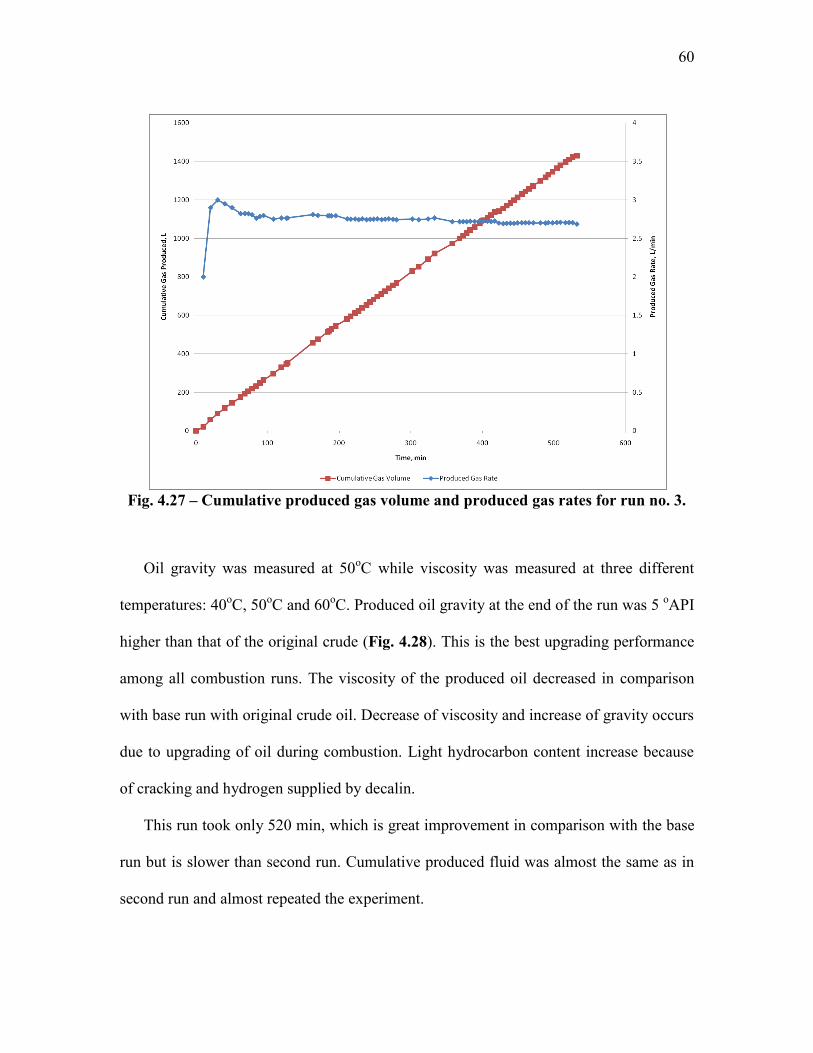
different. Cumulative volume of produced liquid is 1002 g which is 88% of original fluid
in place. Cumulative volume of produced gas and its average rate versus time graph is
shown in Fig 4.27. Average rate of produced gas is 2.7 L/min which is lower than
injection rate. This difference is created due to gas losses from separator while producing
oil.
Fig. 4.26 – Cumulative fluid production for run no. 3.
60
Fig. 4.27 – Cumulative produced gas volume and produced gas rates for run no. 3.
Oil gravity was measured at 50oC while viscosity was measured at three different
temperatures: 40oC, 50
oC and 60
oC. Produced oil gravity at the end of the run was 5
oAPI
higher than that of the original crude (Fig. 4.28). This is the best upgrading performance
among all combustion runs. The viscosity of the produced oil decreased in comparison
with base run with original crude oil. Decrease of viscosity and increase of gravity occurs
due to upgrading of oil during combustion. Light hydrocarbon content increase because
of cracking and hydrogen supplied by decalin.
This run took only 520 min, which is great improvement in comparison with the base
run but is slower than second run. Cumulative produced fluid was almost the same as in
second run and almost repeated the experiment.

61
Fig. 4.28 – Produced oil gravity and viscosity for run no. 3.
62
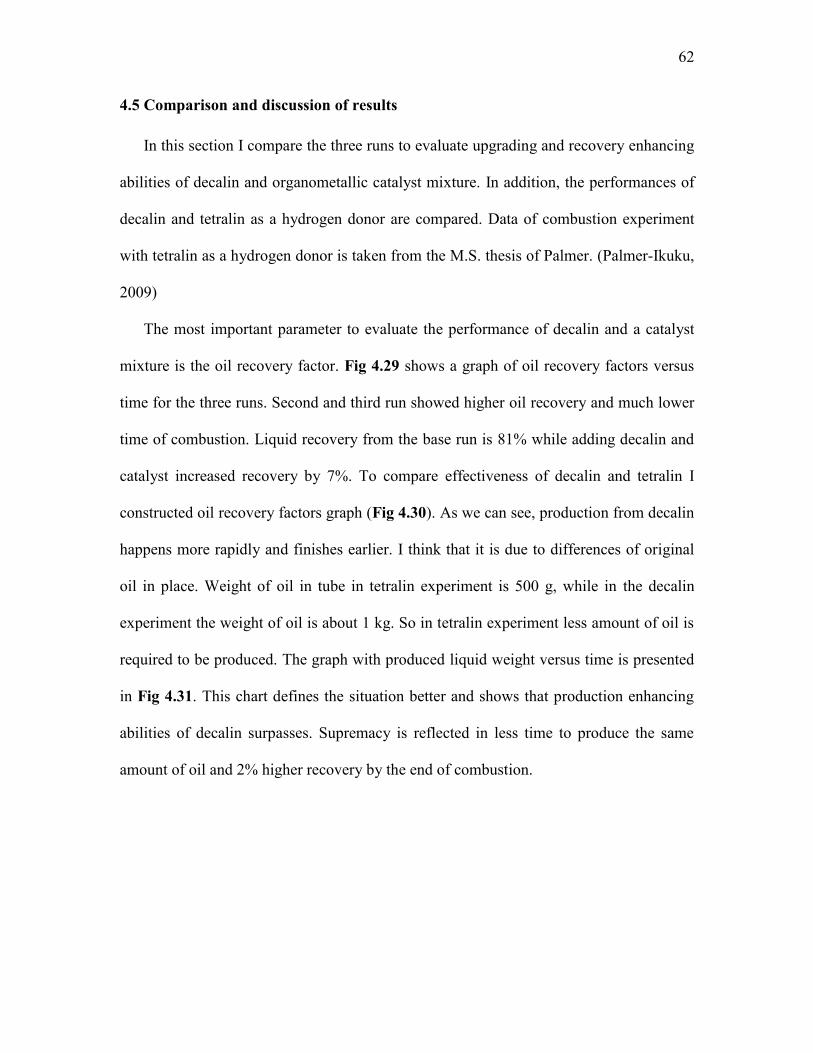
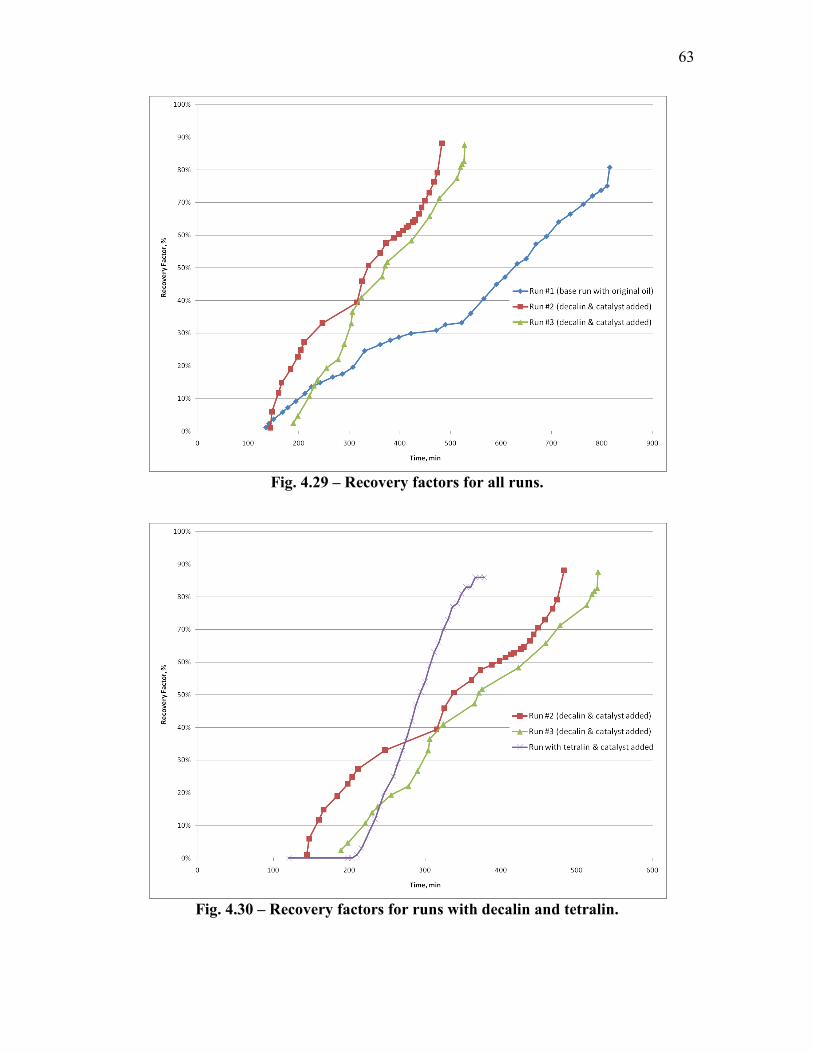
4.5 Comparison and discussion of results
In this section I compare the three runs to evaluate upgrading and recovery enhancing
abilities of decalin and organometallic catalyst mixture. In addition, the performances of
decalin and tetralin as a hydrogen donor are compared. Data of combustion experiment
with tetralin as a hydrogen donor is taken from the M.S. thesis of Palmer. (Palmer-Ikuku,
2009)
The most important parameter to evaluate the performance of decalin and a catalyst
mixture is the oil recovery factor. Fig 4.29 shows a graph of oil recovery factors versus
time for the three runs. Second and third run showed higher oil recovery and much lower
time of combustion. Liquid recovery from the base run is 81% while adding decalin and
catalyst increased recovery by 7%. To compare effectiveness of decalin and tetralin I
constructed oil recovery factors graph (Fig 4.30). As we can see, production from decalin
happens more rapidly and finishes earlier. I think that it is due to differences of original
oil in place. Weight of oil in tube in tetralin experiment is 500 g, while in the decalin
experiment the weight of oil is about 1 kg. So in tetralin experiment less amount of oil is
required to be produced. The graph with produced liquid weight versus time is presented
in Fig 4.31. This chart defines the situation better and shows that production enhancing
abilities of decalin surpasses. Supremacy is reflected in less time to produce the same
amount of oil and 2% higher recovery by the end of combustion.
63
Fig. 4.29 – Recovery factors for all runs.
Fig. 4.30 – Recovery factors for runs with decalin and tetralin.

64
Fig. 4.31 – Cumulative oil production for runs with decalin and tetralin.
To evaluate upgrading abilities of additives we compared their API gravities and
viscosities. From the graph of oil gravities versus time presented in Fig 4.32 it is obvious
that additives assist in produced oil upgrading. The API gravity of oil at the end of the
experiment increased for 2 and 4 degrees API in experiments 2 and 3, respectively, in
comparison with the base run. The oil gravity from run with tetralin (Palmer-Ikuku,
2009) also shows about 2 degrees API higher than the base run, except for the last data
which was about 6 degrees API higher.

65
Fig. 4.32 – Produced oil gravity for all runs.
One indirect parameter by which we can judge on upgrading happening during
combustion is apparent H/C ratio. The large apparent atomic hydrogen-carbon ratio is a
result of oxygen being consumed in LTO reactions, which do not produce carbon-oxides.
The viscosity and boiling range of the crude oil is increased because of LTO (Mamora
and Brigham, 1995). We can see from apparent H/C ratios that it decreased in runs with
premixed decalin-catalyst compared to the base run (Table 4.5). I think that it is a clear
sign of better upgrading in runs with decalin and catalyst mixture.
It was mentioned before that runs with additives resulted in higher combustion
temperatures, as evident from graph of combustion front temperatures versus time in Fig
4.33. Adding decalin and catalyst increased significantly the combustion temperature.
Difference between average temperatures of first and third runs is 130oC. Unfortunately,

66
there is no data on combustion temperature with time in the thesis of Palmer. I could
compare only average temperatures of combustion to choose between hydrogen donors.
Average combustion temperatures for decalin are higher than for tetralin as seen from
Table 4.5.
Fig. 4.33 – Combustion front temperatures for all runs.

67
Table 4.5 – Summary of experimental result.
Run #1
(base run)
Run #2
(decalin +
iron catalyst)
Run #3
(decalin +
iron catalyst)
Run with
tetralin +
iron catalyst)
m-ratio 0.24 0.23 0.22 0.25
Average apparent H/C
ratio 1.93 1.14 0.69 1.70
Median apparent H/C
ratio 1.6 1 0.69 -
Average combustion
temperature (oC)
430 508 563 492
Combustion front velocity
(ft/hr) 0.19 0.32 0.31 0.46
Oil recovery (%) 81 88 88 86
API gravity at end of
combustion run 10.5 12.5 14.3 15
*Average viscosity at end
of combustion run (cp) 740 399 377 221**
* Oil viscosity averaged for the three temperatures: 40o, 50
o and 60
oC
** Based on Palmer (Palmer-Ikuku, 2009) oil viscosity in base run was 504cp.

68
5 SUMMARY, CONCLUSIONS, AND RECOMMENDATIONS
5.1 Summary
The main objective of my research is to experimentally evaluate oil upgrading and
recovery during in situ combustion using a combination of hydrogen donor decalin and
an organometallic catalyst. 10o API Gulf of Mexico heavy oil is used for the experiments.
Decalin and tetralin’s production enhancing abilities were compared by analyzing the
experimental results with data from the thesis of Palmer.
Four in situ combustion runs were performed with a Gulf of Mexico heavy oil and
three of them were successful. The first run was base a run made without any additives.
Two runs were made with premixed decalin (5% by oil weight) and an organometallic
catalyst (750 ppm). The same oil and catalyst were used in the for experiments of Palmer
(Palmer-Ikuku, 2009), and the only difference was in the hydrogen donor type. Following
conditions were kept constant during all experimental runs: air injection rate at 3.1 L/min
and combustion tube outlet pressure at 300 psig.
5.2 Conclusions
Based on the experimental results, the following conclusions can be made:
1. Experimental results with decalin and organometallic catalyst showed an increase
in oil recovery to 7%, increase in oil API gravity and higher velocity of
combustion.
2. 2-3o API increase with decalin as hydrogen donor, similar to that for tetralin.
69
3. 381-402cp oil viscosity at the end of combustion run for the runs with decalin,
compared to 768 cp to the base run. Similar oil upgrading effects were observed
with tetralin as hydrogen donor.
4. Low temperature oxidation appears to occur during the base run. This is probably
due to air bypassing the combustion front. The reason for it is not well
understood. In experiments with additives this effect was less or did not happen at
all.
5. Apparent H/C ratio is lower for runs with decalin-catalyst compared to the base
run indicating upgrading of oil. Large apparent H/C ratio is a result of oxygen
being consumed in LTO reactions, which do not produce carbon oxides. The
viscosity and boiling range of the crude oil increases because of LTO.
6. The combustion temperature of decalin-catalyst run is higher compared to the
base run, and this increase of temperature is very noticable (up to 130oC). High
combustion temperature prevents LTO during combustion process of oil premixed
with decalin and catalyst.
7. There is a large variation of average combustion temperature even in runs with
the same decalin-catalyst additive. The average temperature for the second run is
508oC while the average temperature for the third run is 563
oC.
8. Oil recovery factors in both decalin-catalyst runs (88% OOIP) increased by 7%
compared to the base run (81% OOIP).
9. Oil recovery factor for run with decalin is higher than that with tetralin by 2%.
The fact that decalin half the price of tetralin, the use of decalin is preferred for
enhanced in situ combustion.

70
10. Combustion time with decalin-catalyst decreased from 815 min (base run) to 495
min (run 2) and 527 min (run 3). It happens due to number of reasons, including
lower viscosity of oil and higher temperature of combustion. Oil moves faster
because of low viscosity and it leads to higher combustion front velocity. With
high temperatures, heat can go further and preheat the oil. It starts movement of
oil from zones which are not available at lower temperatures. This is significant
result as in field run it means huge savings on working time of compressors and
faster return of investments.
11. API gravity of produced oil increased in all combustion runs compared to the
original oil. The gravity at the end of combustion in decalin-catalyst runs (12.5
oAPI and 14.3
oAPI in run 2 and 3 respectively) was higher in comparison to the
base run (10.5oAPI). These runs confirm upgrading abilities of decalin and
organometallic catalyst.
12. Water saturation of the sand mix used in combustion should be higher. During
combustion, water from the reservoir evaporates and creates a steam front that
moves towards the production well. This steam and hot water is an additional
force that moves the oil to the producer. Presence of this force would have given
even better results in oil production.
5.3 Recommendations
1. Investigate a way to disperse decalin and catalyst through the porous media
previously saturated with oil and water, as in lab we premix it with oil, which is
impossible in real life.

71
2. Investigate the economics of both decalin and decalin-catalyst for use in heavy oil
recovery using in situ combustion.
3. Conduct in situ combustion experiments with decalin and catalyst using a sand
pack with heterogeneities as found in the field.
72
REFERENCES
Alboudwarej H, F.F., Taylor S, Badry R, Bremner C, Brough B, Skeates C, Baker a,
Palmer D, Pattison K, Beshry M, Krawchuk P, Brown G, Calvo R, Cañas Triana
Ja, Kundu D, Hathcock R, Koerner K, Hughes T, López De Cárdenas J and West
C. 2006. Highlighting Heavy Oil Oilfield Review 18 (2): 34-53.
Cristofari, J., Castanier, L.M., and Kovscek, A.R. 2008. Laboratory Investigation of the
Effect of Solvent Injection on In-Situ Combustion. SPE Journal 13 (2): 153-163.
997. DOI: 10.2118/99752-pa
Fassihi, M.R., Meyers, K.O., and Baslie, P.F. 1990. Low-Temperature Oxidation of
Viscous Crude Oils. SPE Reservoir Engineering 5 (4): 609-616. 15648-PA. DOI:
10.2118/15648-pa
He, B., Chen, Q., Castanier, L.M., and Kovscek, A.R. 2005. Improved In-Situ
Combustion Performance with Metallic Salt Additives. Paper Society of
Petroleum Engineers 93901-MS presented at the SPE Western Regional Meeting,
Irvine, California, 03/30/2005.
Mamora, D.D. and Brigham, W.E. 1995. The Effect of Low-Temperature Oxidation on
the Fuel and Produced Oil During In-Situ Combustion of a Heavy Oil. In Situ 19
(4): 341-365.
Mohammad, A.A.A. and Mamora, D.D. 2008. In Situ Upgrading of Heavy Oil under
Steam Injection with Tetralin and Catalyst. Paper 2008, SPE/PS/CHOA
International Thermal Operations and Heavy Oil Symposium 11760 presented at
the International Thermal Operations and Heavy Oil Symposium, Calgary,
Alberta, Canada, 10/20/2008.
Nares, H.R., Schachat, P., Ramirez-Garnica, M.A., Cabrera, M., and Noe-Valencia, L.
2007. Heavy-Crude-Oil Upgrading with Transition Metals. Paper Society of
Petroleum Engineers 107837-MS presented at the Latin American & Caribbean
Petroleum Engineering Conference, Buenos Aires, Argentina, 04/15/2007.
Ovalles, C.S., Vallejos, C., Vasquez, T., Rojas, I., Ehrman, U., Benitez, J.L. et al. 2003.
Downhole Upgrading of Extra-Heavy Crude Oil Using Hydrogen Donors and
Methane under Steam Injection Conditions. Petroleum Science and Technology
21 (1): 255 - 274.
Palmer-Ikuku, E. 2009. Experimental Study of In Situ Combustion with Tetralin and
Metallic Catalysts. Master of Science, Texas A&M University, College Station.
Ramirez-Garnica, M.A., Mamora, D.D., Nares, R., Schacht-Hernandez, P., Mohammad,
A.A.A., and Cabrera, M. 2007. Increase Heavy-Oil Production in Combustion
Tube Experiments through the Use of Catalyst. Paper Society of Petroleum

73
Engineers 107946-MS presented at the Latin American & Caribbean Petroleum
Engineering Conference, Buenos Aires, Argentina, 04/15/2007.
Ramirez-Garnica, M.A., Perez, J.R.H., Cabrera-Reyes, M.D.C., Schacht-Hernandez, P.,
and Mamora, D.D. 2008. Increase Oil Recovery of Heavy Oil in Combustion
Tube Using a New Catalyst Based on Nickel Ionic Solution. Paper 2008,
SPE/PS/CHOA International Thermal Operations and Heavy Oil Symposium
117713-MS presented at the International Thermal Operations and Heavy Oil
Symposium, Calgary, Alberta, Canada, 10/20/2008.
Wu, C.H. and Fulton, P.F. 1971. Experimental Simulation of the Zones Preceding the
Combustion Front of an In-Situ Combustion Process. 11 (1): 38-46. 2816-PA.
DOI: 10.2118/2816-pa
Zhong, L.G., Liu, Y.J., Fan, H.F., and Jiang, S.J. 2003. Liaohe Extra-Heavy Crude Oil
Underground Aquathermolytic Treatments Using Catalyst and Hydrogen Donors
under Steam Injection Conditions. Paper Society of Petroleum Engineers 8486
presented at the SPE International Improved Oil Recovery Conference in Asia
Pacific, Kuala Lumpur, Malaysia, 10/20/2003.
74
VITA
Name: Dauren Mateshov
Permanent address: 3116 TAMU, Richardson Building
Texas A&M University, College Station, Texas, 77843
Education: B.S. Petroleum Engineering
Kazakh-British Technical University, Kazakhstan 2007
M.S. Petroleum Engineering
Texas A&M University, College Station 2010
Member: Society of Petroleum Engineers
Email address: [email protected]