mega-events: the effect of the world’s biggest sporting...
TRANSCRIPT

Mega-Events: The effect of the world’s biggest sporting events onlocal, regional, and national economies
Victor A. Matheson
October 2006
COLLEGE OF THE HOLY CROSS, DEPARTMENT OF ECONOMICSFACULTY RESEARCH SERIES, PAPER NO. 06-10*
Department of EconomicsCollege of the Holy Cross
Box 45AWorcester, Massachusetts 01610
(508) 793-3362 (phone)(508) 793-3708 (fax)
http://www.holycross.edu/departments/economics/website
*All papers in the Holy Cross Working Paper Series should be considered draft versions subjectto future revision. Comments and suggestions are welcome.

1Victor A. Matheson, Department of Economics, Box 157A, College of the Holy Cross,Worcester, MA 01610-2395, 508-793-2649 (phone), 508-793-3708 (fax),[email protected]
Mega-Events: The effect of the world’s biggest sporting events onlocal, regional, and national economies
Victor A. Matheson1
College of the Holy Cross
October 2006
Abstract
That paper provides an overview of the economics of sports mega-events as well asreview of the existing literature in the field. The paper describes why boosters’ ex ante estimatesof the economic impact of large sporting events tend to exaggerate the net economic benefits ofthese events and surveys the results of a large number of ex post studies of exploring the trueimpact of mega-events.
JEL Classification Codes: L83
Keywords: sports, impact analysis, mega-event

2
Introduction
Sports boosters often claim that major sporting events, so-called “mega-events,” inject
large sums of money into the cities lucky enough to host them. Promoters envision hoards of
wealthy sports fans descending on a city’s hotels, restaurants, and businesses, and showering
them with fistfuls of dollars. For example, the National Football League (NFL) typically claims
an economic impact from the Super Bowl of around $300 to $400 million1, Major League
Baseball (MLB) attaches a $75 million benefit to the All-Star Game2, and up to almost $250
million for the World Series3, and the estimated effect of the National Collegiate Athletic
Association (NCAA) Men’s Basketball Final Four ranges from $30 million4 to $110 million5.
Multi-day events such as the summer or winter Olympics or soccer’s World Cup produce even
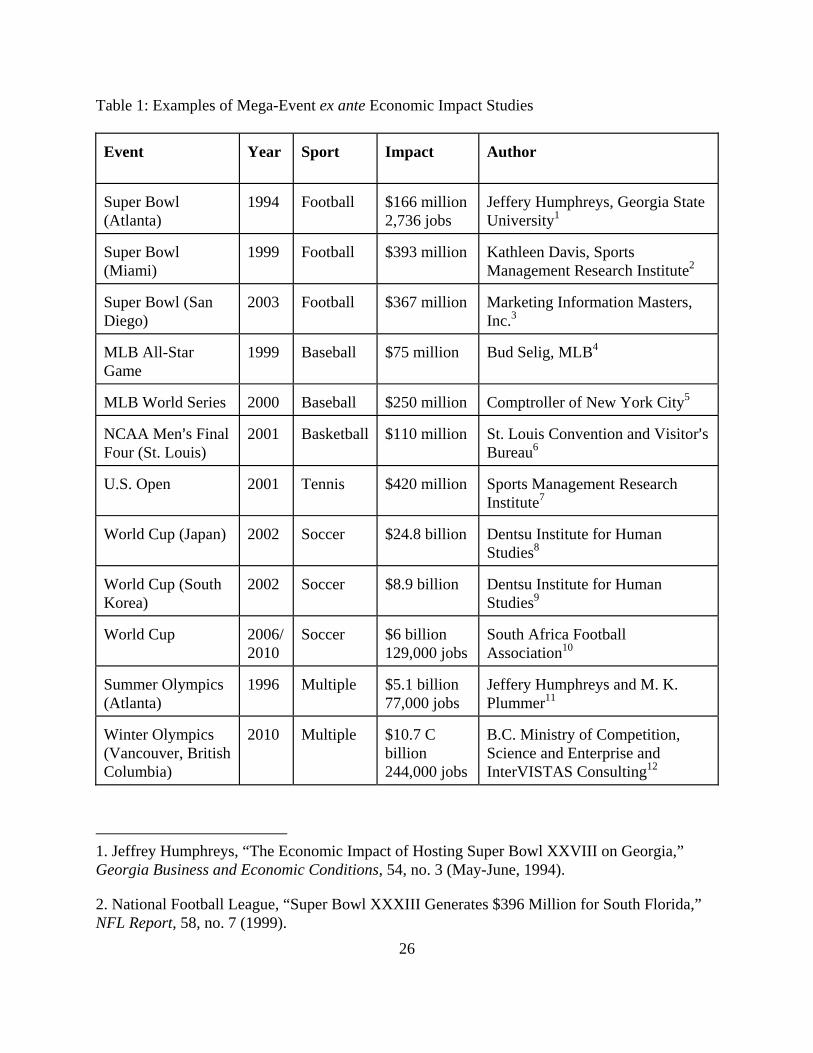
larger figures. See Table 1 for a list of published economic impact estimates for a variety of large
sporting events.
Of course, leagues, team owners, and event organizers have a strong incentive to provide
economic impact numbers that are as large as possible in order to justify heavy public subsidies.
The NFL and MLB use the Super Bowl and baseball’s All-Star Game as carrots to prompt
otherwise reluctant city officials and taxpayers to provide lavish funding for new stadiums to the
great financial benefit of the existing owners. For example, in baseball, of the 15 new major
league stadiums built between 1970 and 1997, 13 were selected by MLB to host an All-Star
Game within five years of their construction6. Similarly, during a visit to the Dallas-Fort Worth
area just before a crucial vote on public funding for a new stadium, NFL Commissioner Paul
Tagliabue suggested that the construction of a new stadium would lead to the opportunity for the
metro area to host the Super Bowl in the next decade. Since the NFL touts economic benefits
from hosting the Super Bowl of $300 to $400 million, an amount that meets or exceeds the

3
proposed $325 million public subsidy for the stadium, in effect, Commissioner Tagliabue was
saying that combined with a Super Bowl, Arlington would be getting a new stadium for free.
With an event like the Olympics, the huge cost of hosting the event to the standards now
required by the International Olympic Committee (IOC), as well as providing adequate security,
almost necessitates an infusion of taxpayer money. For example, while on paper the 2002 Winter
Olympics in Salt Lake City made a profit, the cost figures did not include millions of dollars of
additional security provided by the U.S. Department of Defense at no cost to the local organizing
committee. For the 2004 Summer Games, the government in Athens spent $1.5 billion on
security alone. These figures illustrate why organizers often rely on lofty reports that promise
huge monetary windfalls to host cities. Since many economic impact studies are commissioned
by owners, leagues, or event organizers, which stand to directly benefit from the public subsidies
such reports are designed to elicit, one must question whether such studies can be believed.
Ex ante economic modeling and its deficiencies
A typical predictive, or ex ante, economic impact study of the type used by event
promoters estimates the number of visitors an event is expected to draw, the number of days each
spectator is expected to stay, and the amount each visitor will spend each day. Combining these
figures, an estimate of the “direct economic impact” is obtained. This direct impact is then
subjected to a multiplier, usually around two, to account for the initial round of spending
recirculating through the economy. This additional spending is known as “indirect economic
impact.” Thus, the total economic impact is double the size of the initial spending.
For example, in assessing the impact of Super Bowl XXVIII on the City of Atlanta and
the State of Georgia, Jeffrey Humphreys (1994) estimated that the event created 2,736 jobs and

4
had an impact of $166 million on the Georgia economy7. Of the $166 million, Humphreys
estimated direct and indirect economic impact of $76 and $90 million, respectively. The direct
impact was derived from estimating the number of “visitor days” (306,680) and multiplying that
statistic by the average estimated per diem expenditures per visitor ($252). The indirect or
induced economic impact was estimated using the Regional Input-Output Multiplier System
(RIMS II) model developed by the Bureau of Economic Analysis. More recent NFL’s estimates
of the economic impact of the Super Bowl arrive at figure roughly double that of Humphrey’s
1994 study in part due to general inflation in the economy, but most of the difference is a result
of increases in the assumed number of visitors and the daily spending attributable to each of
them.
While such an estimation method is relatively straight-forward, academic economists
have been quick to point out the failings of such ex ante studies as they often rely on poor
methodology and also suffer from several theoretical problems.
First, many booster estimates are wildly optimistic about the number of potential guests
and their spending habits. In March 2005, Denver tourism officials predicted 100,000 visitors for
the National Basketball Association (NBA) All-Star Game. Considering that the Pepsi Center,
the game’s venue, only holds 20,000 fans, and that Denver has only about 6,000 hotel rooms, it
is not clear exactly how such an influx of basketball fans would be even be possible much less
probable.
Similarly, in other cases, the size of the estimates themselves strain credulity. The Sports
Management Research Institute estimated the direct economic benefits of the U.S. Open Tennis
tournament in Flushing Meadows, New York at $420 million for the tri-state area, more than any
other sports or entertainment event in any city in the United States. This sum represents 3% of

5
the total annual direct economic impact of tourism for New York8. It is simply impossible to
believe that 1 in 30 tourists to New York City in any given year are visiting the city solely to
attend the U.S. Open. The projected $6 billion impact of the World Cup proposed for South
Africa in 2006 suggested that soccer games and their ancillary activities would have represented
over 4 percent of the entire gross domestic product of the country in that year9. Along the same
lines, a study by the Dentsu Institute for Human Studies estimated a $24.8 billion impact from
the 2002 World Cup for Japan and an $8.9 billion impact for South Korea10. As a percentage of
total national income, these figures represent 0.6 and 2.2 percent of the total Japanese and South
Korean economies, respectively.
In other cases, the variation in estimated benefits alone is enough to question the validity
of the studies. A series of studies of the NBA All-Star game produced numbers ranging from a
$3 million windfall for the 1992 game in Orlando to a $35 million bonanza for the game three
years earlier in Houston11. Similarly, the 1997 NCAA Women’s Basketball Final Four was
estimated to have an economic impact of $7 million on the local economy of Cincinnati, but the
same event was predicted to produce a $32 million impact on the San Jose economy just two
years later12. The five- or ten-fold disparity in the estimated impact for the same annual event
serves to illustrate the ad hoc nature of these studies. In some cases, economic impact figures
appear to be completely fabricated. While city or league officials may suggest a certain monetary
figure from a particular event, when pressed on the details, the “missing study” syndrome
arises13.
Sports boosters also often cite civic pride or national exposure as a primary benefit of
mega-events and of sports in general. In many cases, it is undoubtedly true that mega-events
bring intangible psychological value to the communities that host them. The 1995 Rugby World

6
Cup in South Africa represented an opportunity for the country to announce its re-emergence as
a full member of not only the world’s sporting community but also its political community. The
picture of South African President Nelson Mandela wearing the jersey of the white South
African captain Francois Pienaar while presenting him with the championship trophy was a
powerful image to the world indicating that South Africa had emerged from its years of racial
oppression and served to unify the country14. Similarly, Ray Nagin, the mayor of New Orleans,
pointed to the return of the NFL to the city in September 2006 as an important symbol to the rest
of the country that the city was fully on the road to recovery from Hurricane Katrina which had
devastated the city the year previously.
Obviously, measuring such benefits is fraught with difficulty, and academic studies are
mixed on the subject. Most researchers find no correlation between economic growth and the
presence of new sports facilities, franchises, or events suggesting that the intangible value of
these events tends not to translate into any measurable benefits to the host cities. (See, for
example, Robert Baade15, Dennis Coates and Brad Humphreys16, and Phil Porter17.) On the other
hand Coates and Humphreys did find that cities that win the Super Bowl (not the host cities) tend
to experience a statistically significant increase in their per capita incomes following the game, a
result they attribute to higher productivity due to a happier labor force18. In other words, it is
certainly possible that something intangible (happiness) can produce something tangible
(productivity and real income). Coates and Humphreys’ claim of higher per capita personal
incomes in winning cities, however, has been at least in part refuted by Victor Matheson19.
At least one study by Gerald Carlino and Edward Coulson has found that rental housing
prices are higher in cities with professional sports teams indicating a higher willingness of buyers
to pay for housing in cities with these amenities20, and this idea could, in theory, be applied to

7
cities that host mega-events as well. Dennis Coates, Brad Humphreys and Andrew Zimbalist,
however, have suggested that Carlino and Coulson’s results are highly susceptible to the model
specification used in estimating the results21. It is also clearly true that cities with professional
teams, since they are generally larger metropolitan areas, also can offer many other cultural
attractions besides professional sports in comparison to smaller cities which may also contribute
to the higher willingness to pay for housing in these cities.
Of course, the use of sporting events to provide entertainment for the masses has been
around for centuries. The term “bread and circuses” dates from the first century Roman empire
where extravagant games were held in conjunction with giveaways of subsidized food in order to
pacify the citizenry and reduce urban unrest.
The other major intangible benefit of mega-events claimed by sports boosters is that of
national and international exposure. Sports fans may enjoy their visit to the city and return later
raising future tourist revenues for the area. Corporate visitors, it is claimed, may relocate
manufacturing facilities and company headquarters to the city. Television viewers might decide
to take a trip to the host city at some time in the future based on what they see during the
broadcast of the mega-event. Finally, hosting a major event might raise perception of the city so
that it becomes a “major league” or “world class” city and travel destination. All of these claims
are potential true although little empirical research has conclusively demonstrated any long-run
connections between hosting mega-events and future tourism demand. There are not even any
anecdotal examples of companies moving corporate operations to a city based on the hosting of a
sporting event.
While intangible benefits to mega-events certainly exist, two caveats must be mentioned.
First, the presence of a mega-event may bring with it intangible costs as well as benefits. For

8
example, the publicity associated with a sporting event may not always place a city in a positive
light. Following the riots that occurred during the National Basketball Association finals in
Detroit in the early 1990s, the city’s national image basked in the glow of car fires and burning
buildings rather than the goodwill associated with an NBA championship, and the bribery
scandal that surrounded the 2002 Winter Olympics in Salt Lake City certainly didn’t enhance the
city’s reputation. Similarly, the international reputations Munich and Atlanta were tarnished by
the terrorist events that occurred during the Olympic Games held in their respective cities.
In addition, if the lion’s share of the benefits of an event is intangible, this is a significant
cause for concern since this type of benefit is most likely to be based upon assumption and
guesswork. While sports boosters often suggest that the exposure a city receives during a mega-
event is invaluable to the area, in the words of University of Chicago economist Allen
Sanderson, “Anytime anybody uses the word ‘invaluable,’ they are usually too lazy to measure it
or they don’t want to know the answer.”
Even when ex ante studies are done carefully and considered manner, they suffer from
three primary theoretical deficiencies: the substitution effect, crowding out, and leakages. The
substitution effect occurs when consumers spend money at a mega-event rather than on other
goods and services in the local economy. A local resident who goes to an All-Star Game when it
is in town is spending money at the game that likely would have been spent locally elsewhere in
the absence of the game. Therefore, the local consumer’s spending on a sporting event is not new
economic activity, rather a reshuffling of local spending. For this reason, most economists
advocate that spending by local residents be excluded from any economic impact estimates.
Even including only out-of-region visitors in impact studies may still result in inflated
estimates if a large portion of the non-local fans at a game are “casual visitors,” that is out-of-

9
town guests who go to a sporting event, but are visiting the host city for reasons other than the
sporting event itself. For example, college professor at an academic conference may buy a ticket
to a local game, and therefore the ticket would be counted as a direct economic impact of the
sports contest. The professor, however, would have come to the city and spent money on hotels
and restaurants in the absence of the sporting match, and again the money spent at the game
substitutes for money that would have spent elsewhere in the local economy.
Similarly, ex ante estimates may be biased upwards if event guests engage in “time-
switching,” which occurs when a traveler rearranges a planned visit to a city to coincide with a
mega-event. One example of time-switching is someone who has always wanted to visit Hawaii
who plans a trip during the NFL’s Pro-Bowl. While the Pro-Bowl did influence the tourist’s
decision about when to come, it did not affect the decision whether to come. Therefore total
tourism spending in Hawaii is unchanged; the Pro-Bowl simply affects the timing of such
spending.
In the case of mega-events, the amount of new spending that is new to the economy is
thought to be quite large in comparison to the total amount of spending, since these “premier”
events are thought to attract large audiences from outside the local economy, many of whom
come specifically for the event. Whereas 5 percent to 20 percent of fans at a typical MLB game
are visitors from outside the local metropolitan area, the percentage of visitors at an event like an
All-Star Game or the Super Bowl is thought to be much higher22. High prices charged by hotels
and other businesses in the hospitality industry also tend to dissuade casual visitors during mega-
events.
A second source of bias is “crowding out,” which is the congestion caused by a mega-
event that dissuades regular recreational and business visitors from coming to a city during that

10
time. Many large sporting events are staged in communities that are already popular tourist
destinations. If hotels and restaurants in the host city normally tend to be at or near capacity
throughout the time period during which the competition takes place, the contest may simply
supplant rather than supplement the regular tourist economy. In other words, the economic
impact of a mega-event may be large in a gross sense but the net impact may be small. Scores of
examples of this phenomenon exist. As a case in point, during the 2002 World Cup in South
Korea, the number of European visitors to the country was higher than normal, but this increase
was offset by a similar sized decrease in number of regular tourists and business travelers from
Japan who avoided South Korea due to World Cup hassles. The total number of foreign visitors
to South Korea during the World Cup in 2002 was estimated at 460,000, an figure identical to
the number of foreign visitors during the same period in the previous year23.
A third source of bias comes from leakages. While money may be spent in local
economies during mega-events, this spending may not wind up in the pockets of local residents.
The taxes used to subsidize these events, however, are paid for by local taxpayers. The economic
multipliers used in ex ante analyses are calculated using complex input-output tables for specific
industries grounded in inter-industry relationships within regions based upon an economic area’s
normal production patterns. During mega-events, however, the economy within a region may be
anything but normal, and therefore, these same inter-industry relationships may not hold. Since
there is no reason to believe that the usual economic multipliers are the same during mega-
events, any economic analyses based upon these multipliers may, therefore, be highly
inaccurate24.
In fact, there is substantial reason to believe that during mega-events, these multipliers
are highly overstated, which overestimates the true impact of these events on the local economy.

11
Hotels, for example, routinely raise their prices during mega-events to three or four times their
normal rates. The wages paid to a hotel’s workers, however, remain unchanged, and indeed
workers may be simply expected to work harder during times of high demand without any
additional monetary compensation. As a hotel’s revenue increases without a corresponding
increase in costs, the return to capital (as a percentage of revenues) rises while the return to labor
falls. Capital income is far less likely to stay within the area in which it is earned than labor
income, and therefore, one might expect a fall in the multiplier effect during mega-events due to
these increased leakages25.
Most league-sponsored economic impact studies not only potentially exaggerate the
benefit-side of the cost-benefit equation but also often completely ignore the costs of hosting
such an event. Most leagues and event organizers require sparkling new stadiums and arenas
before awarding the privilege of hosting a mega-event to a city. The NBA and MLB as well as
the National Hockey League and Major League Soccer use their All-Star games to showcase new
facilities and explicitly use the promise of hosting these events as an enticement to cities to build
new stadiums and arenas. This is not a uniquely American phenomenon. Both the Summer and
Winter Olympics routinely entail major construction projects as a condition of winning the bid.
The Federation Internationale de Football Association (FIFA), soccer’s world governing body,
extracts similar promises of new stadiums from its host countries. Germany spent over 1.4 billion
euros building or rehabilitating 12 stadiums for the 2006 FIFA World Cup of which at least 35
percent was provided by local, state, and federal taxpayers26.
It is a common error in cost benefit analysis for the costs of infrastructure improvements
to be counted as a benefit and not a cost. While construction expenditures for sports
infrastructure undoubtedly have stimulative effects on the economy, the opportunity cost of

12
capital must also be considered. Public expenditures on sports infrastructure and event operations
necessarily entail reductions in other government services, an expansion of government
borrowing, or an increase in taxation, all of which produce a drag on the local economy27. At
best public expenditures on sports-related construction or operation have zero net impact on the
economy as the employment benefits of the project are matched by employment losses
associated with higher taxes or spending cuts elsewhere in the system.
At worst, the spending on sports projects represents true costs. If specialized materials,
labor, or technology must be obtained from outside the local economy, these expenditures result
in an outflow of money away from the city. Furthermore, due to the distortions caused by the tax
system, all funds raised by a local government to pay for stadium construction result in some
level of dead-weight loss that can easily exceed $0.25 for every dollar spent. Finally, even if all
monies spent on construction stay in the local economy, there is nothing to suggest that stadium
building is the best use of government funds and that the return on sports infrastructure exceeds
the return on the next best alternative. In many cases, sports venues are often highly specialized
facilities that have only limited use following an event. For example, what does one do with a
world-class, 10,000 seat swimming facility once the Olympics are over? Indeed, unless a
compelling case can be made that a local community is in dire need of fiscal stimulus and that no
other projects exist that would provide a comparable return, infrastructure spending must be
considered a cost and not a benefit.
Besides the infrastructure costs associated with hosting these games, sporting events and
the crowds associated with them require government expenditures on public safety, sanitation
and public transportation, and the larger the event the larger the potential costs. The variable
costs borne by the host city are at least $1.5 million for the Super Bowl28, and Greece spent over

13
$1.5 billion on security alone for the 2004 Summer Olympics. In addition, non-economic costs
such as “traffic congestion, vandalism, environmental degradation, disruption of residents'
lifestyle, and so on are rarely reported.”29 Following championship matches, for example,
informal celebrations all too frequently degenerate into riots resulting in violence and the
destruction of property, which negatively affect productive activity in the short-run. The failure
to account for the public costs associated with athletic contests serves to give an upwards bias to
the reported net impact of these events.
While ex ante estimates often do a credible job in determining the economic activity that
occurs as a result of a mega-event and may also address the issue of the substitution effect by
excluding spending by local residents, they generally do a poor job of accounting for crowding-
out and almost never acknowledge the problems associated with the application of incorrect
multipliers. Of course, one solution to the criticisms of ex ante economic analysis is to simply
perform better cost-benefit analysis that fully accounts for the costs involved and more
thoroughly addresses the issues of appropriate multipliers, opportunity costs, and the substitution
effects of mega-events.
Larry Dwyer, Peter Forsyth, and Ray Spurr estimate the economic impact of the Quantas
Australian Grand Prix automobile race using both standard input-output analysis and a more
sophisticated computable general equilibrium (CGE) model that better accounts for the
theoretical deficiencies discussed previously. By the standard input-output analysis, the race
increased real output by $112 million the state of New South Wales and $120.1 million the
country as a whole while the CGE model presented much more modest figures of $56.7 million
and $24.5 million for the state and country, respectively30.

14
Ex Post studies of mega-events
While Dwyer, Forsyth, and Spurr advocate the use of CGE over simple input-output
based models in generating economic impact estimates, they concede that any type of ex ante
approach to requires making many heroic assumptions about the state of the economy and the
response of host cities to mega-events. For this reason, other scholars have performed ex post
studies of regions that have hosted large sporting event to examine whether the advertised ex
ante estimates conform to ex post observations of the economic impact mega-events exert on
their host cities. These ex post analyses generally confirm the criticisms of economic impact
studies discussed previously finding that ex ante studies routinely exaggerate the benefit of
mega-events often by up to a factor of 10.
Ex post analyses of mega-events are performed by examining the economic performance
of a host region during a mega-event and comparing this performance to other similar regions at
the same time that did not host the event. Alternatively, one can compare a city’s economy
during a mega-event to the same city before and/or after the event. Scholars most commonly use
personal income, per capita personal income, employment, and taxable sales or sales tax
collections in their studies, although economic variables such as hotel occupancy rates and
prices, and airport arrivals and departures have also been used to attempt to measure the
economic impact of mega-events on host economies.
The primary difficulty facing practitioners of ex post economic impact analysis is that
even significant economic events may be hard to isolate within the large, diverse metropolitan
economies in which they take place. For example, even if the Super Bowl does result in a $400
million boost to the host city, this is less than 0.1% of the annual personal income of a
metropolitan area like Los Angeles, a frequent Super Bowl host. Any income gains as a result of

15
the game may be obscured by normal fluctuations in the region’s economy. If the event can be
isolated within space and time, however, any potential impact is more likely to be identified. For
example, while the presence of the World Series might have a large effect on neighborhood
businesses, the overall effect on a state or country’s economy will be minuscule and hard to
identify. Furthermore, these same economic effects may be large for the time period immediately
surrounding the event, but over the course of an entire year, the impact during this, perhaps,
week-long period is not likely to show up as an important change. Therefore, the use of quarterly
or monthly data is superior to annual data, and city, county, or metropolitan area data is preferred
to state or national figures. In addition, if one can examine multiple events, or the same event
over a number of years, patterns that are not be evident when observing an individual event may
be revealed.
While the earliest studies of the economic impact of professional sports concentrated on
the presence of professional franchises and the construction of new playing facilities (e.g. Robert
Baade and Richard Dye31 and Coates and Humphreys32), more recently work has begun to focus
on the economic impact of mega-events on local economies. See Table 2 for a summary of
multiple ex post mega-event impact studies.
Robert Baade and Victor Matheson examine annual city-wide employment data during
MLB’s All-Star Game and find that employment growth in host cities between 1973 and 1997
was 0.38% lower than expected compared to other cities33. A similar examination of the 1996
Summer Olympics in Atlanta by the same authors found employment growth of between 3,500
and 42,000 jobs, a fraction of 77,000 new jobs claimed in ex ante studies34. An examination of
metropolitan area-wide personal income during thirty NCAA Men’s Final Four Basketball
tournaments found that, on average, personal incomes were lower in host cities during

16
tournament years35. A similar study of the 1994 World Cup in the U.S. found that personal
income in host cities was $4 billion lower than predicted, a direct contradiction to ex ante
estimates of a $4 billion windfall36. Coates and Humphreys examine the effect of post-season
play in all four major U.S. sports on per capita personal incomes and find in all cases that hosting
playoff games has a statistically insignificant impact on per capita incomes37. Finally, Baade and
Matheson examined 32 Super Bowls held between 1970 and 2001 and found that the average
increase in personal incomes in host cities was $91.9 million, roughly one-quarter of the figures
routinely touted by the NFL, and that an increase in personal incomes due to the game of greater
than $300 million could be ruled out at the 5% significance level38.
Taxable sales or sales tax collections have also frequently been used to assess the
economic impact of sporting events. These measures are ideally suited to measuring the
economic impact of large sporting events for several reasons. First, there is often a direct
connection between sales tax collections and sporting events or facilities. Boosters often include
large sums for visitor spending in their ex ante estimates of the economic impact of a event, and
numerous publicly funded sports facilities have also been financed directly from sales taxes
collections or through specific increases in the sales tax rate making an examination of taxable
sales especially relevant39. In addition, taxable sales are a good indicator of economic well-being
as they represent approximately 40 percent of overall economic activity. Finally, the previously
mentioned studies of mega-events have used personal income40, 41, per capita income42, or
employment data43, 44 to estimate the ex post economic impact of sports. These data are generally
available only annually and at the county or metropolitan area level, and therefore these studies
suffer from the limitations mentioned previously. Taxable sales data, however, are often
published either monthly or quarterly and can cover areas down to the city level or smaller.

17
Therefore, these data can be analyzed to identify activities that are much smaller in scale and
duration.
Phil Porter provides a detailed analysis of taxable sales with respect to mega-events,
using regression analysis to determine that the economic impact of the Super Bowl was
statistically insignificant, that is not measurably different from zero. After reviewing short-term
data on sales receipts for several Super Bowls, Porter concluded:
Investigator bias, data measurement error, changing production relationships,
diminishing returns to both scale and variable inputs, and capacity constraints
anywhere along the chain of sales relations lead to lower multipliers. Crowding
out and price increases by input suppliers in response to higher levels of demand
and the tendency of suppliers to lower prices to stimulate sales when demand is
weak lead to overestimates of net new sales due to the event. These characteristics
alone would suggest that the estimated impact of the mega-sporting event will be
lower than the impact analysis predicts. When there are perfect complements to
the event, like hotel rooms for visitors, with capacity constraints [benefits are]
reduced to zero.
Other studies relying on taxable sales have also been made. Baade and Matheson
challenged an NFL claim of a $670 million boost in South Florida’s taxable sales due to the 1999
Super Bowl and arrive at a figure of a mere $37 million increase45. Baade and Matheson also
examined taxable sales in California to determine the effect of MLB’s All-Star Game on local
economies. They found that the three California cities that hosted All-Star Games between 1985

18
and 1997 suffered an average drop in taxable sales of roughly $30 million in the quarter in which
the game took place46.
Other more recent studies have examined multiple events in both Florida47 and Texas48, 49
using taxable sales and gross sales/sales taxes collections, respectively. As in previous papers,
the authors find no consistently positive statistically significant relationship between mega-
events and either retail sales or sales tax collections.
Only one ex post mega-event analysis has identified significant economic benefits from a
mega-event. Julie Hotchkiss, Robert Moore, and Stephanie Zobay, in a retrospective study of the
1996 Atlanta Olympics, estimated that the Games resulted in an increase in employment of
293,000 jobs in areas that hosted events, a figure that exceeded even the optimistic projections of
the event organizers50. A more careful look at their results, however, points at the difficulty of
identifying mega-events in the grand scheme of overall metropolitan area economic
development. The authors found that employment growth in Atlanta and the surrounding area
was a mere 0.2 percent higher than would have otherwise been expected over the time period
from 1991 through 1996. If this higher growth over the entire period is attributed solely to the
presence of the Olympics, then indeed job growth was 293,000 jobs higher than would have
otherwise been observed. Even slight changes in large economies over long time periods,
however, can result in eye-popping numbers. While it is certainly possible that the Summer
Olympics were responsible for these employment gains, the study also serves as a cautionary tale
against extrapolating small changes over large areas and time periods.
Policy Recommendations and Conclusions

19
While sports boosters routinely claim large benefits from hosting mega-events, the
overwhelming majority of independent academic studies of these events have shown that their
economic impact appears to be limited. While the gross impact of these huge games and
tournaments is undoubted large, attracting tens or hundreds of thousands of live spectators as
well as television audiences that can reach the billions, the net impact of mega-events on real
economic variables such as taxable sales, employment, personal income, and per capita personal
income in host cities is negligible. There are ways, however, that host cities can work to
maximize the net benefits that accrue to the area.
First, by limiting the amount of new infrastructure built to accommodate an event, costs
can be substantially reduced significantly increasing the probability that an event will result in
positive net benefits. The local government of Montreal built multiple new facilities for the 1976
Summer Olympics, including the grandiose Olympic Stadium, and wound up with debts totaling
$1.2 billion. These debts were not paid off until 30 years after the Games. In contrast, the 1984
Los Angeles Olympic Committee exclusively used existing sports venues around the city, spent
less than $1 billion in total to put on the Games, and ended up with a profit of over $200
million51.
Second, while academic economists are nearly universal in their criticism that specialized
sports infrastructure does little to promote economic growth, mega-events often spur spending on
non-sports related infrastructure that may provide for future economic development. Only a
fraction of Beijing’s $22 billion in infrastructure improvements planned for the 2008 Summer
Olympics will be spent on sports facilities, for example. A mega-event may prompt otherwise
reluctant public officials into making needed improvements in general infrastructure.

20
On the other side of the coin, there is, of course, no reason to believe that general
infrastructure improvements necessarily increase economic growth. Even infrastructure that is
not directly sports related may go unused after the completion of the event, or may be a second-
best use of scarce investment capital52. Furthermore, the separation between what is “sports”
infrastructure and what is “general” infrastructure is not always clear. The new Wembley
stadium in London was originally slated to cost around $500 million. In addition, over $150
million in “general” infrastructure improvements were proposed at the same time including new
roads and a completely renovated Underground station. Without the presence of Wembley
Stadium, however, no new roads or subway station would be required. Therefore, from a
objective standpoint, the entire $650 million price tag should be considered specialized sports
infrastructure, and an analysis of the expenditure would likely lead to a negative appraisal of its
economic benefit53.
A third item that local officials should keep in mind is that there are several reasons to
believe that hosting a series of smaller events may result in higher net benefits than a strategy
that encourages large, but infrequent mega-events. First, crowding out is much less likely to
occur during a small event than during a mega-event. It is difficult to believe that large numbers
of travelers will fundamentally change their travel plans due to a relatively minor event such as a
local marathon or amateur track and field event, and therefore these events may get all of the
benefits of increased visitor spending without the costs of displaced visitors. Second, since
smaller events are less likely to cause deviations from normal business patterns, the multipliers
applied for these events are also much more likely to represent an accurate estimate of indirect
spending. Third, while security measures cannot be ignored for these smaller events, the security
costs and the local inconveniences caused by toughened security measures will be orders of

21
magnitude lower than for mega-events. Fourth, lower profile events are less likely to place
additional demands on local organizers such as state-of-the-art facilities and first-class
accommodations for athletes and organizers raising the costs of the hosting. Finally, mega-events
simply require larger (and consequently more expensive) sporting facilities that are likely to be
little used in future. Quite simply put, mega-events cause overinvestment in rarely used sports
facilities54.
The most important piece of advice that a local government can take regarding mega-
events, however, is simply to view with caution any economic impact estimates provided by
entities with a incentive to provide inflated benefit figures. While most sports boosters claim that
mega-events provide host cites with large economic returns, these same boosters present these
figures as justification for receiving substantial public subsidies for hosting the games. The vast
majority of independent academic studies of mega-events show the benefits to be a fraction of
those claimed by event organizers.

22
Endnotes
1. National Football League, “Super Bowl XXXIII Generates $396 Million for South Florida,” NFL Report, 58, no. 7 (1999).
2. Bud Selig, J. Harrington, and Healey, “New Ballpark Press Briefing: July 12, 1999,” www.asapsports.com/baseball/1999allstar/071299BS.html, (accessed August 29, 2000).
3. Dan Ackman, “In Money Terms, The Subway Series Strikes Out,” Forbes Magazine, October 21, 2000.
4. T. Anderson, “St. Louis Ready to Raise NCAA Flag if Atlanta Can’t,” St. Louis Business Journal, January 19, 2001.
5. M. Mensheha, “Home-court Edge: Final Four Promises to be Economic Slam Dunk,” San Antonio Business Journal, March 27, 1998.
6. Robert Baade and Victor Matheson, “Home Run or Wild Pitch? Assessing the Economic Impact of Major League Baseball’s All-Star Game,” Journal of Sports Economics, 2, no. 4 (2001): 307-327.
7. Jeffrey Humphreys, “The Economic Impact of Hosting Super Bowl XXVIII on Georgia,” Georgia Business and Economic Conditions, 54, no. 3 (May-June, 1994).
8. United States Tennis Association, “2000 U.S. Open Nets Record $420 Million in Economic Benefits for New York,” www.usta.com/pagesup/news12494.html, (accessed January 9, 2002).
9. South Africa Football Association, “World Cup Bid Details,” www.safa.ord.za/html/bid_det.htm (accessed January 9, 2002).
10. Jonathan Finer, “The grand illusion,” Far Eastern Economic Review, 7, (March 2002): 32–36.
11. J. Houck, “High-stake Courtship,” FoxSportsBiz.com, January 21, 2000. www.foxsports.com/business/trends/z000120allstar1.sml, (accessed September 14, 2000).
12. Knight Ridder News Service, “Final Four’s Financial Impact Hard to Gauge,” Enquirer Sports Coverage, enquirer.com/editions/1999/03/25/spt_final_fours.html, March 25, 1999, (accessed August 30, 2001).
13. Patrick Anderson, Business Economics and Finance with MATLAB, GIS and Simulation Models, (New York: Chapman & Hall/CRC, 2004), 131.
14. Robert Baade and Victor Matheson, “Mega-Sporting Events in Developing Countries: Playing the Way to Prosperity?” South African Journal of Economics, 72, no. 5 (December 2004): 1084-1095.

23
15. Robert Baade, “Professional Sports as a Catalyst for Metropolitan Economic Development,” Journal of Urban Affairs, 18, no. 1 (1996): 1-17.
16. Dennis Coates and Brad Humphreys, “The Growth Effects of Sports Franchises, Stadia, and Arenas,” Journal of Policy Analysis and Management, 14, no. 4 (1999): 601-624.
17. Phil Porter, “Mega-Sports Events as Municipal Investments: A Critique of Impact Analysis,” in Sports Economics: Current Research, eds John Fizel, Elizabeth Gustafson, and Larry Hadley, (Westport, CT: Praeger Press, 1999).
18. Dennis Coates and Brad Humphreys, “The Economic Impact of Post-Season Play in Professional Sports,” Journal of Sports Economics, 3, no. 3 (2002): 291-299.
19. Victor Matheson, “Contrary Evidence on the Economic Impact of the Super Bowl on the Victorious City,” Journal of Sports Economics, 6, no. 4 (2005): 420-428.
20. Gerald Carlino and N. Edward Coulson, “Compensating differentials and the social benefits of the NFL,” Journal of Urban Economics, 56, no. 1 (2004): 25-50.
21. Dennis Coates, Brad Humphreys and Andrew Zimbalist, “Compensating differentials and the social benefits of the NFL: A comment,” Journal of Urban Economics, 60, no. 1 (2006): 124-131.
22. John Seigfried and Andrew Zimbalist, “The Economics of Sports Facilities and Their Communities,” Journal of Economic Perspectives, 14, no. 3 (2000): 95-114.
23. M. Golovnina, “S. Korean tourism sector in blues despite World Cup,” Forbes.com, http://www.forbes.com/newswire/2002/06/19/rtr636036.html, posted 6/19/2002 (accessed 6/20/2002).
24. Victor Matheson, “Economic Multipliers and Mega-Event Analysis,” College of the Holy Cross Working Paper Series, no. 04-02 (2004).
25. Matheson, “Economic Multipliers and Mega-Event Analysis.”
26.Robert Baade, Victor Matheson, and Mimi Nikolova, “A Tale of Two Stadiums: Comparing the Economic Impact of Chicago’s Wrigley Field and U.S. Cellular Field,” Geographische Rundschau International Edition, 3, no. 2 (April 2007).
27. Seigfried and Zimbalist.
28. Dennis Coates, “Tax Benefits of Hosting the Super Bowl and MLB All-Star Game,” International Journal of Sport Finance,” forthcoming.
29. Soonhwan Lee, “A Review of Economic Impact Study on Sport Events,” The Sport Journal, 4, no. 2 (2001).

24
30. Larry Dwyer, Peter Forsyth, Ray Spurr, “Estimating the Impacts of Special Events on an Economy,” Journal of Travel Research, 43, (May 2005): 1-9.
31. Robert Baade and Richard Dye, “The Impact of Stadiums and Professional Sports on Metropolitan Area Development,” Growth and Change, 21, no. 2 (1990): 1-14.
32. Coates and Humphreys, “The Growth Effects of Sports Franchises, Stadia, and Arenas.”
33. Robert Baade and Victor Matheson, “Home Run or Wild Pitch?”
34. Robert Baade and Victor Matheson, “Bidding for the Olympics: Fool’s Gold?” in Transatlantic Sport: The Comparative Economics of North American and European Sports, eds Carlos Pestanos Barros, Muradali Ibrahimo, and Stefan Szymanski, (London: Edward Elgar Publishing, 2002), 127-151.
35. Robert Baade and Victor Matheson, “An Economic Slam Dunk or March Madness? Assessing the Economic Impact of the NCAA Basketball Tournament,” in Economics of College Sports, eds John Fizel and Rodney Fort, (Westport, CT: Praeger Publishers, 2004), 111-133.
36. Robert Baade and Victor Matheson, “The Quest for the Cup: Assessing the Economic Impact of the World Cup,” Regional Studies, 38, no. 4 (2004): 341-352.
37. Coates and Humphreys, “The Economic Impact of Post-Season Play in Professional Sports”.
38. Robert Baade and Victor Matheson, “Padding Required: Assessing the Economic Impact of the Super Bowl,” European Sports Management Quarterly, 6, no. 4 (December 2006).
39. Robert Baade and Victor Matheson, “Have Public Finance Principles Been Shut Out in Financing New Stadiums for the NFL?” Public Finance and Management, 6, no. 3 (Summer 2006): 284-320.
40. Baade and Matheson, “The Quest for the Cup”.
41. Baade and Matheson, “An Economic Slam Dunk or March Madness?”
42. Coates and Humphreys, “The Economic Impact of Post-Season Play in Professional Sports”.
43. Baade and Matheson, “Home Run or Wild Pitch?”
44. Baade and Matheson, “Bidding for the Olympics: Fool’s Gold?”
45. Robert Baade and Victor Matheson, “An Assessment of the Economic Impact of the American Football Championship, the Super Bowl, on Host Communities,” Reflets et Perspectives, 34, no. 2-3 (2000): 35-46.
46. Baade and Matheson, “Home Run or Wild Pitch?”

25
47. Robert Baade, Robert Baumann, and Victor Matheson, “Selling the Big Game: Measuring the Economic Impact of Mega-Events Through Taxable Sales,” College of the Holy Cross Working Paper Series, no. 05-10 (2005).
48. Dennis Coates, “Tax Benefits of Hosting the Super Bowl and MLB All-Star Game.”
49. Dennis Coates and Craig Depken, II, “Mega-Events: Is the Texas-Baylor game to Waco what the Super Bowl is to Houston?” International Association of Sports Economists, Working Paper no. 06-06 (2006).
50. Julie Hotchkiss, Robert E. Moore, and Stephanie M. Zobay, “Impact of the 1996 Summer Olympic Games on Employment and Wages in Georgia,” Southern Economic Journal, 69, no. 3 (2003): 691-704.
51. Holger Preuss, Economics of the Olympic Games, Edward Elgar Publishing 2004.
52. Baade and Matheson, “Mega-Sporting Events in Developing Countries”.
53. Baade and Matheson, “Mega-Sporting Events in Developing Countries”.
54. Victor Matheson, “Is Smaller Better? A Comment on ‘Comparative Economic Impact Analyses’ by Michael Mondello and Patrick Rishe,” Economic Development Quarterly, 20, no. 2 (May 2006): 192-195.
26
Table 1: Examples of Mega-Event ex ante Economic Impact Studies Event
Year
Sport
Impact
Author
Super Bowl (Atlanta)
1994
Football
$166 million 2,736 jobs
Jeffery Humphreys, Georgia State University1
Super Bowl (Miami)
1999
Football
$393 million
Kathleen Davis, Sports Management Research Institute2
Super Bowl (San Diego)
2003
Football
$367 million
Marketing Information Masters, Inc.3
MLB All-Star Game
1999
Baseball
$75 million
Bud Selig, MLB4
MLB World Series
2000
Baseball
$250 million
Comptroller of New York City5
NCAA Men=s Final Four (St. Louis)
2001
Basketball
$110 million
St. Louis Convention and Visitor=s Bureau6
U.S. Open
2001
Tennis
$420 million
Sports Management Research Institute7
World Cup (Japan)
2002
Soccer
$24.8 billion
Dentsu Institute for Human Studies8
World Cup (South Korea)
2002
Soccer
$8.9 billion
Dentsu Institute for Human Studies9
World Cup
2006/2010
Soccer
$6 billion 129,000 jobs
South Africa Football Association10
Summer Olympics (Atlanta)
1996
Multiple
$5.1 billion 77,000 jobs
Jeffery Humphreys and M. K. Plummer11
Winter Olympics (Vancouver, British Columbia)
2010
Multiple
$10.7 C billion 244,000 jobs
B.C. Ministry of Competition, Science and Enterprise and InterVISTAS Consulting12
1. Jeffrey Humphreys, “The Economic Impact of Hosting Super Bowl XXVIII on Georgia,” Georgia Business and Economic Conditions, 54, no. 3 (May-June, 1994).
2. National Football League, “Super Bowl XXXIII Generates $396 Million for South Florida,” NFL Report, 58, no. 7 (1999).

27
3. National Football League, “Super Bowl XXXVII generates $367 million economic impact on San Diego County,” http://www.nfl.com/news/story/6371262, May 14, 2003, (accessed October 15, 2006).
4. Bud Selig, J. Harrington, and J. Healey, “New Ballpark Press Briefing: July 12, 1999,” www.asapsports.com/baseball/1999allstar/071299BS.html, (accessed August 29, 2000).
5. Dan Ackman, “In Money Terms, The Subway Series Strikes Out,” Forbes Magazine, October 21, 2000.
6. T. Anderson, “St. Louis Ready to Raise NCAA Flag if Atlanta Can=t,” St. Louis Business Journal, January 19, 2001.
7. United States Tennis Association, “2000 U.S. Open Nets Record $420 Million in Economic Benefits for New York,” www.usta.com/pagesup/news12494.html, (accessed January 9, 2002).
8. Jonathan Finer, “The grand illusion,” Far Eastern Economic Review, 7, (March 2002): 32B36.
9. Finer.
10. South Africa Football Association, “World Cup Bid Details,” www.safa.ord.za/html/bid_det.htm (accessed January 9, 2002).
11. Jeffrey Humphreys and M. K. Plummer, “The Economic Impact on the State of Georgia of Hosting the 1996 Summer Olympic Games,” (Athens, Georgia: Selig Center for Economic Growth, The University of Georgia, 1995). 12. InterVISTAS Consulting, “The Economic Impact of the 2010 Winter Olympics and Paralympic Games: An Update,” (British Columbia Ministry of Competition, Science and Enterprise, November 20, 2002).

28
Table 2: Examples of Mega-Event ex post Economic Impact Studies Event
Years
Variable
Impact
Author
MLB All-Star Game
1973-1997
Employment
down 0.38%
Robert Baade and Victor Matheson1
Super Bowl
1973-1999
Employment
537 jobs
Robert Baade and Victor Matheson2
Summer Olympics (Atlanta)
1996
Employment
293,000 jobs
Julie Hotchkiss, Robert Moore and Stephanie Zobay3
Summer Olympics (Atlanta)
1996
Employment
3,500 - 42,000 jobs
Robert Baade and Victor Matheson4
Super Bowl
1970-2001
Personal Income
$91.9 million
Robert Baade and Victor Matheson5
MLB playoffs and World Series
1972-2000
Personal Income
$6.8 million/ game
Robert Baade and Victor Matheson6
NCAA Men=s BB Final Four
1970-1999
Personal Income
down $44.2-$6.4 million
Robert Baade and Victor Matheson7
World Cup
1994
Personal Income
down $4 billion
Robert Baade and Victor Matheson8
Multiple Events
1969-1997
Personal Income/capita
Not statistically significant
Dennis Coates and Brad Humphreys9
Daytona 500
1997-1999
Taxable Sales
$32 - $49 million
Robert Baade and Victor Matheson10
Super Bowl
1985-1995
Taxable Sales
no effect
Phil Porter11
Multiple Events (Florida)
1980-2005
Taxable Sales
down $34.4 million (avg)
Robert Baade, Rob Bauamann, and Victor Matheson12
Multiple Events (Texas)
1991-2005
Gross Sales
Varied - pos. and neg.
Dennis Coates13
Multiple Events (Texas)
1990-2006
Sales Tax Revenue
Varied - pos. and neg.
Dennis Coates and Craig Depken, II14
NHL regular-season games
1990-1999
Hotel Occupancy
Slight increase
Marc Lavoie and Gabriel Rodriguez15

29
1. Robert Baade and Victor Matheson, “Home Run or Wild Pitch? Assessing the Economic Impact of Major League Baseball’s All-Star Game,” Journal of Sports Economics, 2, no. 4 (2001): 307-327.
2. Robert Baade and Victor Matheson, “An Assessment of the Economic Impact of the American Football Championship, the Super Bowl, on Host Communities,” Reflets et Perspectives, 34, no. 2-3 (2000): 35-46.
3. Julie Hotchkiss, Robert E. Moore, and Stephanie M. Zobay, “Impact of the 1996 Summer Olympic Games on Employment and Wages in Georgia,” Southern Economic Journal, 69, no. 3 (2003): 691-704.
4. Robert Baade and Victor Matheson, “Bidding for the Olympics: Fool=s Gold?” in Transatlantic Sport: The Comparative Economics of North American and European Sports, eds Carlos Pestanos Barros, Muradali Ibrahimo, and Stefan Szymanski, (London: Edward Elgar Publishing, 2002), 127-151.
5. Robert Baade and Victor Matheson, “Padding Required: Assessing the Economic Impact of the Super Bowl,” European Sports Management Quarterly, 6, no. 4 (December 2006).
6. Robert Baade and Victor Matheson, “A Fall Classic? The Economic Impact of the World Series,” International Journal of Sport Management and Marketing, forthcoming.
7. Robert Baade and Victor Matheson, “An Economic Slam Dunk or March Madness? Assessing the Economic Impact of the NCAA Basketball Tournament,” in Economics of College Sports, eds John Fizel and Rodney Fort, (Westport, CT: Praeger Publishers, 2004), 111-133.
8. Robert Baade and Victor Matheson, “The Quest for the Cup: Assessing the Economic Impact of the World Cup,” Regional Studies, 38, no. 4 (2004): 341-352.
9. Dennis Coates and Brad Humphreys, “The Economic Impact of Post-Season Play in Professional Sports,” Journal of Sports Economics, 3, no. 3 (2002): 291-299.
10. Robert Baade and Victor Matheson, “High Octane? Grading the Economic Impact of the Daytona 500,” Marquette Sports Law Journal, 10, no. 2 (Spring 2000): 401-415.
11. Phil Porter, “Mega-Sports Events as Municipal Investments: A Critique of Impact Analysis,” in Sports Economics: Current Research, eds John Fizel, Elizabeth Gustafson, and Larry Hadley, (Westport, CT: Praeger Press, 1999).
12. Robert Baade, Robert Baumann, and Victor Matheson, “Selling the Big Game: Measuring the Economic Impact of Mega-Events Through Taxable Sales,” College of the Holy Cross Working Paper Series, no. 05-10 (2005).

30
13. Dennis Coates, “Tax Benefits of Hosting the Super Bowl and MLB All-Star Game,” International Journal of Sport Finance, forthcoming.
14. Dennis Coates and Craig Depken, II, “Mega-Events: Is the Texas-Baylor game to Waco what the Super Bowl is to Houston?,” International Association of Sports Economists, Working Paper no. 06-06 (2006).
15. Marc Lavoie and Gabriel Rodríguez, “The Economic Impact of Professional Teams on Monthly Hotel Occupancy Rates of Canadian Cities: A Box-Jenkins Approach,” Journal of Sports Economics, 6, no. 3 (2005): 314-324.