pd&r research partnerships › portal › sites › default › files › ... · these out to...
TRANSCRIPT

Encouraging Residential Moves to Opportunity Neighborhoods:
An Experiment Testing Incentives Offered to Housing Voucher Recipients
PD&R Research Partnerships

Visit PD&R’s website
www.huduser.govto find this report and others sponsored by HUD’s Office of Policy Development and Research (PD&R). Other services of
HUD USER, PD&R’s research information service, include listservs, special interest reports, bimonthly publications (best
practices, significant studies from other sources), access to public use databases, and a hotline (800-245-2691) for help
accessing the information you need.
PD&R Research PartnershipsPartnering With Universities, Philanthropic Organizations, Other Federal or State Agencies for Innovative Research Projects That Inform HUD’s Policies and Programs
HUD’s Office of Policy Development and Research (PD&R) has authority to enter into unsolicited research partnerships
with universities, philanthropic organizations, other federal or state agencies, or a combination of these entities through
noncompetitive cooperative agreements. The purpose of these partnerships is to allow PD&R to participate in innovative
research projects that inform HUD’s policies and programs. Research partnerships require that at least 50 percent of the
costs are funded by the partnering agency. PD&R is focusing its cooperative agreement efforts on research partnerships
that will advance one of the following five key areas:
1. Homeownership and housing finance;
2. Affordable rental housing;
3. Housing as a platform for improving quality of life;
4. Sustainable and inclusive communities; or
5. HUD assets.

1
ENCOURAGING RESIDENTIAL MOVES TO OPPORTUNITY NEIGHBORHOODS:
AN EXPERIMENT TESTING INCENTIVES OFFERED TO HOUSING VOUCHER
RECIPIENTS
Heather L. Schwartz Policy Researcher, RAND 650 Poydras Ave. Suite 1400 New Orleans, LA 70130 Email: [email protected] Office: 504-299-3404 Kata Mihaly Economist, RAND Email: [email protected] Office: 703-413-1100 x5393 Breann Gala Project Manager, Metropolitan Planning Council Email: [email protected] Office: (312) 922-5616 Date of manuscript: November 16, 2015 Date of revised manuscript: March 4, 2016

2
ACKNOWLEDGEMENTS
We wish to thank the many people who helped make this study happen. First, we wish to thank
The John D. and Catherine T. MacArthur Foundation for funding this research through grant
101434-0. The work that provided the basis for this publication was also supported by funding
under a Grant with the U.S. Department of Housing and Urban Development, Office of Policy
Development and Research. We also acknowledge the staff from the seven public housing
authorities who administered the moving briefings that were at the core of this study. Housing
Choice Partners, Christine Klepper, Executive Director, provided the mobility counseling and
data about that counseling for the study. Breann Gala at the Metropolitan Planning Council
organized the regional effort, and Robin Snyderman helped to carry out the regional plan through
BRicK Partners. We also thank the Chicago Regional Housing Choice Initiative advisors—Alex
Polikoff, BPI Chicago; Dr. Paul Fischer, retired Professor, Lake Forest College; Barbara Sard,
Center on Budget and Policy Priorities; Ianna Kachoris, John D. and Catherine T. MacArthur
Foundation; Ingrid Gould Ellen, New York University; Jeff Lubell, Abt Associates; Juanita
Irizarry, Friends of the Parks (formerly with Chicago Community Trust and Office of Illinois
Governor Pat Quinn); Kalima Rose, PolicyLink; Mary K. Cunningham, Urban Institute; Phil
Tegeler, Poverty and Race Research Action Council; and Stephanie DeLuca, Johns Hopkins
University—for their time devoted to the project. Cole Sutera provided excellent
programmingsupport and was a critical member of the research team. Lydia Taghavi and Ndeye
Jackson matched study data and provided PIC data. Kaitlyn McClain, formerly with the
Metropolitan Planning Council, transcribed housing authority sign-in sheets into usable, digital
data. We thank Jennifer O’Neil for her input on mobility counseling programs. Thank you to
Rolf Pendall for generously sharing Urban Institute’s Neighborhood Advantage Score dataset.

3
The substance and findings of the work are dedicated to the public. The author and publisher are
solely responsible for the accuracy of the statements and interpretations contained in this
publication. Such interpretations do not necessarily reflect the views of the Government, The
MacArthur Foundation, RAND Corporation, or the Metropolitan Planning Council.
ABSTRACT
Substantial benefits can accrue from living in low-poverty neighborhoods, yet approximately
80 percent of the 2.2 million Housing Choice Voucher (HCV) recipients rent homes in moderate-
or high-poverty census tracts. The Chicago Regional Housing Choice Initiative tested several
ways to promote “opportunity moves.” It included the first experiment that tests whether two
types of incentives induce opportunity moves for HCV recipients that had requested a moving
voucher.
Based on the 2,005 HCV recipients in the study, we found that neither the offer of a $500
grant nor the offer of a $500 grant coupled with free mobility counseling induced opportunity
moves. The receipt of mobility counseling also did not boost opportunity moves. Regardless of
the type of offer, 11-12 percent of participants moved to opportunity neighborhoods. Despite
requesting a moving voucher, half of the study participants remained in place, indicating
significant barriers to moving. We offer potential reasons for the results and conclude with two
recommended pilots to increase opportunity moves.
4
INTRODUCTION
Recent research underscores the importance of neighborhood context for adults’ and
children’s outcomes. One strand of this research identifies long-term benefits to adults and
children of moving from high-poverty to lower-poverty neighborhoods (Chetty & Hendren,
2015; Ludwig et al., 2011; Chetty, Hendren, & Katz, 2015). A second strand identifies the
distressing rate at which African Americans, in particular, live generation to generation in high-
poverty neighborhoods (Jargowsky, 2015; Sharkey, 2013).
In recognition of both of these facts, the Department of Housing and Urban Development
(HUD) has pursued policy reforms to enhance the rate at which families with federally-funded
Housing Choice Vouchers (HCV)—48 percent of whom are led by African Americans1—move
to neighborhoods where there are lower concentrations of poor people and racial minorities.
Throughout this article we refer to these upwardly mobile moves as “opportunity moves.”
Despite recent efforts, it remains the case that about 80 percent of the 2.2 million housing choice
voucher recipients rent homes in moderate or high-poverty places (McClure, Schwartz, Taghavi,
2015).
One of the HUD-funded reforms to promote opportunity moves is a pilot called Chicago
Regional Housing Choice Initiative (CRHCI), which was an opportunity to expand the regional
work of PHAs in the Chicago area to test various strategies to facilitate opportunity moves.
CRHCI implemented three types of interventions: (1) a regional waiting list for subsidized rental
housing located in opportunity areas in the Chicago metro area, (2) a centralized entity providing
portability assistance to Housing Choice Voucher (HCV) recipients; and (3) two types of
1 Source: Picture of Subsidized Households, 2013. Retrieved on September 23, 2015 from http://www.huduser.gov/portal/datasets/picture/yearlydata.html.

5
relatively low-cost incentives for HCV recipients to move to opportunity areas in the Chicago
metro area. This evaluation examines the third component of CRHCI.
From November 2012 to October 2014, seven public housing authorities (PHAs) in the
Chicago metro region held mandatory in-person briefing sessions for HCV moving voucher
requestors. The briefing sessions were randomly assigned by the researchers to one of three types
of briefings: (1) “business as usual” that covered the standard information about moving with a
voucher; (2) a briefing that supplemented the standard information with the offer of a $500 grant
if households used their voucher to move to a home in an opportunity neighborhood; (3) a
briefing that supplemented standard information with the offer of both a $500 grant and free
mobility counseling.
To our knowledge, there is no prior study that has rigorously tested whether residential
mobility counseling in and of itself increases opportunity moves for regular housing voucher
recipients. In fact, there is no experimental evidence that demonstrates that any type of incentive
or encouragement (aside from the combination of restricted-use vouchers and mobility
counseling such as were used in Moving to Opportunity) is effective at boosting voluntary
opportunity moves. This study addresses this gap, since we examine the effects of offering two
types of incentives intended to cause voluntary opportunity moves among recipients of regular
Housing Choice Vouchers.
Research questions
In this evaluation, we pose and answer four research questions:
1. Did the offer of two types of incentives ($500 grant; $500 grant plus mobility counseling) induce voucher holders to move to opportunity neighborhoods?
2. Did the take up of counseling induce voucher recipients to move to opportunity neighborhoods?

6
3. Did the offer of two types of incentives and the take up of counseling induce voucher recipients to move to more advantaged neighborhoods if not “opportunity neighborhoods”?
4. What is the profile of voucher recipients who move to opportunity neighborhoods?
Methods
To answer these questions, we implemented a field experiment. Between November 12, 2012
– October 31, 2014, RAND researchers issued automated emails to selected PHA staff at seven
housing authorities asking the designated staff person to offer one of three types of moving
briefings (the type was selected at random by RAND). Using names from the sign-in sheets from
the randomized briefings merged with longitudinal records with families’ residential addresses,
we examined whether either incentive induced households to move to opportunity
neighborhoods or higher quality neighborhoods.
Limitations
There are three notable limitations of this study. The most important one was our inability to
verify in all cases that public housing authority staff complied with the randomized emails
dictating which type of briefing to offer. While we sought to implement rules to ease and check
compliance and a local subcontractor audited a sample of the briefings, we cannot be certain that
staff offered what the sign-in sheets indicated they offered. We account for known discrepancies
between the randomized and actual offered incentive. A related limitation is that we relied on
briefing sign-in sheets to record study participants, and PHA staff were not able to fill in missing
data for those who did not sign-in or to correct illegible names, resulting in the loss of total
participants in the study. The third limitation is that the scope of the study did not include longer-
term data collection about families once they moved; instead, this study was designed to answer

7
the first-order questions whether offering two forms of incentives would induce opportunity
moves.
Overview of the paper
In section 2 we provide context for the study by describing prior research about the two types
of incentives. In section 3, we provide context for the study by explaining CRHCI overall, and
how the study was administered. In section 4, we explain the data and methods we employed,
and present results in section 5. In section 6 we offer a set of recommendations for future
research about mobility counseling.
2. STUDY MOTIVATION AND PRIOR RESEARCH
In this section we first describe the problem that motivated Chicago-area public housing
authorities to pilot CRHCI. We then summarize prior research about the two incentives offered
in this study. Since the term “mobility counseling” includes a bundle of services that have varied
substantially by locality and budget, we devote most of this section to a detailed examination of
the major voluntary mobility programs for housing voucher recipients.
The problem
Experimental and quasi-experimental research has established that moving from high-
poverty to lower-poverty neighborhoods has beneficial effects over the longer term, especially
for children (for recent results see: Chetty & Hendren, 2015; Ludwig et al., 2011; Chetty,
Hendren, & Katz, 2015). Yet analyses of the largest tenant-based subsidy program in the United
States—the Housing Choice Voucher program2—which theoretically allows low-income
2 The Housing Choice Voucher (HCV) program is a federally-funded program costing approximately $19 billion per year that provides housing subsidies to approximately 2.2 million low-income households in the U.S. The voucher defrays costs to a low-income participant to rent a home in the private market. Tenant-based rental assistance, which

8
voucher recipients to make upwardly mobile residential moves reveals that such moves are
relatively uncommon. The most recent national data about the voucher program indicates that 21
percent of voucher recipients rent homes located in low-poverty neighborhoods with 10 percent
or less poverty (McClure, Schwartz, Tagavi, 2015). This is essentially the same proportion of
voucher holders who lived in low-poverty census tracts a decade prior.
With these and similar results in mind, HUD and housing mobility advocates have sought
policy levers to increase the rate at which HCV recipients move to low-poverty neighborhoods.
For example, in 2015, HUD issued a major update to its Affirmatively Furthering Fair Housing
Rule that significantly increases requirements for federal grantee jurisdictions like counties to
identify barriers to fair housing in their jurisdiction as part of their comprehensive plan, which
HUD reviews and approves. These more stringent stipulations could have the effect of increasing
affordable housing in opportunity areas. The President’s 2017 budget includes a new $15 million
mobility counseling pilot for 10 localities to test whether mobility counseling promotes
opportunity moves. Other relevant policy changes include: piloting Small Area Fair Market
Rents to capture finer grained housing market price differences that could increase the cap of the
voucher for higher-cost areas; streamlining portability procedures to make opportunity moves
easier (Federal Register 5453); and legal advocacy for “source of income” protection to prevent
landlord discrimination against voucher recipients (PRRAC, 2015), which is correlated with
has evolved over time into the HCV program, started in 1974, and voucher recipients contribute 30 percent of their income after certain adjustment to the combination of rent and utilities. The federal government pays the balance of the rent, up to a price cap that is set by state and local agencies based on HUD-determined metropolitan or county “fair market rent” (FMR), which is usually at the 40th percentile of recently rented non-luxury units. There are exceptions such as in Chicago where the price cap is set at the 50th percentile. At least 75 percent of new families admitted each year to an agency’s HCV program must have income at or below 30 percent of the area median income, which is approximately the federal poverty line. Program rules also stipulate that the rental home that the voucher recipient selects must pass a physical inspection to meet Housing Quality Standards (HQS).

9
voucher recipients’ location in less racially segregated neighborhoods (Metzger, 2014). In
addition, HUD along with the Chicago Community Trust, The MacArthur Foundation, and Cook
County CDBG program funded the Chicago-area pilot that is the subject of this study.
Barriers to voucher recipients moving to opportunity neighborhoods
Researchers and practitioners have identified a long list of barriers that help to explain the
relatively low rates at which HCV recipients move to opportunity neighborhoods. The most
frequently mentioned ones include the following:
Low subsidy amount relative to prevailing market rents. The cap on the voucher subsidy is
often too low for families to afford the rent in opportunity neighborhoods.3 Although some
PHAs have obtained permission from HUD to raise the cap through exception payment
standards, it is generally in modest amounts and does not fully resolve the challenge that rents
can vary significantly across a metro area. A metro-wide standard produces a voucher payment
cap that does not make housing affordable in all locations within the region (Edin, DeLuca,
Owens, 2012; Basolo & Nguyen, 2006; McClure, 2006).
Lack of affordable rental housing in target areas. There is a limited supply of multifamily
rental dwellings in low-poverty neighborhoods due to zoning stipulations (Rothwell, 2012;
Pendall, 2000), and multifamily rentals tend to be more affordable than single family ones.
3 HUD publishes and annually updates metropolitan-wide Fair Market Rents (FMR) and county FMRs in non-metropolitan areas, which are usually set at the 40th percentile of recently rented non-luxury units. Housing agencies administering the HCV program may cap the value of HCV subsidy at 90 – 110 percent of the FMR, or else obtain HUD approval to set the cap higher or lower. Starting in fiscal year 2013, HUD has tested via a demonstration program setting capped voucher subsidy levels by “Small Area Fair Market Rents,” which has the effect of increasing subsidy in higher cost zip codes and lowering them in low-cost ones (Kahn & Newton, 2013). HUD has since published “hypothetical” small area fair market rent levels by zip code to allow PHAs to adjust their fair market rent levels if the PHA so wished for its tenant-based vouchers so long as the adjusted rate remains within 90 to 110 percent of the metro-wide FMR. See Fischer (2015) for more detail on the small area FMRs.

10
However, the supply of affordable rentals4 in low-poverty census tracts exceeds the numbers of
voucher recipients leasing homes in those places; McKlure (2013) found that 26 percent of all
affordable rental units in 276 metropolitan areas were located in low-poverty tracts, yet 19
percent of voucher households in those metro areas located in low-poverty tracts.
Time limits for the housing search. The vouchers that PHAs issue to tenants typically expire
after 90 days, meaning the voucher recipients must locate a home, the housing authority must
inspect it, approve it, and the tenant enter into a lease with the landlord and the PHA enter into a
contract with the owner within that 90-day timeframe. Some PHAs have increased search time to
120 or even 180 days, but the combination of scarce housing combined with bureaucratic delays
in processing vouchers can result in expired, unused vouchers for mobility moves (Pashup et al.,
2005).
Landlord resistance to Housing Choice Vouchers. Documented discrimination by landlords
against voucher recipients is widespread (Varady & Walker, 2007; Turner and Ross 2005;
Yinger 1995). Landlord interviews have also identified a variety of other barriers including
upfront financial risk from longer lease-up times to fulfill HCV program requirements5; unclear
ways to gauge the financial soundness of a subsidized tenant; misunderstanding of the HCV
program; incurred costs of upgrading the unit to meet unit inspection requirements; and delays in
rent payments from the housing authority (Greenlee, 2014; Pashup et al., 2005). By contrast,
4 “Affordable rentals” means ones with rents less than the Fair Market Rent value that HUD publishes. 5 Once a moving voucher recipient has identified a rental unit he or she wishes to rent, she must complete a request for lease approval form which the landlord must sign to indicate his/her willingness participate in the program. Once the PHA received the signed form, the PHA schedules an inspection of the unit, which may or may not trigger re-inspections if shortcomings are identified for remedy. Once the unit has passed inspection, the PHA issues a contract to the voucher holder, who must get it signed by the landlord and then resubmit it to the PHA. Then once that is submitted, families can move in. Also, the Housing Assistance Payment contract between the PHA and landlord must be processed before landlords begin to receive the subsidized portion of the rent.

11
qualitative work has identified strategic practices by landlords in non-opportunity areas to recruit
certain voucher recipients that are a captive market for hard-to-rent units (Rosen, 2014)
Administrative burden of porting. Moving from high-poverty to low-poverty neighborhoods
can often require crossing a PHA jurisdictional line, which is possible to do with a housing
voucher, but which triggers increased administrative burden both for the voucher recipient and
the sending and receiving PHAs (Edin, DeLuca, Owens, 2012).
Lack of public transportation for rental homes in opportunity neighborhoods. The lack of a
car6 combined with lack of regular public transit service constrains voucher recipients’ housing
search and/or willingness to live in opportunity areas without public transit (Pendall et al., 2014;
Briggs, Comey, and Weisman, 2010; Rosenblatt and DeLuca, 2012; Dawkins, Jeon, & Pendall,
2015).Voucher holders rank accessibility a top concern according to housing counselors (Varady
and Walker 2000, 2007).
Quality of home versus quality of neighborhood. In interviews and focus groups, voucher
recipients have often expressed greater preference for higher quality housing—i.e., more rooms,
more square footage—than for smaller units in lower-poverty places (Rosenblatt & DeLuca,
2012; DeLuca, Wood, Rosenblatt, 2011; Boyd et al., 2010; Wood, 2011). Thus the type of
affordable rental housing that is available in opportunity areas (e.g., an older walk-up garden
apartment) may not be as attractive to voucher recipients as a more recently rehabilitated rental
unit in a lower cost non-opportunity area.
6 As a yardstick for car ownership rates among voucher recipients, in Moving to Opportunity, 37 percent of the participants owned cars (MTO participants were living in urban public housing), whereas 65 percent of Welfare to Work participants owned cars (Pendall et al., 2014).

12
Reactive moves. Based on 140 interviews with voucher movers, researchers identified that
approximately 70 percent of moves were for “reactive,” unpredicted reasons like plumbing
failures, heat outages, the sale of the unit that then required the tenant to move out,failed housing
inspection for current voucher recipients, or job loss (DeLuca, Rosenblatt, Wood, forthcoming;
Wood, 2011; Schacter 2004). Urgency inhibits opportunity moves, which mobility counselors
say require training of families, exposure to new places, advance planning, and often longer
search times (Darrah & DeLuca, 2014).
Limited information. Especially when performing a housing search in a time crunch,
qualitative research indicates that voucher recipients turn to relatives, friends, friends of friends,
or local “for rent” signs to find alternate rental housing, which has the effect of limiting their
choice set (Hartung and Henig, 1997). Another common information source is the list of rentals
that PHAs have on hand, which are often composed of landlords in non-opportunity areas who
have added themselves to a rental housing list (Pashup et al., 2005; Varady and Walker, 2007;
DeLuca, Rosenblatt, Wood, forthcoming).
Limited resources, including time. A series of personal factors like limited funds to conduct
and enact the search, paying for a security deposit, paying for movers, health problems, and the
lack of time to do searches are additional barriers to opportunity moves (Pashup et al., 2005;
Briggs, Comey, Weisman, 2010; Cunningham & Popkin, 1999; Marr, 2005).
Familiarity, social ties, acceptance. All else equal, many families prefer a “comfort zone”
where relatives or important social institutions like church are close by and where the family will
not be socially rejected for their race and class (Charles 2005). Of course, proximity to family
and friends can also be a “draining tie” that can push renters out of their current neighborhood
(Briggs, Comey, Weisman, 2010). But there is evidence that those with fewer social ties to the

13
old neighborhood are more likely to make opportunity moves (Shroeder, 2003; Briggs, Comey,
and Weisman, 2010).
Two potential ways to reduce barriers: mobility counseling and financial incentives
Given the focus of the CRCHI pilot, we focus here on research about mobility programs that
HCV clients voluntarily use rather than the services offered for mandatory relocations that occur
when families are forcibly displaced from their homes due to either the demolition or expiration
of subsidized housing.
Mobility counseling
Number of programs. Based on their 2015 scan, the Poverty and Race Research Action
Council identified 15 voluntary mobility counseling programs currently operating in the U.S., the
largest of which are court-ordered desegregation remedies in Dallas and Baltimore, but the
majority of which are smaller locally-funded programs. While we are not aware of a
comprehensive census of PHAs’ mobility counseling programs, a 1997 scan identified 52
assisted mobility programs (Turner & Williams, 1997), indicating a decline in such programs for
voucher recipients from the 1990s to today.
Features of mobility counseling. There is no uniform definition of mobility counseling, but it
typically includes: (a) landlord outreach by organizations to identify landlords in opportunity
areas who will accept voucher tenants; (b) counselors offering customized search assistance to
tenants to support tenants’ own search; and (c) modest transportation subsidies to clients to help
them view units. As Table 1 and Table 2 reveal, that generic definition masks meaningful
distinctions among the largest and best-known mobility counseling programs.

14
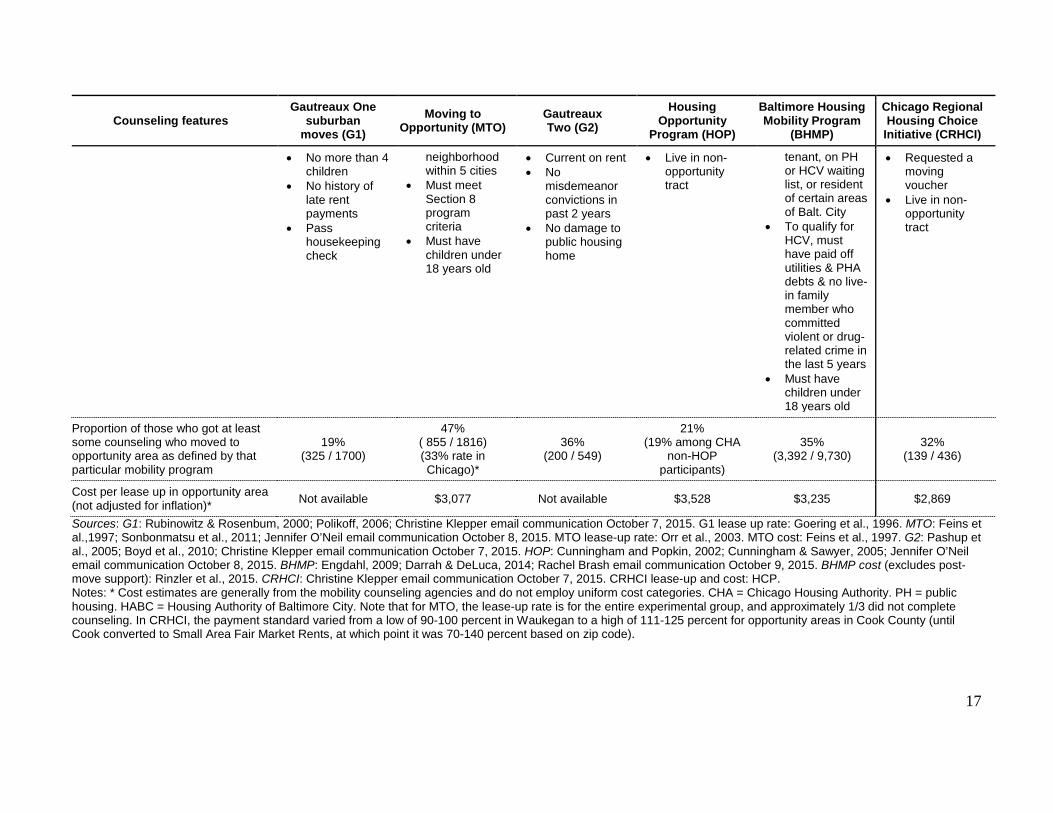
Table 1 summarizes the program design features of the five current or former voluntary
mobility programs for either public housing residents or voucher recipients about which there is
peer-reviewed published research. It reveals that the opportunity-oriented mobility counseling
programs operated within highly varied policy contexts, ranging from court-ordered remedies
with specially funded vouchers to mobility programs that operate within the regular HCV
voucher program.
Table 2 documents the substantial variation in the amount and intensity of counseling
services offered through each mobility program. Programs range from a more counselor-led
approach (as typified by the early years of the Gautreaux One program) to a more client-led
approach (as typified by the counseling program in this study and its most similar counterpart,
Housing Opportunity Program).
Taken together, the two tables comport with the general points that Cunningham et al. make
in their 2010 scan of mobility assistance programs: these programs set the bar for opportunity
neighborhoods at different levels; carry different counselor caseloads and stipulate different
counselor qualifications; lack funding for long term implementation; generally do not collect
outcomes data or cost data in a comparable way; and have varied landlord outreach mechanisms.
The five programs included in Tables 1 and 2are arranged left to right by the start date for the
mobility counseling program. The first is Gautreaux One, which was a court-ordered
desegregation remedy for families living in or on the waiting list for Chicago Housing Authority
public housing (see Rubinowitz & Rosenbum, 2000). Moving to Opportunity, by contrast, was a
randomized controlled trial that offered restricted-use vouchers to a randomly selected group of
public housing recipients in five cities who lived in tracts where 40 percent or more of the
neighborhood population lived in poverty (see Sonbonmatsu et al., 2011). Gautreaux Two was a

15
continuation of the Chicago court-ordered remedy, but was a second iteration of mobility
counseling with distinct features from the first (see Pashup et al., 2005). The Housing
Opportunity Program was funded by the Chicago Housing Authority and is the other program
listed in Table 1 besides CRCHI that involved regular rather than special-purpose housing
vouchers (see Cunningham and Popkin, 2002). Finally, the Baltimore Housing Mobility Project
is a court-ordered desegregation remedy for Baltimore City public housing tenants others and it,
too, involves special-purpose housing vouchers (see Darrah & DeLuca, 2014). As a reference for
the reader, the final column indicates the features of the mobility program examined in this
study, which we describe in more detail in Section 3.

16
TABLE 1. THE PROGRAM FEATURES OF VOLUNTARY HOUSING MOBILITY PROGRAMS FOR HCV CLIENTS
Counseling features Gautreaux One
suburban moves (G1)
Moving to Opportunity (MTO)
Gautreaux Two (G2)
Housing Opportunity
Program (HOP)
Baltimore Housing Mobility Program
(BHMP)
Chicago Regional Housing Choice
Initiative (CRHCI)
Years of operation 1976 - 1998 families enrolled 1994 - 1998 2002 - 2005 1998 - 2010 2003 -
current 2012 - 2014
Definition of opportunity
<=30% African American <=10% poverty
<23.49% poverty <30% African
American <=23.49% poverty
Until 2015, <=10% poverty, <=30%
African American, <=5% subsidized housing residents.
After 2015, composite index.
Generally, tracts rated 6-10 on a
HUD-created index factoring in poverty, housing stability, job
& transit access, school quality, &
employment
Targeted vouchers that must be used in opportunity area
Regional administration of vouchers
Geographic area of operation Chicago metro
Baltimore, Boston, Chicago, Los
Angeles, New York Chicago metro Chicago Baltimore metro Chicago metro
Program administrator Leadership
Council 8 different
nonprofit orgs.
Leadership Council, then Housing
Choice Partners
CHAC Inc. (subsidiary of
Quadel)
Metro Baltimore Quadel, then
Baltimore Regional Housing Partnership
Housing Choice Partners
Nonprofit administrator administered vouchers
Voucher payment standard as percent of Fair Market Rent 120 100 100 110 Up to 130 90 – 140%*
Time limit for housing search 180 days 90 days 180 days to unlimited
90 days with extensions
180 days with extensions 90-180 days
Length of stay requirement one year minimum one year minimum none none two year minimum none
Client eligibility restrictions • CHA PH tenant or PH waiting list
• Current PH tenant in high poverty
• CHA PH tenant or PH waiting list
• In HCV program for at least 1 year
• Current or former HABC family PH
• In HCV program for at least 1 year
17
Counseling features Gautreaux One
suburban moves (G1)
Moving to Opportunity (MTO)
Gautreaux Two (G2)
Housing Opportunity
Program (HOP)
Baltimore Housing Mobility Program
(BHMP)
Chicago Regional Housing Choice
Initiative (CRHCI)
• No more than 4 children
• No history of late rent payments
• Pass housekeeping check
neighborhood within 5 cities
• Must meet Section 8 program criteria
• Must have children under 18 years old
• Current on rent • No
misdemeanor convictions in past 2 years
• No damage to public housing home
• Live in non-opportunity tract
tenant, on PH or HCV waiting list, or resident of certain areas of Balt. City
• To qualify for HCV, must have paid off utilities & PHA debts & no live-in family member who committed violent or drug-related crime in the last 5 years
• Must have children under 18 years old
• Requested a moving voucher
• Live in non-opportunity tract
Proportion of those who got at least some counseling who moved to opportunity area as defined by that particular mobility program
19% (325 / 1700)
47% ( 855 / 1816) (33% rate in Chicago)*
36% (200 / 549)
21% (19% among CHA
non-HOP participants)
35% (3,392 / 9,730)
32% (139 / 436)
Cost per lease up in opportunity area (not adjusted for inflation)* Not available $3,077 Not available $3,528 $3,235 $2,869
Sources: G1: Rubinowitz & Rosenbum, 2000; Polikoff, 2006; Christine Klepper email communication October 7, 2015. G1 lease up rate: Goering et al., 1996. MTO: Feins et al.,1997; Sonbonmatsu et al., 2011; Jennifer O’Neil email communication October 8, 2015. MTO lease-up rate: Orr et al., 2003. MTO cost: Feins et al., 1997. G2: Pashup et al., 2005; Boyd et al., 2010; Christine Klepper email communication October 7, 2015. HOP: Cunningham and Popkin, 2002; Cunningham & Sawyer, 2005; Jennifer O’Neil email communication October 8, 2015. BHMP: Engdahl, 2009; Darrah & DeLuca, 2014; Rachel Brash email communication October 9, 2015. BHMP cost (excludes post-move support): Rinzler et al., 2015. CRHCI: Christine Klepper email communication October 7, 2015. CRHCI lease-up and cost: HCP. Notes: * Cost estimates are generally from the mobility counseling agencies and do not employ uniform cost categories. CHA = Chicago Housing Authority. PH = public housing. HABC = Housing Authority of Baltimore City. Note that for MTO, the lease-up rate is for the entire experimental group, and approximately 1/3 did not complete counseling. In CRHCI, the payment standard varied from a low of 90-100 percent in Waukegan to a high of 111-125 percent for opportunity areas in Cook County (until Cook converted to Small Area Fair Market Rents, at which point it was 70-140 percent based on zip code).

18
TABLE 2. THE SERVICES PROVIDED BY VOLUNTARY HOUSING MOBILITY PROGRAMS FOR HCV CLIENTS
Services provided Gautreaux One
suburban moves (G1)
Moving to Opportunity (MTO)
Gautreaux Two (G2)
Housing Opportunity
Program (HOP)
Baltimore Housing Mobility Program
(BHMP)
Chicago Regional Housing Choice
Initiative (CRHCI)
Identify supply of affordable rental housing
Aggressive landlord recruitment in opportunity areas
Low-interest loans for developers if
accept G1 tenants. Landlord outreach
dropped in later years.
Varied by city no
Varied, but typically 1-2 landlord
outreach staff no
Counseling services
Individual needs assessment (health problems, drug abuse, family conflict)
Housekeeping home visits (not all cities) no no no
Counseling is mandatory to receive housing assistance no orientation session
mandatory no no
Group orientation session
Workshops (e.g., budgeting, housing search) varied 4 mandatory
workshops no
Individual counseling sessions weekly contact weekly contact
Free credit reports no no no optional optional
Credit counseling as needed as needed no no no
Budgeting skills no as needed no
Housing search assistance
Tours of potential neighborhoods no no
Families placed on waiting list for pre-identified homes no no no no no

19
Counselor provides lists of available units (either from public sources like Trulia or from self-developed lists)
no
Counselor shows units to client
0.2 units/client in Chicago up to 2.5 in
L.A. no
(for approx. 1 in 12)
Counselor monitors that lease-ups are not concentrating in particular neighborhoods
no No
Counselor ensures that lease-ups are not adjacent to vacant or abandoned homes
no no no no
Program provides transportation to visit units as needed as needed as needed as needed routinely as needed
Counselor contacts landlords about units on behalf of clients
3/4 in LA & NYC; Less than1/2 in Bos.,
Balt., Chicago no
Counselor accompanies voucher recipient on unit visits
more often in beginning
25% in Chicago up to 79% in Balt. no
(for approx. 1 in 12)
Counselors inspect potential homes separate from Housing Quality Standards (HQS) inspection
no no during some, but not all, years
BHMP staff do inspections no
Expedited HQS inspections special leasing
officers in each PHA no no
Counselor assists with arranging inspections and lease approvals no as needed
Counselor negotiates directly with landlords
no
initial guidance to landlords about
leasing process and answered Qs about rent determination
Moving cost assistance no no no loan later converted to $500 grant $500 grant

20
Post-move support
Counselors conduct post-move calls no no
Counselor conducts post-move home visits No
Assistance to purchase car no no no no no
Landlord mediation no no no no
Referrals to social service agencies no no no
Sources: G1: Rubinowitz & Rosenbum, 2000; Polikoff, 2006; Christine Klepper email communication October 7, 2015. MTO: Feins et al.,1997; Sonbonmatsu et al., 2011; Jennifer O’Neil email communication October 8, 2015. G2: Pashup et al., 2005; Boyd et al., 2010; Christine Klepper email communication October 7, 2015. HOP: Cunningham and Popkin, 2002; Cunningham & Sawyer, 2005; Jennifer O’Neil email communication October 8, 2015. BHMP: Engdahl, 2009; Darrah & DeLuca, 2014; Rachel Brash email communication October 9, 2015. CRHCI: Christine Klepper email communication October 7, 2015. Notes: CHA = Chicago Housing Authority. PH = public housing. HABC = Housing Authority of Baltimore City.

21
Based on their extensive analysis of the eight nonprofit counseling agencies who worked in
MTO, Feins, McInnis, and Popkin (1997, pg. A-112) identified the following five characteristics
as “vital” for opportunity moves:
1. motivating families to move to low-poverty places; 2. informing families about suitable neighborhoods; 3. locating units on behalf of clients; 4. helping clients search effectively on their own; and 5. intervening with landlords and PHAs to ensure a lease-up occurs.
Taken together, the five characteristics indicate a fairly intensive counselor-led search process
that involves tours to expose clients to new neighborhoods, encouraging clients to keep up
morale for opportunity moves, and, in some cases, providing services that a real estate agent
would typically provide to find specific homes on behalf of clients (as opposed to generic lists of
available rentals), and then acting in an advocate role on behalf of tenants by interacting with
landlords and PHAs during the lease-up phase. MTO counseling agencies also indicated as
“essential” the post-move check-ins to help families integrate into their receiving
neighborhoods” for those needing the most intensive services, which has been confirmed in other
research examining the longevity of post-move residency in the opportunity area (Boyd et al.,
2010). We return to these themes in the discussion in Section 5.
Profile of mobility movers. Prior research indicates that although the clients these mobility
programs serve are quite disadvantaged, those who make opportunity moves are relatively more
advantaged than those who do not. As shown in Table A1 of the Technical Appendix,
opportunity movers tend to have smaller families (MTO, Gautreaux Two), younger heads of
household, higher incomes (Cunningham & Sawyer, 2005), fewer health problems (Gautreaux
Two), more likely to be white than black (Gautreaux Two) and more likely to be black than
Hispanic (MTO), have a car (or at least a license), and are less likely to have a disabled family

22
member (Pashup et al., 2005; Schroder, 2003). As expected, greater vacancy rates in the local
housing market are also positively associated with opportunity moves (Schroder, 2003). In MTO,
which collected significant amounts of primary data at baseline, those in the experimental group
who successfully leased up were more likely to be dissatisfied with their current neighborhood
and expressed greater comfort with the idea of their child enrolling in a nearly all-white school
and with moving a greater distance from the original neighborhood (Schroder, 2003).
Relationship between counseling and opportunity moves. MTO offers the closest
approximation in that it compares a randomly-selected group of families who were offered
regular voucher with no locational constraint nor counseling to a second randomly-selected
group of families who were offered both a restricted voucher (i.e., a voucher that could only be
applied in tracts with equal to or less than 10 percent poverty) and optional, free mobility
counseling.7 Schroder (2003) found that the geographic restriction on the voucher for the second
group lowered lease-up rates by 14 percentage points, but that the intensity of counseling
services counteracted and almost neutralized the penalty of the special housing voucher’s
geographic restriction. In other words, the intensity of counseling was positively correlated with
opportunity moves. Qualitative analyses of the MTO counseling also found positive correlation
between the intensity of counseling and the search (number of units identified by client, number
of units identified by counselor, completion of counseling) and opportunity moves (Feins,
McInnis, and Popkin, 1997).
7 Two other salient distinctions between MTO and CRHCI is that CRHCI eligibility was not restricted to families with children, and that CRCHI examines a group of HCV recipients living in non-opportunity areas who requested a moving voucher as compared to MTO which targeted residents living in public housing in high poverty neighborhoods.

23
Additional studies of mobility counseling for voucher recipients examine the correlation
between the intensity and type of counseling received and generally find that it is positively
associated with an increase in the rate of opportunity moves. For example, McClure (2006)
identified the intensive mobility counseling from Gautreaux One as essential to achieving the
remarkably durable opportunity moves; a majority of the families who had moved to low-
poverty, white neighborhoods were still there 15 years later or more (Keels et al. 2005; DeLuca
et al. 2010).
When taken together, these positive findings, while not causal, provide some indication that
the more intensive the counseling, the greater the rate of opportunity moves. Further, qualitative
research has identified several weaknesses about low-intensity counseling. Focus groups of
mobility counseling participants indicate that voucher recipients can feel overwhelmed by
information during the orientation session of counseling and then find it hard to access
counselors during the housing search (Popkin & Cunningham, 1999; Popkin et al., 2000; Pashup
et al., 2005). Examining Gautreaux Two, researchers noted that in having to conduct their own
housing search and to call each time to learn if a home was in or not in an opportunity area, the
mobility counseling placed a “considerable burden on even the ablest participants” (Pashup et
al., 2005). In the absence of tours or counselor-led identification of units, clients’ lack of
familiarity with the opportunity areas to which they could move also inhibited their search (ibid).
The positive correlation between the intensity of counseling and the successful use of a
voucher to lease a rental home in an opportunity neighborhood does not necessarily mean that
counseling caused those moves, since families who self-select into intensive counseling may be
more motivated and thus likely to move to opportunity areas. Further, the cost of intensive
counseling—especially when factoring in longer-term post-move counseling, which was not

24
included in Table 1—can be prohibitive for the already limited PHA budgets. Lowering the cost
of opportunity moves was one of the primary motivations for the CRHCI pilot and for HUD’s
investment in lower intensity offerings like a $500 grant or a limited amount of counseling.
Security deposit or cash assistance
Number of programs. To our knowledge, nine localities offer some kind of security deposit
assistance as part of a HCV mobility strategy as of 2015: Baltimore; Buffalo, N.Y.; Chicago;
Connecticut; Dallas; Joliet, Ill.; King County Wash.; and Philadelphia (Rosenblatt & Cossyleon,
2015; PRRAC, 2015). However, we suspect this count is low, as a 2010 scan of 11 mobility
counseling programs included other cities like Yonkers, San Diego, Atlanta, Boston, Las Vegas,
and Pittsburgh and reported that “most” of these cities offered heightened financial assistance for
security deposits or moving costs for opportunity moves (Cunningham et al., 2010).
Relationship between assistance and opportunity moves. Research about the effect of grants
or low-interest loans for security deposits on mobility moves is virtually non-existent. We were
able to locate one study (Rosenblatt & Cossyleon, 2015) that examined security deposit
assistance as relates to opportunity moves in Milwaukee. The Milwaukee County Security
Deposit Assistance program offered $1,000 grants to HCV movers who leased an apartment in
designated suburban localities. As of December 2014, a total of 179 HCV recipients had signed
up to receive more information about the assistance, and 18 of them had successfully rented and
leased the home (18/179 = 10 percent). The conclusion of that study was that the deposit
incentive needs to be combined with other HCV policy changes to meaningfully boost
opportunity moves.
25
3. STUDY CONTEXT AND IMPLEMENTATION
In this section we describe the Chicago Regional Housing Choice Initiative. We then explain
the incentives and how they were offered and administered. We refer readers to the Technical
Appendix at [[URL here]] for a detailed explanation each type of moving briefing, staff training,
auditing of briefings, administration of the $500 grant, and mobility counseling elements.
Overview of CRHCI
The Chicago Regional Housing Choice Initiative was a pilot that involved a year-long
planning process and then ran from October 2011 to October 2014. The pilot had the following
three components:
• Component 1: Operate a regional project-based voucher program that aims to increase the supply of affordable housing in opportunity areas and form a regional waiting list to more efficiently lease developments.
• Component 2: Create a portability procedure that could make portability easier for HCV clients.
• Component 3: Test two types of incentives to induce HCV voucher recipients to move to opportunity neighborhoods.
CRHCI was implemented by a combination of seven public housing authorities that are all in
the Chicago metro area8, the Metropolitan Planning Council (a regional policy and planning
advocacy organization in Chicago) and Housing Choice Partners (HCP), a fair housing and
mobility counseling organization. HUD provided $1 million in funding for the pilot, and HCP
raised $397,433 additional funds to cover additional implementation costs.9
8 The seven housing authorities are: Chicago Housing Authority, DuPage Housing Authority, Housing Authority of Cook County, Lake County Housing Authority, McHenry County Housing Authority, Oak Park Housing Authority, and Waukegan Housing Authority. 9 The Chicago Community Trust contributed $200,000 to HCP for implementation, and the Cook County CDBG program supplemented counseling costs at $187,953. Separately, The John D. and Catherine T. MacArthur Foundation also funded RAND to lead an independent evaluation of the third component of CRHCI. Included in the RAND evaluation budget are funds for the Metropolitan Planning Council to audit briefings and collect data and for Housing Choice Partners to collect counseling data.

26
Definition of opportunity areas
With some exceptions that are explained in the Technical Appendix, CRHCI partners defined
as “opportunity” any census tract in their region that had a rating of 6-10 on a HUD composite
index that equally weighted six indexes about poverty, housing stability, job access, labor market
engagement, school performance, and transit access. Tracts with a rank of 1 to 5 qualified as a
non-opportunity or “traditional” neighborhood. Figure 1 shows a map of tracts rated 6-10 on the
opportunity index scale.
FIGURE 1. MAP OF OPPORTUNITY AREAS

27
Source: HUD Fair Housing and Equity Assessment data
Table 3 shows that the resulting demographic profile of the opportunity neighborhoods had
lower rates of poverty and non-White residents than the thresholds applied in any of the other
major HCV mobility programs (see Table 1). Specifically, CRHCI used a definition that resulted
in an average poverty rate of opportunity tracts of 6 percent, and 4 percent of the population was
African American. By comparison, the Chicago’s HOP program defined as opportunity any
census tract with less than 23 percent poverty.
TABLE 3. DESCRIPTIVE CHARACTERISTICS OF OPPORTUNITY TRACTS
Place Total
number of census tracts
Percentage of tracts that are
opportunity
Opportunity tracts
Percent in poverty
Percent African
American Percent White
Percent non-White Hispanic
Percent of rentals that are vacant
City of Chicago 809 40 8.7 5.9 56.1 28.8 5.4
Cook County 498 60 4.8 2.9 73.2 13.2 5.0
DuPage County 214 89 4.2 4.1 73.3 10.2 5.5
Lake County 124 78 3.7 2.2 78.8 9.7 4.9
McHenry County 52 71 5.1 1.1 83.9 10.9 5.3
Town of Oak Park 14 64 4.0 14.5 71.3 6.0 7.3
City of Waukegan 30 10 4.4 4.6 75.8 11.0 0.0
Total 1,741 55 5.9 4.1 68.4 17.3 5.2 Source: 2013 5-year estimate American Community Survey tract-level data. Notes: There were 862 tracts originally identified as opportunity tracts using 2000 Census boundaries. By 2010, the original tracts had split into 959 tracts per 2010 Census boundaries. All 959 are included here. Tracts are only counted once in the table—e.g., a Chicago tract that is also in Cook County is only shown for Chicago.
The process for offering the incentives
Unlike some of the mobility counseling programs we describe in Section 2 such as Moving
to Opportunity, CRHCI focused exclusively on HCV participants that have been part of the HCV
program for at least one year and were interested in moving to a different rental home with a

28
voucher.10 After contacting the PHA to request moving papers, the PHA staff then schedule the
client to attend an in-person moving briefing held at the PHA’s office. PHA staff typically
inform the HCV client about the standing schedule of moving briefings (e.g., that they occur
every Wednesday) and advise the client to attend the next scheduled briefing. Depending on the
size of the PHA’s voucher program, these briefings might occur multiple times per week with
large groups of people at each briefing, or in the smallest PHAs the briefings might be one-on-
one and performed on demand by PHA staff.
The head of household or actual voucher holder must attend this briefing. Attending the
moving briefing is a precondition for the HCV recipient to receive a moving voucher. In other
words, a HCV recipient may not move from one apartment to another with a single voucher; the
move triggers the expiration of one voucher and the issuance of a new one.
Moving briefings
The moving briefing is the linchpin of this research study. It is the place where voucher
recipients receive their moving papers and a moving voucher, and it is also the date at which the
clock starts ticking on the housing search time limit; the voucher recipient must find a rental
home for lease within as few as 90 days or, depending on PHA discretion, as many as 180 days
in the case of some PHAs in the study.
RAND research staff emailed participating PHA staff who hosted the moving briefings with
directions to offer one of three types of briefings (the type was selected at random). The auto
email was delivered around 4 pm CT and referred to the type of briefing that was to be offered
10 In the HCV program, households can request to move after living in their current apartment for 12 months as long as they have not violated their lease and are in good standing with their PHA’s HCV program. HCV participants start the moving process by requesting moving papers from the PHA that administers their voucher and then notifying their landlord that they intend to move. HCV clients can request moving papers up to 60 days before lease expiration in the current apartment.

29
the next day. An example of the email is included in the Technical Appendix. Depending on the
emailed directions, the PHA staff then offered to those HCV movers who happened to attend the
moving briefing that day either: (a) the business-as-usual moving briefing, (b) a moving briefing
where a $500 grant was offered, or (c) a moving briefing where a $500 grant plus free mobility
counseling was offered. See the Technical Appendix at for detailed descriptions of each briefing
type.
Business-as-usual moving briefing. The standard moving briefing typically consists of the
following subjects: (1) how the HCV program works; (2) family and owner responsibilities; (3)
where the family can lease a unit, including information about portability. The briefing can take
as little as 30 minutes or as much as three hours. Regardless of the length of the briefing, the
session involves significant amounts of paperwork and documentation that the HCV participants
are required to complete and/or be provided under HUD regulations.
Moving briefing in which offer of a $500 grant is made. The second type of briefing covered
all the same information as the business-as-usual briefing with three additional elements of
information: (1) an explanation of what opportunity areas are and benefits of living in them; (2)
tips about the housing search process, including the offer on one slide of “up to a $500 grant will
be available for moves to opportunity areas” and that the grants can be used for security deposits,
moving expenses, utility deposits, or furniture; and, (3) a folder with the referral form,
opportunity maps, copies of the PowerPoint presentation, and a flyer about the $500 offer.
Attendees were encouraged to “sign up today” by completing a one-page referral form and to
check addresses with Housing Choice Partners (HCP) before signing a lease, along with a 1-800
number to call for HCP.

30
Moving briefing in which offer of a $500 grant and mobility counseling is made. The third
type of briefing was similar to the $500 grant only briefing created by HCP, except there was
less housing search information provided since the participant would have a HCP family advisor
to assist in the housing search. The briefing included talking points for the PHA staff person and
a flyer about key components of mobility counseling with reference to a “Family Advisor” to
help with the search. Attendees were also encouraged to “sign up today” by completing a one-
page referral form and to talk with their family advisor at Housing Choice Partners (HCP) before
signing a lease.
Mobility counseling
If a client indicated interest in counseling in the briefing session where counseling was
offered, the PHA staff person then faxed to HCP a one-page client referral form. Upon receipt of
the fax, the HCP family advisor then verified that the household’s current residential address
listed on the form was not in an opportunity area and thus that the family was eligible for
counseling and the $500 grant if they moved to an opportunity area. If the client was not eligible,
HCP mailed them a letter to notify them of the fact. If the family lived in a non-opportunity area,
the HCP family advisor then sent a welcome letter advising them about an upcoming orientation
and letting them know that their family advisor would call the head of household to schedule
them for a two-hour orientation session, which is the mandatory first step in the counseling
process.
The orientation session included an overview of opportunity areas, including the benefits and
why a participant should consider such a move, where opportunity areas are located, how to
search in these areas, and what to do if discrimination occurred. Other topics in the session
included landlord interviewing techniques, explanation of leases, fair housing rights, an overview

31
of landlord/tenant rights and responsibilities, financial management, and home maintenance.
Each participant received a workbook to take home that covered the above topics. The
orientations were typically led by an HCP counselor and were the first step in helping a
household move to an opportunity area.
After the orientation, households were then assigned to one of three HCP family advisors that
worked with the participant one-on-one to secure housing in an opportunity area. Each family
advisor covered a geographic area. The family advisor used the intake form that clients filled out
at the orientation session to discuss and determine the household’s needs, background, and
desires for their upcoming move. It was the advisor’s role to identify barriers that were likely to
affect the family’s ability to successfully lease in an opportunity neighborhood and to help
remove those barriers.
After a conversation with the family to identify opportunity areas of interest to the family, the
family advisor would then provide listings (usually by reading them over the phone) for units in
or near the neighborhoods in which the clients expressed interest. Although HCP did not engage
in new landlord recruitment as a part of CRHCI, HCP had developed relationships with landlords
over the years as part of its other ongoing counseling initiatives, and some of those landlords
continue to call HCP to list units. To develop the rental listings, the family advisor augments
listings from landlord-offered units with public listings from the MLS service, Illinois Social
Serve, Zillow, HotPads, Trulia and PHA listings.
Seventy-two percent of counseled households that HCP recorded as moving to opportunity
areas had at least one contact with a family advisor in which they were provided rental listings.
The client was then responsible to set up the appointment to view the home, though in most cases

32
HCP had already introduced the landlord to the program and therefore the landlord knew HCV
recipients would call.
In a minority of cases—approximately 1 in 12 counseled families who HCP recorded as
moving to opportunity areas—the family advisor showed apartments to the families. HCP also
provided transportation as needed on a case-by-case basis, but many of their clients did not need
transportation assistance. In most cases, counseling occurred by phone or email rather than office
visits, especially considering there were three family advisors who each covered large
geographical areas. During the search process, the client and family advisor were typically in
contact at least once a week, and sometimes more frequently.
Once a counseled client moved to an opportunity area, HCP administered the $500 upon
receipt of a copy of the signed lease. Thirty days later, HCP then called with a “wellness check”
with about two out of ten clients to see how the transition was going and make referrals as
needed to area social service supports. Ninety days after the move, HCP conducted a home visit
with about seven out of ten counseled clients who made an opportunity move to see how the
transition went, to check on any tenant or landlord issues, to discuss budgeting information with
the family, and to check on the adults’ employment status. Because of budget and staff
limitations, HCP determined that the 90-day home visit was more important than the 30-day visit
so that participants had time to settle in.
While there is no standard definition of counseling intensity, the counseling offered to
families via CRHCI was of lower intensity than other counseling in mobility studies like MTO
and Gautreaux One (see Table 2). The counseling offered in CRHCI was to support a client-led
rather than counselor-led housing search.
33
4. DATA AND METHODS
In this section we describe our sources of data, how HCV recipients were recruited into the
study, the study sample, and PHAs’ compliance with the randomization schedule for the HCV
mover briefings. We also describe the outcome measures and our methods for analyzing the data.
See the Technical Appendix for further detail on sources of data, randomization and compliance
with randomization, and the analytic methodology.
Data sources
The critical, originating data for this study are the PHA briefing sign-in sheets from
November 2012 – October 2014, since sign-in sheets indicate the type of moving briefing
received by the household and comprise the study sample (see Section 3 for details on the
briefings). With names compiled from the sign-in sheets, HUD then used social security numbers
or, when social security numbers were missing or incomplete, last name, first name, and date of
birth to locate the relevant households within the Public and Indian Housing Information Center
(PIC) data system. The PIC data11 is our source for longitudinal data that indicate households’
residential addresses, date of moves, and households’ characteristics over time. After HUD
released de-identified longitudinal household data, we geocoded addresses to determine if they
were in opportunity census tracts and merged in Census and school quality data to develop a
neighborhood profile. Table A2 in the Technical Appendix shows the complete list of data
sources.
11 Public Housing Authorities submit electronically to the PIC System at least annual updates for households in Public and Indian Housing assisted programs, of which HCV is one.

34
Recruitment
The recruitment of HCV participants who had requested a moving voucher started on
November 19, 2012 and ended on October 31, 2014 for all six housing authorities except for
Chicago Housing Authority, which is discussed in the next paragraph. Households who had
attended the grant-only or the grant plus counseling briefings were able to claim a $500 grant
upon moving to an opportunity neighborhood or to receive counseling up through January 31,
2015.
The Chicago Housing Authority was a special case and did not start randomization until
April 3, 2013. The Chicago Housing Authority did not consent to offer business-as-usual
briefings because it already offering free mobility counseling to all HCV participants and did not
wish to remove that offer entirely to create a control group. It was the only PHA that only
randomized moving briefing attenders into the $500 grant offer or the counseling plus $500 (and
not the business-as-usual group). Consequently we exclude the CHA clients from the causal
analyses presented below.

35
Sample
Households were eligible to participate in the study if they had a Housing Choice Voucher
for at least one year, requested a moving voucher from one of the seven participating PHAs, and
lived in a non-opportunity census tract at time of attending moving briefing. Table 4 summarizes
the loss in sample at each step of the data compilation process.
TABLE 4. SAMPLE SIZE LOSS
Research step Number of households
Households who attended moving briefings for which RAND sent randomized briefing assignments
4,746
Households at the randomized briefings who opted out of the study 204 Households on sign-in sheets from moving briefings who consented to be in the study* 4,542 Number of unique households from sign-in sheets with either: (a) 9-digit SSN or (b) last name, first name, and date of birth.
3,806
Number of unique households located in HUD PIC data 3,333 Number of unique households located in HUD PIC data and eligible for study analysis** 3,065 Analytic sample with CHA included 3,065 Analytic sample excluding CHA 2,005
Notes: Table A2 of the Technical Appendix documents the loss of data from HCP records to HUD PIC data. * This count includes duplicates if households attended more than one briefing and includes households living in opportunity areas and thus not eligible for the study. ** Eligible if the household did not exit the HCV program immediately after the briefing and either: (a) lived in non-opportunity neighborhood at time of attending the moving briefing, or (b) were porting in from outside of CRHCI boundaries
After dropping households who were not eligible for the study because they already lived in
an opportunity neighborhood at the time of the briefing, we were left with a sample of 3,065
households. 1,060 of these households held a voucher from the Chicago Housing Authority at the
time of the random assignment, and are excluded from a majority of analyses because Chicago
did not offer the business as usual version of the moving briefing.12 To these data we then
merged in information from HCP to identify which households had obtained counseling or an
incentive for moving to an opportunity neighborhood. While there was data loss at several
stages of merging different sources, because the data loss is not related to the outcome measure
12 We do include CHA households in analyses testing whether the $500 grant incentive had different effects on opportunity moves than the $500 grant and counseling.
36
or the randomized group assignment, we do not believe that our results suffer from selection bias
due to sample loss.13
Compliance with randomization
PHA staff did not always offer the randomized type of briefing. Compliance with the
randomization varied by PHA (shown in Figure A1 of the Technical Appendix), and several
PHAs systematically under-offered the “business as usual” briefings.14 In short, 70 percent of
households who were randomized to receive a “business as usual” briefing actually obtained that
type of briefing, 88 percent of households randomized to receive the grant-only briefing did, and
96 percent of households randomized to receive the grant-plus-counseling briefing did. Given the
differential non-random compliance by PHAs, we conduct sensitivity analyses in which we drop
the least compliant PHAs (Waukegan and DuPage).15 Our preferred specification and the one we
use to derive the results reported here examines opportunity moves according to the intended,
randomized briefing rather than the briefing actually obtained.
Measures
Outcomes
The analysis focuses on one primary and three secondary outcomes. The primary outcome of
interest is an indicator for whether the household moved to an opportunity neighborhood after
attending a randomized moving briefing. Using information about the date of the randomized
briefing and the census tract where the household lived before and after the briefing, we defined
13 In particular, the primary source of data loss—missing personally identifiable information from sign-in sheets—is not correlated with the outcomes of interest described below or the randomly assigned briefing type. 14 See more details about compliance in the Technical Appendix. 15 We also conduct the analyses ignoring non-compliance altogether by only considering the type of offers made to households per the sign-in sheets to test possible statistical significance of offers made. However, these analyses should not be interpreted as causal given that non-compliance does not appear to be random.

37
this indicator to equal one if the household ever moved to an opportunity neighborhood after the
briefing date and before December 31, 2014. If a household moved to an address outside the
CRHCI boundary, we deemed the move “non-opportunity” regardless of the characteristics of
the receiving neighborhood.
We also examined three secondary outcomes to gain a more nuanced understanding of
whether households moved to more advantaged neighborhoods compared to the yes/no
opportunity neighborhood designation.16 First, we examined whether families offered the two
types of incentives were more likely to move to advantaged neighborhoods per the
Neighborhood Advantage Score (Pendall and Hedman, 2015). The second outcome was an
elementary school quality index that we created. Lastly, we examined the percentage of
neighbors who have income below the federal poverty level in the receiving neighborhood.
Covariates
To more precisely estimate the effect of offering the two types of incentives and the effect of
taking up counseling on moves, we specified a regression model to control for any differences in
household characteristics across the three groups. We controlled for head of household
demographic characteristics, such as age, gender, ethnicity, disability status, an indicator for
whether the household received wages, received public assistance, and continuous measures their
current and permanent household income17 at baseline. We coded missing values of all
covariates with a missing indicator. We also controlled for baseline neighborhood
16 See the Technical Appendix for a detailed description of the secondary outcome measures. 17 To estimate permanent income, we averaged household-level income for all time points prior to the randomized briefing that was present in the HUD longitudinal data. On average, we had four pre-briefing time points for a given household to derive an average income that we called permanent income.

38
characteristics, such as percent of households within the baseline census tract who are African
American, percent of households who were Hispanic, percent of households with at least a
Bachelor’s degree, percent of households below the federal poverty level, rental vacancy rates,
median home value, the quality of the zoned elementary school, and the median household
income in the tract.
Table A4 in the Technical Appendix presents the summary statistics of the analysis sample
overall, and by participating PHA. All of the summarized covariates were measured at baseline,
before study participants attended randomized briefings. As the last column in that table shows,
the heads of household in the study sample were primarily low-income African American
females who receive federal assistance in the form of TANF or SSI and had a permanent income
below $12,000. Of these families in the study, 70.53 percent had any school age children, which
is defined as one or more children age 5 – 18. Those that did have school-age children had an
average of two. On average, they came from neighborhoods where approximately half of the
residents were African-American heads of household, 23 percent of neighbors live in poverty,
and the average household income was $39,919.
These aggregate statistics mask substantial differences across households from the urban
PHAs (Chicago and Cook), and those in the more suburban PHAs (DuPage, Lake County,
McHenry, and Oak Park). For example, suburban neighborhoods had higher median house
values and a lower fraction of neighbors living in poverty, whereas urban neighborhoods had a
higher fraction of households where the head had a disability.
Analytic methodology
Our analysis methodology is one used by other similar studies employing an encouragement
design (e.g., Sanbonmatsu et al., 2011) and builds on residential mobility studies such as Moving

39
to Opportunity. This study, however, only examines the short-term outcome of whether either of
the two incentives offered induced HCV recipients to move to opportunity neighborhoods. Using
standard specifications of intent-to-treat and treatment-on-the-treated effects, we developed
regression-adjusted estimates of the difference in opportunity moves between the attendees at the
business-as-usual briefings and the briefings where the two types of incentives were offered. The
Technical Appendix describes these specifications in detail.
5. RESULTS
In this section we organize the results by research question. After presenting the results for
each, we then discuss the implications at the end of Section 5. Unless otherwise noted, we
exclude Chicago Housing Authority study participants from the presented results since that
housing authority did not offer the business-as-usual type of moving briefing.
Did the offer of two types of incentives induce voucher recipients to move to opportunity
neighborhoods?
We first examined whether the offer of the $500 grant or the offer of the $500 grant coupled
with counseling induced households to move at higher rates to opportunity neighborhoods than
the business as usual group. Figure 2 presents the fraction of households who stayed in place,
who moved to non-opportunity neighborhoods (“moved to non-ON” in Figure 2) and who
moved to opportunity neighborhoods (“moved to ON” in Figure 2), according to the type of
moving briefing. The left-hand bar chart displays moves broken down by the randomized
moving briefings (per RAND emails) and the right-hand bar chart displays moves according to

40
the moving briefing actually offered (per the briefing sign-in sheets).18 The results on the left can
be causally interpreted; the results on the right show that, even when ignoring non-compliance
with randomization, the opportunity move rates were largely the same across the three groups.
Looking at the left-hand bar chart, 12.2 percent of the group randomized to receive the
control briefing moved to opportunity neighborhoods, 11.4 percent of the group randomized to
receive the $500 grant-only offer moved to opportunity neighborhoods, and 12.1 percent of the
group randomized to receive the offer of a $500 grant plus counseling moved to opportunity
neighborhoods. These percentages are similar to the right-hand bar chart, where opportunity
moves are broken down by type of briefing attended. As shown in Table A5 of the Technical
Appendix, the differences in opportunity move rates between the control group and the two
treatment groups are not statistically significant.19 In summary, the offer alone did not induce
opportunity moves.
18 As described in Section 4, briefings administered did not always match the type of moving briefing that was randomized for that day. 19 We also tested whether the offer of the $500 grant or the offer of the $500 grant coupled with counseling induced households to move at all or to move to a non-opportunity neighborhood, and found that the differences in move rates between the control group and the two treatment groups are not statistically significant.

41
FIGURE 2. OPPORTUNITY MOVES BY TREATMENT GROUP ASSIGNMENT AND BY BRIEFING
ATTENDED
NOTES: Figure excludes households from CHA. In the left graphic (moves by randomized treatment group), the control group consisted of 1,955 households, 804 households who were supposed to offered the grant only, and 610
households who were supposed to be offered grant plus counseling. In the right pane which ignores PHAs’ non-compliance with the random offer and only examines what PHAs offered as indicated by the color of the briefing sign-
in sheet, the control group included 2,005 households, 791 who were offered the grant only, and 802 who were offered a grant plus counseling.
The rates of opportunity moves differed substantially across the PHAs, with far higher
opportunity move rates within the most advantaged suburban PHAs and the fewest in the most
disadvantaged PHAs (Chicago, Cook County, Waukegan). Figure 3 displays the opportunity
move rates by randomized group within each PHA. Note that in this figure we also included
Chicago Housing Authority, which did not offer business as usual moving briefings (and is thus
51.9
39.4
12.2
54.1
37.8
11.4
43.1
48.2
12.1
0
10
20
30
40
50
Perc
ent
control grant only grant+counsel
Moves by Randomized Treatment Group
45.645.6
11.7
51.6
40.6
11.0
50.0
41.3
12.6
0
10
20
30
40
50
Perc
ent
control grant only grant+counsel
Moves by Type of Briefing Attended
Stay Move to nonON Move to ON

42
excluded from the opportunity move rates shown in Figure 2). None of the differences in the
fraction of households making opportunity moves between control and grant only or control and
grant plus counseling groups shown in Figure 3 are statistically significant at the five percent
significance level. Some notable trends are that DuPage had the largest fraction of households
overall move to opportunity neighborhoods, regardless of the type of briefing offered. As shown
in Table 3, 89 percent of DuPage census tracts were opportunity tracts (the highest proportion of
the seven PHAs) and virtually all opportunity moves in DuPage were made by households that
had ported into the PHA. McHenry had the next highest opportunity move rate, but reflects only
32 households (see figure notes for number of households per PHA) and, like DuPage, the
county also has majority opportunity tract.
FIGURE 3. OPPORTUNITY MOVES BY RANDOMIZED TREATMENT GROUP AND PHA

43
NOTES: Number of households in the analysis by PHA (including control, $500 grant only, $500 grant plus counseling) are as follows: Chicago Housing Authority: 1,060 households. DuPage: 154 households. Cook County: 763 households. Lake County: 154 households. McHenry: 32 households. Oak Park: 146 households. Waukegan:
756 households.
Figure 4 presents the impact estimates of the two types of incentives within each PHA to
examine whether the offer of the grant or grant plus counseling had a statistically significant
impact on opportunity moves in any of the PHAs. The dots in the figure represent the coefficient
estimates, and the whiskers show the confidence interval around the estimate. The confidence
intervals crossing zero in each instance indicate that none of the impact estimates is statistically
significant in either the positive or negative direction. Chicago is excluded from Figure 4 since
they did not offer the control group briefing, which is the basis of the comparisons in the figure.
0
10
20
30
40
50
60
70Pe
rcen
t
CHA DuPage Cook Lake McHenry Oak Park Waukgo gc co go gc co go gc co go gc co go gc co go gc co go gc
co: control go: $500 grant only gc: $500 grant plus counseling

44
FIGURE 4. OPPORTUNITY MOVE TREATMENT EFFECT ESTIMATES BY PHA
We then examined whether the following four subgroups of households were more likely to
move to opportunity neighborhoods: (1) households who ported into the PHA either from outside
the CRHCI jurisdiction or across the participating PHAs, (2) households where the head is
African American, (3) households who have at least one child under the age of 18, (4) and
households where the head is over 65 years of age. Similar to Figure 2, we found no statistically
significant effects of either type of offer on any of the subgroups (results shown in Table A6 of
the Technical Appendix). The impact estimates were generally small, positive and larger for the
grant plus counseling group than the $500 grant-only group, but not statistically significant.
To test the robustness of our results to alternative specifications, we ran four additional
checks. None of them altered the findings. First we examined whether households from DuPage
-.4-.2
0.2
.4.6
Impa
ct o
f tre
atm
ent o
n op
portu
nity
mov
e
DuPage Cook Lake McHenry Oak Park Waukegan
$500 grant only $500 grant plus counseling

45
drove the results since study participants from DuPage had the highest rate of opportunity moves
by far. Second, we examined whether households who attended the briefing after September 1,
2014 and who may not have had sufficient time to have updated residential records within HUD
PIC data were driving the results. Third, we examined an alternative definition of the randomized
treatment by grouping households who attended multiple briefings according to the most
intensive treatment they received (instead of the first treatment they received). Fourth, we
dropped the two PHAs (Waukegan and DuPage) whose moving briefings were least compliant
with randomization.
Did the take-up of counseling induce voucher recipients to move to opportunity
neighborhoods?
We next turned to analyzing whether those who took up at least some counseling among
those offered the $500 grant and counseling were more likely to move to opportunity
neighborhoods using the three alternative definitions for counseling: whether the household at
least attended the initial counseling session that was the mandatory first step in counseling; the
number of contact attempts HCP recorded per client (includes calls, mailed letters, in-person
meetings); and a yes/no indicator for whether HCP provided the client with rental listings. The
coefficients are presented in Table A8 of the Technical Appendix, and they are all negative and
not statistically different from zero, indicating that the counseling services as defined did not
cause more households to move to an opportunity neighborhood.20 We also examined counseling
receipt among the same four subgroups discussed above (results not shown), and also did not
find any statistically significant coefficients on the take-up of counseling.
20 These regressions were estimated with 2SLS, and the coefficient on the instrument in the first stage regression is statistically significant.

46
Did the offer of two types of incentives and the take up of counseling induce voucher
recipients requesters to move to more advantaged neighborhoods?
While we did not find any effect of the offer of either incentive on the rate with which HCV
recipients moved to an opportunity neighborhood, we were also interested in whether households
in the two treatment groups were induced to move to higher quality neighborhoods using more
granular data than the yes/no opportunity neighborhood designation. We examined three
definitions of neighborhood quality: the neighborhood advantage score (NAS), the index of
school quality, and the percent of neighbors with incomes below the federal poverty line. In
results shown in Table A7 of the Technical Appendix, we found that neither offered incentive
induced households to move to a higher quality neighborhood.21 Similarly, the take-up of
counseling did not induce households to move to the higher quality neighborhoods, as shown in
Table A9 of the Technical Appendix.
We re-iterate that neither the offer nor the receipt of counseling in and of itself caused
opportunity moves or moves to more advantaged neighborhoods when comparing the treatment
to the business-as-usual control group. However, those who selected into counseling did move to
more economically advantaged neighborhoods than other opportunity movers. Among the
opportunity movers, those who received counseling moved to neighborhoods with lower rates of
poverty (6.55 percent versus 8.24 percent among opportunity movers who moved on their own
without any offer; difference statistically significant at 5% level) and higher median household
income ($72,899 among counseled opportunity movers versus $64,523 opportunity movers who
21 In fact, the coefficient on grant-only for the neighborhood advantage score is negative and statistically significant at the 5% level. It is unclear how to interpret the negative coefficient, because the score is a composite of multiple indicators, and an overall negative score could imply improvements in some component scores, which were outweighed by lower scores on other components. Also, correcting for multiple hypothesis testing for the three secondary outcomes makes this coefficient statistically not significant from zero.

47
moved on their own; difference statistically significant at the one percent level). These results are
shown in Table A10 of the Technical Appendix. Counseled opportunity movers also made the
greatest distance moves (22.3 miles on average) compared with 17.8 miles for opportunity
movers who got the $500 grant only and 15.8 miles for opportunity movers who went on their
own. The differences in distance of move are not statistically significant and are therefore only
suggestive. Otherwise, opportunity movers of all types—i.e., moved on their own, counseled, got
$500 only—located in very similar neighborhoods on average in terms of the neighborhood
advantage score, percent of neighbors who are African American, and elementary school quality
index.
What is the profile of voucher recipients who move to opportunity neighborhoods?
Next, to inform PHAs and mobility counselors to identify the client base most likely to make
an opportunity move and to compare our results to prior studies of counseling, we pooled the
study participants regardless of the type of moving briefing they attended and simply examined
the demographic profile of those who did and did not move to opportunity neighborhoods. These
results thus do not pose any causal claims about the influences or traits that impel opportunity
moves.
Table 5 displays those characteristics of households that are statistically significantly
different across the type of move made (the full set of comparisons we made are shown in Table
A11 of the Technical Appendix). Similar to what other studies have found (see Table A1 of the
Technical Appendix), opportunity movers are much more likely to be porting in (47 percent
versus 13 percent), are more likely to have a white head of household (18 percent versus 10
percent), are more likely to have somewhat smaller families (average of 1.6 rather than 1.8
children), are more likely to be employed (60 versus 54 percent).

48
TABLE 5: CHARACTERISTICS OF HOUSEHOLDS BY TYPE OF MOVE
Household Characteristics
Opportunity Movers
Stayers and non-
opportunity movers
Statistical significance of
difference % Port-in 47.16 12.83 34.34***
HoH: % white 18.09 10.20 7.88***
HoH: % Black 83.69 90.80 -7.11***
% with inc from wages 60.28 54.22 6.06*
% with inc from TANF 63.48 56.95 6.52**
% with inc from SSI 27.66 34.17 -6.51**
N Children in Hhld 1.57 1.81 -0.24** Note: Chicago Housing Authority residents included in this table. *** p<.001 ** p<0.01, * p<0.05.
Discussion
In summary, neither the offer of a $500 grant alone nor the offer or a $500 grant in
combination with free mobility counseling induced opportunity moves for the study participants
as a whole or among subgroups. The receipt of mobility counseling also did not cause
opportunity moves. Between 11-12 percent of study participants who attended any of three types
of moving briefings subsequently moved to opportunity neighborhoods. These two types of low-
intensity incentives, as offered to this particular population of voucher recipients, did not have
their intended effects.
Those who ported into a jurisdiction were significantly more likely to be opportunity movers,
suggesting that HCV recipients who declare an intention to port are good candidates for
promoting opportunity moves. Those that moved to opportunity neighborhoods also tended to
have income from wages, live in smaller families, and to come from more moderate poverty
neighborhoods in the first place. Those who selected into counseling and subsequently moved to
opportunity areas tended to move to more economically prosperous neighborhoods as compared
to other opportunity movers from the grant-only or “business as usual” groups.
49
Putting these results into context is challenging since CRHCI was a pilot program with a
number of unique features that limit its generalizability. This study examined families already in
the voucher program who requested a moving voucher and who lived in non-opportunity
neighborhoods at the time of that request. CRHCI households typically came from
neighborhoods with much less poverty than, for example, MTO, and this could have reduced
their motivation to make opportunity moves. An average of 22 percent of CRHCI participants’
neighbors lived below the poverty line compared to neighborhood poverty rates of 40 percent
and higher within MTO.
The most similar program to CRHCI we identified is the Housing Opportunity Program
(HOP), which also operated within the confines of the regular HCV program (and not court-
ordered desegregation cases with specially-allocated vouchers with different rules), was located
in Chicago, and applied similar household eligibility criteria. The critical differences between the
two were that CRHCI involved seven PHAs whereas HOP involved one, HOP was a long
running program whereas CRCHI was new, and CRHCI applied a more stringent definition for
opportunity neighborhoods, which could help to explain the lower average opportunity move rate
in CRHCI (between 11 and 12 percent) versus HOP (between 19 and 21 percent). Nevertheless,
both programs yielded minimal differences in the rates of opportunity moves between the
counseled and the non-counseled. For HOP, 21 percent of those counseled moved to opportunity
while 19 percent of non-counseled also did so.
The relatively low opportunity move rates in both CRHCI and HOP combined with the fact
that Chicago had the lowest rate among the five MTO cities’ opportunity moves suggests that the
Chicago metro area has a particularly formidable set of barriers to opportunity moves. It is a
highly racially and economically segregated metropolis in a state that does not have source of

50
income protection (although the City of Chicago has since 1990 and Cook County has since
2013, along with a limited number of suburbs). This means that Illinois landlords outside of
areas with the source of income protection may legally reject voucher applicants for the stated
reason of having a voucher.22 Also during the CRHCI study, rental vacancy rates were lower on
average than the national rate (as of 2013, there was 5.2 percent rental vacancy in CRHCI
opportunity areas; 6.3 percent in CRHCI area as a whole; 7.3 percent nationally). Indeed,
approximately half of the participants in the study wound up not moving at all despite requesting
a moving voucher.
While we cannot isolate the contribution of each barrier, the relatively low rates of
opportunity moves was likely the combined influence of the following twelve factors. We call
these out to inform the design of future housing mobility programs. The first two relate to the
housing market context in which CRCHI operated, while the third through eleventh barrier stem
from the design and implementation of the CRHCI mobility policy. The final barrier is common
to mobility counseling programs.
Barrier 1: Lack of affordable rental housing. The voucher payment standards, which ranged
from 90 to 140 percent of the Fair Market Rent, may still have been too low relative to the rental
prices in the metro area during 2012-2014. There was also a relatively tight rental market.
Smaller families were more likely to make opportunity moves, which comports with prior
research about the challenge of finding three and four-bedroom affordable rental homes within
opportunity areas.
22 A journalistic investigation of all Chicago and Cook County Craigslist rental listings in June 2015 found that anti-Section 8 bias remains, despite the source of income laws making such statements illegal (Yousef, 2015).

51
Barrier 2: A starting point of moderate poverty. Unlike Gautreaux and Moving to
Opportunity where participants came from very high poverty neighborhoods, the typical CRHCI
participant lived originally in a census tract where 22 percent of neighbors lived in poverty. Even
though we found that those in our study sample who lived in relatively lower poverty
neighborhoods were more likely to make opportunity moves, we qualify this point by
underlining that only 13 percent of the study sample started in neighborhoods where poverty was
40 percent or greater. Living in moderate poverty neighborhoods may have reduced the incentive
to make an opportunity move.
Barrier 3: Stringent definition of opportunity. The CRHCI definition of opportunity
neighborhood set a high standard for opportunity moves. Even though a little over half of all
tracts in the region were deemed “opportunity,” the average opportunity tract had a poverty rate
of six percent and four percent of the population was African American. The fairly high
threshold meant a relatively small proportion of HCV families made opportunity moves.
Barrier 4: No landlord recruitment. Neither HCP nor the PHAs conducted any new landlord
recruitment or outreach as a part of CRHCI. In addition, landlord discrimination and racial
segregation are serious barriers for the predominantly African-American HCV population in this
study.
Barrier 5: Late timing of offer. The offer of the two incentives likely occurred too late in the
housing search process. By the time a tenant requests moving papers (which turns on the time-
limited search clock and, in this instance, the randomized offer), many tenants will have already
identified where they want to move. The offers might have had greater impact if they occurred
well before voucher recipients had come forward to request a moving voucher.

52
Barrier 6: Low intensity of counseling. Limited resources inhibited the extent of counseling,
which was primarily a client-driven search process and did not include a real estate specialist,
counselor-led outreach to book housing viewings, van tours, or extensive transportation as other
mobility programs have offered.
Barrier 7: Offer lost in the shuffle. The moving briefing is already information-heavy, and
the offers of the incentives may been too brief, brought up too late in the briefing, and simply
may not have stood out sufficiently or appeared simple and easy enough to be attractive.
Barrier 8: Incentive insufficiently attractive. The offer of $500 may have been too small
relative to the size of security deposits in the Chicago metro area (e.g., a two-bedroom FMR in
FY 2013 in Cook County was $966). Also, the offer of $500 was not cash to the mover, but
rather a reimbursement paid to the landlord, the moving company, or furniture company and was
contingent on submitting proof of moving. This may have reduced its appeal as an incentive.
Barrier 9: Cumbersome look-up process. To learn if a rental listing was in an opportunity
neighborhood, clients had to call up HCP about each listing instead of type an address into an
interactive, online feature. This requirement to call the counselor about each listing was a design
feature criticized within Gautreaux Two.
Barrier 10: New program. The counseling program was new and thus lacked the time to
build word-of-mouth buy-in among clientele.
Barrier 11: Under resourced. CRHCI stretched too few dollars across too big a set of
activities, and it occurred in a context of limited PHA resources due to sequestration, staff
turnover, and receivership. There were three components in CRHCI (this study examines only
the third component), and each posed start-up costs and implementation challenges to coordinate
across seven PHAs.

53
Barrier 12: Poorly measured dosage indicator for counseling. Housing Choice Partners did
not track the number of hours of counseling or direct active contacts (by phone or in-person),
which may have been a better metric of “dosage” than the three measures used in this study
based on the data that was available (i.e., client attended at least the mandatory orientation
session; tally of any type of contact or contact attempt from HCP to client; yes/no indicator of
whether HCP provided rental listings to a client).
Even though CRHCI is unique, it still carries lessons for other HCV mobility efforts. The
simplest reason is that CRHCI, unlike court-ordered remedies with special purpose vouchers,
operated within the confines of the HCV program and thus offers relevant lessons for other
programs that are likely to confront many of the same constraints. We drew on the lessons
learned above to develop recommendations that we make for future HCV mobility pilots and
research in the last section.
Finally, we wish to note that the body of research about mobility counseling is seriously
hampered by the lack of standardized measures (and a lack of published results) about the take-
up rate among all those originally offered counseling, the drop-off along the way among
counseled clients including those who stay in place, and the ultimate number of opportunity
moves. Future research that both accounts for attrition among the counseled and tracks
expenditures by mobility counseling activity would greatly aid practitioners’ ability to pilot
alternatives.
54
6. RECOMMENDATIONS
We conclude with two recommendations to test ways to boost the rate of HCV opportunity
moves. We restrict our recommendations to mobility-based policies since that was the focus of
the experiment. Having said that, the limited supply of affordable rental housing in opportunity
areas will be a significant barrier to making upwardly mobile residential moves if the numbers of
HCV opportunity movers were to increase substantially. Consequently, place-based policy
responses to build, acquire, or preserve affordable rental housing in opportunity areas (whether
they be inclusionary zoning, preservation initiatives, or locating Section 8 place-based units in
opportunity tracts) play a necessary, complementary role to “people-based” policies like mobility
counseling or cash incentives.
To develop our mobility-related recommendations, we drew on the lessons learned from
CRHCI, our literature review, the input of housing mobility counselor experts (Christine Klepper
and Jennifer O’Neil), and CRHCI’s partners and advisors.
Idea 1: Research a second-generation mobility counseling program that operates within the
traditional HCV system.
The field lacks rigorous evidence about the effect of mobility counseling relative to no
counseling within the standard HCV program. The majority of research available derives from
special cases like court-ordered desegregation remedies and from MTO. For the sake of results
that generalize to a much larger set of PHAs with tenant-based HCV programs, we recommend a
“proof of concept” study that examines a well-resourced large, established mobility counseling
program for HCV recipients to better understand the outreach, counseling and ongoing resources
needed to support households in choosing housing regionally (whether place-based or tenant-
based) in opportunity areas.

55
The program might be contracted out or run in-house by PHA staff. Ideally, the program
could operate across multiple PHAs so long as the counseling program was administered in a
comparable way and with the same per client resources in each locality. The structure of the
counseling would include best practices such as counseling being offered to only a subset of
high-priority families already in the HCV program. The eligibility criterion could be based on
research about those most likely to benefit—e.g., families who declare an intention to port to
another jurisdiction, families with children age 0-13, wage earners, or families living in high-
crime areas.
Regardless of eligibility criteria, counseling should be offered well before the lease is due to
expire given the lesson learned in CRHCI and the need for pre-counseling services for at least
some clients. Also, the counseling program should have been in operation for at least a year
before the impact evaluation begins to work out initial implementation kinks and to build word-
of-mouth reputation among users.
When offered, there should be a differentiation of counseling that starts with initial needs
assessment after which counselors would place families into provisional categories such as: not
interested; minimal services needed (e.g., for wage earning adults); and high-intensity services
needed (e.g., unemployed). Those who are actively uninterested could simply be invited to come
back if interested at a later time. In low-intensity counseling, counselors serve as cheerleaders for
opportunity, starting with a van or possibly video tour of opportunity areas and then the
provision of minimal support for client-led housing searches and fairly minimal post-move
support such as via text messaging and periodic phone calling. In high-intensity counseling,
counselors take a longer term approach that starts with pre-counseling case management to work
on budgeting, credit repair, and expanded employment. Later, counselors shift into housing

56
search assistance with a more directed approach in which counselors identify possible units for
clients, arrange tours, negotiate with landlords, assist with final move-in preparation, and then
offer post-move support to reduce potential isolation of the relocatee or to negotiate with
landlords.
The program should also place priority to landlord recruitment. Ideally, the counseling
program would take an evidence-based approach to identify where affordable rental housing is
located within opportunity areas, how many of those landlords are participating in HCV already,
the profile of those landlords (size, ownership type), the profile of the rental housing; and then
would use real estate brokers or in-house trained PHA staff who are well versed in the HCV
program to recruit and manage relationships with HCV landlords. The counseling program could
also be linked to properties with project-based subsidies.
To keep it simple and understandable (as well as to reduce up-front planning time and cost),
we recommend that the local program identify either zip codes as opportunity areas or else use a
pre-made index such as CRHCI did with HUD’s index (possibly with a less stringent cut-off,
although this will likely need to determined based on local distribution on the index scores). If
the list of opportunity census tracts or zip codes is long, the program should make the index
easier to understand and lower families’ housing search transactional costs (as well as landlords’)
by creating an online tool in which users can enter an address and immediately learn if it is in an
opportunity area or not.
To test the efficacy of such a program, it is critical that the evaluation of the counseling
program is designed up front, including pre-specification of the cost and counseling data
categories researchers will collect and their frequency of that collection. The primary objective is
to design a study that can isolate the effect of counseling, and ensure that the counseling is

57
administered with fidelity. Efforts should be made in the design to limit “crossover” by, say,
clients in the treatment group sharing the counseling information or resources with the control
group. Data collection in the study should also be done in a way to allow researchers to
distinguish the cost of pre-counseling, landlord recruitment, housing search, post-move
assistance and the differentiated strands of counseling (low versus high intensity).
Idea 2: Pilot new landlord outreach methods and landlord induction processes for the HCV
program.
We hypothesize that a lack of affordable rental housing in CRHCI opportunity areas was a
chief barrier that suppressed opportunity moves. And recent research has emerged about how
landlords, as opposed to solely tenants, engage with the HCV program. This research has
revealed a series of concerns among HCV landlords and strategic behaviors that can work
against the goal of promoting opportunity moves (Greenlee, 2014; Rosen, 2014). All else equal,
the quality of landlord outreach predicts lease-up rates (Finkel, 2001), but PHAs generally lack
the staff time and capacity to sustain landlord outreach (Greenlee, 2011). However, the
experience of long-running counseling programs serve as a caution about landlord recruitment;
both Gautreaux One and MTO started with strong landlord outreach that decreased over time
because counselors deemed it not that successful in yielding new, participating landlords.
Here we offer a series of potential small pilots with the goal of developing processes that
could then be formally tested in a research study at a larger scale. Given the exploratory nature of
the pilots, we recommend formative rather than impact evaluations. Simple statistics could be
collected to gauge the level of effort relative to the numbers of affordable rentals located in
opportunity areas to determine which ideas merit further expansion.

58
Market analysis 1. After defining opportunity neighborhoods, solicit market analyses to
identify affordable rental housing within opportunity neighborhoods and further identify owners
of affordable rental housing to develop a profile of relevant landlords (small to large, housing
typology, owner type). Then analyze the profile of HCV participating landlords—their size,
location, property type—and compare the market profile of opportunity area landlords to
understand which types of landlords are opting in and out of HCV.
Market analysis 2. Depending on the type of landlord(s) that are most desired to participate,
develop a focus group of currently participating HCV landlords in the target neighborhoods to
solicit their perceptions and understanding of HCV, barriers to entry, and what possible
modifications to procedure could appeal to more landlords in opportunity areas to participate
(e.g., the order in which the landlord-tenant lease is signed and landlord-PHA HAP contract is
signed or expedited HQS inspections in opportunity areas).
Differentiated marketing materials. Develop targeted materials and programmatic tweaks for
recruiting various types of landlords who own affordable rental housing and then conduct focus
groups with those categories of landlords. Develop and test various marketing strategies to notify
landlords in opportunity areas.
Change the default. Test the effects of PHAs providing to HCV voucher recipients: (a) a list
and/or texting of available rental homes to clients where the homes located in opportunity areas
are ranked first and non-opportunity ranked second, compared with (b) business-as-usual
unsorted list of available affordable rental housing.
Learn from other programs. Survey other relocation programs such as those intended for
homeless individuals to learn what strategies counselors have found effective to recruit landlords
and the level of effort required for those strategies.
59
Incentives to landlords rather than tenants. Test an incentive paid to landlords of affordable
rental housing located in opportunity neighborhoods for signing leases with HCV voucher
holders. Examples are a simple $1,000 cash transfer, or offering a holding fee as a way to pay
landlords for their lost rent while waiting for the several weeks it can take a PHA to complete the
HQS inspection.
Use permit data. Utilizing municipal data, reach out to all multifamily rental property owners
in a given municipality to identify the supply of opportunity area-located affordable rental
housing. Offer owners the incentive of near-guaranteed demand for their rentals through the
HCV or PBV programs.
Engage municipal leaders in opportunity areas. As a means of reaching landlords, engage
municipal directors to bolster their local Affirmatively Furthering Fair Housing plans and to
create a better database of rental housing providers in their jurisdiction.
Post-move landlord support. Test and market post-move landlord support offered to
opportunity area owners (such as via mobility counselors) to help resolve tenant-landlord
disputes.
In conclusion, the potential benefits of upwardly mobile residential moves compel housing
practitioners to continue testing policies to ease voucher-based opportunity moves. Given the
local variation among housing markets, it is unlikely that any one policy will work in all
contexts. Based on the lessons learned from the Chicago pilot as well as prior research, we have
suggested several pilots to test on a small scale across a variety of housing markets with the goal
of developing adaptable policies to promote mobility.

60
REFERENCES
Basolo, Victoria, and Mai Thi Nguyen. 2006. Does neighborhood matter?: The neighborhood
conditions of housing voucher holders by race and ethnicity. Housing Policy Debate 16, nos.
3/4: 297–324.
Boyd, Melody, Kathryn Edin, Susan Clampet-Lundquist, and Greg Duncan. 2010. The
Durability of Gains From the Gautreaux Two Residential Mobility Programs: A Qualitative
Analysis of Who Stays and Who Moves From Low-Poverty Neighborhoods. Housing Policy
Debate 20, no. 1: 119–146.
Briggs, Xavier de Souza, Jennifer Comey, and Gretchen Weismann. 2010. Struggling to stay out
of high-poverty neighborhoods: housing choice and locations in moving to opportunity's first
decade. Housing Policy Debate 20, no. 3: 383-427.
Briggs, Xavier de Souza, and Margery Austin Turner. 2006. Assisted housing mobility and the
success of low-income minority families: Lessons for policy, practice, and future research.
Journal of Law and Social Policy 1, no. 1: 25–61.
Charles, Camille Zubrinsky. 2005. Can we live together? Racial preferences and neighborhood
outcomes. In The Geography of Opportunity: Race and Housing Choice in the Metropolitan
America, ed. X. d. S. Briggs, 45–80. Washington, DC: Brookings Institution.
Chetty, Raj and Nathan Hendren. 2015. The Impacts of Neighborhoods on Intergenerational
Mobility: Childhood Exposure Effects and County-Level Estimates. Working Paper.
http://www.equality-of-opportunity.org/images/nbhds_paper.pdf

61
Chetty, Raj, Nathan Hendren and Lawrence Katz. 2015. The Effects of Exposure to Better
Neighborhoods on Children: New Evidence from the Moving to Opportunity Experiment.
Working Paper. http://equality-of-opportunity.org/images/mto_paper.pdf
Casey Dawkins, Jae Sik Jeon, and Rolf Pendall. 2015. Transportation Access, Rental Vouchers,
and Neighborhood Satisfaction: Evidence From the Moving to Opportunity Experiment.
Housing Policy Debate 25, no. 3: 497-530.
Climaco, Carissa G., Christopher N. Rodger, Judith D. Feins, and Ken Lam. 2008. Portability
Moves in the Housing Choice Voucher Program, 1998–2005. Cityscape: A Journal of Policy
Development and Research 10, no. 1: 5-40.
Cunningham, Mary K., Molly Scott, Chris Narducci, Sam Hall, Alexandra Stanczyk. 2010.
Improving neighborhood location outcomes in the Housing Choice Voucher program: A scan
of mobility assistance programs. Washington, DC: Urban Institute. Accessed on March 2,
2016 at http://www.urban.org/sites/default/files/alfresco/publication-pdfs/412230-
Improving-Neighborhood-Location-Outcomes-in-the-Housing-Choice-Voucher-Program-A-
Scan-of-Mobility-Assistance-Programs.PDF.
Cunningham, Mary K. and Susan J. Popkin. 2002. CHAC Mobility Counseling Assessment.
Final report. Accessed on October 23, 2015 at
http://www.urban.org/sites/default/files/alfresco/publication-pdfs/410588-CHAC-Mobility-
Counseling-Assessment.PDF.
Cunningham, Mary K. and Susan J. Popkin. 1999. CHAC Inc. Section 8 program: Barriers to
Successful Leasing Up. Report prepared for CHAC, Inc. Washington DC: The Urban
Institute. Accessed on October 23, 2015 at

62
http://www.researchgate.net/publication/237387709_CHAC_SECTION_8_PROGRAM_BA
RRIERS_TO_SUCCESSFUL_LEASING_UP.
Darrah, Jennifer and Stefanie DeLuca. 2014. “Living Here has Changed my whole perspective”:
How escaping inner-city poverty shapes neighborhood and housing choice. Journal of Policy
Analysis and Management 33, no. 2: 350–384.
DeLuca, Stephanie, Greg Duncan, Ruby Mendenhall, and Micere Keels. 2010. Gautreaux
Mothers and Their Children: An Update. Housing Policy Debate 20, no. 1:7–25.
DeLuca, Stephanie, Peter Rosenblatt, and & Holly Wood. Unpublished. Why Poor People Move
(and Where They Go): Residential mobility, selection, and stratification. Working paper.
Accessed on October 23, 2015
at http://www.law.nyu.edu/sites/default/files/ECM_PRO_074751.pdf.
Edin, Kathryn, Stephanie DeLuca, and Ann Owens. 2012. Constrained Compliance: Solving the
Puzzle of MTO’s Lease-Up Rates and Why Mobility Matters. Cityscape: A Journal of Policy
Development and Research 14, no. 2:181-194.
Feins, Judith D., Debra McInnis, and Susan J. Popkin. 1997. Counseling in the moving to
opportunity program. Washington, DC: US Department of Housing and Urban Development.
Feins, Judith D., and Rhiannon Patterson. 2005. Geographic mobility in the housing choice
voucher program. Cityscape: A Journal of Policy Development and Research 8, no. 2: 21-47.
Meryl Finkel and Larry Buron. 2001. Study on Section 8 Voucher Success Rates—Volume I:
Quantitative Study of Success Rates in Metropolitan Areas. Report prepared for the U.S.
Department of Housing and Urban Development by Abt Associates, Inc.. Washington, DC:

63
U.S. Department of Housing and Urban Development, Office of Policy Development and
Research.
Fischer, Will. 2015. Neighborhood-based subsidy caps can make housing vouchers more
efficient and effective. Center on Budget and Policy Priorities. Accessed on March 3, 2016 at
http://www.cbpp.org/research/housing/neighborhood-based-subsidy-caps-can-make-housing-
vouchers-more-efficient-and
Goering, John, Katherine Carnevale, and Manuel Teodoro. 1996. Expanding housing choices
for HUD-assisted families: Moving to Opportunity. Washington, DC: Department of
Housing and Urban Development.
Goetz, Edward G. 2003. Housing dispersal programs. Journal of Planning Literature 18, no. 1:
3-16. DOI: 10.1177/0885412203251339
Greenlee, Andrew J. 2014. More Than Meets the Market? Landlord Agency in the Illinois
Housing Choice Voucher Program, Housing Policy Debate 24, no. 3: 500-524. DOI:
10.1080/10511482.2014.913649
Greenlee, Andrew J. 2011. A different lens: Administrative perspectives on portability in
Illinois’ Housing Choice Voucher Program. Housing Policy Debate 21, no. 3: 377–403.
DOI:10.1080/ 10511482.2011.591409
Hartung, John M. and Jeffrey R. Henig. 1997. Housing Vouchers and Certificates as a Vehicle
for Deconcentrating the Poor Evidence from the Washington, D.C., Metropolitan Area.
Urban Affairs Review 32, no. 3: 403-419. DOI: 10.1177/107808749703200305

64
Horn, Keren M., Ingrid Gould Ellen, and Amy E. Schwartz. 2014. Do Housing Choice Voucher
holders live near good schools? Journal of Housing Economics 24: 28-40.
Housing and Urban Development, US Department of. 2001. Housing Choice Voucher
Guidebook 7420.10G. Accessed on October 23, 2015 at:
http://portal.hud.gov/hudportal/HUD?src=/program_offices/administration/hudclips/guidebo
oks/7420.10G
Jargowsky, Paul A. 2015. The Architecture of segregation: Civil unrest, the concentration of
poverty, and public policy. Issue Brief. The Century Foundation. Accessed on October 9,
2015 at http://www.tcf.org/assets/downloads/Jargowsky_ArchitectureofSegregation.pdf.
Johnson, Michael P. 2005. Spatial decision support for assisted housing mobility counseling.
Decision Support Systems 41, no. 1: 296–312.
Kahn, Peter B. and Geoffrey B. Newton. The Small Area FMR Demonstration. Cityscape: A
Journal of Policy Development and Research 15, no. 1: 325-328.
Keels, Micere, Greg J. Duncan, Stefanie DeLuca, Ruby Mendenhall, and James E. Rosenbaum.
2005. Fifteen Years Later: Can Residential Mobility Programs Provide a Permanent Escape
from Neighborhood Crime and Poverty? Demography 42, no. 1:51–73.
Kleit, Rachel Garshick, Seungbeom Kang, and Corianne Payton Scally. 2015. Why Do Housing
Mobility Programs Fail in Moving Households to Better Neighborhoods? Housing Policy
Debate. DOI: 10.1080/10511482.2015.1033440
Kleit, Rachel Garshick, and Lynne C. Manzo 2006. To move or not to move: Relationships to
place and relocation in HOPE VI. Housing Policy Debate 17, no 2: 271–308.

65
Ludwig, Jens, Lisa Sanbonmatsu, Lisa Gennetian, Emma Adam, Greg J. Duncan, Lawrence F.
Katz, Ronald C. Kessler, Jeffrey R. Kling, Stacy Tessler Lindau, Robert C. Whitaker, and
Thomas W. McDade. 2011. Neighborhoods, Obesity, and Diabetes — A Randomized Social
Experiment. New England Journal of Medicine 365, no. 16: 1509-1519.
Marr, Matthew D. 2005. Mitigating apprehension about section 8 vouchers: The positive role of
housing specialists in search and placement. Housing Policy Debate 16, no. 1: 85-111. DOI:
10.1080/10511482.2005.9521535
McClure, Kirk. 2013. Which metropolitan areas work best for poverty deconcentration with
Housing Choice Vouchers? Cityscape 15(3): 209 – 236.
McClure, Kirk. 2006. Do tight housing markets inhibit racial, ethnic, and poverty
deconcentration. Paper read at the annual meetings of the Association of Collegiate Schools
of Planning, November 10, in Fort Worth, TX.
McClure, Kirk, Alex F. Schwartz, and Lydia B. Taghavi. 2015. Housing Choice Voucher
Location Patterns a Decade Later. Housing Policy Debate 25, no. 2: 215-233. DOI:
10.1080/10511482.2014.921223
Metzger, Molly W. 2014. The Reconcentration of Poverty: Patterns of Housing Voucher Use,
2000 to 2008. Housing Policy Debate 24, no. 3: 544-567. DOI:
10.1080/10511482.2013.876437
Newman, Sandra J., and Ann B. Schnare. 1997. ‘‘. . . And a suitable living environment’’: The
failure of housing programs to deliver on neighborhood quality. Housing Policy Debate 8,
no. 4: 703–41.

66
Orr, Larry, Judith D. Feins, Robin Jacob, Erik Beecroft, Lisa Sanbonmatsu, Lawrence F. Katz,
Jeffrey B. Liebman, and Jeffrey Kling. 2003. Moving to Opportunity for Fair Housing
Demonstration Program: Interim Impacts Evaluation. Report prepared for the U.S.
Department of Housing and Urban Development by Abt Associates, Inc., and the National
Bureau of Economic Research. Washington, DC: U.S. Department of Housing and Urban
Development, Office of Policy Development and Research.
Pashup, Jennifer, Kathryn Edin, Greg J. Duncan, and Karen Burke. 2005. Participation in a
residential mobility program from the client’s perspective: Findings from Gautreaux two.
Housing Policy Debate 16, nos. 3&4: 361–92.
Pendall, Rolf. 2000. Why voucher and certificate users live in distressed neighborhoods. Housing
Policy Debate 11, no. 4: 881–910.
Pendall, Rolf, Christopher R. Hayes, Taz George, Zachary J. McDade, Casey Dawkins, Jae Sik
Jeon, Eli Knapp, Evelyn Blumberg, Gregory Pierce, Michael Smart. 2014. Driving to
Opportunity: Understanding the links among transportation access, residential outcomes, and
economic opportunity for housing voucher recipients. Washington, DC: Urban Institute.
Accessed on March 2, 2016 at http://www.urban.org/research/publication/driving-
opportunity-understanding-links-among-transportation-access-residential-outcomes-and-
economic-opportunity-housing-voucher-recipients
Priemus, Hugo, Peter A. Kemp, and David P. Varady. 2005. Housing vouchers in the United
States, Great Britain, and the Netherlands: Current issues and future perspectives. Housing
Policy Debate 16, nos. 3/4: 575–609.

67
PRRAC, 2015. Expanding Choice: Practical Strategies For Building A Successful Housing
Mobility Program. APPENDIX B: State, Local, and Federal Laws Barring Source-of-
Income Discrimination. Accessed on October 23, 2015 at
www.prrac.org/projects/expandingchoice.php
Rinzler, Dan, Philip Tegeler, Mary Cunningham, and Craig Pollack. 2015. Leveraging the power
of place: Using pay for success to support housing mobility. Working paper 2015-04. Federal
Reserve of San Francisco. Accessed on October 23, 2015 at
http://www.frbsf.org/community-development/publications/working-
papers/2015/july/leveraging-the-power-of-place-housing-mobility/
Rosen, Eva. 2014. Selection, matching, and the rules of the game: Landlords and the geographic
storing of low-income renters. W14-11. Working paper. Joint Center for Housing Studies.
Accessed on October 12, 2015 at
http://www.jchs.harvard.edu/sites/jchs.harvard.edu/files/w14-11_rosen_0.pdf.
Rosenbaum, James E. and Anita Zuberi. 2010. Comparing residential mobility programs: design
elements, neighborhood placements, and outcomes in MTO and Gautreaux. Housing Policy
Debate 20:1, 27-41. DOI: 10.1080/10511481003599845
Rosenblatt, Peter and Jennifer Cossyleon. 2015. Take a chance of me: A review of the
Milwaukee security deposit assistance program. PPRAC. Accessed on March 4, 2015 at
http://prrac.org/pdf/MilwaukeeCountySecurityDepositStudy.pdf.
Rosenblatt, Peter and Stefanie DeLuca, 2012. “We Don’t Live Outside, We Live in Here”:
Neighborhood and Residential Mobility Decisions. City and Community 11, no. 3: 254 – 284.

68
Rothwell, Jonathan. 2012. Housing Costs, Zoning, and Access to High-Scoring Schools.
Washington, D.C.: The Brookings Institution, Metropolitan Policy Program.
Rubinowitz, Leonard S. and James E. Rosenbaum. 2000. Crossing the Class and Color Lines.
University of Chicago Press.
Schacter, Jason P. 2004. Geographical mobility: 2002 to 2003. Current Population Reports 20–
549. Washington, DC: US Census Bureau.
Sharkey, Patrick. 2013. Stuck in Place: Urban Neighborhoods and the End of Progress Toward
Racial Equality. Chicago: University of Chicago Press.
Shroder, Mark D. 2003. Locational constraint, housing counseling, and successful lease-up. In
Choosing a better life? Evaluating the moving to opportunity social experiment, ed. John
Goering, and Judith Feins, 59–80. Washington, DC: Urban Institute Press.
Lisa Sanbonmatsu, Jens Ludwig, Lawrence F. Katz, Lisa A. Gennetian, Greg J. Duncan, Ronald
C. Kessler, Emma Adam, Thomas W. McDade, and Stacy Tessler Lindau. 2011. Moving to
Opportunity for Fair Housing Demonstration Program - Final Impacts Evaluation. U.S.
Department of Housing & Urban Development, Office of Policy Development and Research.
Turner, Margery Austin, and Xavier Briggs. 2008. Assisted Housing Mobility and the Success of
Low-Income Minority Families: Lessons for Policy, Practice, and Future Research. Urban
Institute Brief No. 5.
Turner, Margery Austin, and Stephen L. Ross. 2005. How racial discrimination affects the search
for housing. In The geography of opportunity: race and housing choice in metropolitan
America, ed. X. d. S. Briggs, 81–100. Washington, DC: Brookings Institution.

69
Turner, Margery Austin, and Kale Williams. 1997. Housing mobility: Realizing the promise.
Accessed on March 2, 2016 at http://www.prrac.org/mobility/97report.pdf.
Varady, David P. and Carol C. Walker. 2000. Vouchering out distressed subsidized
developments: Does moving lead to improvements in housing and neighborhood conditions?
Housing Policy Debate 11, no. 1: 115–62.
Varady, David P. and Carole C. Walker (2003) Using housing vouchers to move to the suburbs:
How do families fare? Housing Policy Debate 14, no. 3: 347-382. DOI:
10.1080/10511482.2003.9521480
Varady, David P. and Reinout Kleinhans. 2013. Relocation Counselling and Supportive Services
as Tools to Prevent Negative Spillover Effects: A Review. Housing Studies 28, no. 2: 317-
337. DOI: 10.1080/02673037.2013.767882
Wood, Holly Michelle. 2011. When Only a House Makes a Home: The Roles of Neighborhood
and Dwelling in the Residential Decision-Making of Lower-Income, Inner-City Black
Families. Unpublished manuscript.
Yinger, John. 1995. Closed doors, opportunities lost: the continuing costs of housing
discrimination. New York: Russell Sage Foundation
Yousef, Odette. 2015. Section 8 voucher holders face blatant discrimination on Craigslist.
WBEZ newscast. October 14. Accessed on October 14, 2015
at http://www.wbez.org/news/section-8-voucher-holders-face-blatant-discrimination-
craigslist-113330