pdx devops- stream processing, heka and riemann
TRANSCRIPT
Stream processing, Heka and Riemann
PDX DevOps, June 29th, 2015

Me
Site Reliability Engineer at New Relic
github.com/nickchappell/
twitter.com/nickachappell/
http://newrelic.com/about/careers
Dataflow programming is more descriptive
Stream processing came up at Monitorama several times
Assembly line vs workbench
Stream processing
Frameworks provide some primitives and abstractions: !• Inputs • Outputs • Some sort of message/event abstraction
along with delivery guarantees • Task assignment and code delivery
Stream processing frameworks

Apache Storm
https://storm.apache.org

Apache StormDeveloped at Twitter, then open-sourced as an Apache project
Inputs are spouts
Outputs are bolts
Messages/events are tuples
Your code takes tuples from spouts, does something with them and sends them to bolts
Source: https://storm.apache.org

Apache StormSpouts and bolts are combined
to make topologies
Topologies are like Hadoop jobs, but they don’t shut
down unless told to
‘pooter science wordz: Topologies are directed
graphs of defined transformations (your spouts
and bolts) of streams
Streams are a flow of tuples
Source: https://storm.apache.org
Topology info and metadata are kept in Zookeeper

Apache Samza
http://samza.apache.org

Twitter Heron
Twitter’s follow-up to Storm, but they haven’t open-source’d it yethttps://blog.twitter.com/2015/flying-faster-with-twitter-heron

https://mesos.apache.org
https://mesosphere.com
Apache Mesos/Mesosphere
Apache Kafka
http://kafka.apache.org
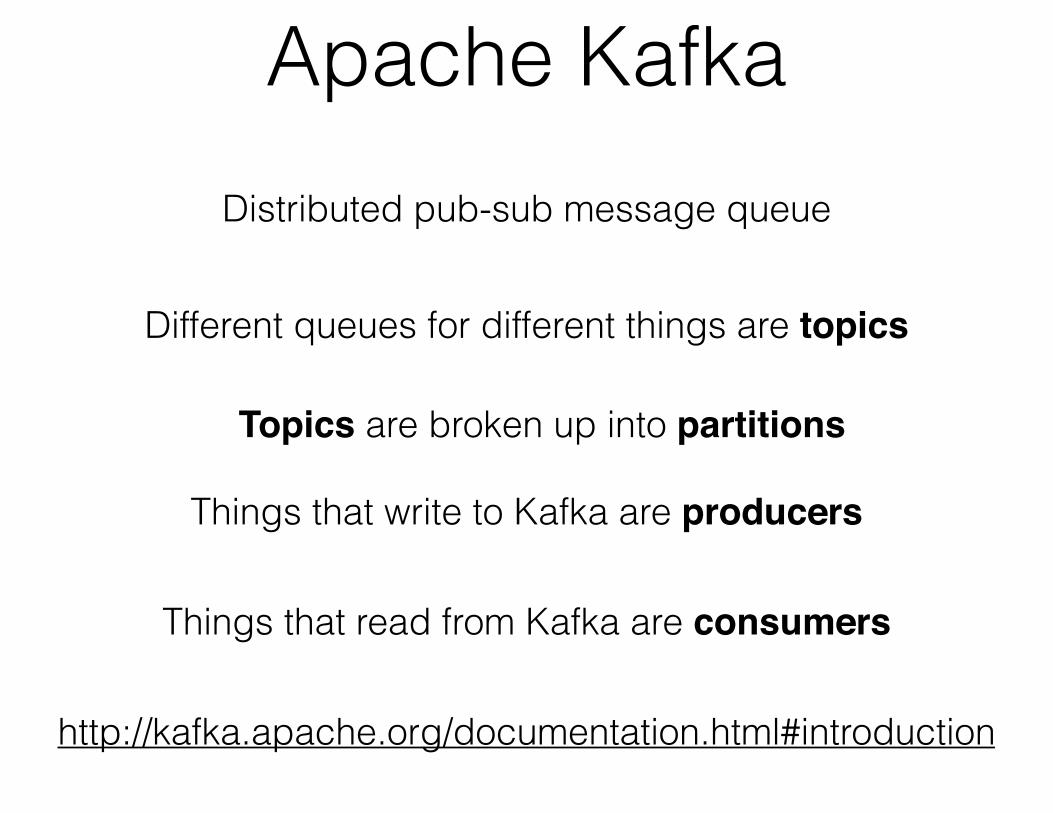
Apache KafkaDistributed pub-sub message queue
Different queues for different things are topics
Topics are broken up into partitions
Things that write to Kafka are producers
Things that read from Kafka are consumers
http://kafka.apache.org/documentation.html#introduction
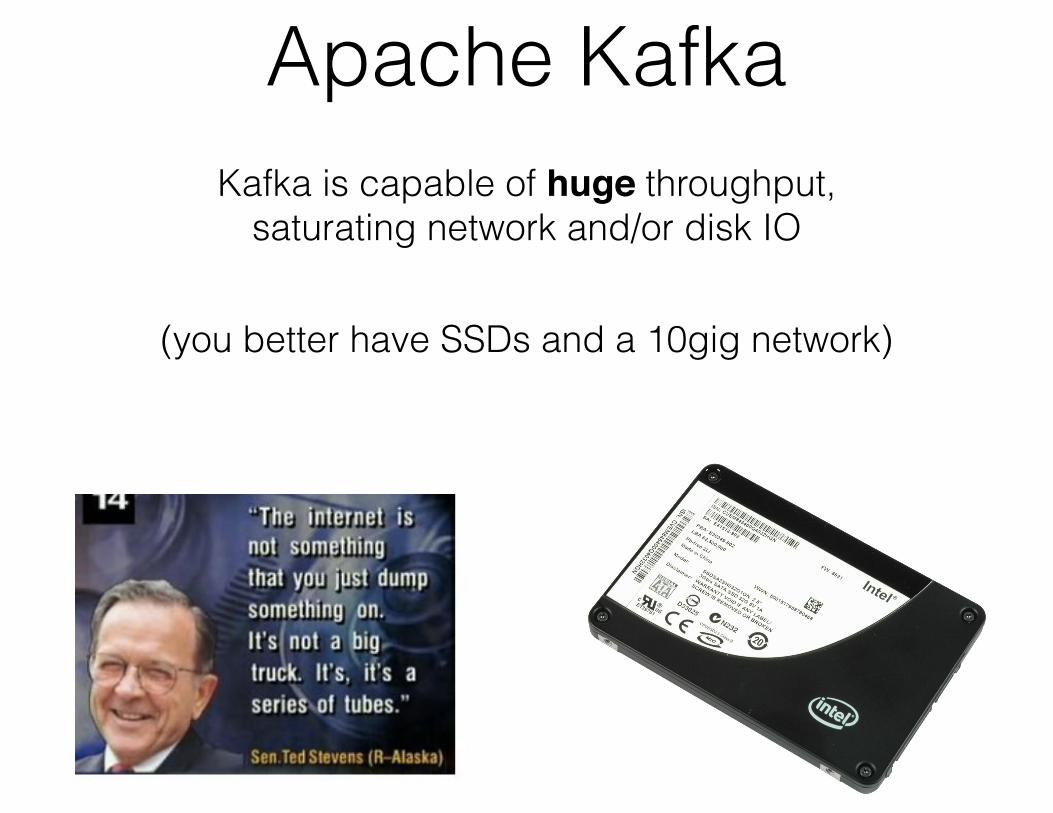
Apache KafkaKafka is capable of huge throughput,
saturating network and/or disk IO
(you better have SSDs and a 10gig network)
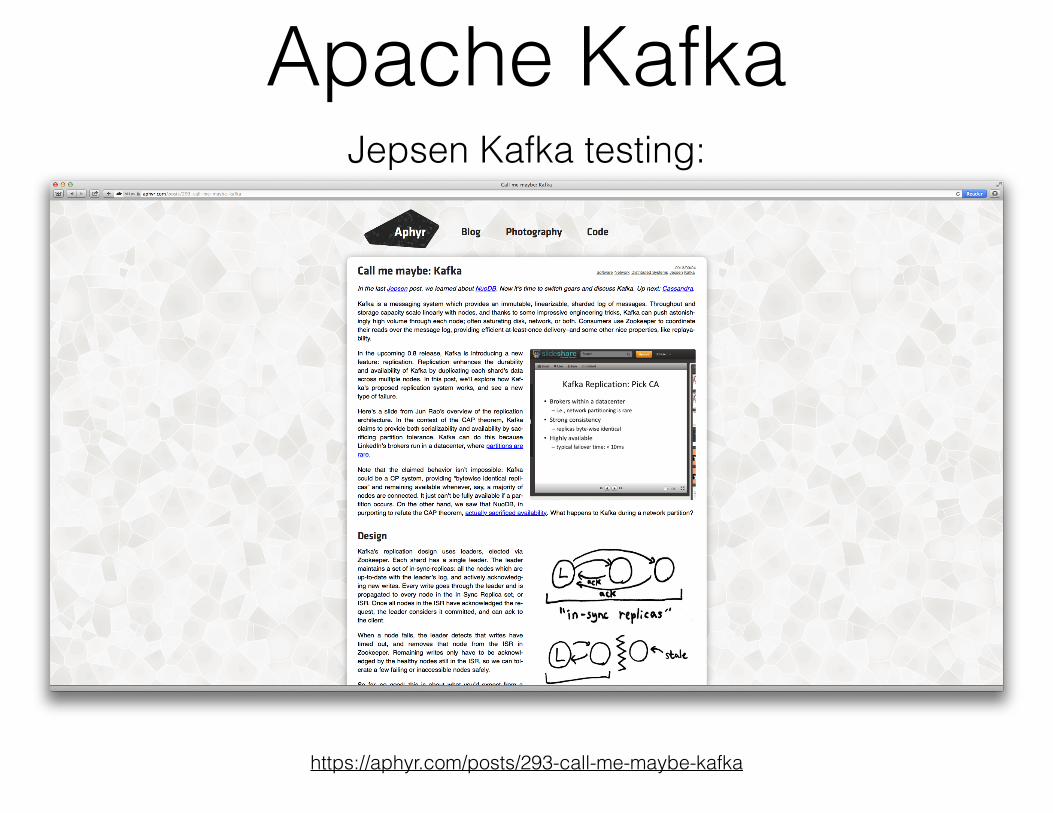
Apache KafkaJepsen Kafka testing:
https://aphyr.com/posts/293-call-me-maybe-kafka

Apache Storm and Kafka
Spouts = consumers
Bolts = producers (if they’re not writing to
another spout)
Tuples = messages
Source: https://storm.apache.org
Source: https://storm.apache.org
Streams = Kafka topics

Why use a message queue?
Message queues provide buffers and the ability to handle back pressure
Allowing spouts to read from a topic without expiring the messages after a single read lets you spin up separate
topologies in parallel for experimenting, etc.
If your producers/consumers are stateless, your topologies can be horizontally scalable
Stream processing and monitoring
Monitoring is an area where stream processing as a technique can be useful
Metrics, events, and logs are (usually) generated continuously…
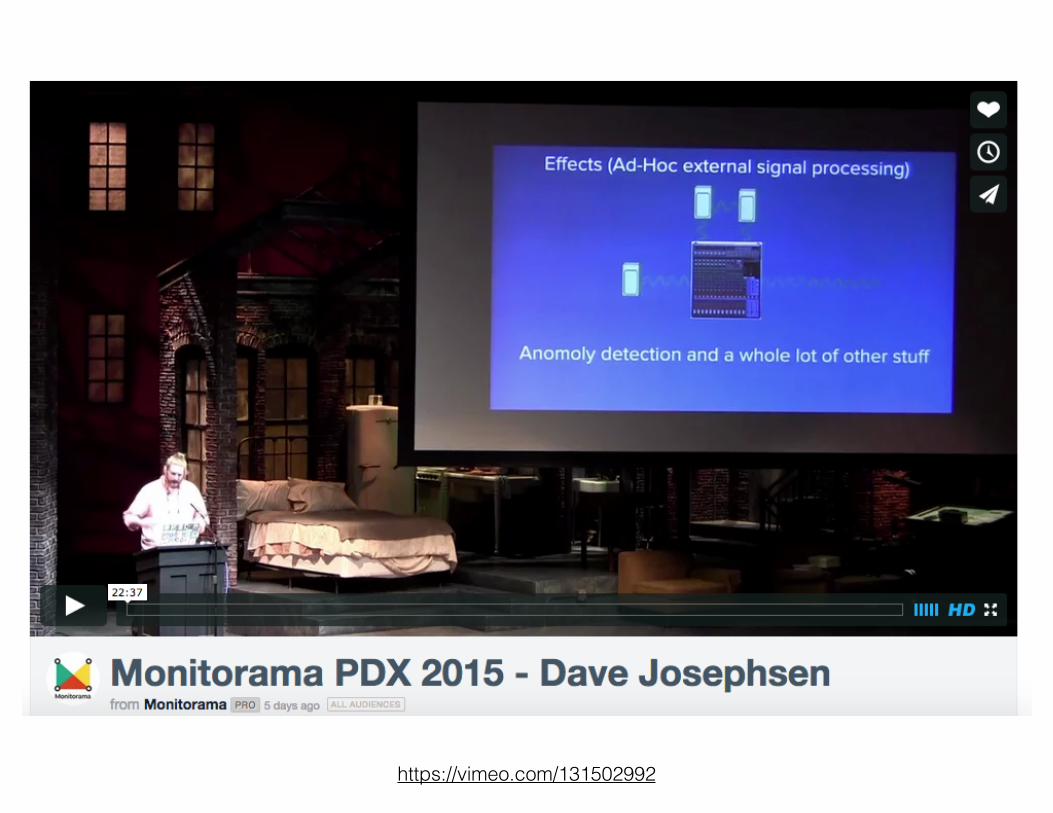
https://vimeo.com/131502992
Stream processing tools
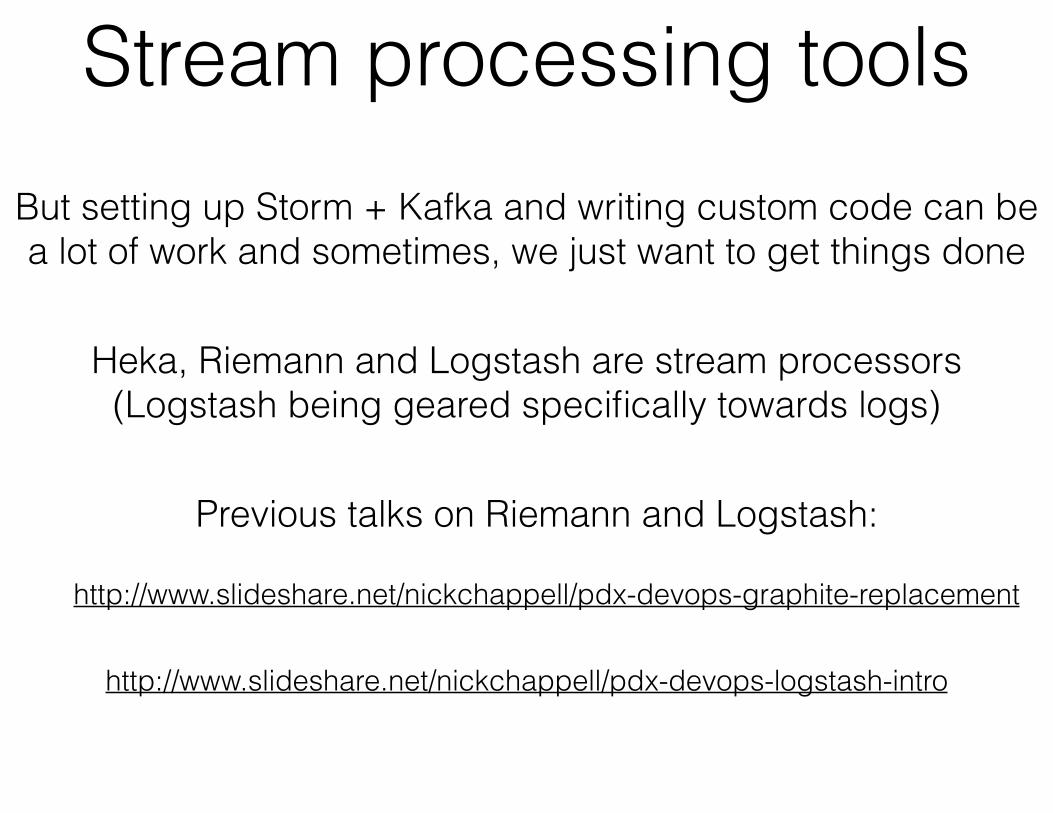
Stream processing toolsBut setting up Storm + Kafka and writing custom code can be a lot of work and sometimes, we just want to get things done
Heka, Riemann and Logstash are stream processors (Logstash being geared specifically towards logs)
http://www.slideshare.net/nickchappell/pdx-devops-graphite-replacement
http://www.slideshare.net/nickchappell/pdx-devops-logstash-intro
Previous talks on Riemann and Logstash:
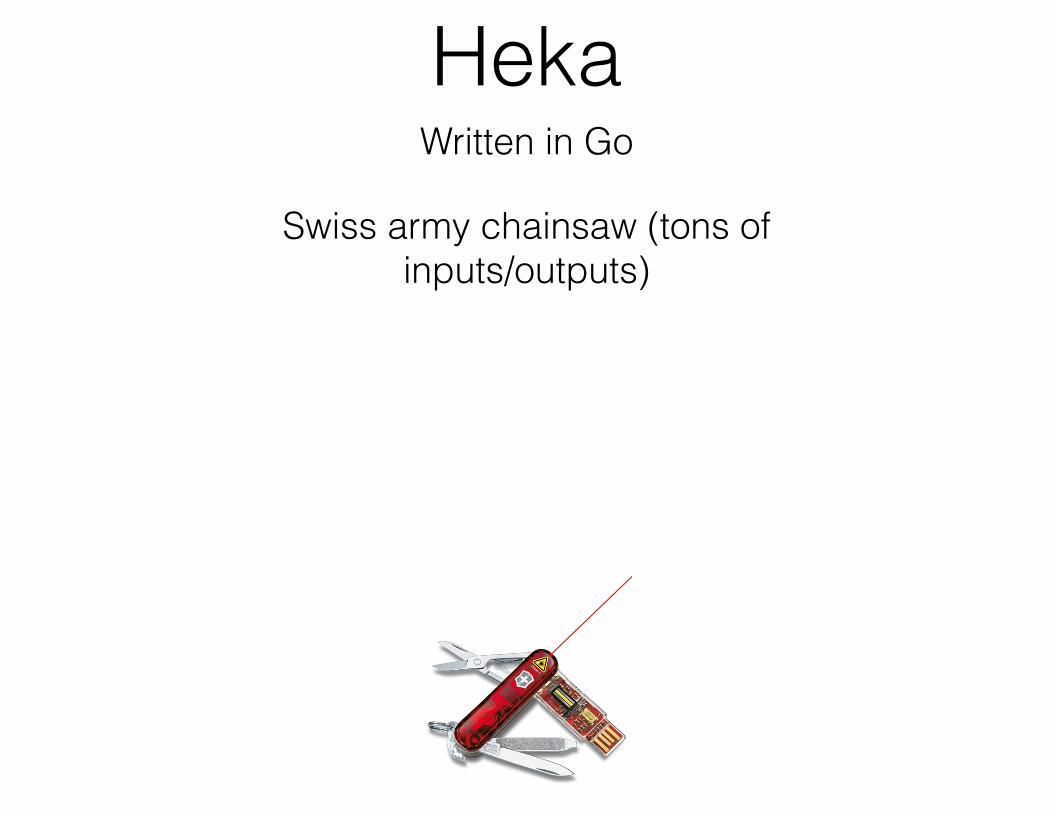
HekaWritten in Go
Swiss army chainsaw (tons of inputs/outputs)

Heka messages
:Timestamp: 2015-06-23 03:03:33.18044776 +0000 UTC!:Type: ProcessInput!:Hostname: dnsmaster1.local!:Pid: 10902!:Uuid: 6f8f1730-a72c-4dab-b3b4-a236c292eb77!:Logger: check_procs_critical!:Payload: PROCS WARNING: 98 processes | procs=98; 1:1 -c 2 -C sshd ;;0;!:EnvVersion:!:Severity: 7!:Fields:! | name:"ProcessInputName" type:string value:"check_procs_critical.stdout"
A Heka message represented as reStructured text (they’re really Go structs under the hood):
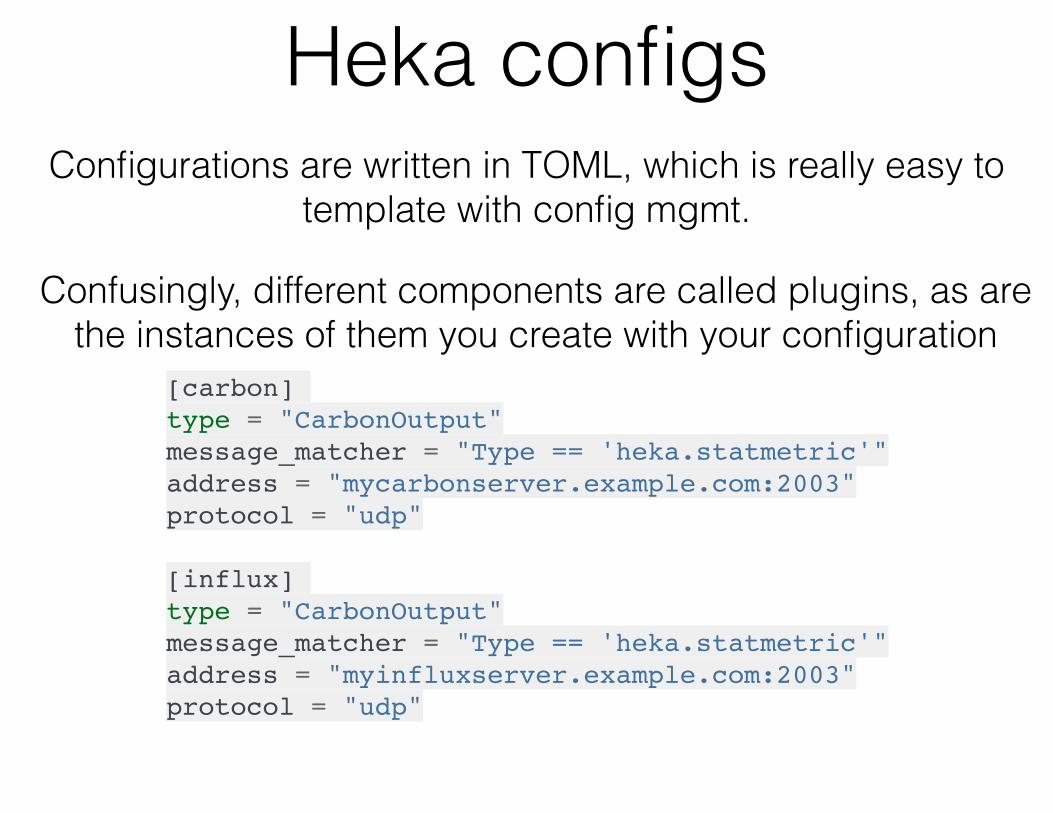
Heka configsConfigurations are written in TOML, which is really easy to
template with config mgmt.
Confusingly, different components are called plugins, as are the instances of them you create with your configuration
[carbon]!type = "CarbonOutput"!message_matcher = "Type == 'heka.statmetric'"!address = "mycarbonserver.example.com:2003"!protocol = "udp"!![influx]!type = "CarbonOutput"!message_matcher = "Type == 'heka.statmetric'"!address = "myinfluxserver.example.com:2003"!protocol = "udp"

Heka architecture
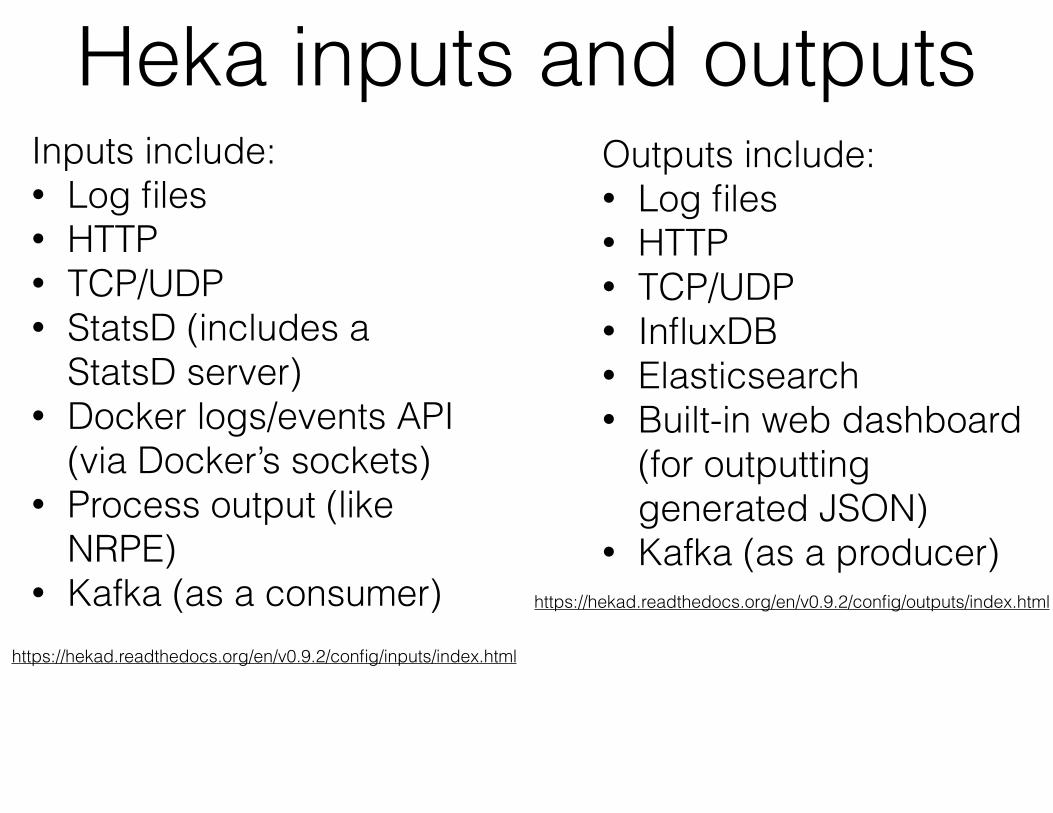
Heka inputs and outputsInputs include: • Log files • HTTP • TCP/UDP • StatsD (includes a
StatsD server) • Docker logs/events API
(via Docker’s sockets) • Process output (like
NRPE) • Kafka (as a consumer)
Outputs include: • Log files • HTTP • TCP/UDP • InfluxDB • Elasticsearch • Built-in web dashboard
(for outputting generated JSON)
• Kafka (as a producer)
https://hekad.readthedocs.org/en/v0.9.2/config/inputs/index.html
https://hekad.readthedocs.org/en/v0.9.2/config/outputs/index.html

Decoders take inputs and turn them into Heka messages
Encoders take Heka messages and turn them into a form or wire format that can be used by an output (ex: turn a Heka
message into Elasticsearch-compatible JSON, then hand it off to an HTTP output which talks to the ES API)
Heka decoders and encoders

Heka encoders and decodersInputs specify what decoder to use:
Outputs specify what encoder to use:[ElasticSearchOutput]!message_matcher = "Type == 'sync.log'"!server = "http://es-server:9200"!flush_interval = 5000!flush_count = 10!encoder = "ESJsonEncoder"
[nginx_access_logs]!type = "LogstreamerInput"!splitter = "TokenSplitter"!decoder = "nginx_access_decoder"!log_directory = "/var/log/nginx"!file_match = 'access\.log\.?(?P<Index>\d+)?(.gz)?'!priority = ["^Index"]
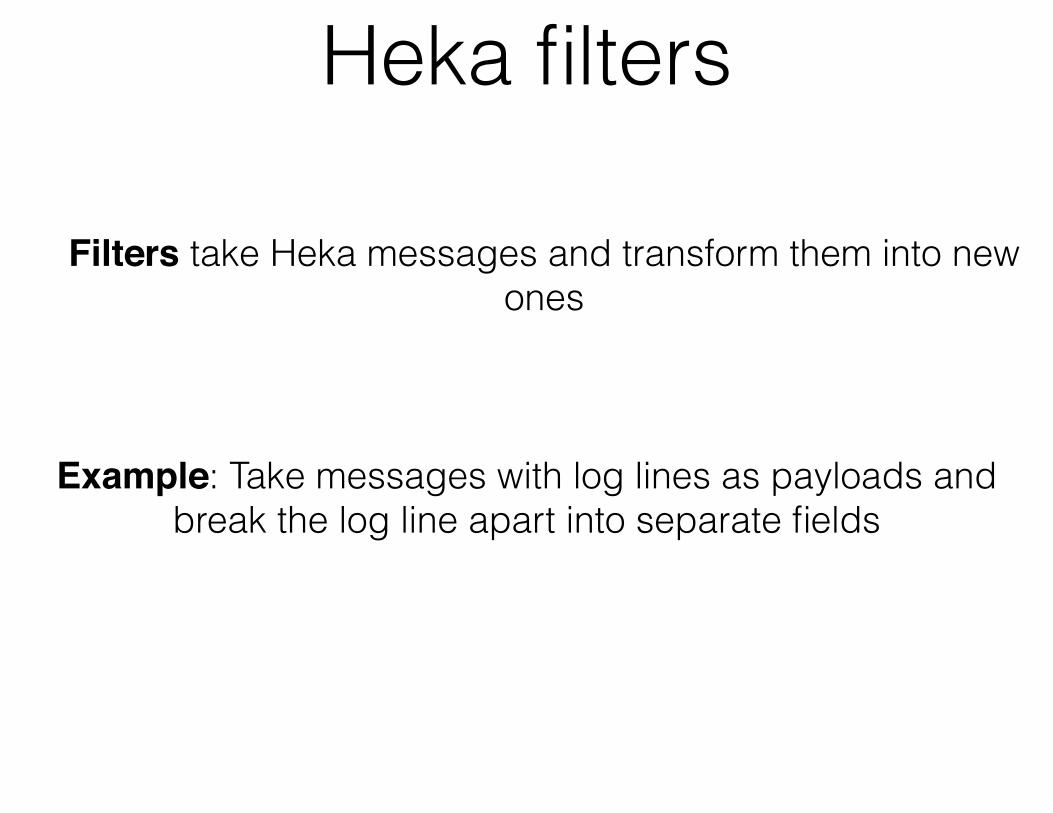
Filters take Heka messages and transform them into new ones
Heka filters
Example: Take messages with log lines as payloads and break the log line apart into separate fields
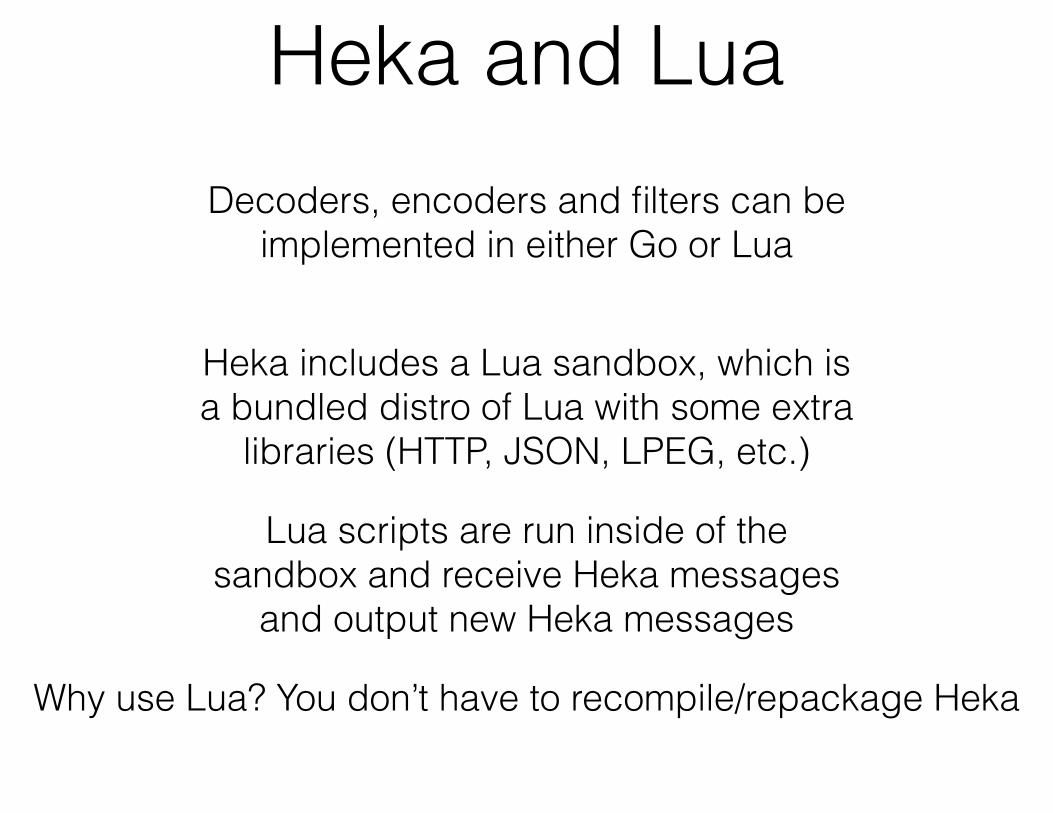
Decoders, encoders and filters can be implemented in either Go or Lua
Heka and Lua
Why use Lua? You don’t have to recompile/repackage Heka
Heka includes a Lua sandbox, which is a bundled distro of Lua with some extra
libraries (HTTP, JSON, LPEG, etc.)
Lua scripts are run inside of the sandbox and receive Heka messages
and output new Heka messages
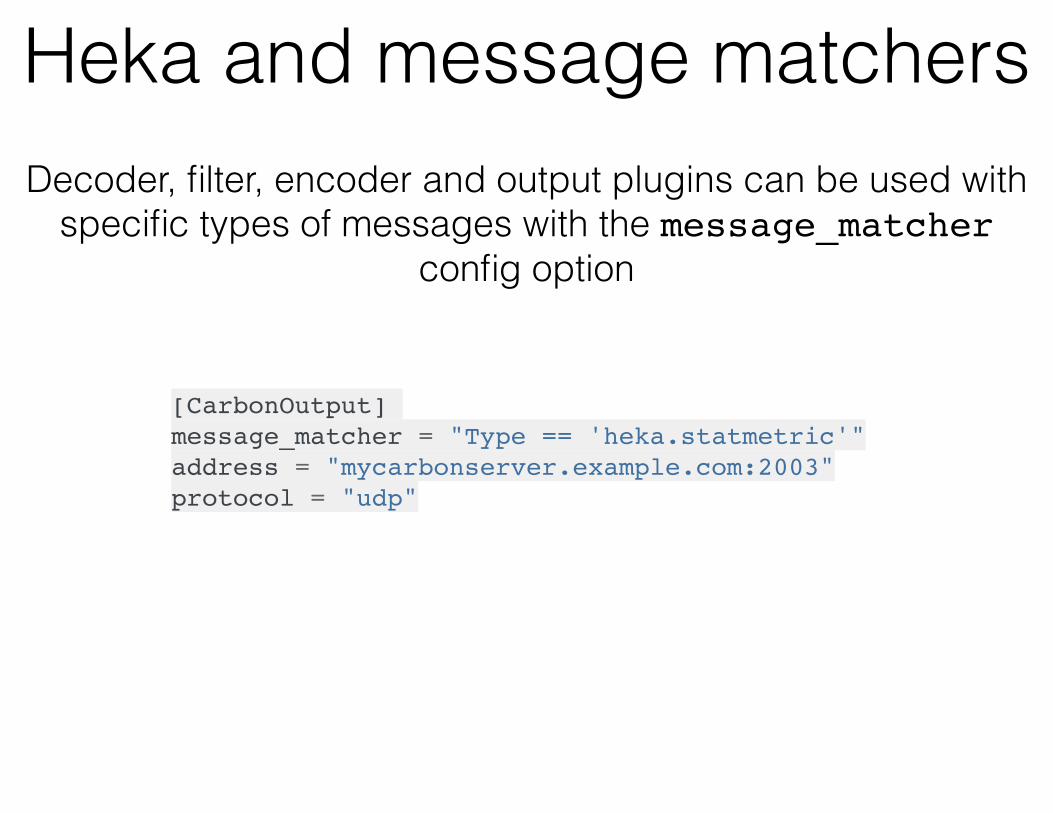
Heka and message matchersDecoder, filter, encoder and output plugins can be used with
specific types of messages with the message_matcher config option
[CarbonOutput]!message_matcher = "Type == 'heka.statmetric'"!address = "mycarbonserver.example.com:2003"!protocol = "udp"
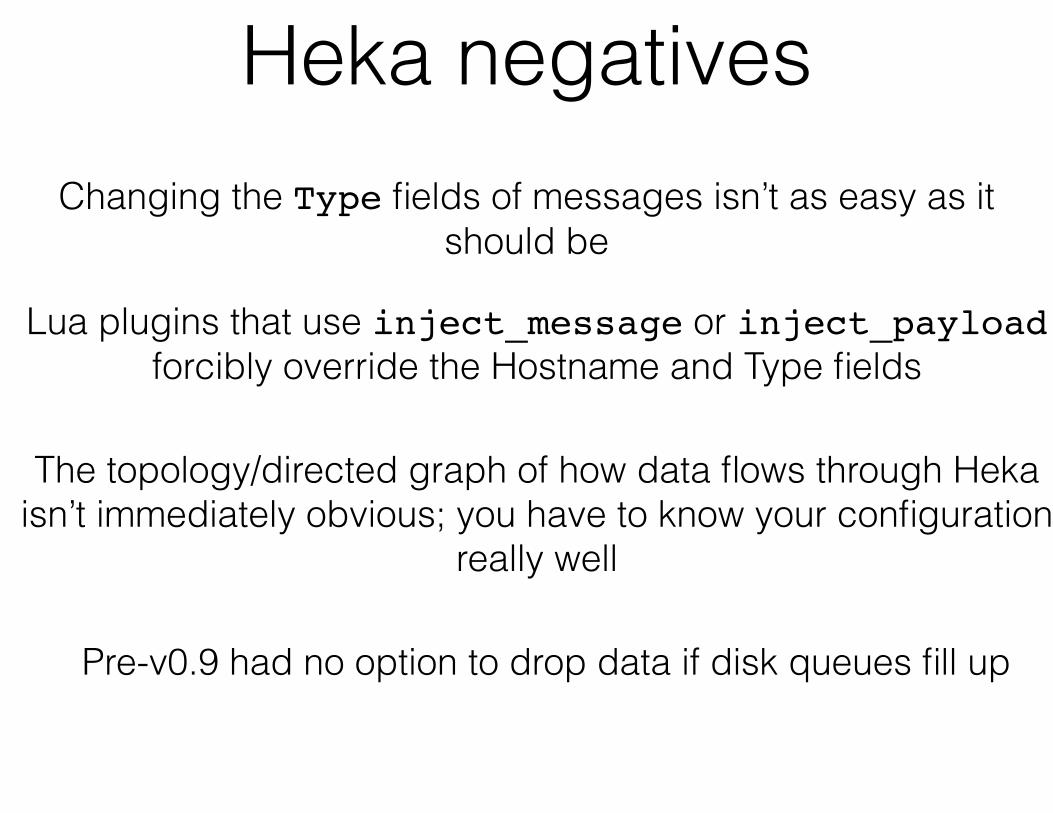
Heka negativesChanging the Type fields of messages isn’t as easy as it
should be
Lua plugins that use inject_message or inject_payload!forcibly override the Hostname and Type fields
The topology/directed graph of how data flows through Heka isn’t immediately obvious; you have to know your configuration
really well
Pre-v0.9 had no option to drop data if disk queues fill up

Heka negatives
…according to Rob Miller (Heka dev at Mozilla), overhead of goroutines/channels puts an upper ceiling on Heka’s
performance
Hindsight is a thin C wrapper around the same Lua sandbox Heka uses and should perform better:
https://github.com/trink/hindsight
Performance is usually pretty good, but…
…moving to the Lua sandbox and back involves memory copies (we ran into memory leaks too)

Heka and Kafka
https://hekad.readthedocs.org/en/v0.9.2/config/inputs/kafka.html
https://hekad.readthedocs.org/en/v0.9.2/config/outputs/kafka.html
As a Kafka consumer:
As a Kafka producer:
Heka’s possible uses
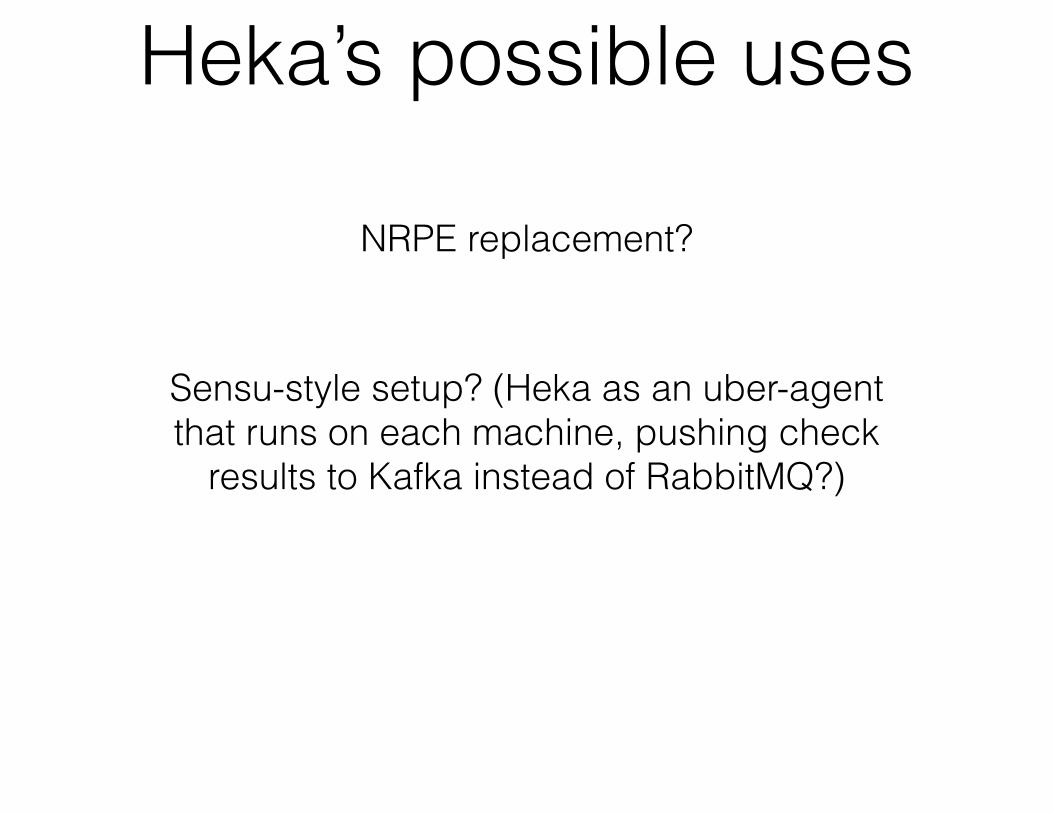
NRPE replacement?
Sensu-style setup? (Heka as an uber-agent that runs on each machine, pushing check
results to Kafka instead of RabbitMQ?)

https://vimeo.com/131581322
Heka at Monitorama
Heka and config management
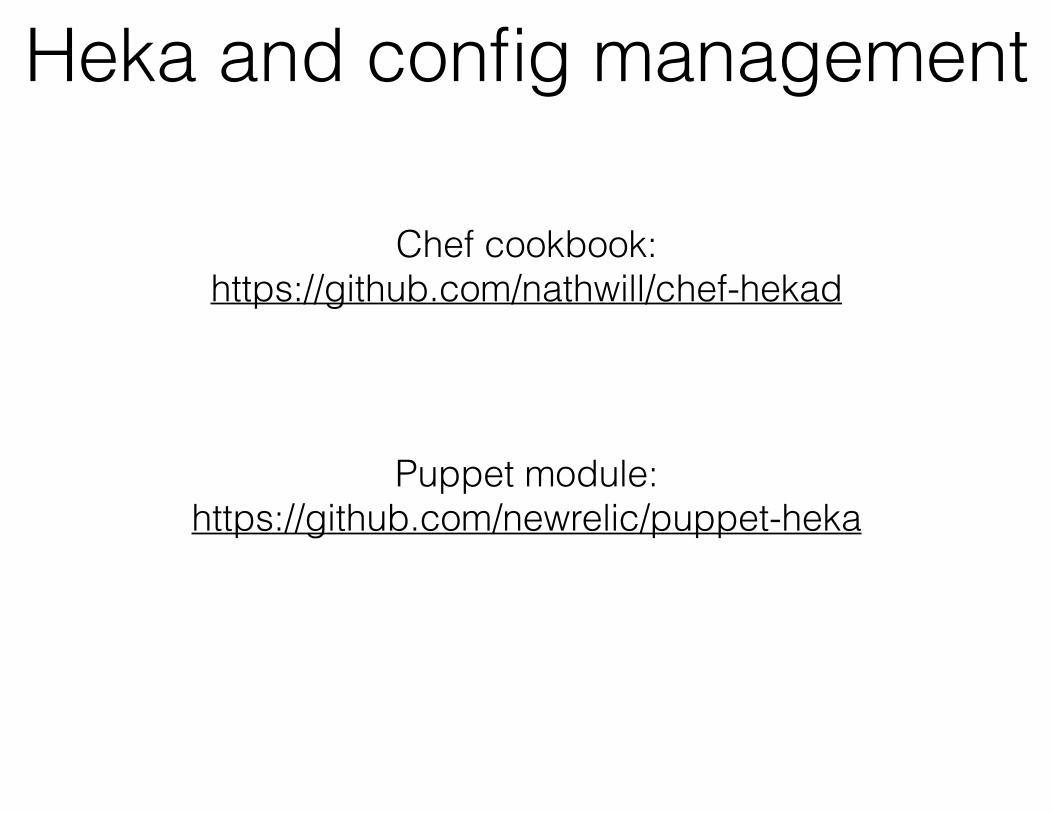
Puppet module: https://github.com/newrelic/puppet-heka
Chef cookbook: https://github.com/nathwill/chef-hekad
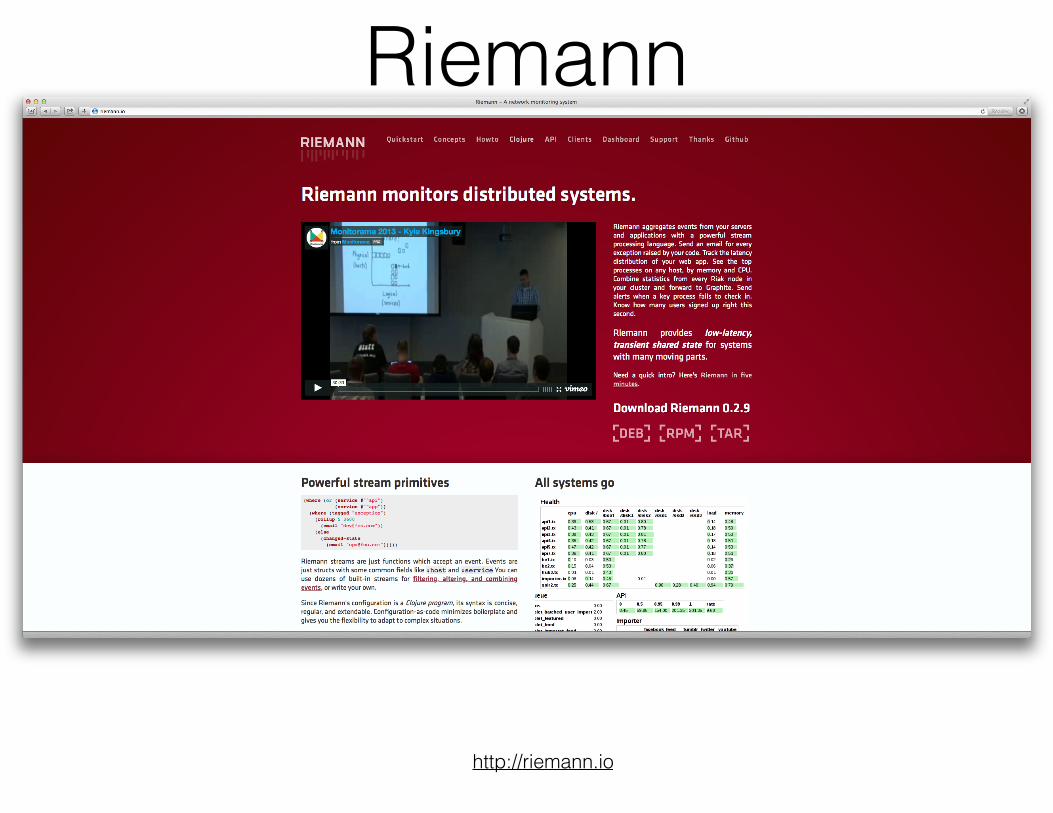
Riemann
http://riemann.io
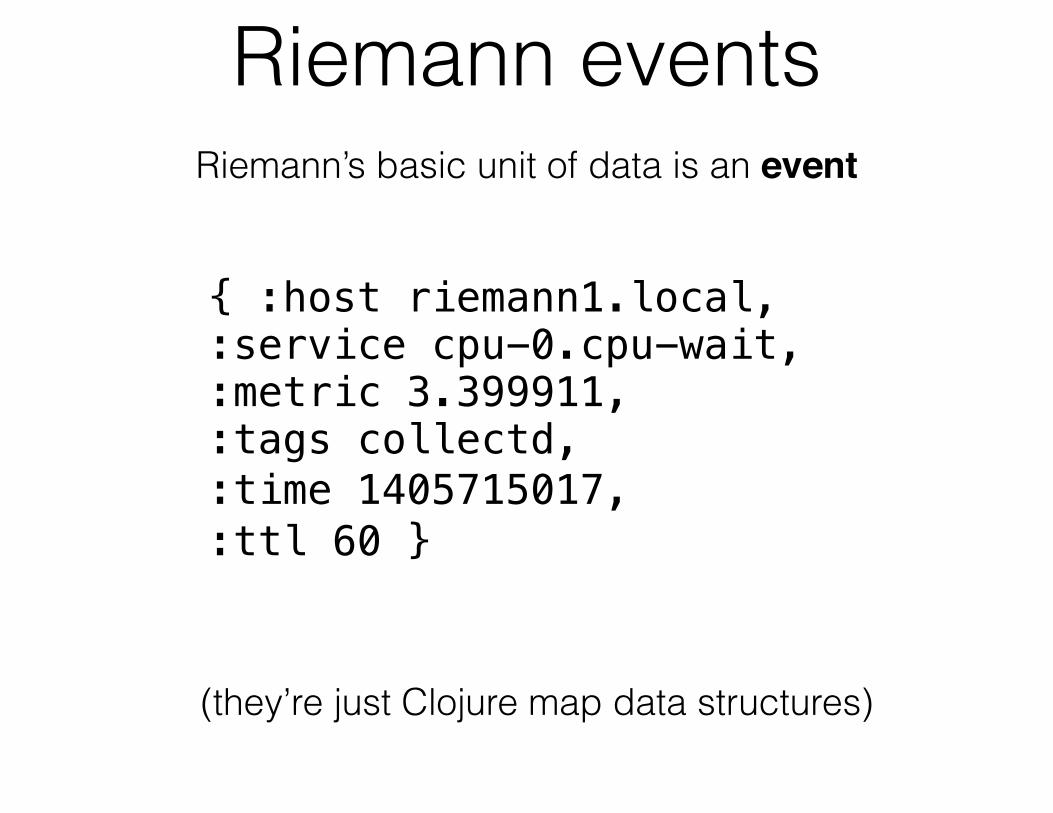
Riemann eventsRiemann’s basic unit of data is an event
{ :host riemann1.local, :service cpu-0.cpu-wait, :metric 3.399911, :tags collectd, :time 1405715017,:ttl 60 }
(they’re just Clojure map data structures)
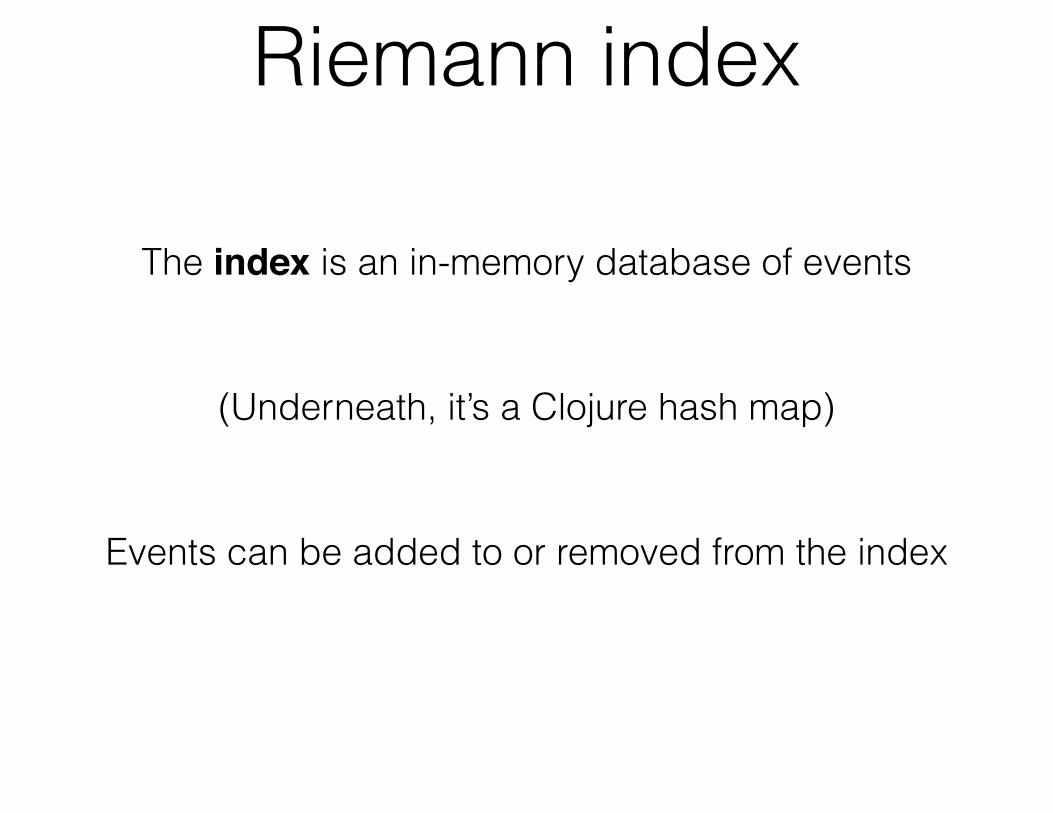
Riemann index
The index is an in-memory database of events
Events can be added to or removed from the index
(Underneath, it’s a Clojure hash map)

Riemann configurationConfiguration is a Clojure program:
(streams! #(info %) ; First, measure here! (where (service #"^riak .+")! #(info %) ; Then move the info stream here to check the filter! (by :service! (coalesce! #(info %) ; Third, check the coalesced vector of events! (smap folds/maximum! #(info %) ; Fourth, probe here to check the maximum calculation! (with :host nil! #(info %) ; Finally, check exactly what events are being applied! ; to the index.! index))))))
Source: http://riemann.io/howto.html
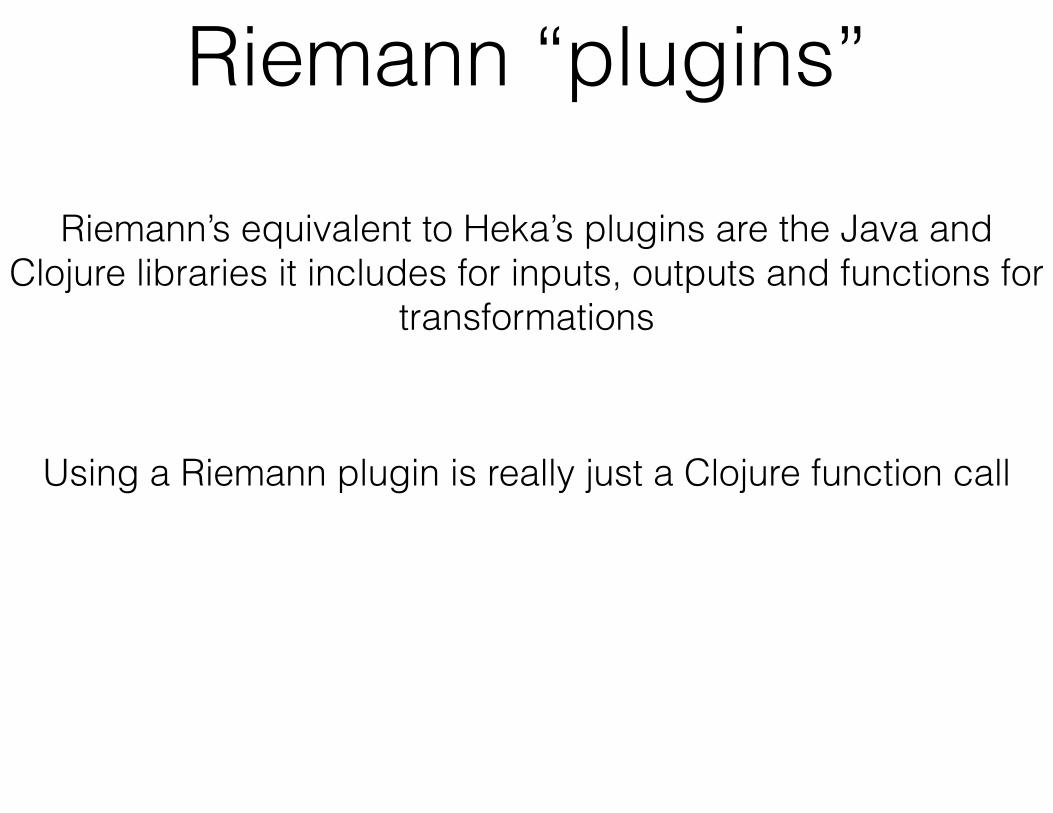
Riemann “plugins”
Riemann’s equivalent to Heka’s plugins are the Java and Clojure libraries it includes for inputs, outputs and functions for
transformations
Using a Riemann plugin is really just a Clojure function call
Riemann “plugins”Inputs and outputs for TCP/UDP, HTTP, Graphite’s carbon
format…
Outputs to InfluxDB, OpenTSDB, Nagios, email, a bunch of SaaS services (PagerDuty, Librato, OpsGenie, Logentries)….
http://riemann.io/api.html

Riemann “plugins”Add functionality by either writing Clojure functions and
referencing them or including Java/Clojure/Scala library .jar files in Riemann’s class path
Adding Clojure functions to configs doesn’t require a recompile of Riemann as it includes the Clojure compiler
Riemann streams
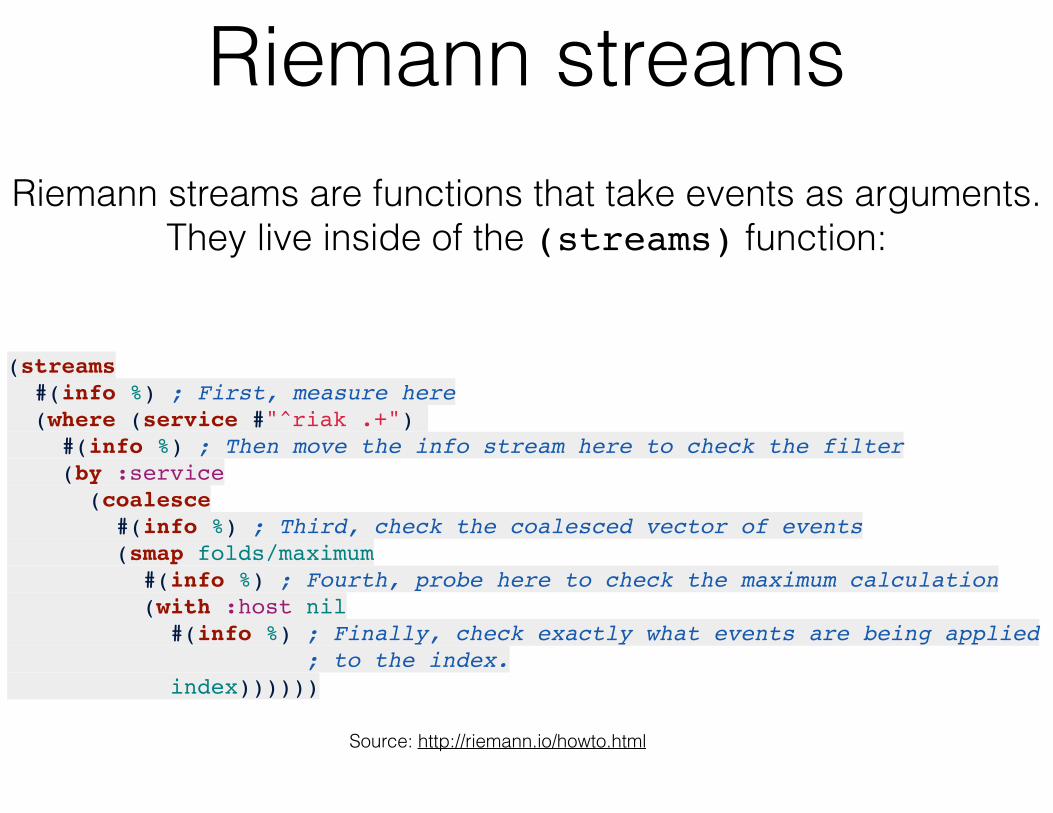
(streams! #(info %) ; First, measure here! (where (service #"^riak .+")! #(info %) ; Then move the info stream here to check the filter! (by :service! (coalesce! #(info %) ; Third, check the coalesced vector of events! (smap folds/maximum! #(info %) ; Fourth, probe here to check the maximum calculation! (with :host nil! #(info %) ; Finally, check exactly what events are being applied! ; to the index.! index))))))
Riemann streams are functions that take events as arguments. They live inside of the (streams) function:
Source: http://riemann.io/howto.html

Riemann streams
What you’re making in a Riemann config is a Storm-style topology, but inside of a single process instead of being
spread across several machines
Not having to bounce in and out of Lua plugins is a plus!

Riemann negativesRunning on the JVM means the memory usage is too high to
run Riemann as an agent on all of your machines
A client written in Ruby and a bunch of language client libraries are available:
!http://riemann.io/clients.html
Clojure can have a high learning curve, but the code-as-data aspect of Lisp-like languages can get you some really
powerful abstractions
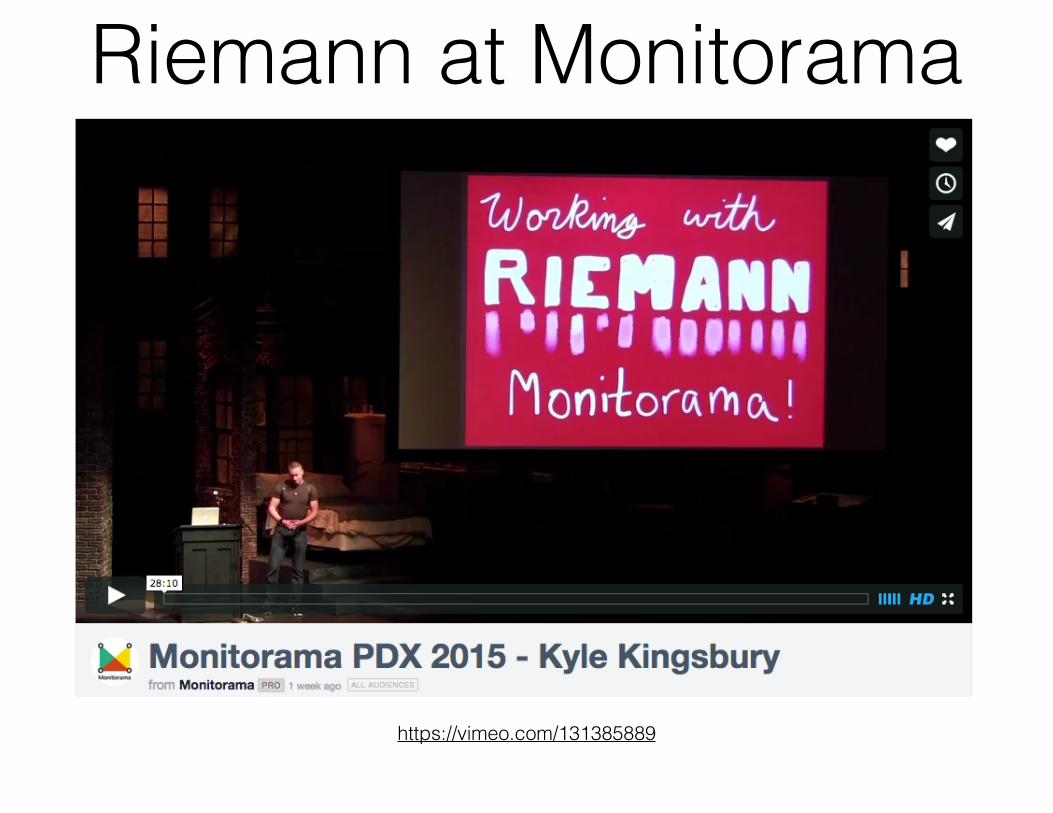
https://vimeo.com/131385889
Riemann at Monitorama
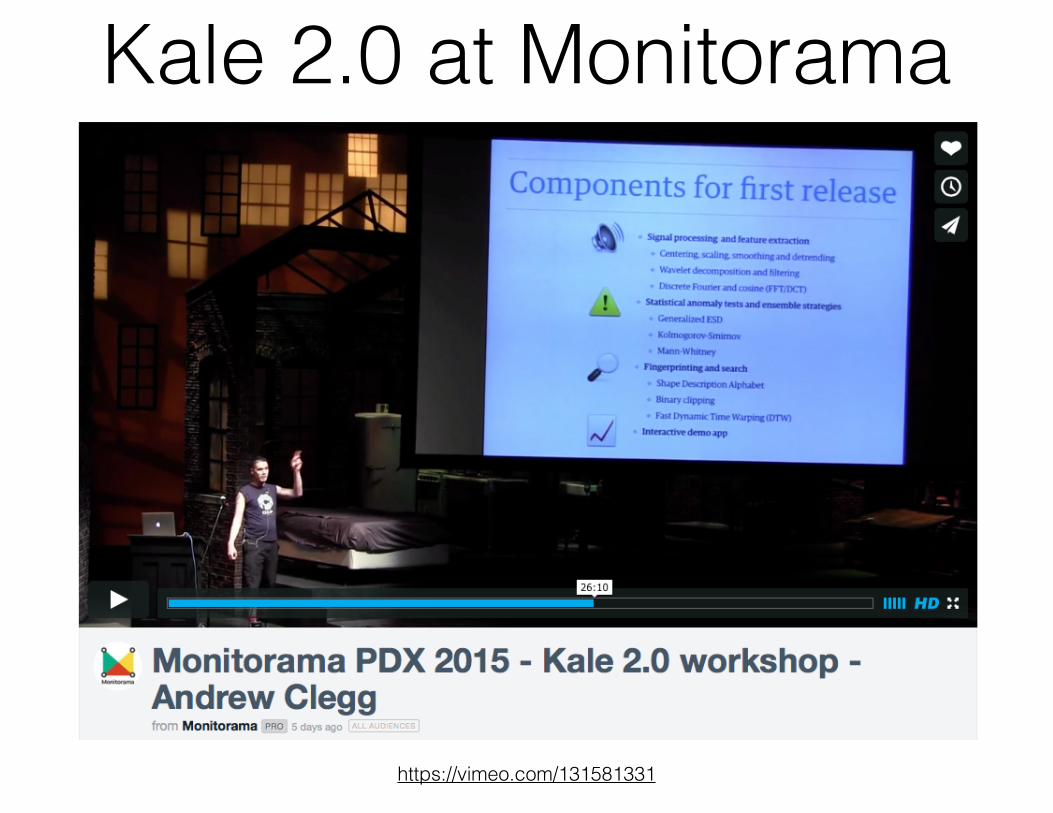
https://vimeo.com/131581331
Kale 2.0 at Monitorama