peak oil: a reality or hype? - skil
TRANSCRIPT

Electronic copy available at: http://ssrn.com/abstract=1084991
WORKING PAPER ──────────────────────────────
Peak Oil: a Reality or Hype? Mamdouh G. Salameh Oil Market Consultancy Service USAEE WP 08-005 January 2008
The United States Association for Energy Economics established this working paper series for the purpose of sharing members’ latest research findings and to facilitate the exchange of ideas. Papers included in the series have been approved for circulation by USAEE but have not been formally edited or peer reviewed. The findings and opinions expressed herein are those of the individual author(s) and do not represent the official position or view of the USAEE.

The United States Association for Energy Economics (USAEE) is a non-profit organization of academic, business, government, and other professionals that strives to advance the understanding and application of economics across all facets of energy development and use, including theoretical, applied, and policy perspectives. The USAEE was founded in 1994 to provide a forum for the exchange of ideas, experiences and issues among professionals interested in energy economics. For more information on membership programs, conferences, and publications of the USAEE, visit our website: www.usaee.org USAEE Council Members, 2008 Wumi Iledare, President Joe Dukert, President Elect Peter Nance, Past President Charles Rossmann, VP Conferences Mina Dioun, VP Chapter Liaison James Smith, VP Academic Affairs Mary Barcella, VP Communications Jonathan Story, Secretary-Treasurer Kathleen Spees, Student Representative Lori Smith Schell Peter Hartley Rick Karp Glenn Sweetnam

USAEE Working Paper Series ------------------------------------------------------------- Peak Oil: a Reality or Hype? ---------------------------------------------------------------- By Dr Mamdouh G. Salameh Director Oil Economist World Bank Consultant UNIDO Technical Expert Oil Market Consultancy Service Spring Croft Sturt Avenue Haslemere Surrey GU27 3SJ United Kingdom Tel: (01428) – 644137 Fax: (01428) – 656262 e-mail: [email protected]

Peak Oil: A Reality or Hype? ------------------------------------------------------------------------------------------------------------ By Dr Mamdouh G. Salameh* Introduction Seven years into the 21st century, the United States and the world remain heavily dependent on the fuel that powered the last 100 years: crude oil. President Bush has gone so far as to call that dependence an “addiction”. Concern about the depletion of conventional global oil reserves seems to have intensified for several reasons, including technological improvements in geological data gathering and analysis, the increasingly sparse reserves discovered by new drilling, question marks over the real size of global proven reserves and concerns that much of the world’s conventional oil especially in the Middle East, is coming from old and over-exploited mega-fields that are becoming less productive. There is no risk that we are running out of oil but chances of being able to match the projected growth in demand over the medium term with a rise in production is being seriously questioned. Opinions on peak oil range from optimistic predictions that the market economy will produce a solution to predictions of doomsday scenarios of a global economy unable to meet its energy needs. The reality, as is always the case, is somewhere in between. The Peak Oil Theory Peak oil theory, also known as the Hubbert peak theory after the American Geologist H King Hubbert, concerns the long-term rate of extraction and depletion in conventional oil and other fossil fuels. It states that any finite resource such as crude oil will have a beginning, middle and an end of production, and at some point it will peak. Oil production typically follows a bell-shaped curve when charted on a graph with the peak of production occurring when approximately half of the oil has been extracted. With some exceptions, this holds true for a single well, a whole field, an entire region, and presumably the world (see Figure 1). Peak Oil does not mean 'running out of oil', but 'running out of cheap oil'. There is a big difference between oil supplies not running out, and supply meeting demand. So When Will Oil Peak Globally? A great battle is raging today, largely behind the scenes, about when will global conventional oil production peak and what will happen when we do. In one camp are the “optimists” who tell us that 2 trillion barrels of oil or more remain to be exploited in oil reserves and future discoveries. In the other camp are the “realists” who reckon that 1 trillion barrels of oil, or less, are left. In a society that has allowed its economies to become geared almost inextricably to growing supplies of cheap oil, the difference between 1 and 2 trillion barrels is seismic.
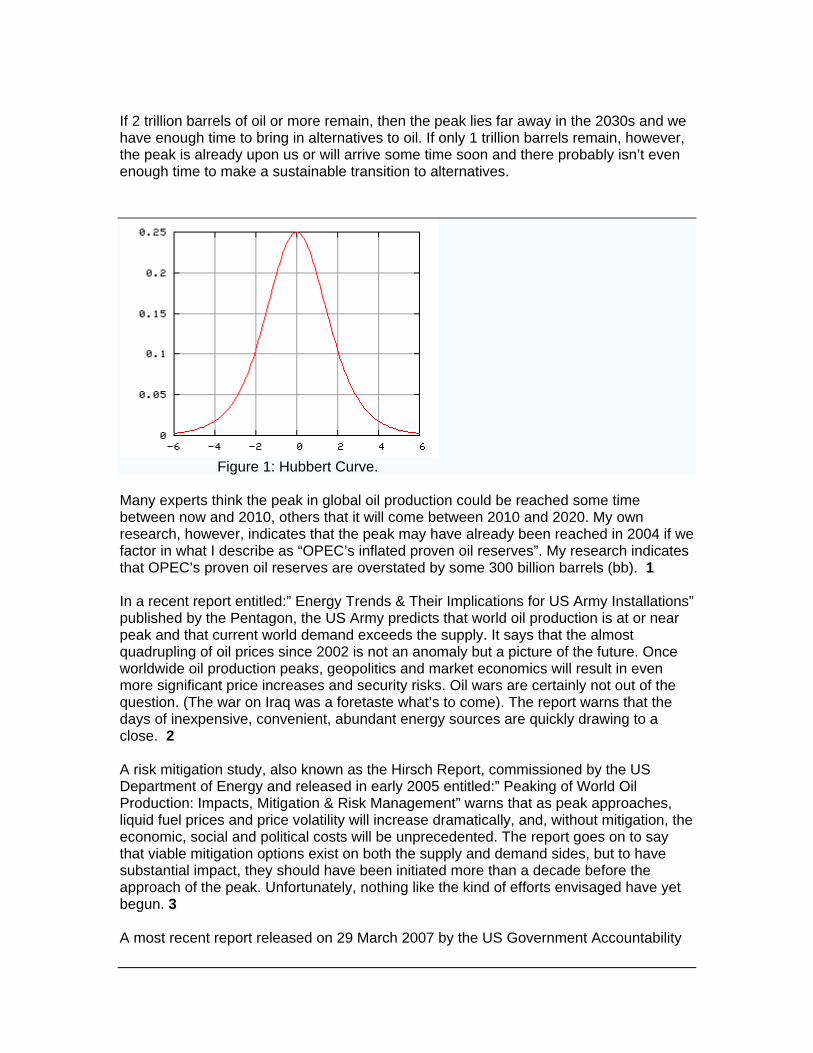
If 2 trillion barrels of oil or more remain, then the peak lies far away in the 2030s and we have enough time to bring in alternatives to oil. If only 1 trillion barrels remain, however, the peak is already upon us or will arrive some time soon and there probably isn’t even enough time to make a sustainable transition to alternatives.
Figure 1: Hubbert Curve. Many experts think the peak in global oil production could be reached some time between now and 2010, others that it will come between 2010 and 2020. My own research, however, indicates that the peak may have already been reached in 2004 if we factor in what I describe as “OPEC’s inflated proven oil reserves”. My research indicates that OPEC’s proven oil reserves are overstated by some 300 billion barrels (bb). 1 In a recent report entitled:” Energy Trends & Their Implications for US Army Installations” published by the Pentagon, the US Army predicts that world oil production is at or near peak and that current world demand exceeds the supply. It says that the almost quadrupling of oil prices since 2002 is not an anomaly but a picture of the future. Once worldwide oil production peaks, geopolitics and market economics will result in even more significant price increases and security risks. Oil wars are certainly not out of the question. (The war on Iraq was a foretaste what’s to come). The report warns that the days of inexpensive, convenient, abundant energy sources are quickly drawing to a close. 2 A risk mitigation study, also known as the Hirsch Report, commissioned by the US Department of Energy and released in early 2005 entitled:” Peaking of World Oil Production: Impacts, Mitigation & Risk Management” warns that as peak approaches, liquid fuel prices and price volatility will increase dramatically, and, without mitigation, the economic, social and political costs will be unprecedented. The report goes on to say that viable mitigation options exist on both the supply and demand sides, but to have substantial impact, they should have been initiated more than a decade before the approach of the peak. Unfortunately, nothing like the kind of efforts envisaged have yet begun. 3 A most recent report released on 29 March 2007 by the US Government Accountability

Office (GAO) and entitled “Crude Oil: Uncertainty about Future Oil Supply Makes it Important to Develop a Strategy for Addressing a Peak & Decline in Oil Production”, warned that a peak in oil production could occur any time between now and 2040 and that the US government was totally unprepared. The report concludes that “the prospect of a peak presents problems of global proportion whose consequences will depend critically on our preparedness. The consequences would be most dire if a peak occurred soon, without warning, and was followed by a sharp decline in oil production because alternative energy sources, particularly for transportation, are not yet available in large quantities. Such a peak would require sharp reductions in oil consumption, and the competition for increasingly scarce energy would drive up prices, possibly to unprecedented levels, causing severe economic damage”. Eight of the top oil producers in the world have already peaked. USA peaked in 1971, Canada in 1973, Iran in 1974, Indonesia 1977, Russia in 1987, UK in 1999, Norway in 2001 and Mexico in 2002 while China and even Saudi Arabia are about to peak (see Table 1). The only one among the top producers that has clear capability to increase production is Iraq once stability is restored to the country. Table 1 The Peak & Depletion of Conventional Crude Oil --------------------------------------------------------------------------------------------------------------------- Country Date of Peak Date of Peak % % Ultimate Discovery Production Discovered Depleted Production (bb --------------------------------------------------------------------------------------------------------------------- China 1960s 2006 93 47 57 Canada 1950s 1973 95 76 25 Iran 1960s 1974 94 76 130 Iraq 1970s 2019 87 20 135 Indonesia 1950s 1977 93 65 31 Kuwait 1950s 1971 93 34 90 Libya 1960s 1970 94 42 55 Mexico 1950s 2002 94 55 55 Norway 1970s 2001 93 48 33 Russia 1940s 1987 94 61 200 Saudi Arabia1940s 2013 96 31 300 UAE 1960s 2014 94 23 78 UK 1970s 1999 94 63 32 USA 1930s 1972 98 88 195 Venezuela 1950s 1970 96 48 95 The World 1962 2005-2010 94 49 2100 ---------------------------------------------------------------------------------------------------------------------Sources: Association for the Study of Peak Oil’s (ASPO) websit www.peakoil.net / The Energyfiles Ltd / Chevron / Petroleum Review. Moreover, three of the world’s largest oilfields have already peaked. Kuwait’s Burgan, the world’s second largest accounting for 60% of Kuwait’s reserves, peaked in November 2005 at 1.7 million barrels a day (mbd). 4 Also Mexico’s giant Cantarell peaked in March 2006 and has seen its production fall from 1.99 mbd to 1.44 mbd between January and December 2006 and is projected to drop another 400,000 barrels a day (b/d) by the end of this year. 5 Saudi Arabia’s Ghawar, the world’s largest oilfield

accounting for 60% of Saudi oil production, or 5 mbd, peaked in April 2006 and is now declining at a rate of 8% per year. 6 Many experts have questioned the exact size of Saudi Arabia’s reserves and also those of OPEC. The Saudis claim to have more than 258 bb of proven reserves. However, more recently a former director of exploration and production in Saudi Aramco, Mr Saddad al-Husseini has said that Saudi Arabia’s proven developed reserves stand at 130 bb. 7 Saudi plans for massively increasing its oil production capacity to 15 mbd over the next two decades are generally considered to be a pipedream. 8 Saudi oil production is projected to peak at 12 mbd. 9 Saudi Arabia’s four biggest oilfields (Ghawar, Safaniya, Hanifa and Khafji) are all more than fifty years old, having produced almost all Saudi oil in the last half century. These days they have to be kept flowing in large measure by injection of water. This is of explosive significance since they could be on the verge of seeing a collapse of 30%-40% of their production in the imminent future and imminent means sometime in the next three to five years – but it could even be tomorrow. 10 Iran is another case of highly inflated proven reserves. Although the 2007 issue of BP Statistical Review of World Energy and the Oil & Gas Journal (OGJ) cited 137.5 bb of proven reserves for Iran at the end of 2006, Dr Ali Muhammed Saidi, a retired expert of the National Iranian Oil Corporation (NIOC) estimates the proven reserves at no more than 37 bb. 11 Then in January 2006, Petroleum Intelligence Weekly (PIW) reported that instead of the 99 bb of proven reserves which Kuwait claims to have, it had seen internal documents professing that Kuwait’s proven reserves are only 24 bb, 15 bb of them the remaining oil in the Burgan oilfield. 12 In the US, discovery peaked in 1930 and production peaked 40 years later in1970. And despite all the technology we hear about, world discovery peaked in1962 and production of conventional oil peaked in 2006. As for the Middle East, discovery peaked in 1965 and peak production will be reached by 2009. Since production has to mirror discovery, it should surprise no one that we now face the corresponding peak of production. The Ultimate Global Proven Reserves Estimates at the beginning of 2007 indicate that there are just 1044 bb of conventional oil yet-to-produce. This is defined as the sum total of global remaining reserves and any reserve additions from new discoveries (see Table 2). The expert consensus is that the world peak will be reached when 1,050 bb of oil have been produced – that is to say, half the ultimate reserves of 2,100 bb. With1056 bb already produced, this means that conventional oil production peaked in 2006. However, if we factor in what I describe as “OPEC’s inflated proven oil reserves, then peak may have already occurred in 2004.

Table 2 Ultimate Global Conventional Oil Reserves & Depletion Rate (end of 2006) --------------------------------------------------------------------------------------------------------------------- Volume Description ---------------------------------------------------------------------------------------------------------------------Ultimate Reserves (bb) 2,100 Amount of production when production ceases. Produced so far (bb) 1,056 Until the end of 2006. Yet-to-produce (bb) 1,044 Ultimate reserves less produced. Discovered so far (bb) 1,984 Produced plus remaining reserves. Yet-to-find (bb) 116 Ultimate reserves less discovered. Discovery rate (bb/y) 7 Annual additions from new fields Depletion rate (%) 3 Annual production as % of the yet-to-produce --------------------------------------------------------------------------------------------------------------------- Sources: USGS / BP Statistical Review of World Energy, June 2007 / IHS Energy Group, World Petroleum Trends (WPT) 2003. What Does Peak Mean for Our Societies? We have allowed oil to become vital to virtually everything we do. 90 % of all our transportation, whether by land, air or sea, is fuelled by oil. 95% of all goods in shops involve the use of oil. Just to farm a single cow and deliver it to market requires six barrels of oil, enough to drive a car from New York to Los Angeles and back. 13 Our industrial societies and our financial systems were built on the assumption of continual growth – growth fuelled by ever more readily available cheap fossil fuels, particularly crude oil. Oil currently accounts for 36% of the world’s primary energy consumption and 95% of global transport fuel consumption (see Table 3). Table 3 Global Primary Energy Consumption, 2006 (mtoe) ------------------------------------------------------------------------------------------------------------ Crude Oil Natural Coal Nuclear Hydro- Total Gas Energy Electricity ------------------------------------------------------------------------------------------------------------ 3889.8 2574.9 3090.1 635.5 688.1 10878.4 36% 24% 28% 6% 6% 100% ------------------------------------------------------------------------------------------------------------ Source: BP Statistical Review of World Energy, June 2007. To evaluate other energy sources it helps to understand the concept of Net Energy, or the Energy Return on Investment (EROI). One of the reasons our economies have grown so abundant so quickly over the last few generations is precisely because oil has had an unprecedented high EROI ratio. In the early days of oil, for every barrel of oil used for exploration and drilling, up to 50 barrels of oil were found. More recently the ratio has declined to 5:1 and, in some cases, to 1.1. Certain alternative energy sources such as ethanol and biodiesel may actually have EROI ratios of less than 1. 14 Some alternative energy sources such as wind and hydro-power may have much better EROI ratio. However, their potential expansion may be limited by various physical

factors. Even in combination it may not be possible to gather from renewable energy anything like the amount of energy that industrial societies are accustomed to. Characteristics of Peak in Oil Production A peak in oil production would manifest itself by rapidly escalating prices, a slowdown in production, a growing supply deficit, declining discovery rate of new oil and also a declining Energy Return on Investment (EROI) ratio. All these characteristics exist today. (i)- Slowdown in Global oil Production The oil prices have almost quadrupled since 2002 rising from $20/b to more than $75/b in 2006. World oil production has virtually been flat since 2004 and the deficit between global supplies and demand is widening. It amounted to 2.80 mbd in 2005 and is projected to reach 10.70 mbd by 2010 rising to 29.42 mbd in 2020 and 34.50 mbd by 2030 (see Table 4). Table 4 Actual & Projected Global Oil Production, 2005-2030 (mbd) --------------------------------------------------------------------------------------------------------------------- 2005 2006 2010 2020 2030 --------------------------------------------------------------------------------------------------------------------- World demand 84.50 85.76 93.30 111.00 117.40 World supply 81.70 81.66 82.60 81.58 82.90 Conventional 81.10 79.94 79.80 77.38 76.90 Unconventional 1.60 1.72 2.80 4.20 6.00 Supply deficit - 2.80 - 4.10 - 10.70 - 29.42 - 34.50 ------------------------------------------------------------------------------------------------------------------- Sources: US Department of Energy’s International Energy Outlook, 2006 / IEA, World Energy Outlook 2006/ BP Statistical Review of World Energy, June 2007 /Author’s projections. (ii)- Declining Discovery Rate As for discovery rate, the world is currently consuming 31 bb a year, yet on average finding just over 6 bb a year. Over the period 1992-2006, only 23% of the global oil production has been replaced by new discoveries (see Table 5). Table 5 Global Crude Oil Reserve Additions, 1992-2006 (bb)
Year Added in Year Annual Production As % of Annual Production 1992 7.80 23.98 33 1993 4.00 24.09 17 1994 6.95 24.42 28 1995 5.62 24.77 23 1996 5.42 25.42 21 1997 5.92 26.22 23

1998 7.60 26.75 28 1999 13.00 26.22 50 2000 12.60 27.19 46 2001 8.90 27.81 32 2002 9.00 26.99 31 2003 2.27 28.11 8 2004 1.40 30.10 5 2005 0.91 30.84 3 2006 - 31.30 - 1992-2006 91.39 404.21 23 Average 6.09 26.94 23 Sources: IHS Group’s 2003 World Petroleum Trends Report (WPT) / BP Statistical Review of World Energy, 1993-2007. (iii)- Declining Energy Return on Investment (EROI) Ratio When oil production first began in the mid-nineteenth century, the largest oilfields recovered 50 barrels of oil for every barrel used in the extraction, transportation and refining giving it an EROI ration of 50:1. This ratio has now declined to 5:1 and, in some cases, to 1:1. (iv)- Tight Production Capacity Global production capacity has been virtually static since the late 1990s. Only when the oil price started to increase sharply from 2002 onwards did the major OPEC and non-OPEC producers decide to start investing in capacity expansion. Still the net global capacity addition amounted to only 1 mbd in 2006 and is projected to rise to 1.19 mbd by 2010 (see Table 6). Table 6 Capacity Addition & Capacity Erosion, 2005-2011 (mbd) ------------------------------------------------------------------------------------------------------------ 2005 2006 2007 2008 2009 2010 --------------------------------------------------------------------------------------------------------- OPEC new capacity 1.160 1.520 1.420 1.320 2.240 2.235 Non-OPEC capacity 1.416 1.865 2.320 1.886 1.710 1.035 Total new capacity 2.576 3.385 3.740 3.206 3.950 3.270 Capacity erosion & slippage* 1.526* 2.348* 2.440* 1.750* 2.328* 2.081* --------------------------------------------------------------------------------------------------------- Net new capacity 1.050 1.037 1.300 1.456 1.622 1.189 --------------------------------------------------------------------------------------------------------- Sources: Petroleum Review, April 2006. * Assumes 20% slippage and 10% capacity shortage The top five producers in the Arab Gulf: Iran, Iraq, Kuwait, Saudi Arabia and UAE currently produce around 21 mbd, a quarter of the global total. If global demand continues to rise at 1.5% per annum, these five countries will have to meet around two-thirds of the global demand. The combined current net capacity of the five Gulf
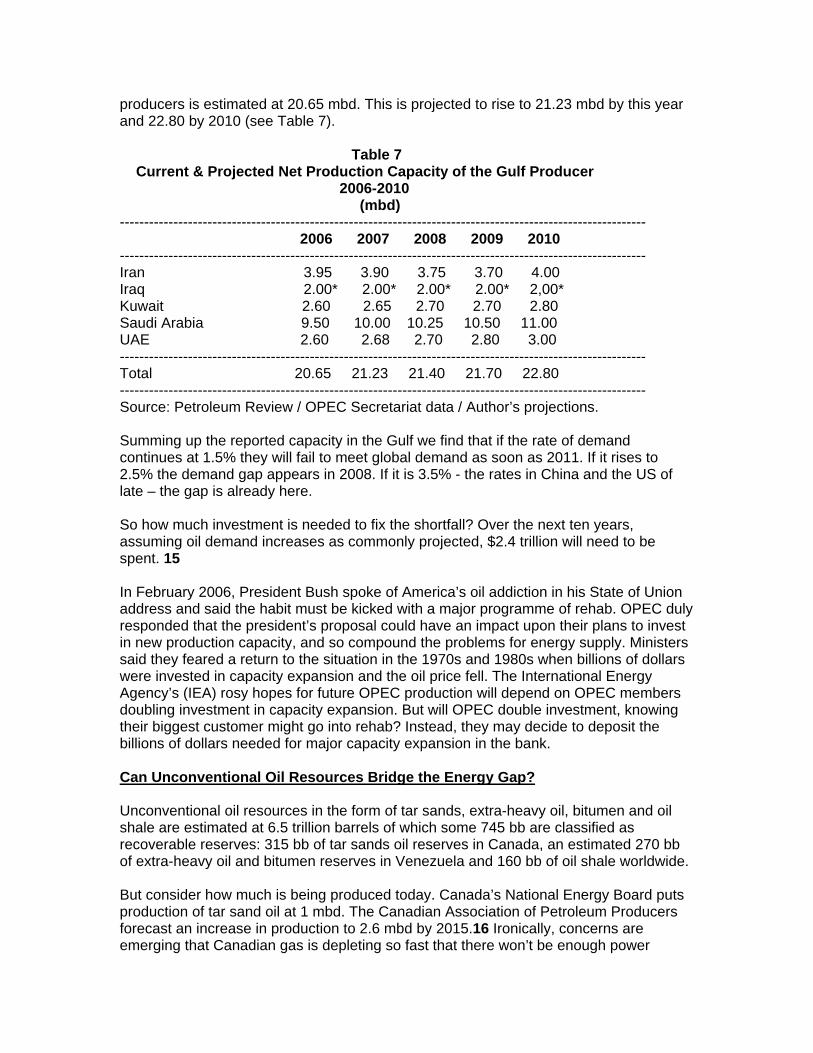
producers is estimated at 20.65 mbd. This is projected to rise to 21.23 mbd by this year and 22.80 by 2010 (see Table 7). Table 7 Current & Projected Net Production Capacity of the Gulf Producer 2006-2010 (mbd) ------------------------------------------------------------------------------------------------------------ 2006 2007 2008 2009 2010 ------------------------------------------------------------------------------------------------------------ Iran 3.95 3.90 3.75 3.70 4.00 Iraq 2.00* 2.00* 2.00* 2.00* 2,00* Kuwait 2.60 2.65 2.70 2.70 2.80 Saudi Arabia 9.50 10.00 10.25 10.50 11.00 UAE 2.60 2.68 2.70 2.80 3.00 ------------------------------------------------------------------------------------------------------------ Total 20.65 21.23 21.40 21.70 22.80 ------------------------------------------------------------------------------------------------------------ Source: Petroleum Review / OPEC Secretariat data / Author’s projections. Summing up the reported capacity in the Gulf we find that if the rate of demand continues at 1.5% they will fail to meet global demand as soon as 2011. If it rises to 2.5% the demand gap appears in 2008. If it is 3.5% - the rates in China and the US of late – the gap is already here. So how much investment is needed to fix the shortfall? Over the next ten years, assuming oil demand increases as commonly projected, $2.4 trillion will need to be spent. 15 In February 2006, President Bush spoke of America’s oil addiction in his State of Union address and said the habit must be kicked with a major programme of rehab. OPEC duly responded that the president’s proposal could have an impact upon their plans to invest in new production capacity, and so compound the problems for energy supply. Ministers said they feared a return to the situation in the 1970s and 1980s when billions of dollars were invested in capacity expansion and the oil price fell. The International Energy Agency’s (IEA) rosy hopes for future OPEC production will depend on OPEC members doubling investment in capacity expansion. But will OPEC double investment, knowing their biggest customer might go into rehab? Instead, they may decide to deposit the billions of dollars needed for major capacity expansion in the bank. Can Unconventional Oil Resources Bridge the Energy Gap? Unconventional oil resources in the form of tar sands, extra-heavy oil, bitumen and oil shale are estimated at 6.5 trillion barrels of which some 745 bb are classified as recoverable reserves: 315 bb of tar sands oil reserves in Canada, an estimated 270 bb of extra-heavy oil and bitumen reserves in Venezuela and 160 bb of oil shale worldwide. But consider how much is being produced today. Canada’s National Energy Board puts production of tar sand oil at 1 mbd. The Canadian Association of Petroleum Producers forecast an increase in production to 2.6 mbd by 2015.16 Ironically, concerns are emerging that Canadian gas is depleting so fast that there won’t be enough power

available to heat water for the oil sands expansion operations anyway. If production reaches 2.2 mbd, the draw on gas could be as much as 2.5 billion cubic feet (bcf) per day, or 15% of Canada’s current gas production of 16.8 bcf/day. This would place significant demands on dwindling supplies. The only way the 300-plus bb of tar sand oil could be extracted is to build nuclear power plants dedicated to the job. By 2010, unconventional oil is projected to contribute only 2.80 mbd rising to 6.00 mbd in 2030. Unconventional oil will be hard pressed to meet 3% and 5% of the global demand for conventional oil in 2010 and 2030 respectively (see Table 8). Table 8 Contribution of Unconventional Oil to Global Oil Demand, 2006-2030 (mbd) --------------------------------------------------------------------------------------------------------- 2006 2010 2020 2030
World demand 85.76 93.30 111.00 117.40 World supply 81.66 82.60 81.58 82.90 Synfuels 1.72 2.80 4.20 6.00 Biofuels 0.53 0.60 0.70 1.00 Tar sand oil 1.00 1.60 2.50 3.50 Extra-heavy oil 0.19 0.60 1.00 1.50 As % of global Demand 2 3 4 5 Sources: US Department of Energy’s International Energy Outlook, 2006 / BP Statistical Review of World Energy, June 2007 / IEA’s World Energy Outlook 2006 / European Biodiesel Board (EBB) /Alcohol Fuel: Information from Answers.com./ Author’s projections. As for renewable energy sources, they contributed only 1% to the global primary energy demand in 2005. Their contribution may not exceed 6% in 2025, possibly rising to 13% by 2050 (see Table 9). Table 9 Primary Energy Consumption, 2006-2050 (mtoe)
2006 2025 2050 Primary Energy 10879 16194 19679 Oil 3890 5135 5288 Natural gas 2575 5119 6927 Coal 3090 3526 2748 Nuclear 636 1061 1937 Hydro 616 314 299 Renewables 72 1039 2480 As a % of total 1% 6% 13% Sources: Shell International, Scenarios to 2050 / BP Statistical Review of World Energy, June 2007/IEA, World Energy Outlook 2006.

The Impact & Trends in the Global Economy To date, high oil prices have not really put stress on the global economy for at least three reasons. High prices reflect mostly the strength of global demand, specifically in the US, China and India. The developed world uses about half as much oil per unit of gross domestic product (GDP) as it did in the 1970s. And recycling of oil wealth by producers is alive and well with imports by oil-exporting countries up by 32% in 2004 and by a further 22% in 2005. Every $10/b rise in the oil price knocks off half a percentage point from the global economy. A sustained price of $70-$75/b would cause global GDP to fall by 2.5%-3%. However, one dramatic but largely overlooked change in the global balance of economic power is the shift of wealth toward countries that supply energy and raw materials. Since 2002, the major global oil exporters have seen their oil revenues more than double and surpluses quadruple while the external accounts of the major oil-importing countries have deteriorated, intensifying global economic imbalances and dampening growth. The overall transfers from oil consumers to oil producers in 2007 are projected to reach $1.3 trillion, or 3% of world GDP. 17 This would amount to a recycling problem of increasing complexity, from both an economic and a political point of view. However, the specific global and national impacts will depend on whether the oil windfall is recycled into the global economy. But the petro-dollar boom has more worrisome implications too. With the continued weakening of the dollar since 2002, many oil-producing countries are starting to diversify their petrodollars into new assets away from the dollar. My research shows that if the OPEC producers priced their oil in a basket of three equally-weighted currencies made up of the US dollar, the yen and the euro instead of the dollar, they would have earned an extra $52 bn in 2005. 18 This could have a very serious impact on the value of the US dollar as a petro-currency and also as a global reserve currency. It would reduce the demand for the dollar and cause it to weaken further while the US would find it very hard to finance its mushrooming twin deficits – its trade and budget deficits. In 2006, the US budget deficit reached about $800 bn, bringing the cumulative total since 1996 to a $4.4 trillion. 19 The dollar’s reserve currency status has allowed it to run up debts no other country in history could have got away with. The major beneficiaries of such investment diversification would be the euro and the yen. The United States has seen a steadily weakening dollar as an answer to its ever-widening current account deficit. After all, the dollar has depreciated about 25% against a basket of currencies since 2002 without a peep from Washington. The United States has been pushing relentlessly for China and other Asian countries to revalue their currencies, thereby trying to make the dollar relatively weaker. Indeed, the US has been relying entirely on a depreciating dollar to increase exports and restrain imports. It has not encouraged domestic savings in order to reduce the need for massive inflows of foreign funds. It would be one thing if this lopsided policy was working, but the current account has continued to increase from its record-breaking $850 bn last year. In addition, the dollar cannot sink far enough to restrain imports without creating a panic. For example, while a softer dollar has benefited exporters, almost no conceivable dollar depreciation would be enough to significantly narrow the trade gap, simply because the value of the imports is twice that of exports. 20

Because the United States needs to borrow more than $2 bn each day from abroad to finance its imports and service its $3 trillion foreign debt, a dollar that plummets too fast would necessitate a rise in US interest rates to attract foreign funds. Thus the United States would end up with inflation, high interest rates and recession. Finally, a weakening dollar could lead to more acquisitions by the cash-rich countries – China and the Gulf states – that arouse political backlash in America. That could ignite more protectionist pressures and send Wall Street reeling and could also precipitate a global currency crisis. 21 An Asian Oil Demand Shock? While we recognize the risks associated with a supply shock in the oil patch, we believe investors should be just as concerned about the demand shock evolving from Asia. At the moment, Asia’s energy resources are grossly inadequate (see Table 10). The growing deficit between Asian supply and demand alone could keep energy prices high in the years ahead. Table 10 Current & Projected Crude Oil Demand, Supply, Imports & Reserves in the Asia-Pacific Region (2006-2010) (mbd) --------------------------------------------------------------------------------------------------------------------- % of change 2005 2006 2007 2008 2009 2010 2005-2010 --------------------------------------------------------------------------------------------------------------------- Production 7.93 7.94 7.52 7.30 7.08 6.84 - 14 Consumption 24.29 25.16 26.42 27.74 29.12 31.00 + 28 Net Imports 16.36 17.22 18.90 20.44 22.04 24.16 + 48 Reserves (bb) 40.20 37.30 34.56 31.90 29.32 26.82 - 33 --------------------------------------------------------------------------------------------------------------------- Sources: BP Statistical Review of World Energy, June 2007 / Author’s projections. The bottom line is that neither of Asia’s fastest-growing economies has enough energy to feed its rapid industrialization and urbanization. It is against this background that the concept of peak oil becomes more worrisome. High oil prices might not simply be a cyclical phenomenon brought about by peak demand in this five-year-old global economic recovery. Instead, high oil prices might be an early indication of a supply-demand imbalance that can’t be reconciled by still higher prices. In this case, a more comprehensive oil shock surely awaits. The Interplay Between Oil Peak & Geopolitics As the world’s number one consumer, the United States will have much to say about how the crisis - whether of early depletion or inadequate infrastructure and investment, or both – plays out. The geopolitics of American oil dependency sees four key trends in US energy behaviour: more imports, increasingly unstable and unfriendly suppliers, escalating risk of anti-American violence and rising competition for diminishing supplies. Despite efforts to diversify the US energy mix, the United States is still heavily dependent on oil imports and this dependency can only deepen in the future.
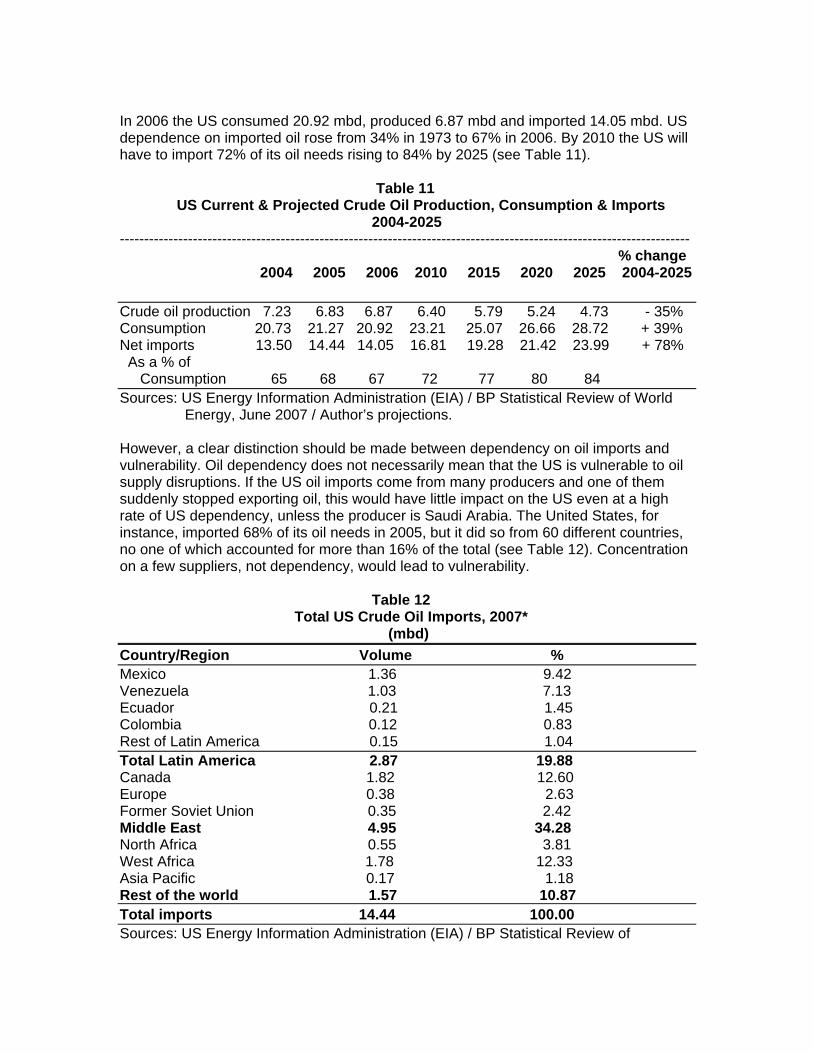
In 2006 the US consumed 20.92 mbd, produced 6.87 mbd and imported 14.05 mbd. US dependence on imported oil rose from 34% in 1973 to 67% in 2006. By 2010 the US will have to import 72% of its oil needs rising to 84% by 2025 (see Table 11). Table 11 US Current & Projected Crude Oil Production, Consumption & Imports 2004-2025 --------------------------------------------------------------------------------------------------------------------- % change 2004 2005 2006 2010 2015 2020 2025 2004-2025
Crude oil production 7.23 6.83 6.87 6.40 5.79 5.24 4.73 - 35% Consumption 20.73 21.27 20.92 23.21 25.07 26.66 28.72 + 39% Net imports 13.50 14.44 14.05 16.81 19.28 21.42 23.99 + 78% As a % of Consumption 65 68 67 72 77 80 84 Sources: US Energy Information Administration (EIA) / BP Statistical Review of World Energy, June 2007 / Author’s projections. However, a clear distinction should be made between dependency on oil imports and vulnerability. Oil dependency does not necessarily mean that the US is vulnerable to oil supply disruptions. If the US oil imports come from many producers and one of them suddenly stopped exporting oil, this would have little impact on the US even at a high rate of US dependency, unless the producer is Saudi Arabia. The United States, for instance, imported 68% of its oil needs in 2005, but it did so from 60 different countries, no one of which accounted for more than 16% of the total (see Table 12). Concentration on a few suppliers, not dependency, would lead to vulnerability. Table 12 Total US Crude Oil Imports, 2007* (mbd) Country/Region Volume % Mexico 1.36 9.42 Venezuela 1.03 7.13 Ecuador 0.21 1.45 Colombia 0.12 0.83 Rest of Latin America 0.15 1.04 Total Latin America 2.87 19.88 Canada 1.82 12.60 Europe 0.38 2.63 Former Soviet Union 0.35 2.42 Middle East 4.95 34.28 North Africa 0.55 3.81 West Africa 1.78 12.33 Asia Pacific 0.17 1.18 Rest of the world 1.57 10.87 Total imports 14.44 100.00 Sources: US Energy Information Administration (EIA) / BP Statistical Review of

World Energy, June 2007. * First quarter 2007 figures. Increasingly unfriendly suppliers and escalating anti-American violence are linked. The point here is that with growing dependence on oil imports, the US finds itself having to deal with governments and dictatorships in unstable countries. Beyond the five Gulf producers, the US strategy of supplier diversification will look to eight main sources outside the Gulf region: Mexico, Venezuela, Colombia, Russia, Azerbaijan, Kazakhstan, Nigeria and Angola. These countries and their oil operations are characterized by one or more of the following attributes: corruption, organized crime, political turmoil and ruthless dictators. The US is being forced into deeper relationships with such regimes. The bottom line is that any eruption of ethnic or political violence in these areas could do more than entrap American forces there. It could lead to a deadly confrontation between the world’s military powers. Because obviously in a world as enduringly addicted to oil as ours is, others are going to be looking for their own supplies. China will be among them. Over the coming years we will see China more involved in Middle East politics. And they will want to have access to oil by cutting deals with corrupt dictatorships in the region, and perhaps providing components of weapons of mass destruction, ballistic missiles and nuclear technology, and that could definitely put them on a collision course with the United States. Oil dependency could yet prove to be the route to a third World War. Most US presidents since the Second World War have ordered military action of some sort in the Middle East. American leaders may prefer to dress their military entanglements east of Suez in the rhetoric of democracy building, but the long-running strategic theme is obvious. It was stated most clearly, paradoxically, by the most liberal of them. In 1980 Jimmy Carter declared access to the Persian Gulf a vital national interest to be protected “by any means necessary, including military force”. The US has been doing this ever since, clocking up a bill measured in thousands of billions of dollars, and counting. Geopolitical pressures have also tightened on the world oil and gas markets over the last 12 months, never mind how big the reserves are. Iran has threatened to switch oil and gas exports to China if Europe and America push them hard on their nuclear ambitions. Venezuela has threatened the same, for different reasons. Russia has threatened to turn off the gas supply to Ukraine if the Ukrainians didn’t pay higher prices, so threatening Europe’s supply. Russia supplies around a quarter of EU’s gas. And more recently, Russia stopped oil exports to Belarus and European customers farther down the line, in a row over tariffs and energy prices. Furthermore, a creeping re-nationalization of the oil and gas assets in Latin America is under way. Can the World Be Weaned Off Oil? I have so far endeavoured to prove the case for two big arguments. First, there is plenty of oil and gas left but not enough to feed growing global energy demand for much longer. Second, the peak in conventional oil production has already been reached in 2006 and when the market realizes this, severe economic traumas will ensue.

The truth of the matter is that the shortfall between current expectation of oil supply and actual availability will be such that neither gas, nor renewables, nor liquids from gas and coal, nor nuclear, nor any combination thereof, will be able to plug the gap in time to head off the economic trauma resulting from the peak. But doing nothing is not an option. It will only lead to conflicts and devastating wars in the future. This begs the question as to whether the world could eventually be weaned off oil. The answer to that is that it can only be done if we endeavour to change our way of life, easy said than done. But the dire alternative will eventually force us to change the way we live and seek alternative energy sources. Meanwhile, there are short-term and long-term measures that governments can urgently take to reduce our addiction to oil and ward off the adverse impact of an energy crisis. Energy efficiency could be a first step. Automakers, for instance, could profitably increase fuel mileage to 66 mpg for light trucks and 92 mpg for cars at little additional cost. There are already technologies which can help the world reduce its reliance on conventional oil in transport. Put these technologies together and you get the car of the future, a plug-in hybrid with a flexible-fuel tank. The current crop of hybrid cars get around 50 mpg. Make it a plug-in and you may get 75 miles. Replace the conventional fuel tank with a flexible-fuel tank that can run on a combination of 15% petroleum and 85% ethanol or methanol, and you could get between 400 and 500 miles per gallon of gasoline. (You don’t get 500 miles per gallon of fuel but the crucial task is to lessen the use of petroleum). And ethanol and methanol are much cheaper than gasoline, so fuel costs would drop dramatically. Conclusions Global conventional oil production peaked in 2006. The current price fluctuations for crude oil are a manifestation of the peak. A peak in oil production would manifest itself by rapidly escalating prices, a slowdown in production, a growing supply deficit, declining discovery rate of new oil and also a declining Energy Return on Investment ratio. All these characteristics exist today. Peak oil is not only a reality but is already impacting on oil prices, the world economy and the global energy security. The almost quadrupling of oil prices since 2002 is not an anomaly but a picture of the future. With the peaking of global conventional oil production, geopolitics and market economics will result in even more significant price increases and security risks. Oil wars are certainly not out of the question. The governments of the major oil-consuming countries as well as the multi-national oil companies and some international organizations are in a state of denial about the implications of peak oil. Moreover, the days of inexpensive, convenient and abundant energy sources are quickly drawing to a close. While it is impossible to wean the world off oil without a radical change in our life style, there are already technologies which can help reduce our addiction to oil. Major investments should therefore be channelled towards enhancing energy efficiency globally and the further development of a plug-in hybrid car with a flexible-fuel tank as an interim measure and ultimately hydrogen motor technology. ------------------------------------------------------------------------------------------------------------

* Dr Mamdouh G. Salameh is an international oil economist, a consultant to the World Bank in Washington DC and a technical expert of the United Nations Industrial Development Organization (UNIDO) in Vienna. Dr Salameh is Director of the Oil Market Consultancy Service in the UK and a member of both the International Institute for Strategic Studies (IISS) in London and the Royal Institute of International Affairs. He is also a member of the Energy Institute in London.
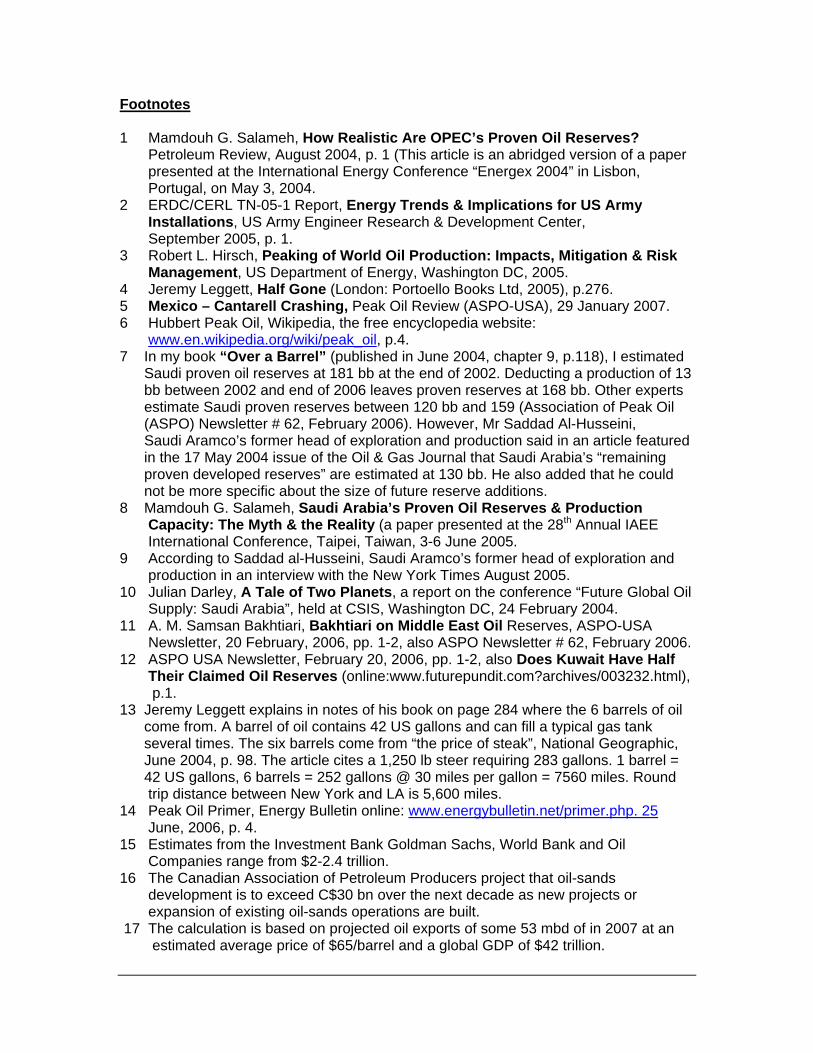
Footnotes 1 Mamdouh G. Salameh, How Realistic Are OPEC’s Proven Oil Reserves? Petroleum Review, August 2004, p. 1 (This article is an abridged version of a paper presented at the International Energy Conference “Energex 2004” in Lisbon, Portugal, on May 3, 2004. 2 ERDC/CERL TN-05-1 Report, Energy Trends & Implications for US Army Installations, US Army Engineer Research & Development Center, September 2005, p. 1. 3 Robert L. Hirsch, Peaking of World Oil Production: Impacts, Mitigation & Risk Management, US Department of Energy, Washington DC, 2005. 4 Jeremy Leggett, Half Gone (London: Portoello Books Ltd, 2005), p.276. 5 Mexico – Cantarell Crashing, Peak Oil Review (ASPO-USA), 29 January 2007. 6 Hubbert Peak Oil, Wikipedia, the free encyclopedia website: www.en.wikipedia.org/wiki/peak_oil, p.4. 7 In my book “Over a Barrel” (published in June 2004, chapter 9, p.118), I estimated Saudi proven oil reserves at 181 bb at the end of 2002. Deducting a production of 13 bb between 2002 and end of 2006 leaves proven reserves at 168 bb. Other experts estimate Saudi proven reserves between 120 bb and 159 (Association of Peak Oil (ASPO) Newsletter # 62, February 2006). However, Mr Saddad Al-Husseini, Saudi Aramco’s former head of exploration and production said in an article featured in the 17 May 2004 issue of the Oil & Gas Journal that Saudi Arabia’s “remaining proven developed reserves” are estimated at 130 bb. He also added that he could not be more specific about the size of future reserve additions. 8 Mamdouh G. Salameh, Saudi Arabia’s Proven Oil Reserves & Production Capacity: The Myth & the Reality (a paper presented at the 28th Annual IAEE International Conference, Taipei, Taiwan, 3-6 June 2005. 9 According to Saddad al-Husseini, Saudi Aramco’s former head of exploration and production in an interview with the New York Times August 2005. 10 Julian Darley, A Tale of Two Planets, a report on the conference “Future Global Oil Supply: Saudi Arabia”, held at CSIS, Washington DC, 24 February 2004. 11 A. M. Samsan Bakhtiari, Bakhtiari on Middle East Oil Reserves, ASPO-USA Newsletter, 20 February, 2006, pp. 1-2, also ASPO Newsletter # 62, February 2006. 12 ASPO USA Newsletter, February 20, 2006, pp. 1-2, also Does Kuwait Have Half Their Claimed Oil Reserves (online:www.futurepundit.com?archives/003232.html), p.1. 13 Jeremy Leggett explains in notes of his book on page 284 where the 6 barrels of oil come from. A barrel of oil contains 42 US gallons and can fill a typical gas tank several times. The six barrels come from “the price of steak”, National Geographic, June 2004, p. 98. The article cites a 1,250 lb steer requiring 283 gallons. 1 barrel = 42 US gallons, 6 barrels = 252 gallons @ 30 miles per gallon = 7560 miles. Round trip distance between New York and LA is 5,600 miles. 14 Peak Oil Primer, Energy Bulletin online: www.energybulletin.net/primer.php. 25 June, 2006, p. 4. 15 Estimates from the Investment Bank Goldman Sachs, World Bank and Oil Companies range from $2-2.4 trillion. 16 The Canadian Association of Petroleum Producers project that oil-sands development is to exceed C$30 bn over the next decade as new projects or expansion of existing oil-sands operations are built. 17 The calculation is based on projected oil exports of some 53 mbd of in 2007 at an estimated average price of $65/barrel and a global GDP of $42 trillion.

18 Mamdouh G. Salameh, Should OPEC Price Its Oil in a Basket of Currencies Rather Than in US Dollar, the IAEE Newsletter, third Quarter 2006, p.24. 19 Robert J. Samuelson, Why the Buck Is on the Edge, Newsweek, December 11, 2006, p. 45. 20 Jeffrey E. Garten, Beware the Weak Dollar, Newsweek September 10, 2007, p. 34. 21 Ibid., p. 34.

