peak oil values & policy for 21c towards 2020 climate change conference sunshine coast,...
TRANSCRIPT

Peak OilPeak OilValues & Policy for 21CValues & Policy for 21C
Towards 2020Towards 2020Climate Change ConferenceClimate Change Conference
Sunshine Coast, QueenslandSunshine Coast, Queensland
8-9th June 20078-9th June 2007 Ian T. DunlopIan T. Dunlop
Deputy ConvenorDeputy Convenor

The Peak Oil OpportunityThe Peak Oil Opportunity • Peaking of Oil Supply
– oil is not running out– but soon it will not be physically possible to expand oil
supply to meet increasing demand
• Climate Change and Peak Oil are inextricably linked – and converging
• Solutions to Peak Oil must reinforce, and not conflict with, solutions to Climate Change
• Convergence will profoundly alter our way of life, our institutions & our prosperity – for the better, as our current lifestyle is not sustainable
Global DriversGlobal Drivers
• Population Growth
• Poverty & Inequality
• Liberalisation
• Globalisation
• Technological Change
• Sustainability

World Population
0
2
4
6
8
10
12
-2000 -1000 0 1000 2000 3000
Year
Pop
ula
tion
- b
illi
on
Today
Source: J.E.Cohen, Columbia University, New York, 2005
Where to ?
BC AD

World Population = 6.5 billion
Poverty & Inequality
World Population
15%
42%
26%
17%
High Income
Developing
Developing: A$2-4 per day
Developing: less than A$2 perday
Enjoy 80% of World GDP
Source: World Bank Global Database 2004

World Ecological Footprint
Source: Global Footprint Network

World Energy Consumption
0
2
4
6
8
10
12
1965 1970 1975 1980 1985 1990 1995 2000 2005
Year
bil
lio
n t
oe Coal
Hydro Nuclear GasOil
Source: BP Statistical Review of World Energy 2006
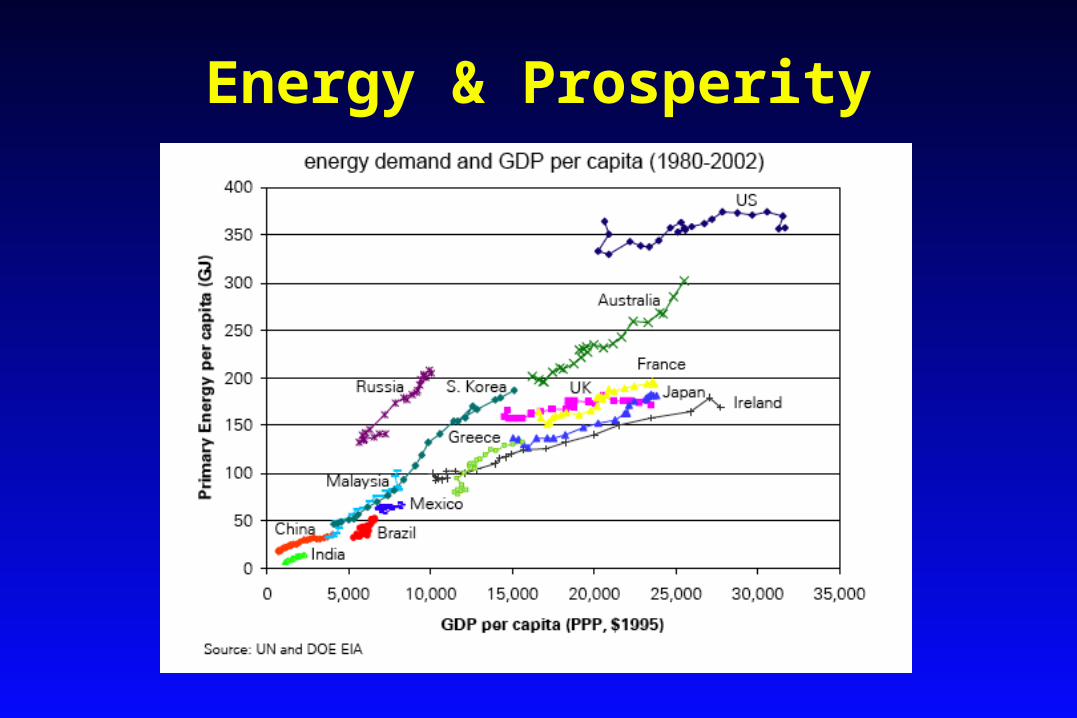
Energy & Prosperity

Energy Demand Growth“Official Forecast” 1971 -
2030

Global Fossil Fuel Resources

World Oil Production
0
10
20
30
40
50
60
70
80
90
1965 1970 1975 1980 1985 1990 1995 2000 2005
years
mil
lio
n b
/d
Asia Pacific
Africa
Middle East
Europe & Eurasia
S. & Cent. America
North America
Source: BP Statistical Review of World Energy 2006

Peak Oil matters Oil dominates its markets
• 80-95% of all transport is fuelled by oil products• 50-75% of all oil is used for transportation• All petrochemicals are produced from oil• 99% of all lubrication is done with oil products• 95% of all goods in the shops get there using oil• 99% of our food involves oil or gas for fertilisers,
agrochemicals, tilling, cultivation and transport• Oil is the most important source of primary energy
on the planet accounting for 36.4% of all energy

Crude Oil Importers
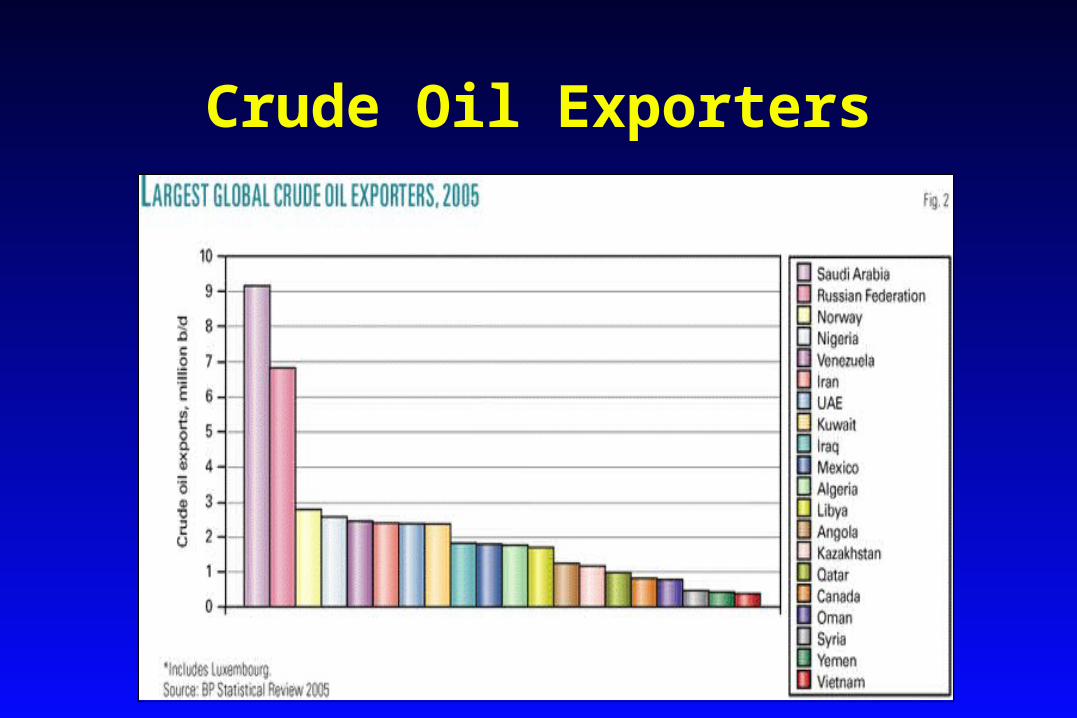
Crude Oil Exporters

The Oil Triangle of the Middle East
Qatar
Within the Oil Triangle you can find roughly 60 percent of the remaining oil reserves in the world. The 2001 Cheney report, US Energy Policy, says that in year 2020 around 54 to 67 percent of the world consumption of oil needs to come from the Oil Triangle.

Typical Oil Province Production Profile

The Growing Gap
Trends in Discoveries and ProductionTrends in Discoveries and Production
Past discovery by ExxonMobil
0
10
20
30
40
50
60
1930 1950 1970 1990 2010 2030 2050
Bil
lio
ns o
f B
arr
els
0
10
20
30
40
50
60
Past
Future
Production
“GrowingGap”
Source: Exxon Mobil 2002 - updated

Oil Availability The “Official Future” in 2005
Availability of oil resources as a function of economic price
Source: IEA (2005)

“Official Future” Today“ The energy future which we are creating is
unsustainable. If we continue as before, the energy supply to meet the needs of the world economy over the next 25 years is too vulnerable to failure arising from under-investment, environmental catastrophe or sudden supply interruption”
Claude MandilExecutive DirectorInternational
Energy AgencyWorld Energy
Outlook 2006

Global Oil Depletion - ASPO
Source: Association for the Study of Peak Oil

CRUDE OIL PRICES1861-2005
Source: BP Statistical Review of World Energy 2006
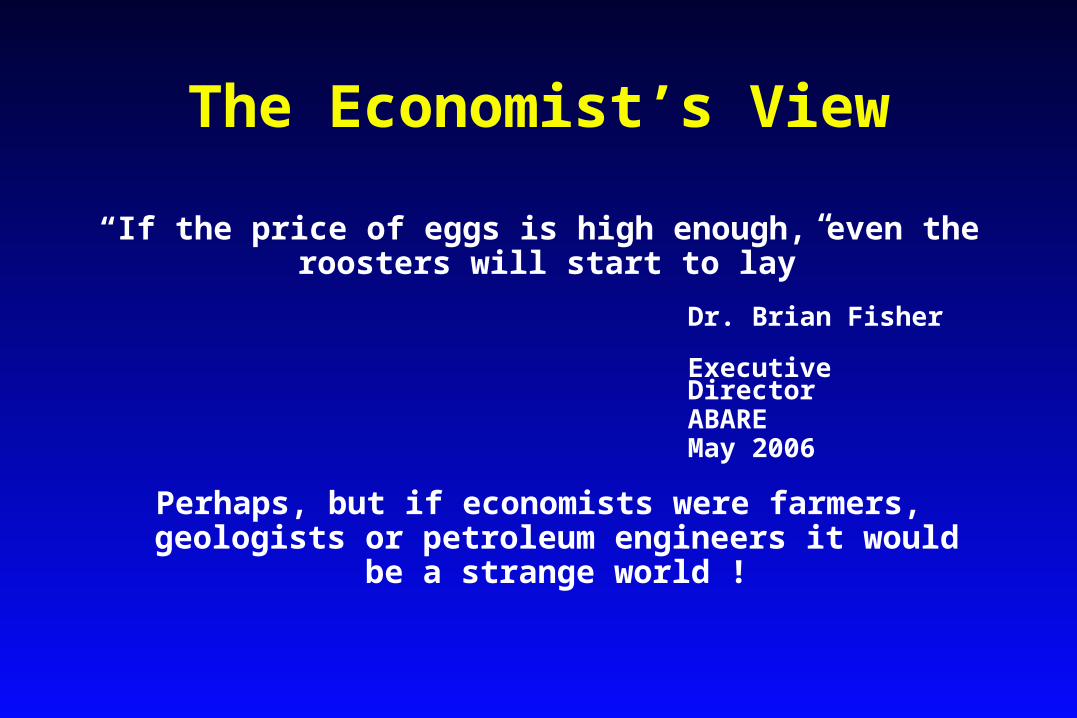
The Economist’s View
“If the price of eggs is high enough, even the roosters will start to lay”
Perhaps, but if economists were farmers, geologists or petroleum engineers it would be
a strange world !
Dr. Brian Fisher Executive DirectorABAREMay 2006

Why are oil supplies peaking?
• We are not finding oil fast enough• It is getting harder• We are not developing fields fast enough• Too many fields are old and declining• We are short of people and equipment• Oilfield inflation is soaring• Our societies are totally oil dependent• Oil supply will peak soon.
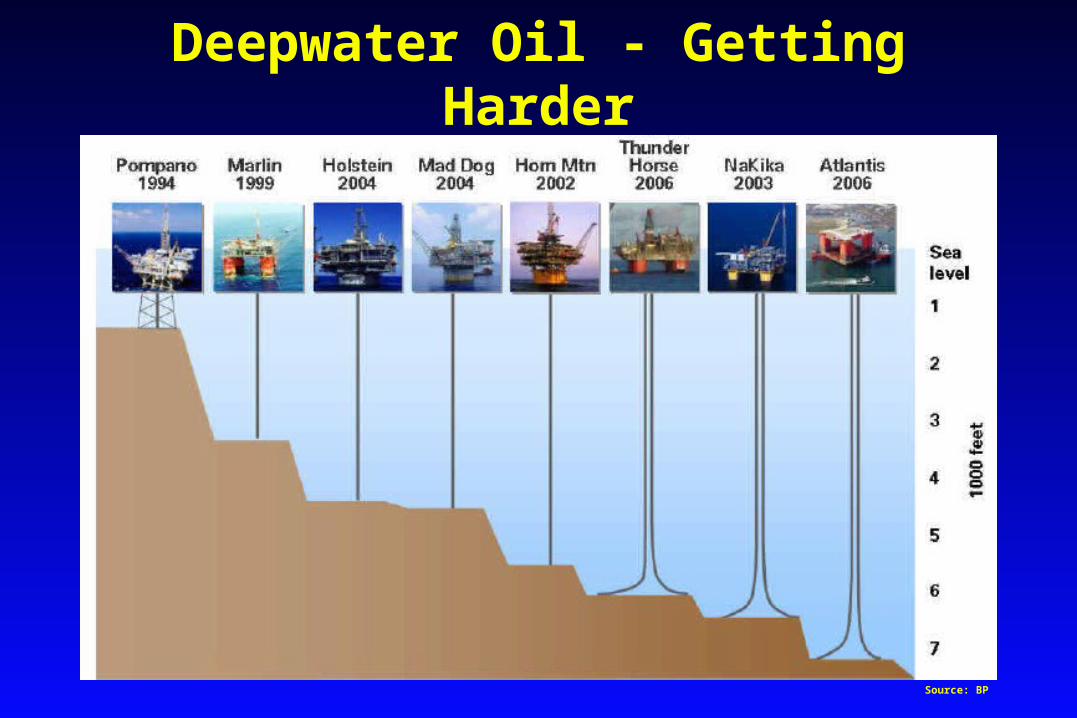
Deepwater Oil - Getting Harder
Source: BP

Deep Water Oil vs Mt. Everest
Jack 2
8,588 metre to oil reservoir
8,848 metre
2,100 metre to seabed
Sea Level
New US Gulf of Mexico oilfield

What will the Peak look like ?
• It could be sharp and nasty– geopolitical supply disruption / constraint– major oilfield depletion acceleration– producing countries consume more oil internally– climate change impact - Hurricane Katrina
• It could be an “undulating plateau”– demand destruction
• developing world cannot afford high prices• climate change emissions constraints
– extra supply accelerates• to balance depletion
• We will probably only see it in the rear-vision mirror– we may already be there

Solutions -- but hurry
• Efficiency in use• Demand management• Biofuels• Heavy oils and tarsands• Clean coal to create syngas• Gas to liquids
The solutions must not worsen climate change

0
10
20
30
40
50
1930 1950 1970 1990 2010 2030 2050
0
1 0
2 0
3 0
4 0
5 0
Global Oil SolutionsFilling the gap
Past Production of Oil
ForecastProduction
Demand Growth
Deprivation, war
City design/lifestyle
Pricing / taxes
Transport mode shifts
Efficiency
Other petroleum fuels gas, tar-sands
Other fuels
Gbbls/year
• no single “Magic Bullet” solution, but lots of “Magic Buckshot” ! • probably no replacement ever for cheap plentiful oil
• urgent preparation and adjustment are vital
2005

Australian Crude Oil & Condensate Supply & Demand
Source: APPEA
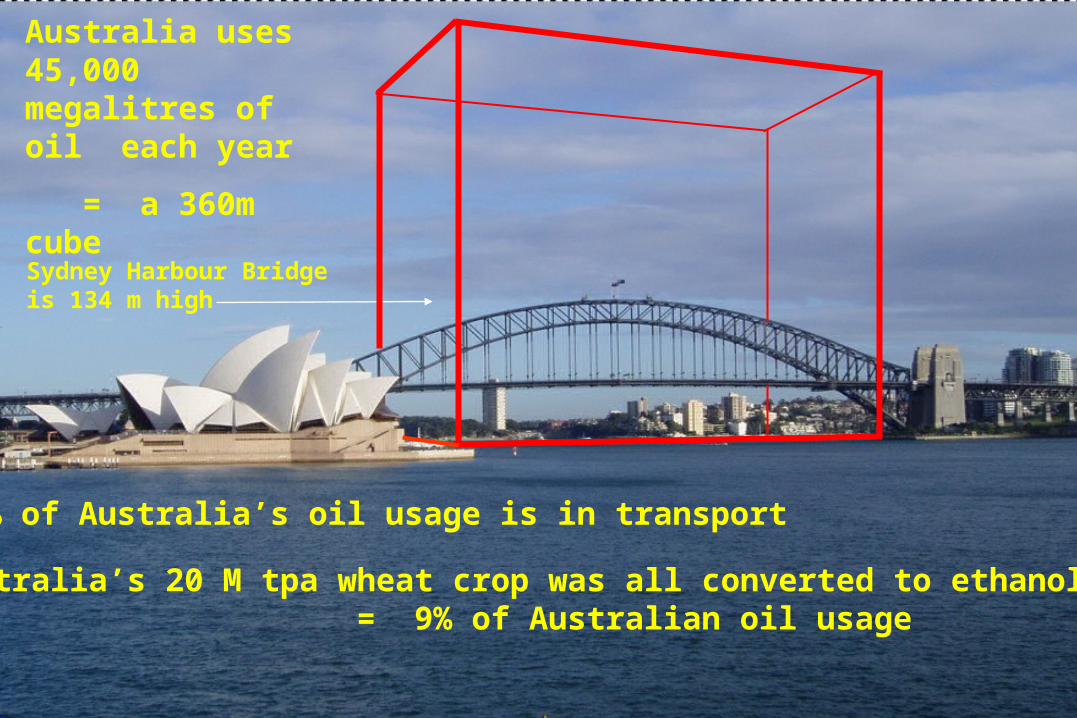
80% of Australia’s oil usage is in transport
If Australia’s 20 M tpa wheat crop was all converted to ethanol: = 9% of Australian oil usage
Australia uses 45,000 megalitres of oil each year
= a 360m cubeSydney Harbour Bridge is 134 m high

Million barrels/ day 2005 BP Statistical Review, 2006
Australia uses 0.9 China 7.0US 20.6World 82.5 US = 1 cubic km oil / year
Australia China United States
1 kml l
Oil Consumption
Comparison

0
10
20
30
40
50
60
70
Oil consumption bbl/day/1000 people
Aust Eu-15 USA China Japan0
100
200
300
400
500
600
700
800
900
Australia EU-15 USA China Japan
Registered Vehicles per 1000
Aust Eu-15 USA China Japan
Registered vehicles /1000 people
0
2,000,000
4,000,000
6,000,000
8,000,000
10,000,000
12,000,000
14,000,000
16,000,000
18,000,000
20,000,000
Australia EU-15 USA China J apan
Oil Consumption bbl/day (blue = net imports, red = production)Total Oil Consumption
Production Net imports
Aust Eu-15+ USA China Japan
20
0
10
M bbl/day
EU 15 + Norway
1 km
Australia
China
United Statesl l

Who Gets The Available Oil ?
• Market forces– the wealthy win
• The “Washington Consensus”– send in the marines !
• A global “Oil Depletion Protocol”– sharing equitably– an oil equivalent of the Kyoto Protocol
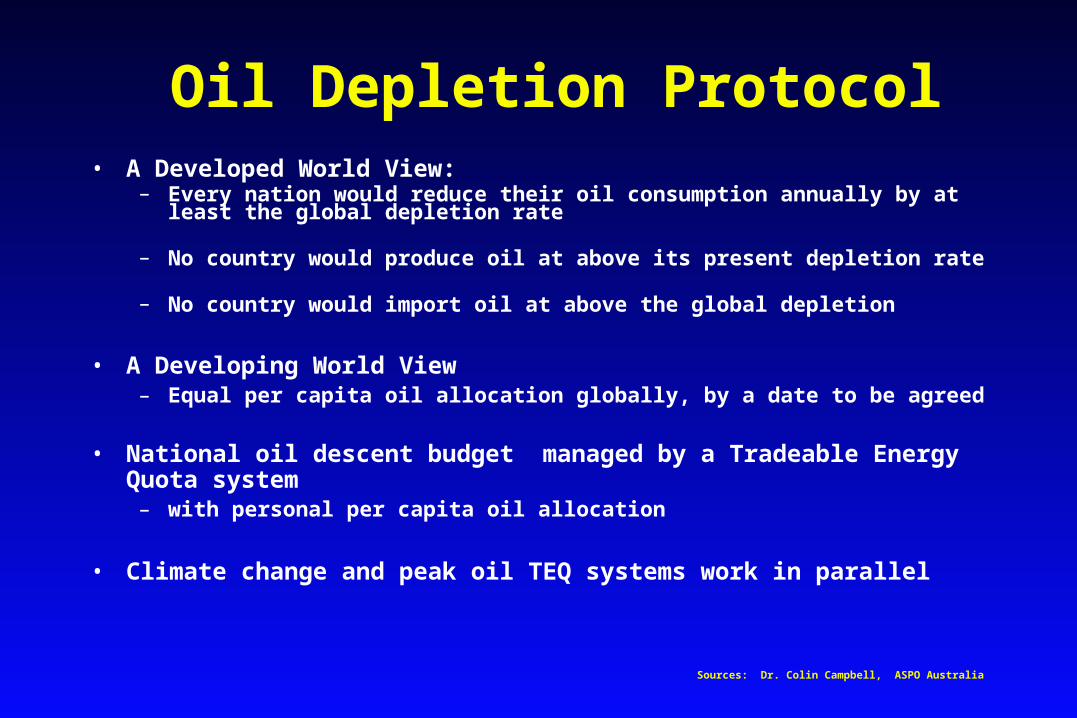
Oil Depletion Protocol• A Developed World View:
– Every nation would reduce their oil consumption annually by at least the global depletion rate
– No country would produce oil at above its present depletion rate
– No country would import oil at above the global depletion • A Developing World View
– Equal per capita oil allocation globally, by a date to be agreed
• National oil descent budget managed by a Tradeable Energy Quota system – with personal per capita oil allocation
• Climate change and peak oil TEQ systems work in parallel
Sources: Dr. Colin Campbell, ASPO Australia

Community Awareness & Commitment
• Transition to a low-carbon economy will fundamentally alter lifestyle of entire community
• Peak Oil is barely on our radar – but it may be the issue which has a greater impact than climate change
in the short-term
• Be aware and prepare!
• Requires principled, long term leadership
• Community involvement and pressure are essential drivers
• A unique opportunity to set humanity on a new course built on sustainable principles
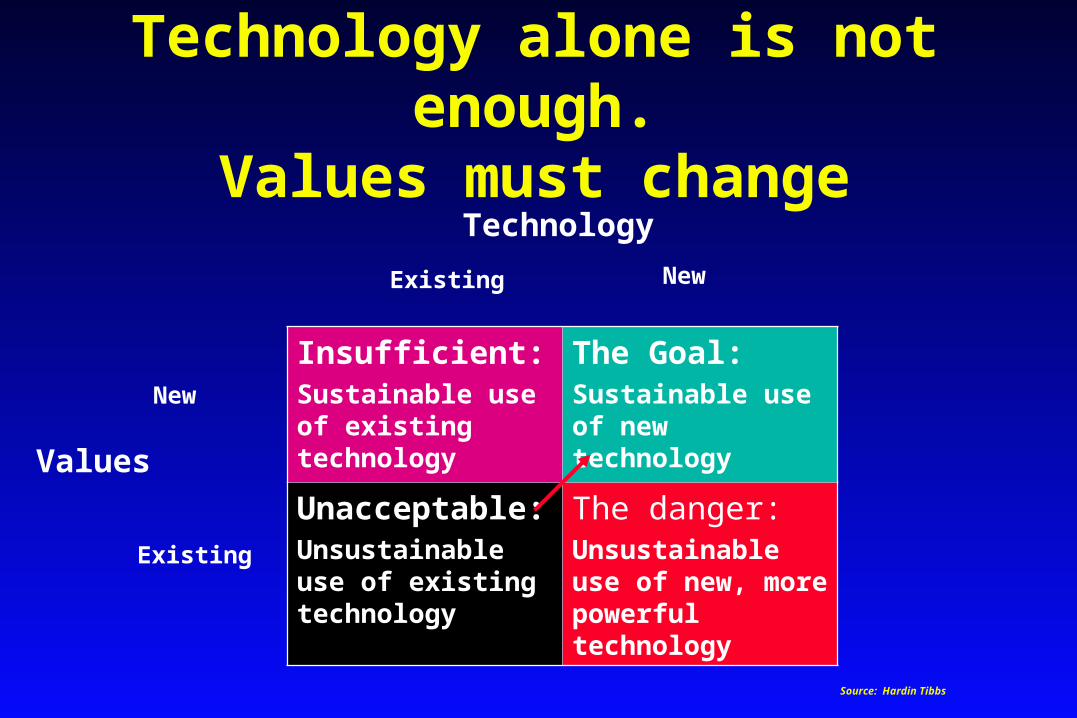
Technology alone is not enough.
Values must change
Insufficient:Sustainable use of existing technology
The Goal:Sustainable use of new technology
Unacceptable:Unsustainable use of existing technology
The danger:Unsustainable use of new, more powerful technology
New
Existing
Existing New
Values
Technology
Source: Hardin Tibbs

21st Century Value ShiftPopulation
Time
Values in 20th C•Quantity•Economy•Growth•Consumption•Materialism•Competition•Selfism•Nationalism•Short-term•Chains
Values in 21st C•Quality•Environment•Sustainability•De-materialisation•Self-restraint•Cooperation•Mutualism•Globalism•Long-term•Loops

Adaptive Change
“It is not the strongest of the species that survive, nor the most intelligent, rather it is those most responsive to change”
Charles Darwin

“Don’t blow it - good planets are hard to find!”Time
Thank you
www.aspo-australia.org.au


Background Slides

How old are the fields?
• Of the 18 largest fields, 12 are in decline, 5 have some potential and 1 is undeveloped
• The 120 largest fields give 50% of total
• 70% of production from fields 30+ years old
• Few large recent discoveries
• We’re dependent on the oil equivalent of ‘Old men and young boys’

Sustainability“ Meeting the needs of the present without
compromising the ability of future generations to meet their own needs”
Gro Harlem Brundtland, “Our Common
Future”,1987
“In a sustainable society, the rates of:• use of renewable resources do not exceed their rates of
regeneration• use of nonrenewable resources do not exceed the rate
at which sustainable renewable substitutes are developed
• pollution emissions do not exceed the assimilative capacity of the environment”
Herman Daly

Tradeable Energy Quotas
An electronic system for rationing carbon-rated energy…for all energy users…
at national level.
Also can be used to maintain a fair distribution of a scarce commodity
such as oil or water