peer-reviewed article bioresources article bioresources.com nejad et al. (2013). “coating of...
TRANSCRIPT
PEER-REVIEWED ARTICLE bioresources.com
Nejad et al. (2013). “Coating of oil-heat treated flooring,” BioResources 8(2), 1881-1892. 1881
Coating Performance on Oil-heat Treated Wood for Flooring
Mojgan Nejad,* Romina Shafaghi, Hiba Ali, and Paul Cooper
Thermal modification of wood in a hot-oil bath is a green process, which improves wood properties using natural products. The process imparts a uniform brown color to the wood and increases its dimensional stability. The improved properties create value-added opportunities for some wood species to be used for high performance applications such as flooring products. This study focused on the optimization of the oil-heat-treatment process to find different approaches for saving energy and also evaluating the performance of water-based coatings on oil-heat treated wood. Effects of process variables on development of wood drying defects such as, checking, cupping, crooking, bowing, twisting, and grain raise were evaluated. This included investigation of effects of Initial wood moisture content and delayed cooling of treated wood in an oven or under a thermal blanket. Our results showed that wood can be treated at an initial moisture content around 8 to 10 percent and cooled in a blanket instead of in an oven without increasing wood defects. Testing the performance of four commercially formulated water-based coatings on heat-treated wood showed that the coatings had an overall better color retention, abrasion, and scratch resistance on the heat-treated wood than on the untreated wood. However, the adhesion of all of the coatings was lower on the heat-treated wood when compared with untreated wood samples.
Keywords: Heat-treated wood; Flooring; Coating; Energy savings; Wood surface properties
Contact information: University of Toronto, 33 Willcocks Street, Toronto, Canada, M5S 3B3
* Corresponding author: [email protected]
INTRODUCTION
Thermal modification of wood is an environmentally friendly process that can
enhance several properties of wood such as color, dimensional stability, and decay
resistance (Esteves and Pereira 2009; Hill 2006; Wang and Cooper 2003). Thermal
treatment is usually performed by heating wood to the range 180 to 220 °C in a low
oxygen environment such as in steam, nitrogen, or hot oil (Esteves and Pereira 2009;
Wang and Cooper 2003). During the oil-heat treatment process, the oil uniformly
transfers heat throughout the wood (Sailer et al. 2000) and provides an oxygen-free
environment that reduces radical formation during treatments and minimizes strength loss
in wood (Militz 2002). Different types of oils can be used for heat treatments as long as
they are stable to a temperature of 230 °C; examples are: linseed, soybean, sunflower,
palm, rapeseed, and tall oil (Sailer et al. 2000).
Heat treatment improves the wood’s dimensional stability by decreasing the
wood’s hygroscopicity (Sailer et al. 2000; Wang and Cooper 2005). Regardless of the
wood species, the main factors that decrease the wood’s equilibrium moisture content are
reported to be the degradation of hemicelluloses, an increase in cellulose crystallinity
PEER-REVIEWED ARTICLE bioresources.com
Nejad et al. (2013). “Coating of oil-heat treated flooring,” BioResources 8(2), 1881-1892. 1882
(which reduces the number of hydroxyl (OH) groups), and the cross-linking of lignin
(Boonstra 2006; Sivonen et al. 2002; Tjeerdsma 2005). Lower equilibrium moisture
contents of treated wood in comparison with untreated wood make the heat-treated wood
an excellent product for flooring applications with lower shrinkage and swelling
(Źivković et al. 2008). The dark color of the wood after the heat treatment makes the
treated wood more aesthetically appealing and it also masks any wood defects and color
variability. The improved properties of the thermally-treated wood can provide value-
added opportunities for under-utilized wood species.
However, negative effects on other properties such as a loss in some mechanical
properties and reduced wettability (Esteves and Pereira 2009) may limit its use in some
applications. The degree of reduced strength of the wood after the treatment varies with
the property evaluated, the wood species, and the treatment conditions such as time,
temperature, and heating media (Wang and Cooper 2003). Rapp and Sailer (2012) tested
the impact bending strength and modulus of elasticity (MOE) of the heat-treated wood in
oil and air at 180 °C, 200 °C, and 220 °C, and stated that there were no significant
differences between the MOE of the control pine samples and the treated woods, and saw
minimal impact of the bending loss when the wood was treated in an oil-bath at 180 °C
compared to the untreated wood (Rapp and Sailer 2012). A recent study reported an
increase in the MOE and the hardness of Chinese fir when wood samples were steam-
treated at temperatures below 200 °C (Cao et al. 2012). Leitch (2009) also reported that
Canadian black ash wood, steam heat-treated at 200 °C, had a slightly higher hardness
than the untreated wood. This can be attributed to the lower equilibrium moisture content
of the thermally modified wood.
The wettability of wood after the heat treatment was reported to decrease due to
the plasticization of lignin (Hakkou et al. 2005) and to increase in the degree of cellulose
crystallinity (Pétrissans et al. 2003). Kocaefe et al. (2008) reported a significant decrease
in the wettability of soft maple after heat-treatment when they measured the dynamic
contact angle of water on the heat-treated and untreated wood samples.
The reduced wettability of the heat-treated wood could cause problems with the
adhesion of coatings, especially water-based coatings, to thermally modified wood. The
first objective of the study was to find a greener process that not only creates value-added
opportunities for some wood species, but also improves the process to use less energy
without having negative impacts on the performance of the final products. The second
objective was to evaluate the performance of environmentally friendly wood flooring
coatings on the surface of the heat-treated wood.
EXPERIMENTAL
Flat-grained, rough sawn boards of three underutilized wood species: 20 boards of
soft maple (Acer rubrum L.) and 6 boards of each American beech (Fagus grandifolia
Ehrh.) and eastern hemlock (Tsuga canadensis L.) measuring 2 cm x 8.5 cm x 120 cm
were used in this study. One set of the end-matched samples of beech and hemlock (2 cm
x 8.5 cm x 30 cm, 6 pieces from each species) and all of the soft maple samples (20
boards) were dried to 4 to 6% moisture content (MC). The other end-matched sets of
beech and hemlock (6 pieces) were conditioned to reach a 9 to 12% MC. The soft maple
samples were cut in half (in length); one half was left as the untreated control and the
other half was heat-treated in an oil-bath.
PEER-REVIEWED ARTICLE bioresources.com
Nejad et al. (2013). “Coating of oil-heat treated flooring,” BioResources 8(2), 1881-1892. 1883
All of the samples were submerged in a hot oil-bath containing soybean oil
with 10% wax (at around 60 °C). The system was heated to 180 °C and held at this
temperature for 3 h. The samples were removed from the bath immediately after 3 h
while the oil was still hot. The soft maple samples and one half of the beech and hemlock
(6 pieces of each species) samples were placed in an oven at 100 °C overnight in order to
be cured and gradually cooled down. The remaining beech and hemlock (6 pieces of each
species) samples were wrapped in a foil thermal blanket to evaluate an alternative cooling
process that does not require additional heat energy. After 24 h of conditioning, either in
the oven or in the blanket, all of the samples were equilibrated in the lab. After three
days the treated wood samples were planed to have smooth, oil-free surfaces for
evaluation purposes.
The beech and hemlock wood samples (2 cm x 8.5 cm x 30 cm) were visually
ranked for: checking, cupping, crooking, bowing, twisting, and grain raise (Table 1).
Rankings (1 to 10) were made by three individuals, and the average rankings were
recorded.
Three commercially formulated coatings were purchased (Table 2), and a
modified version of coating number three was prepared by adding 1% (based on solid
content of coating) of an adhesion promoter (a carboxyl/hydroxyl functional organo-
metal zirconium/aluminum complex). Liquid coatings were characterized in terms of
density, viscosity, and solids content. The viscosities were measured at 20 °C using a
Brookfield dial reading viscometer with spindle #1 @ 20 rpm. The solids contents were
determined based on the ASTM D2369 test method in which 2 mL of each coating was
placed on an aluminum pan and heated in an oven at 110 °C for 60 min. The specific
gravities of the coatings were measured by a hydrometer (G & W Instruments) at room
temperature.
A set of beech and soft maple samples were sanded with 100-grit sandpaper, and
they were wiped with a damp cloth to be ready for coating applications. Three replicates
of beech and 10 of soft maple were coated by the above four mentioned coatings for
coating performance evaluation. Two coats were applied to achieve a 3.5 mils (0.09 mm)
wet film thickness of each coating. The required weight of each coating to achieve this
thickness was calculated based on the measured density of the coatings and the surface
area of the samples.
The samples were sanded between coatings with 100-grit sandpaper to improve
cohesion between the two layers. After one week of air drying, three replicates of coated
beech and soft maple samples were tested for adhesion by tape tests (ASTM D3359). Ten
measurements were performed on each sample; the data reported (Table 3) are the
averages of 30 adhesion tape tests (10 times 3 replicates). Since all of the beech coated
wood samples failed to pass the adhesion test, beech was not used for further evaluations
of the coatings.
To determine the effect of house-hold chemicals on the coating performances, sets
of three replicate samples from the same board of both untreated and heat-treated coated
soft maple wood samples were tested based on ASTM D1308 standards. One milliliter of
various house-hold liquids (hot water, red wine vinegar, mustard, ketchup, coca-cola,
vegetable oil, hot coffee, acetone, ethyl alcohol, and 2.5% NaOH alkali solution) were
placed on the coated both untreated and treated wood surfaces and wiped off with a damp
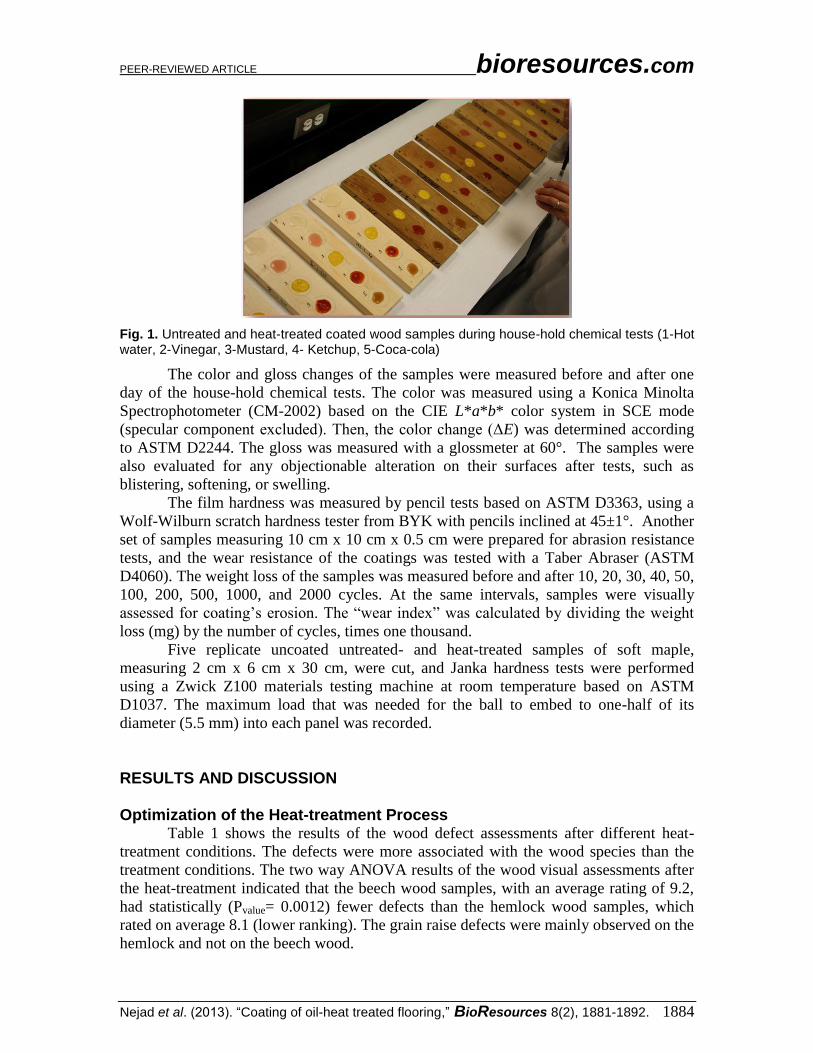
cloth after 1 h (Fig. 1).
PEER-REVIEWED ARTICLE bioresources.com
Nejad et al. (2013). “Coating of oil-heat treated flooring,” BioResources 8(2), 1881-1892. 1884
Fig. 1. Untreated and heat-treated coated wood samples during house-hold chemical tests (1-Hot water, 2-Vinegar, 3-Mustard, 4- Ketchup, 5-Coca-cola)
The color and gloss changes of the samples were measured before and after one
day of the house-hold chemical tests. The color was measured using a Konica Minolta
Spectrophotometer (CM-2002) based on the CIE L*a*b* color system in SCE mode
(specular component excluded). Then, the color change (ΔE) was determined according
to ASTM D2244. The gloss was measured with a glossmeter at 60°. The samples were
also evaluated for any objectionable alteration on their surfaces after tests, such as
blistering, softening, or swelling.
The film hardness was measured by pencil tests based on ASTM D3363, using a
Wolf-Wilburn scratch hardness tester from BYK with pencils inclined at 45±1°. Another
set of samples measuring 10 cm x 10 cm x 0.5 cm were prepared for abrasion resistance
tests, and the wear resistance of the coatings was tested with a Taber Abraser (ASTM
D4060). The weight loss of the samples was measured before and after 10, 20, 30, 40, 50,
100, 200, 500, 1000, and 2000 cycles. At the same intervals, samples were visually
assessed for coating’s erosion. The “wear index” was calculated by dividing the weight
loss (mg) by the number of cycles, times one thousand.
Five replicate uncoated untreated- and heat-treated samples of soft maple,
measuring 2 cm x 6 cm x 30 cm, were cut, and Janka hardness tests were performed
using a Zwick Z100 materials testing machine at room temperature based on ASTM
D1037. The maximum load that was needed for the ball to embed to one-half of its
diameter (5.5 mm) into each panel was recorded.
RESULTS AND DISCUSSION
Optimization of the Heat-treatment Process Table 1 shows the results of the wood defect assessments after different heat-
treatment conditions. The defects were more associated with the wood species than the
treatment conditions. The two way ANOVA results of the wood visual assessments after
the heat-treatment indicated that the beech wood samples, with an average rating of 9.2,
had statistically (Pvalue= 0.0012) fewer defects than the hemlock wood samples, which
rated on average 8.1 (lower ranking). The grain raise defects were mainly observed on the
hemlock and not on the beech wood.

PEER-REVIEWED ARTICLE bioresources.com
Nejad et al. (2013). “Coating of oil-heat treated flooring,” BioResources 8(2), 1881-1892. 1885
The main concern, initially, was to induce honey-comb defects when it was
decided to treat the wood samples at a higher moisture content; however, none of the
wood samples showed honey-comb defects. This may be because the samples were not
thick enough to create a steep moisture gradient (2 cm thick) that could induce honey
comb defects.
Table 1. Appearance Evaluation of Heat-treated Beech and Hemlock (10 is best and zero is the worst, average of three replicates; standard deviations in parentheses)
Wood species
Initial MC
Cooling Process
Evaluation results
Checking Cupping Crooking Bowing Twisting Grain raise
Beech 6(0.4) Oven 10(0) 5(5) 10(0) 10(0) 10(0) 10(0)
Beech 12(0.5) Oven 10(0) 8(3) 9(1) 10(0) 9(1) 10(0)
Beech 5(0.4) Blanket 10(0) 7(5) 9(2) 10(0) 8(3) 10(0)
Beech 11(1.1) Blanket 8(3) 7(5) 10(0) 10(0) 8(3) 10(0)
Hemlock 5(0.3) Oven 3(3) 9(1) 10(0) 10(0) 10(0) 4(0)
Hemlock 9(0.1) Oven 5(4) 9(1) 10(0) 10(0) 9(1) 7(2)
Hemlock 5(0.5) Blanket 4(5) 10(0) 10(0) 10(0) 10(0) 4(0)
Hemlock 9(0.6) Blanket 7(4) 9(1) 10(0) 10(0) 10(0) 4(0)
Samples that were treated at a lower initial moisture content (4 to 6%) had high
variability, which caused their average ranking to be slightly lower than the ranking of
the samples with initial higher MC (9 to 11%), as shown in Fig. 2. The samples that were
treated at high moisture contents and cooled in blankets had slightly higher checking
values than samples treated in other conditions. However, there was no statistically
significant difference between the average rankings of the wood defects caused by
differences in initial moisture contents or the cooling conditions. Treating samples at
higher moisture content and cooling them in blankets rather than in the oven saved a
significant amount of energy required for the treatment process. Based on these results,
we recommend treating wood at around 10% moisture content and cooling it in blankets
rather than with an oven for industrial processes.
Fig. 2. Boxplot of ANOVA results of differences between initial moisture contents effect on the checking of wood

PEER-REVIEWED ARTICLE bioresources.com
Nejad et al. (2013). “Coating of oil-heat treated flooring,” BioResources 8(2), 1881-1892. 1886
Coating Performance Evaluations Table 2 shows the range of coatings used in this study and their measured
properties. The viscosity of the coatings ranged from 100 to 400 cps, and the addition of
1% adhesion promoter to coating-3 caused its viscosity to drop from 115 cps (in coating-
3) to 100 cps in its modified version coating-4 (Table 2).
Table 2. Coating Physical Properties
ID Resin Base Density Solid content
Wt% Viscosity
cps
Coating-1 Polyurethane Water 1.04 30 411
Coating-2 Acrylic Water 1.05 35 221
Coating-3 Polyurethane Water 1.03 32 115
Coating-4* Polyurethane Water 1.03 33 100
* Modified formulation of coating-3 by adding 1% adhesion promoter
The surfaces of the heat-treated beech wood samples were more oily than those of
soft maple; even after planing off another surface layer, there was still excess oil on the
wood surface. The oily surface of the beech wood caused a significant adhesion loss of
all the coatings from the treated-wood surfaces (Table 3). Having excess oil on the
surface of beech samples might be due to the structure of beech which facilitated the
penetration of the oil throughout the wood. For this reason, beech wood samples were not
included in further studies to evaluate the coatings.
Table 3. Coating Adhesion on both Untreated and Heat-treated Woods by Tape Tests (ASTM D3359)
Wood Beech Soft Maple
Treatment Untreated Treated Untreated Treated
Coating-1 4B 0B 4B 3B
Coating-2 4B 0B 4B 3B
Coating-3 4B 0B 5B 4B
Coating-4 4B 0B 4B 4B
Note: 0B: greater than 65% loss; 3B: 5-15% adhesion loss; 4B: Less than 5% adhesion loss; 5B: None, 0% adhesion loss
The adhesion of the coatings on the heat-treated soft maple was one level lower
than on the untreated wood (Table 3), but still, in most cases, the adhesion results were
acceptable with less than a 5% adhesion loss after the cross-cut adhesion tests (4B level).
Based on the two-way ANOVA results, there were significant interaction effects between
the coatings and treatments. Among four evaluated coatings, coating-3, a low viscosity
polyurethane was the best in terms of adhesion ratings. The same coating that was
modified by adding a 1% adhesion promoter surprisingly had lower adhesion ratings than
the commercially formulated coating. This could be because the adhesion promoter was
added after formulation, and was not mixed with resin during the formulation.
PEER-REVIEWED ARTICLE bioresources.com
Nejad et al. (2013). “Coating of oil-heat treated flooring,” BioResources 8(2), 1881-1892. 1887
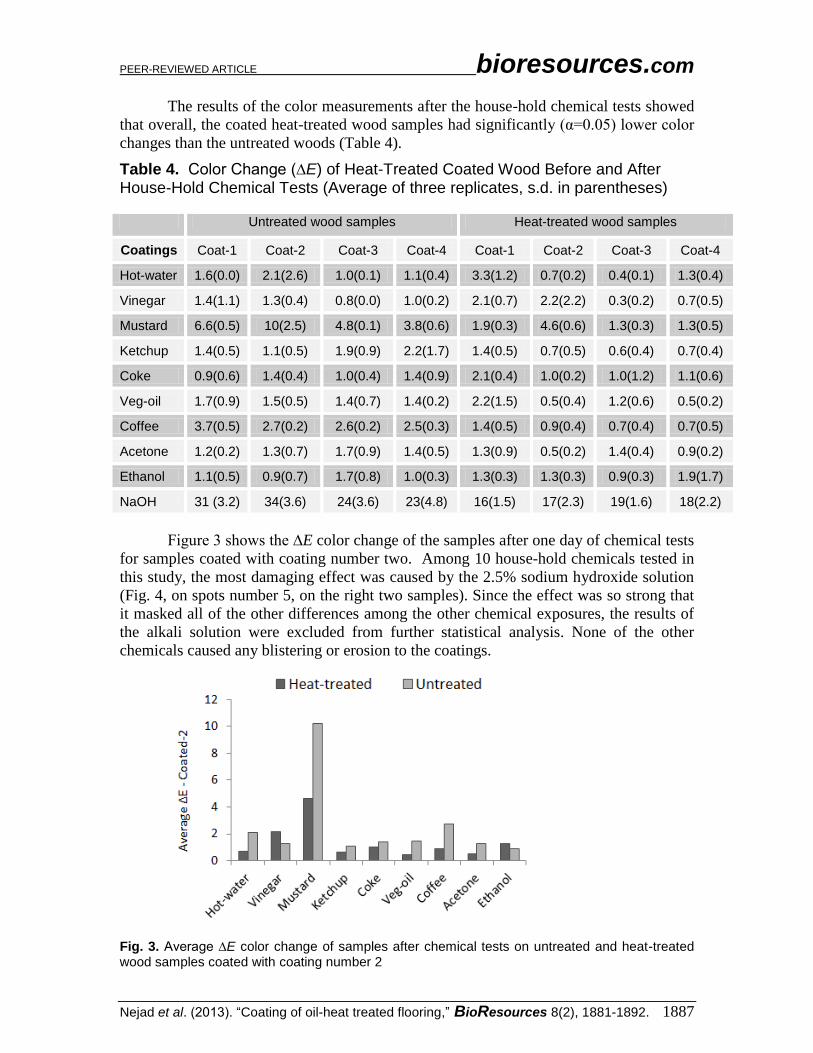
The results of the color measurements after the house-hold chemical tests showed
that overall, the coated heat-treated wood samples had significantly (α=0.05) lower color
changes than the untreated woods (Table 4).
Table 4. Color Change (∆E) of Heat-Treated Coated Wood Before and After House-Hold Chemical Tests (Average of three replicates, s.d. in parentheses)
Untreated wood samples Heat-treated wood samples
Coatings Coat-1 Coat-2 Coat-3 Coat-4 Coat-1 Coat-2 Coat-3 Coat-4
Hot-water 1.6(0.0) 2.1(2.6) 1.0(0.1) 1.1(0.4) 3.3(1.2) 0.7(0.2) 0.4(0.1) 1.3(0.4)
Vinegar 1.4(1.1) 1.3(0.4) 0.8(0.0) 1.0(0.2) 2.1(0.7) 2.2(2.2) 0.3(0.2) 0.7(0.5)
Mustard 6.6(0.5) 10(2.5) 4.8(0.1) 3.8(0.6) 1.9(0.3) 4.6(0.6) 1.3(0.3) 1.3(0.5)
Ketchup 1.4(0.5) 1.1(0.5) 1.9(0.9) 2.2(1.7) 1.4(0.5) 0.7(0.5) 0.6(0.4) 0.7(0.4)
Coke 0.9(0.6) 1.4(0.4) 1.0(0.4) 1.4(0.9) 2.1(0.4) 1.0(0.2) 1.0(1.2) 1.1(0.6)
Veg-oil 1.7(0.9) 1.5(0.5) 1.4(0.7) 1.4(0.2) 2.2(1.5) 0.5(0.4) 1.2(0.6) 0.5(0.2)
Coffee 3.7(0.5) 2.7(0.2) 2.6(0.2) 2.5(0.3) 1.4(0.5) 0.9(0.4) 0.7(0.4) 0.7(0.5)
Acetone 1.2(0.2) 1.3(0.7) 1.7(0.9) 1.4(0.5) 1.3(0.9) 0.5(0.2) 1.4(0.4) 0.9(0.2)
Ethanol 1.1(0.5) 0.9(0.7) 1.7(0.8) 1.0(0.3) 1.3(0.3) 1.3(0.3) 0.9(0.3) 1.9(1.7)
NaOH 31 (3.2) 34(3.6) 24(3.6) 23(4.8) 16(1.5) 17(2.3) 19(1.6) 18(2.2)
Figure 3 shows the ∆E color change of the samples after one day of chemical tests
for samples coated with coating number two. Among 10 house-hold chemicals tested in
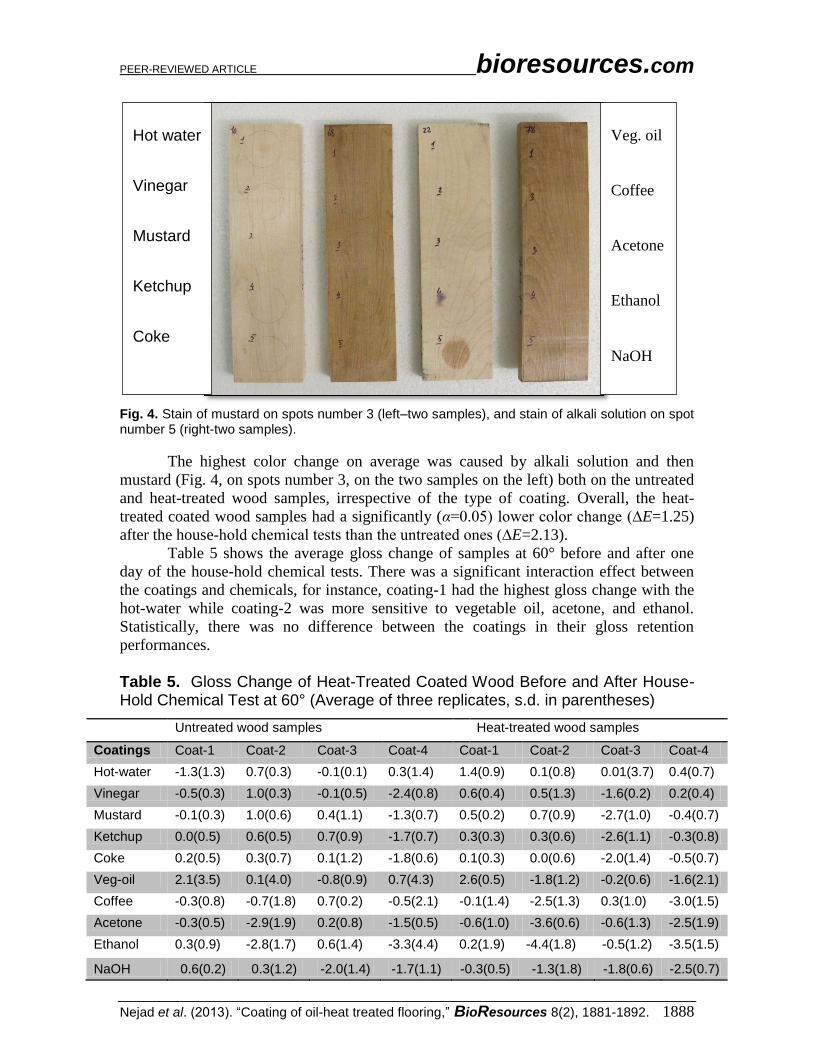
this study, the most damaging effect was caused by the 2.5% sodium hydroxide solution
(Fig. 4, on spots number 5, on the right two samples). Since the effect was so strong that
it masked all of the other differences among the other chemical exposures, the results of
the alkali solution were excluded from further statistical analysis. None of the other
chemicals caused any blistering or erosion to the coatings.
Fig. 3. Average ∆E color change of samples after chemical tests on untreated and heat-treated wood samples coated with coating number 2
PEER-REVIEWED ARTICLE bioresources.com
Nejad et al. (2013). “Coating of oil-heat treated flooring,” BioResources 8(2), 1881-1892. 1888
Fig. 4. Stain of mustard on spots number 3 (left–two samples), and stain of alkali solution on spot number 5 (right-two samples).
The highest color change on average was caused by alkali solution and then
mustard (Fig. 4, on spots number 3, on the two samples on the left) both on the untreated
and heat-treated wood samples, irrespective of the type of coating. Overall, the heat-
treated coated wood samples had a significantly (α=0.05) lower color change (∆E=1.25)
after the house-hold chemical tests than the untreated ones (∆E=2.13).
Table 5 shows the average gloss change of samples at 60° before and after one
day of the house-hold chemical tests. There was a significant interaction effect between
the coatings and chemicals, for instance, coating-1 had the highest gloss change with the
hot-water while coating-2 was more sensitive to vegetable oil, acetone, and ethanol.
Statistically, there was no difference between the coatings in their gloss retention
performances.
Table 5. Gloss Change of Heat-Treated Coated Wood Before and After House-Hold Chemical Test at 60° (Average of three replicates, s.d. in parentheses)
Untreated wood samples Heat-treated wood samples
Coatings Coat-1 Coat-2 Coat-3 Coat-4 Coat-1 Coat-2 Coat-3 Coat-4
Hot-water -1.3(1.3) 0.7(0.3) -0.1(0.1) 0.3(1.4) 1.4(0.9) 0.1(0.8) 0.01(3.7) 0.4(0.7)
Vinegar -0.5(0.3) 1.0(0.3) -0.1(0.5) -2.4(0.8) 0.6(0.4) 0.5(1.3) -1.6(0.2) 0.2(0.4)
Mustard -0.1(0.3) 1.0(0.6) 0.4(1.1) -1.3(0.7) 0.5(0.2) 0.7(0.9) -2.7(1.0) -0.4(0.7)
Ketchup 0.0(0.5) 0.6(0.5) 0.7(0.9) -1.7(0.7) 0.3(0.3) 0.3(0.6) -2.6(1.1) -0.3(0.8)
Coke 0.2(0.5) 0.3(0.7) 0.1(1.2) -1.8(0.6) 0.1(0.3) 0.0(0.6) -2.0(1.4) -0.5(0.7)
Veg-oil 2.1(3.5) 0.1(4.0) -0.8(0.9) 0.7(4.3) 2.6(0.5) -1.8(1.2) -0.2(0.6) -1.6(2.1)
Coffee -0.3(0.8) -0.7(1.8) 0.7(0.2) -0.5(2.1) -0.1(1.4) -2.5(1.3) 0.3(1.0) -3.0(1.5)
Acetone -0.3(0.5) -2.9(1.9) 0.2(0.8) -1.5(0.5) -0.6(1.0) -3.6(0.6) -0.6(1.3) -2.5(1.9)
Ethanol 0.3(0.9) -2.8(1.7) 0.6(1.4) -3.3(4.4) 0.2(1.9) -4.4(1.8) -0.5(1.2) -3.5(1.5)
NaOH 0.6(0.2) 0.3(1.2) -2.0(1.4) -1.7(1.1) -0.3(0.5) -1.3(1.8) -1.8(0.6) -2.5(0.7)
Hot water
Vinegar
Mustard
Ketchup
Coke
Veg. oil
Coffee
Acetone
Ethanol
NaOH

PEER-REVIEWED ARTICLE bioresources.com
Nejad et al. (2013). “Coating of oil-heat treated flooring,” BioResources 8(2), 1881-1892. 1889
The analysis of the data obtained from the gloss measurements at 60° before and
after the house-hold chemical tests showed that unlike the color change, there was no
significant difference in the average gloss change measurements between the heat-treated
and untreated samples. Vegetable oil, ketchup, and mustard increased the gloss of the
coated samples, and the others reduced the gloss (Table 6). The greatest gloss loss was
caused by ethanol. Among 10 tested house-hold chemicals, the highest colour and gloss
change on both untreated and heat-treated wood samples was caused by mustard.
Table 6. Two-way ANOVA Results of Effect of House-hold Chemicals on Gloss Change at 60°
Chemical Mean gloss change Tukey Grouping*
Veg-oil 0.39 A
Ketchup 0.21 AB
Mustard 0.20 AB
Vinegar -0.03 AB
Coke -0.03 AB
Hot-water -0.34 ABC
Coffee -1.39 BC
Acetone -1.92 C
Ethanol -1.99 C
*Means with the same letter are not significantly different
The pencil hardness results are shown in Table 7 (average of 5 replicates). The
recorded data is the hardest pencil that did not leave any indentation mark on the
coatings’ surfaces. Surprisingly, the coatings had a better scratch resistance performance
on the heat-treated wood than the untreated wood samples. This could be due to the
structural changes of the wood during the heat-treatments that caused the coatings not to
be able to penetrate as deep as in the untreated wood and to have a higher dry film
thickness on the heat-treated wood samples.
Table 7. Results of Pencil Hardness Tests of Coated- Untreated and Treated Wood Samples
Untreated Heat-Treated
Coating-1 3B* B
Coating-2 2B HB
Coating-3 3B HB
Coating-4 2B 2B
*The hardness decreases from HB, B, 2B to 3B
All of the coatings showed very minimal weight loss after 2000 Taber abrasion
cycles with no visible signs of erosion, so only the results for the longest abrasion period
are discussed. The analysis of the wear-index data showed that both the treatments and
the coating effects were significant. The average wear-index of the heat-treated wood,
17.2 mg/1000 cycle after 2000 cycles, was significantly lower than the corresponding
value for untreated wood (29.1 mg/1000 cycle). Among the four evaluated coatings,

PEER-REVIEWED ARTICLE bioresources.com
Nejad et al. (2013). “Coating of oil-heat treated flooring,” BioResources 8(2), 1881-1892. 1890
coating-3 was the best in terms of adhesion ratings, abrasion resistance, and its color
retention after the house-hold chemical tests. The coating that was modified at the
University of Toronto (Coating-4) by adding 1% of adhesion promoter had significantly
better abrasion resistance (Fig. 5) than the original commercially formulated coating
(coating-3), only on the untreated wood sample.
Fig. 5. Weight loss of coated- treated and –untreated wood samples after 2000 abrasion cycles
To better explain the results of the pencil hardness and abrasion tests, we
measured the hardness of the uncoated treated and untreated wood samples. The Janka
test results showed that the heat-treated soft maple wood samples had, on average (25
measurements), a slightly higher hardness (5.2 KN ±0.7) than the untreated wood
samples (4.9KN ±0.6), but statistically the difference was not significant. A higher
hardness value can be explained by the significantly lower equilibrium moisture content
(60%) of the heat-treated samples at room temperature (5%) compared to the equilibrium
moisture content of the untreated soft maple wood samples (8%). Both the pencil
hardness test and the Taber abrasion test showed that the heat-treated wood also had a
higher coating surface hardness than the untreated wood. Since both the wood surface
and the coating on the heat treated wood is as hard or harder than those of the untreated
wood, it can be concluded that the heat-treatment process conducted at 180 °C did not
reduce the surface hardness of the soft maple wood samples, which makes such treated
wood a good candidate for wood flooring. It is known that higher treatment temperatures
result in wood with darker coloration, better dimensional stability, and improved
biological resistance, but mechanical properties are adversely affected (Esteves and
Pereira 2009), which may limit the use of higher temperatures for flooring applications.
CONCLUSIONS
1. Treating wood at a 9 to 10% initial moisture content and drying it in a blanket
rather than the oven did not increase the wood defects compared with treating
drier wood at a 4 to 6% MC and gradually cooling it down in an oven.
2. Higher excess oil on the surface of the beech wood samples caused significant
adhesion loss of the coatings; therefore, we do not recommend the oil-heat
treatment for treating American beech wood.

PEER-REVIEWED ARTICLE bioresources.com
Nejad et al. (2013). “Coating of oil-heat treated flooring,” BioResources 8(2), 1881-1892. 1891
3. Measuring the hardness of the treated wood showed that treating the wood at
180 °C did not reduce the surface hardness of the wood samples.
4. Coated heat-treated soft maple samples had better color retention after the
house-hold chemical tests, better abrasion, and better scratch resistance. The
main problem was the adhesion of water-based coatings to the heat-treated
wood, which was lower than on the untreated wood. Coating’s formulators
should focus on finding ways to improve the adhesion for the coatings
formulated for application on heat treated wood.
ACKNOWLEDGMENTS
We would like to thank MITACS and the Sansin Corporation for funding support
for the study and also Tony Ung for his technical help.
REFERENCES CITED ASTM (2012), “ASTM D1037: Standard test methods for evaluating properties of wood-
base fiber and particle panel materials,” Annual Book of ASTM Standards.
ASTM (2007), “ASTM D1308: Standard test methods for effect of household chemicals
on clear and pigmented organic finishes,” Annual Book of ASTM Standards.
ASTM (2009), “ASTM D2244-09b: Standard test methods for calculation of color
tolerances and color differences from instrumentally measured color coordinates,”
Annual Book of ASTM Standards.
ASTM (2010), “ASTM D2369: Standard test methods for volatile content of coatings,”
Annual Book of ASTM Standards.
ASTM (2009), “ASTM D3359: Standard test methods for measuring adhesion by tape
test,” Annual Book of ASTM Standards.
ASTM (2011), “ASTM D3363: Standard test methods for film hardness by pencil test,”
Annual Book of ASTM Standards.
ASTM (2010), “ASTM D4060: Standard test methods for abrasion resistance of organic
coatings by the Taber abraser,” Annual Book of ASTM Standards.
Boonstra, M. J., and Tjeerdsma, B. (2006). "Chemical analysis of heat treated
softwoods," Holz als Roh- und Werkstoff 64, 204-211.
Cao, Y., Lu, J., Huang, R., Zhao, X., and Jiang, J. (2012). "Effect of steam-heat treatment
on mechanical properties of Chinese fir," BioResources 7(1), 1123-1133.
Esteves, B. M., and Pereira, H. M. (2009). "Wood modification by heat treatment: A
review," BioResources 4(1), 370-404.
Hakkou, M., Pétrissans, M., Zoulalian, A., and Gérardin, P. (2005). "Investigation of
wood wettability changes during heat treatment on the basis of chemical analysis,"
Polymer Degradation and Stability 89(1), 1-5.
Hill, C. A. S. (2006). Wood Modification: Chemical, Thermal and Other Processes, John
Wiley & Sons, Ltd., NJ.
Kocaefe, D., Poncsak, S., Doré, G., and Younsi, R. (2008). "Effect of heat treatment on
the wettability of white ash and soft maple by water," Holz Roh Werkst. 66(5), 355-
361.
PEER-REVIEWED ARTICLE bioresources.com
Nejad et al. (2013). “Coating of oil-heat treated flooring,” BioResources 8(2), 1881-1892. 1892
Leitch, M. A. (2009). "Hardness values for thermally treated black ash," Wood and Fiber
Science 41(4), 440-446.
Militz, H. (2002). "Thermal treatment of wood: european process and their background,"
Paper presented at the The International Research Group on Wood Preservation,
Wales.
Pétrissans, M., Gérardin, P., El Bakali, I., and Serraj, M. (2003). "Wettability of heat-
treated wood," Holzforschung 57(3), 301-307.
Rapp, A. O., and Sailer, M. (2012). "Heat treatment of wood Germany- state of the art,"
Retrieved August- 2012 http://thermaltreatedwood.com/Worldwide/Germany.pdf
Sailer, M., Rapp, A. O., and Leithoff, H. (2000). "Improved resistance of scots pine and
spruce by application of an oil-heat treatment," Paper presented at the The
International Research Group on Wood Preservation, Hawaii, USA.
Sivonen, H., Maunu, S. L., Sundholm, F., Jämsä, S., and Viitaniemi, P. (2002).
"Magnetic resonance studies of thermally modified wood," Holzforschung 56(6),
648-654.
Tjeerdsma. (2005). "Chemical changes in hydrothermal treated wood: FTIR analysis of
combined hydrothermal and dry heat-treated wood," Holz als Roh- und Werkstoff
63(6), 102-111
Wang, J., and Cooper, P. (2003). "Review on thermal treatments of wood," Paper
presented at the CWPA Proceedings, Halifax, Canada.
Wang, J., and Cooper, P. (2005). "Effect of oil type, temperature and time on moisture
properties of hot oil-treated wood," Holz als Roh - und Werkstoff 63(6), 417-422.
Źivković, V., Prša, I., Turkulin, H., Sinković, T., and Jirouš-Rajković, V. (2008).
"Dimensional stability of heat treated wood floorings," Drvna Industrija 59(2), 69-73.
Article submitted: December 27, 2012; Peer review completed: February 10, 2013;
Revised version received and accepted: February 14, 2013; Published: February 21, 2013.