perceptions of power in brands and an investigation …
TRANSCRIPT

PERCEPTIONS OF POWER IN BRANDS AND AN
INVESTIGATION INTO MARKET DOMINANCE
A DISSERTATION SUBMITTED TO THE FACULTY
OF THE UNIVERSITY OF MINNESOTA BY
JENNIFER LYNNE STONER
IN PARTIAL FULFILLMENT OF THE
REQUIREMENTS FOR THE DEGREE OF DOCTOR
OF PHILOSOPHY
CARLOS J. TORELLI
JUNE 2016

© Jennifer Lynne Stoner 2016
i
ACKNOWLEDGEMENTS
This dissertation and even the completion of my PhD would not have been
possible without the love and support of so many people.
First of all, thank you to all the faculty members in the marketing department at
Carlson who have helped me along the way. I would especially like to thank the members
of my dissertation committee: Mark Snyder, for bringing thoughtful questions and
comments to each and every presentation that you have attended; Deborah Roedder John,
for helping me grow as a researcher and an academic through both your advice on my
dissertation research as well as your mentorship as a co-author; and Barbara Loken, for
taking a chance on a first year’s idea about naming her mixer and sticking with me
through all the submissions of that project and for all the feedback you have given me
along the way. Most importantly, I’d like to extend my sincere thanks to Carlos Torelli.
Thank you for being with me through every step of this process, through good
reviews/data and bad. Thank you for encouraging me to read and learn broadly. Thank
you for your endless support. I am honored to be the first of what I am sure will be a long
line of your students.
I would also like to thank my PhD colleagues for all the feedback and advice you
have given in brown bags, in practice talks, and in the hallway. I would especially like to
thank Noelle Nelson and Ryan Rahinel for their mentorship during the first few years of
my PhD experience. I learned so much from both of you. I am also grateful to Xiaolin Li
for being a wonderful officemate and for understanding when my static electric charge

ii
would inadvertently turn off the lights at least once a week. Thank you to Yajin Wang for
setting a really high bar for me to follow, being an amazing friend, and sharing not only
your wisdom as a “senior” PhD student but also your “thousands of years of knowledge.”
I extend thanks to Chiraag Mittal for surviving these five years with me. I am deeply
appreciative for having the best academic “little sister” a girl could ask for in Maria
Rodas. I am thankful for Ryan Wang acclimating to the crazy Minnesota PhD world so
quickly. To my friends, Stephanie Cantu, Michael Covey, and Nicholas Olson, thanks for
being the type of friends that would pick me up from the airport rather than give me $20
for a cab and for always encouraging me to try.
While my PhD friends have helped me survive the PhD program, my friends
outside the program are the ones who have really kept me sane along the way. My Wake
Forest family didn’t blink an eye when a crazy MBA student said she thought she wanted
to get a PhD. None of this would have been possible without the support and guidance of
Melvin Scales, Jon Pinder, Sherry Moss, Michelle Roehm, and Kenny Herbst. Heartfelt
gratitude goes to my MBA best friend and arch rival, Andy Rinehart, for all the sushi,
wisdom, level-headedness, and love. I was also lucky enough to find a fantastic group of
friends in Minnesota to support me through this time. Special thanks to my “Caribou
girls” (Shannon Bjorklund, Carolyn Gwi, Jenny Linstad, Jess Schmitt, and Jen Weir) and
their husbands (Eric Bjorklund, Ezekial Gwi, David Linstad, Paul Schmitt, and Ben
Weir). Finally, thanks to my friends that have supported me from throughout the United
States, especially Danielle Espenshade, Amanda Harclerode, and Kathleen Ketchum,
iii
who have always been just a text, phone call, care package, plane ride, or wine glass
away.
Last but not least, I offer special gratitude to my mom and “pop”. Thank you does
not do justice to express the gratitude I have for being blessed with as wonderful and
supportive parents as you. Pop, thank you for inspiring my love of marketing. Did you
ever think that a 4th
grade focus group and Home Depot “store checks” Saturdays after
soccer would come to this? You’ve taught me so much about business and about enjoying
life. Mom, thank you for being supportive in whatever I was doing, whether that was a
six year old with aspirations of being an archaeologist or a PhD student beginning a
career as a Marketing Professor. You inspire me with your generosity and thoughtfulness,
and I hope that I can be even remotely as good of a person as you.

iv
TABLE OF CONTENTS
LIST OF TABLES ……………………………………………………………………... v
LIST OF FIGURES …………………………………………………………………… vi
OVERVIEW…………………………………………………………………………….. 1
ESSAY 1: A TYPOLOGY OF POWER IN BRANDS……………………………….. 9
ESSAY 2: TOO NICE TO BE DOMINANT: HOW BRAND WARMTH IMPACTS
PERCEPTIONS OF MARKET DOMINANCE ……………………………………. 42
ESSAY 3: WHEN BIGGER ISN’T BETTER: HOW PERCEPTIONS OF
MARKET DOMINANCE INTERACT WITH EXISTING BRAND IMAGES TO
IMPACT BRAND FAVORABILITY……………………………………….……….. 75
SUMMARY AND FUTURE DIRECTIONS……………………………………….. 111
BIBLIOGRAPHY……………………………………………………………………. 118
APPENDICES ……………………………………………………………………….. 123

v
LIST OF TABLES
ESSAY 1
Table 1: Structure Matrix with Factor Loadings (Study 1) ………………..
Table 2: Correlations with Naïve Power and Individual Dimensions of Power
(Study 1)……………………………………………………………
Table 3: Brand Means for Various Dimensions of Brand Power (Study 1) …..
Table 4: Structure Matrix with Factor Loadings (Study 2) …………………
Table 5: Correlations with Naïve Power and Individual Dimensions of Power
(Study 2)……………………………………………………………
Table 6: Brand Means for Various Dimensions of Brand Power (Study 2) …..

vi
LIST OF FIGURES
ESSAY 1
Figure 1: Confirmatory Factor Analysis Path Diagram (Study 3)…………
Figure 2: Confirmatory Factor Analysis Path Diagram (Study 4) …………
ESSAY 2
Figure 1: The Impact of Warmth on Perceptions of Market Share for Real Brands
(Study 1) ………………………………………………
Figure 2: The Impact of Warmth on Perceptions of Market Share for Fictitious
Brands (Study 2) ……………………………………………
Figure 3: Mediation Path of Brand Warmth on Market Dominance through
Competitiveness (Study 3)………………………………………………..
Figure 4: The Impact of Product Category Knowledge on Perceptions of Market
Dominance for a High Warmth versus Low Warmth Brand (Study 4)…….
Figure 5: The Impact of Self Relevance on Preference for a High Warmth Brand
(Study 5) …………………………………………………………
ESSAY 3
Figure 1: Brand Favorability as a Function of Product Category and Type of Ad
(Study 2) ……………………………………………………………..
Figure 2: Mediation Path of Market Dominance on Brand Favorability Through
Warmth (Study 2) ……………………………………………...
Figure 3: Brand Favorability as a Function of Brand Description and Type of Ad
(Study 4) ……………………………………………………………
1
OVERVIEW
The area of branding has had a history of adopting various human dimensions to
help describe brand concepts and consumers’ reactions to brands (Aaker 1997; Torelli et
al. 2012). These constructs have helped to not only illustrate the attributes of various
brands but also to study the reactions of consumers to various marketing actions. My
dissertation proposes a new construct, brand power that is useful in further understanding
brands. Power is a commonly used construct in psychology but has yet to be applied to
brands. This is somewhat surprising given that power is pervasive in social psychology
research and the terms “powerful brand” are regularly used by business publications.
What exactly is a “powerful brand”? How are perceptions regarding the embodiment of
power in a brand formed? How do existing brand perceptions interact with marketing
messages that communicate a brand’s embodiment of power? The three essays of my
dissertation seek to answer each of these questions.
Essay 1 provides a conceptual overview of brand power and reviews four
proposed dimensions by which consumers perceive of power in brands. Additionally, this
essay not only validates the four dimensions of brand power but also develops scale items
to measure each of these dimensions. I choose to then focus the remainder of the
dissertation on one specific dimension of power, market dominance. Essay 2 explores
consumer inferences of market dominance in brands. I find that, when category
knowledge is unavailable, consumers infer that high warmth brands are lower in market
dominance than low warmth brands. Essay 3 then continues the study of market
2
dominance by investigating how an ad communicating market dominance can negatively
impact high warmth brands. I find that communicating market dominance can dilute a
brand’s warmth and decrease favorable evaluations of the brand. Taken together, these
three essays explore how power is embodied in brands and how that embodiment can
impact consumer behavior.
Essay 1: A Typology of Power in Brands
In this essay, I investigate how brands embody power. I begin exploring this area
by validating a scale measuring the perception of brand power based on four proposed
dimensions. Power has previously been defined as control over valuable resources
(Keltner, Gruenfeld and Anderson 2003; Rucker and Galinsky 2008). I develop three
dimensions in my typology from this definition: control of essential resources, control of
informational resources, and associations with status. My final dimension of brand power
is developed based on French and Raven’s (1975) Social Bases of Power, as well as,
popular press’s common definition of “brand power” (Dill 2015): market dominance. I
completed four studies to investigate these four proposed dimensions. In all the studies,
participants rated a variety of brands on items related to the four dimensions of power as
well as an overall association with power. Specifically, I found that:
Studies 1 & 2: Exploratory factor analyses found that items measuring the four
proposed dimensions of brand power load onto four distinct factors. These four factors
individually correlated with an overall perception of brand power.

3
Study 3: A confirmatory factor analysis verified that the items were a good overall
fit for the four dimensions of brand power.
These three studies found support for the proposed dimensions of brand power
while also validating a scale to measure these dimensions. The final study focused on
exploring the dimension that I chose as the focus of the final two essays of the
dissertation: market dominance. Specifically, it aimed to better understand how the
market dominance construct is related to other similar constructs. This study discovered
that:
Study 4: A confirmatory factor analysis found that a model in which popularity,
high sales, and market dominance underlies one latent variable; bullying and dominant
brand personality underlies a second latent variable; and trendsetting and iconicity
underlies a third latent variable was a good fit.
Essay 2: Too Nice to Be Dominant:
How Brand Warmth Impacts Perceptions of Market Dominance
In the experiments of Essay 2, I examine how consumers develop perceptions of
market dominance. Research has shown that consumers are unaware of brands’ market
dominance (Kamins, Alpert, and Perner 2007). This is important given that even
misperception as a market leader has been shown to lead to positive evaluations from
consumers (Kamins, Alpert, and Perner 2003). I hypothesize and find that when
consumers lack direct knowledge about the dominance hierarchy in a category, they

4
make inferences about market dominance based on the brand’s image. Specifically I
propose that a brand that is warm, kind, and generous will be perceived as less market
dominant. This is driven by a conflict between warmth and the power associated with a
dominant brand.
Research has shown that powerful people (i.e. leaders), a desire for leadership,
and perceptions of leaders are positively related to dominance and dominant behaviors
(Archer 2006; Fragale, Overbeck, and Neale 2011; Lord, De Vader, and Alliger 1986).
These findings seem to be in conflict with perceptions of high warmth brands—having
cooperative intentions and demonstrating sincerity and trustworthiness (Kervyn, Fiske,
and Malone 2012; Aaker, Garbinsky, and Vohs 2012). Therefore, I propose and find that
consumers perceive brands high in warmth as being less market dominant than brands
low in warmth.
In four studies, participants were presented with a brand either high or low in
warmth and then asked to make judgments regarding the brands’ market dominance in
their respective categories. These ratings of market dominance supported my prediction.
For example:
Studies 1 (real brands) & 2 (fictitious brands): Participants rated high warmth
brands as having a lower market share than low warmth brands in the same category.
This effect emerged in a variety of product categories.
Study 3: Participants again rated a high warmth brand as being less market
dominant than a low warmth brand in the same product category. In this study, market
dominance was measured by a scale measure rather than by market share. Additionally,
5
this effect was driven by decreased perceptions of market competitiveness in that the high
(low) warmth brand was perceived to be less (more) competitive in the market hence
leading to decreased (increased) perceptions of market dominance.
Study 4: For participants with high knowledge of the product category, the
negative impact of warmth on perceptions of market dominance was attenuated.
These four studies demonstrate that warmth can negatively impact perceptions of
a brand’s market dominance. In my final study, I demonstrate how this decrease can
impact choice. Drawing on research showing that dominant brands are preferred in
choice situations that are highly self-relevant (Kim et al. 2008), I find evidence that the
negative impact of warmth on perceptions of market dominance can have implications for
a similar choice setting. The results from this study found that:
Study 5: Participants showed decreased (increased) preference for a high (low)
warmth brand when making a highly self-relevant choice.
Essay 3: When Bigger Isn’t Better: How Perceptions of Market Dominance Interact
with Existing Brand Images to Impact Brand Favorability
In Essay 3, I investigate how an embodiment of power through communications
of market dominance can negatively impact high warmth brands. Brands often
communicate their dominance through slogans and advertisements—something that is
not surprising given that consumers are generally unaware of a brand’s market

6
dominance (Kamins et al. 2007) and even misperception as a market leader can lead to
positive consumer evaluations (Kamins et al. 2003).
As stated previously, past research has shown that perceptions of leaders are
related to dominance and dominant behaviors (Lord et al. 1986). Essay 2 demonstrated
that these perceptions of dominance are in conflict with warmth—demonstrating sincerity
and trustworthiness (Kervyn et al. 2012). I propose that communicating market
dominance is inconsistent with warmth. This inconsistency decreases consumer
favorability towards high warmth brands that promote market dominance in
advertisements. I further argue that this effect is driven by a dilution of the brand’s
warmth. I hypothesize and demonstrate that for high warmth brands, communicating
dominance can have unintended consequences and trigger negative consumer
evaluations.
In four studies, participants were presented with a high warmth brand and their
attitudes towards the brand were negatively impacted when they viewed an ad
communicating market dominance. Across four studies, I found that:
Study 1: Participants evaluated less favorably a fictitious high warmth brand when
they viewed an advertisement communicating market dominance versus a control
advertisement communicating competence but not dominance.
Study 2: Participants evaluated less favorably fictitious high warmth brands in a
variety of product categories when they viewed an advertisement communicating market
dominance versus a control advertisement. This decrease in favorability was driven by
dilution of the brands’ warmth.

7
The first two studies demonstrate how communicating market dominance can
negatively impact brands high in warmth. In the final two studies, I explored how
marketers can attenuate the negative impact of market dominance by reframing the
brand’s dominance as a descriptive norm describing the buying behavior of consumers in
the category. Descriptive norms have been demonstrated to not only increase a message’s
persuasive (Cialdini et al. 2006; Goldstein, Cialdini, and Griskevicius 2008) but also to
be helpful to consumers (Cialdini, Kallgren, and Reno 1991; Goldstein et al. 2008) – a
trait compatible with warmth.
Study 3: Participants evaluated less favorably a real, high warmth brand when
they viewed an advertisement communicating market dominance versus an advertisement
communicating similar information framed as a descriptive norm. This effect was again
driven by a dilution of the brand’s warmth.
Study 4: Participants evaluated less favorably a fictitious high warmth brand when
they viewed an advertisement communicating market dominance versus an advertisement
communicating similar information framed as a descriptive norm. This effect was not
seen for a low warmth brand in the same category nor for a high warmth brand in a
category where warmth is a point of parity.
The rest of my dissertation is organized as follows. Essay 1 includes an
introduction, theoretical framework, four studies, and general discussion regarding the
four dimensions of brand power. Essay 2 contains an introduction, theoretical framework,
five studies, and general discussion pertaining to how consumers infer market dominance
in brands. Essay 3 includes an introduction, theoretical framework, four studies, and

8
general discussion concerning the impact of communicating market dominance. Finally, a
conclusion summarizes the research contribution of all three essays and discusses
limitations and directions for future research.

9
Essay 1
A Typology of Power in Brands

10
Introduction
Past research has adapted human constructs such as personality and values to
describe brands and predict consumer reactions towards brands; however, the construct of
power while pervasive in marketing research has been only minimally applied to brands.
This is somewhat surprising as lists of the “most powerful brands” and articles about how
to develop a powerful brand are regularly published in business periodicals. What exactly
is a “powerful brand”? Do consumers easily see brands in terms of the power that they
hold? What are the dimensions of brand power? This research attempts to answer these
questions. The research summarized below outlines several dimensions that lead
consumers to perceive brands as powerful. Additionally, we develop a scale to measure
these individual dimensions of power.
Branding research has adopted human dimensions such as personality and values
to help describe and understand symbolic, abstract dimensions of brand concepts (Aaker
1997; Torelli et al. 2012). These constructs have helped to not only illustrate the
attributes of various brands but also have helped to study the reactions of consumers to
various brand actions such as CSR initiatives (Torelli, Monga, and Kaikati 2012). While
these dimensions have added to marketing literature as well as managerial knowledge,
there are still under-studied abstract concepts. One of these concepts is brand power. Our
research fills this gap by investigating how consumers perceive power in brands. This
contributes to our theoretical understanding of brand concepts and informs managers
about how to incorporate notions of power in brands.

11
We will first review literature on brand imagery and power before outlining the
four dimensions of power that we believe consumers perceive in brands. The discussion
of a fifth dimension that was considered but rejected will also be included because of its
value for future research. We will then review three studies that both confirm these
dimensions of power as well as validate a scale to measure the individual dimensions. An
additional fourth study will further investigate the market dominance dimension
specifically.
Brand Imagery
Marketers attempt to position products in the minds of consumers by using
distinct brand concepts and images (Park, Jaworski, and MacInnis 1986). Specifically,
many brand managers have attempted to connect their brand’s image to human-like
characteristics through processes such a personification and anthropomorphism (Aaker
1997; Keller 2007a). Understanding a brand in human terms may allow consumers to see
similarities and connections between the brand and themselves, which in turn has been
shown to elicit a more favorable reaction to the brand (Aaker 1999; Ahluwalia and
Kaikati 2001).
With the expression of humanlike brand concepts being of such import to both
consumers and marketers, it is no wonder that previous literature has adapted personality
constructs to describe brands. For example, Aaker (1997) outlined the dimensions of
brand personality in order to compare and contrast them with the “Big Five” dimensions

12
of personality. Additionally, Torelli et al. (2012) adopted Schwartz’s Value Survey, a
reliable measure of human values (Schwartz 1992; Schwartz and Boehnke 2004), as a
structure for helping to predict the compatibility of abstract brand concepts.
Power is a prevalent dimension used to describe individuals and interpersonal
relationships but has yet to be fully applied to brands. The power levels of individual
consumers have various implications on thought processes and the consumption
experience (Rucker, Galinsky, and Dubois 2012). However, individual concepts of power
have yet to be applied to brands themselves. This is somewhat surprising given that the
words “power brands” and “powerful brands” are commonly used and understood by
consumers and business publications.
Power
Power has been a long standing topic of interest in social psychology and more
recently in consumer behavior (Rucker et al. 2012; Galinsky, Rucker, and Magee 2015).
This attention is not undeserved as power has been demonstrated to have an effect on
cognition, perception, behavior, motivation, and physiology (for an overview see
Galinsky et al. 2015).
Specifically in consumer behavior, power has been shown to impact consumer
preferences and spending behavior. For example, a study by Rucker, Dubois, and
Galinsky (2011) found that high power participants, due to a higher value of the self,
spent more money on an assortment of chocolates for themselves than on an assortment
13
intended for others. Other research has demonstrated that powerless individuals engage in
compensatory consumption behaviors, choosing to consume high status products in an
attempt to restore feelings of power (Rucker and Galinsky 2008).
In marketing, power has been studied mainly in two research streams. The first is
in literature on the distribution of power within a marketing channel. The research in this
area applies various theories to help explain the balance of power and conflict among
members of the marketing channel (Gaski 1984). While channel power may help to
increase consumer perceptions of a brand’s power, our proposed dimensions are distinct
in that they describe power from a consumer’s perspective rather than the perspective of a
supplier or retailer.
The second research stream investigates the impact of the power state of the
consumer on behavior. This is justified given that power has been viewed in many cases
as a psychological experience (Rucker, Hu, and Galinsky 2014) or in the context of a
social relationship (Simpson et al. 2015). Our research extends this prior work by
identifying how consumers see brands as an embodiment of power. Prior research in
branding has shown that consumers naturally and easily see brands as relationship
partners (Fournier 1998). Therefore, it naturally follows that consumers should be able to
view brands as power holders.
14
Perceptions of Power in Brands
While several of the previously used dimensions of brand personality and values
may overlap with various conceptions of power, neither of these theoretical frameworks
fully captures all aspects of brand power. The Schwartz Value Scale (Schwartz 1992) has
a dimension labeled power that Torelli and colleagues (2012) have shown can apply to
brand concepts and that Allen and colleagues (2008) have used to apply to a product
category—red meat. However, this dimension seems to confound status and power, and
the individual measurement items seem to lean more towards measuring status (e.g.
wealth and social power). We believe that when it comes to brand associations, the
notions of power and status may be more distinctly separated in the minds of consumers
than when those concepts are applied to people. For instance, while large big box retailers
may be seen as “powerful”, they do not necessarily elicit associations with status. In fact,
the associations linked with this type of high power brand may be of mass market, low
status customers attracted by these retailers’ everyday low price strategies.
If brands are seen by consumers as entities that can hold power, the first obvious
question is what aspects of a brand make it powerful in the eyes of consumers? Power has
been defined in a variety of ways and full chapters or even books have been devoted to
outlining and distinguishing these various definitions (Guinote and Vescio 2010;
Wartenberg 1990; Winter 1973). It is not our intention to provide an exhaustive list of the
definitions of power; rather our proposed dimensions of brand power are related to two
commonly used definitions. The first is the foundational definition adopted by French
15
and Raven (1975) to develop their Bases of Social Power. They define power as one’s
potential ability to influence a target. This definition seems particularly relevant for
brands as brands may influence both consumers as well as other channel members. The
other definition of power we draw from is power as the control of valuable resources
(Keltner, Gruenfeld, and Anderson 2003; Rucker and Galinsky 2008). This definition is
commonly used in marketing literature that focuses on consumers’ power states. Given
that brands may be multinational conglomerates it is easy to understand how they may in
fact control various types of valuable resources.
From these two definitions, we propose that four core dimensions can be used to
describe the embodiment of power by brands: associations with status, control of
essential resources, control of information resources, and market dominance. Each of
these will be reviewed individually in the next section. Additionally, we will review one
other prospective dimension of power, associations with force, which we dismiss as a
dimension at this time but which we feel should be considered in future research on brand
power.
Associations with Status
Our first proposed dimension of brand power is associations with status. Power
and status are related and reinforcing dimensions of social hierarchy in that status is often
awarded to those with power and vice versa (Fragale, Overbeck, and Neale 2011; Magee
and Galinsky 2008). Status may itself be a base of power as it is directly related to what
French and Raven (1959) term referent and expert power (Rucker and Galinsky 2008).
Given the reinforcing nature of these two constructs, we propose that consumers will see

16
brands that can grant or signal status and in turn perhaps power, such as Louis Vuitton,
Rolex, and Porsche, as being powerful.
Simply wearing a luxury branded item of clothing has been shown to gain
preferential treatment in social interactions (Nelissen and Meijers 2011). Thus a status
brand has the ability to grant rewards to the owner. Research has already provided some
evidence that status brands are seen as signals of not just status but also power (Nelissen
and Meijers 2011). Additionally, when put in a powerless state, consumers desire status
signaling goods as a way to compensate for their loss of power (Rucker and Galinsky
2008). These status products are chosen because of the sense of power they provide
(Rucker and Galinsky 2008).
Control of Essential Resources
Several definitions of power include some reference to a control over valuable
resources (Keltner et al. 2003; Magee and Galinsky 2008). Additionally, two of French
and Raven’s (1959) dimensions of social power, reward and coercive power, are centered
around the ability to reward or punish. While status products may be monetarily valuable
and be given as rewards, the granting or withholding of essential resources such as water,
electricity or food may be used in these cases as well.
In the case of consumers and brands, we believe that the resources that consumers
most link with power would be those most basic elements of production or life in general,
natural and energy resources. Any consumer who has been without electricity or water
for more than a brief period of time may feel powerless at the hands of the utility
company. With other brands, consumers may simply not purchase from the product or

17
brand in the future; however, given the necessity of these resources and the monopoly
power in certain areas, consumers have very little ability to impose repercussions on
these companies in the face of inadequate service.
Control of Information Resources
Resources need not be considered essential in order to be considered valuable.
Information is another valuable resource that can grant power. Knowledge and
information has been directly related to the concept of expert power (French and Raven
1975). With the boom of the internet, the access to information has become greater than
ever before. Therefore, brands with an ability to collect and distribute information hold
greater power. In the past, the brands with high information resources would have been
traditional news sources such as the Wall Street Journal but now search engines like
Google and social networking sites like Facebook have access to a wealth of data and
information as well.
Consumers are beginning to realize the power that these brands embody. Many
consumers are aware of brands’ abilities to control the content or information they see
online based on information the brand has gathered (Francis 2015). Even prior to the
advent of the internet, research identified a link between power and controlling
information as those high in power motive had been shown to seek out positions that
control information such as working for a school newspaper (Winter 1973). Additionally,
with the popularity of social networking sites, websites like LinkedIn and Facebook can
provide an abundance of information about others. An ability to develop social

18
connections has been linked with status attainment (Anderson and Kilduff 2009) and thus
these sites wield valuable resources.
Market Dominance
While associations with status and control of various resources are related to
power in a theoretical sense, they are not necessarily what a marketer attempting to build
a powerful brand has in mind. Forbes’s list of the “world’s most powerful brands”
includes brands such as Apple, Coca-Cola, Disney, and McDonald’s (Forbes 2014).
While these brands may have control over essential resources or information resources,
the core of their power comes from the overall strength of the brand in the market. We
term this dimension of power “market dominance.”
Having a product that is dominant in a certain product category can grant a
company power in many domains. First of all, the brand has power over members of its
own supply chain. The risk of losing a large brand’s business for upstream and
downstream channel members may mean that the dominant brand can dictate the terms of
the channel relationship (Porter 1979). Research has demonstrated that greater relative
organizational size is linked with increased use of stronger methods of influence such as
withholding payment and legal action (Wilkinson and Kipnis 1978). Second, a leader in
the market may achieve a monopolistic-like positioning and dictate rules for that
category. The leader sets a standard and points of parity by serving as a category
exemplar (Carpenter and Nakamoto 1989; Kamins, Alpert and Perner 2007). Finally, by
being a market leader, customers may feel that they are tied to the brand and are unable to
switch to a competitor merely due to the brand’s omnipresence. In consumption

19
situations where choices are limited, it is likely that the market leader will be present (e.g.
even a small town will probably have a McDonald’s).
Associations with Force
A fifth dimension of brand power that we considered was associations with force.
Brands strongly connected with this dimension would gain power based on their
associations with what French and Raven (1959) term coercive power. Brands
embodying this dimension would include companies related to weaponry such as the gun
manufacturer Beretta as well as branches of the military such as the Marines. However, in
our exploratory research we found that the majority of consumers have very little
familiarity with these brands, interact with them very rarely, and generally do not think of
the power that they wield. Because most consumers are generally unaware of brands high
on this dimension of power and so do not evaluate brands based on this dimension, we
have chosen to not include “associations with force” in our further research. However,
this dimension of brand power should not be ignored and should possibly be explored in
future research with a subsequent population more familiar with these types of brands.
This paper will outline three studies to explore the four proposed dimensions of
power. These studies give evidence for the four dimensions as well as validate a scale
that can be used to measure them. In Study 1, we use an exploratory factor analysis to
assess the dimensionality of the scale and the reliability of each sub-scale. This study also
investigates how the individual dimensions of power correlate with consumers’ overall
perception of brand power as well as with each other. People may vary on their
conceptions of power (Torelli and Shavitt 2010) and hence how powerful a brand can be
20
perceived in general, based on individual differences or situational variables. We thus
included items to measure overall perception of power in brands in the hopes to better
understand which dimensions were related to the overall concept of brand power. We
refer to this general belief as “naïve power” as it is related to the participant’s naïve belief
about what is a powerful brand based on his/her own conceptualization of power. Study 2
refines the scale used in Study 1 and helps to provide further evidence for its validity.
Study 3 uses a structural model as a confirmatory factor analysis to provide further
evidence for the scale validity. Finally, Study 4 investigates the dimension of market
dominance, the focus of Essays 2 and 3 of this dissertation, in order to provide further
evidence for the discriminant validity of this dimension.
Study 1
In Study 1, we explore the proposed dimensions of power and how they are
related to an overall concept of brand power as well as to each other. Furthermore, we
develop items to measure each of the individual dimensions and explore the reliability for
each subscale.
Method
One hundred and thirty-two people were recruited from Amazon’s mTurk for a
study about brands and were paid a small amount of money for their participation.
Twelve brands, selected to vary on the proposed dimensions of power, were used as
stimuli. These brands were chosen by researchers knowledgeable in the area of branding

21
in order to ensure that two brands high on each of the proposed dimensions of power
were included on the list. We also included two brands that would be high on associations
with force as well as two filler brands that we believed would be high on multiple
dimensions of power. Each participant viewed questions for only three brands in order to
avoid fatigue (see the appendix A for the list of brands used in this study.)
Naïve power. Participants first answered four questions of their naïve associations
with the brand and power on a scale of 1 – 7 where 1 = None/Not at All and 7 = A
Lot/Very Much: “How much power does <brand> have?”, “To what extent is <brand>
associated with power?”, “To what extent does <brand> embody power?”, and “To what
extent does <brand> typify power?” The order of all questions, including the brands
listed in the questions, was randomized. Participants had been instructed that the brands
and question wording would be constantly changing and to read all the questions
carefully.
Individual dimensions of power. After completing all the measures of naïve brand
power, participants then rated the embodiment of each power dimension. They did so by
answering three items associated with each of the four proposed dimensions of power:
Associations of Status (“being associated with status,” “being associated with wealth,”
“being associated with prestige”), Control of Essential Resources (“control of natural
resources,” “control of energy resources,” “control of raw materials”), Control of
Information Resources (“having the ability to spread knowledge rapidly,” “having the
ability to collect large amounts of information,” “control of general information
resources”), and Market Dominance (“dominating the competition,” “preventing

22
customers from switching to competing brands,” “being big”). All questions began with
“How much power does <brand> have when power is defined as…” and were responded
to using a 1 (“None”) to 7 (“A Lot) scale. As with the questions of naïve brand power, the
order of all the questions and brands was again randomized for each participant.
Brand personality and values. In order to provide evidence of convergent validity,
after completing the measures of brand power each person completed eight items
measuring the brands’ sophistication and ruggedness (Aaker 1997) as well as five items
measuring the brands’ association with the value of self-enhancement (Torelli et al.
2012). We believe that the power dimension of “associations with status” should be
correlated with both a brand personality of sophistication as well as the value of self-
enhancement. Additionally, the dimension of “control of essential resources” should be
correlated with ruggedness due to the association with raw materials such coal, oil, water,
etc.
Results
Factor analysis. The ratings of the individual items associated with each of the
four dimensions of power were subjected to a maximum likelihood exploratory factor
analysis with oblimin rotation. The factor analysis revealed four factors. The individual
items loaded together as expected with each factor appearing to describe each of the
proposed dimensions of power. The only exception is the item “preventing customers
from switching to competing brands,” which didn’t appear to load well on any of the
factors (see table 1 for factor loadings).
23
-----------------
Insert Table 1 here
-------------------
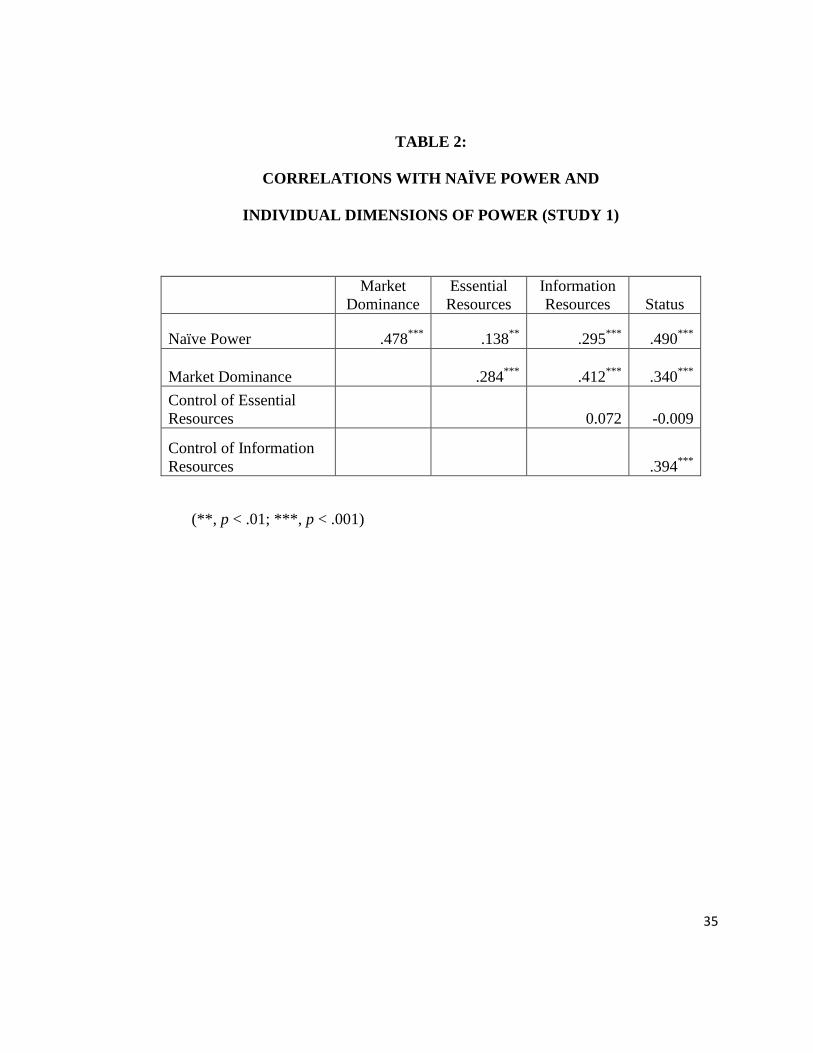
Correlations. The three items for each dimension of power were averaged
together to come up with a score for each dimension (all α’s > .58). Consistent with the
factor analysis results, the reliability analysis revealed that the reliability of the market
dominance scale would increase should the preventing switching item be removed (from
.58 to .74). The four items for the naïve power measure were also averaged together (α =
.93). As expected all of the proposed dimensions of power were significantly correlated
with the naïve measure of power (all p’s < .01). Being associated with status was the
most highly correlated with naïve power (r = .49) followed closely by market dominance
(r = .48). The third most correlated dimension was control of information resources (r =
.30), and the lowest correlation was control of natural resources (r = .14). The low
correlation of naïve power with natural resources is not surprising given that in the
United States, the participants’ home country, natural resources are typically a guarantee
and companies that control these resources are typically subject to government
regulations. The majority of the dimensions also correlated with each other (p’s < .01).
The only exception was that control of essential resources was not correlated with control
of information (r = .07, p = .18) nor with associations with status (r = -.01, p = .86). The
fact that the majority of the dimensions are correlated with each other is not surprising in
that one dimension such as market dominance is likely to bring with it access to other
24
dimensions of power such as essential or informational resources (see table 2 for all
correlations).
------------------
Insert Table 2 here
----------------
Predictive validity. We tested the predictive validity of each sub-scale by
assessing the extent to which the different brands used as stimuli scored as expected on
their corresponding dimensions as expected. All of the brands scored highly on the
associated dimension of power. This provides initial evidence that the scale is useful in
accurately measuring the dimensions of power perceived in different brands (see table 3
for all brands’ means).
-------------
Insert Table 3 here
--------------
Convergent validity. We computed the mean of the ratings for sophistication,
ruggedness, and self-enhancement (α’s > .85) and assessed the correlation between these
mean ratings and those of the associations with status and control of essential resources
sub-scales. As predicted, the mean ratings of associations with status was correlated with
the mean ratings of sophistication (r = .46, p < .01) and the mean ratings of self-
enhancement (r = .43, p < .01). In addition, control of essential resources was correlated
with ruggedness (r = .20, p < .01). These results provide evidence of convergent validity
25
for our dimensions of power in that the dimensions which should be related to certain
brand personalities or values are in fact significantly correlated with those constructs.
Discussion
Results from the first study seem to provide evidence that people perceive the
embodiment of power by brands based on our proposed dimensions and that the proposed
scales are valid measures of each dimension. The only exception would be the item
“prevent customers from switching to competing brands”. It could be that consumers
perceive power based on market dominance as the power over competitors and other
channel members rather than from constraining consumer choice. Therefore, in Study 2,
we replace this item with “being a leader in the market”. Furthermore, Study 1 provides
evidence of both predictive and convergent validity for our dimensions of brand power.
In addition to refining the items measuring market dominance, Study 2 will replicate the
results of Study 1 using a different sample of participants.
Study 2
Study 2 will attempt to refine the individual items for the dimensions of power
scale by changing an item that did not load as expected in Study 1. Additionally, we will
again explore the correlations between the dimensions of power and the overall concept
of brand power as well as the relationship between the dimensions themselves using a
different sample of participants.

26
Method
Ninety-four participants were recruited from mTurk for a study on Brand
Perceptions and were paid a small amount of money for completing the survey. The
design used the same brands as Study 1 and followed the same design except that the
item regarding preventing customer switching was replaced with “being a leader in the
market” for the market dominance power dimension.
Results
Factor analysis. A maximum likelihood exploratory factor analysis with oblimin
rotation once again revealed four factors. The individual items loaded as expected onto
the dimensions for which they were designed. All items loaded onto their expected
factors with a factor loading greater than .66 (see table 4 for all factor loadings).
-------------
Insert Table 4 here
------------
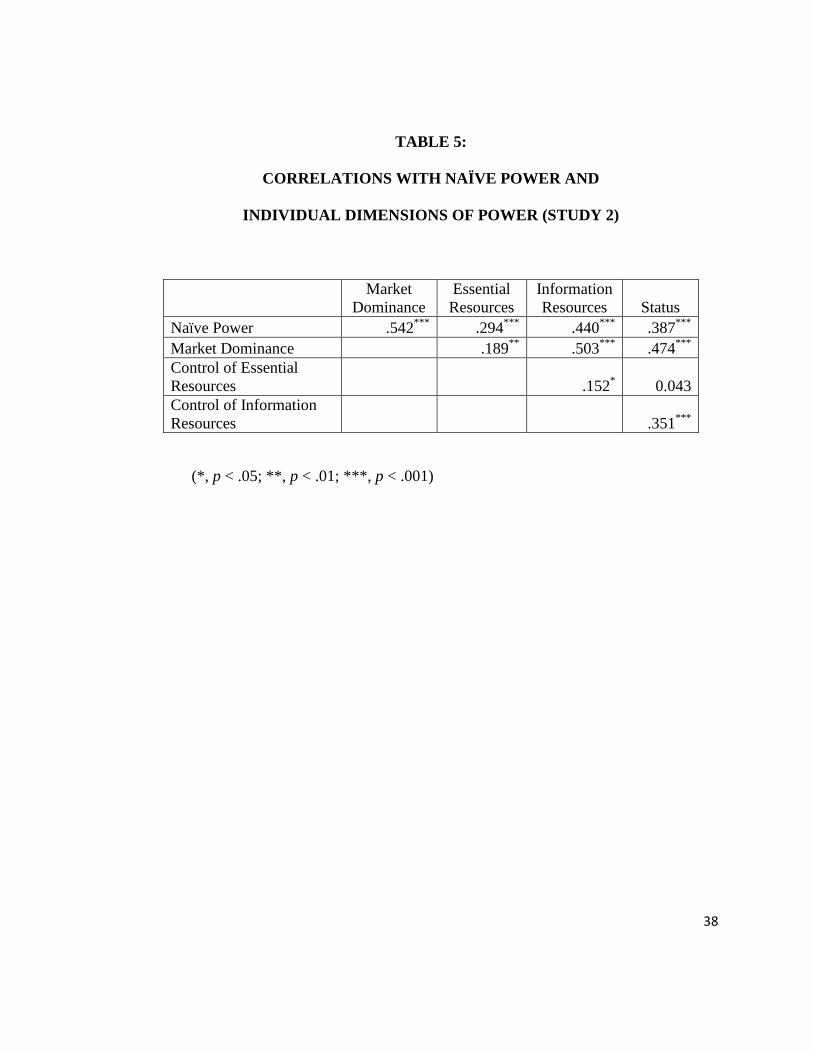
Correlations. Once again the three scale items associated with each dimension
were averaged to come up with an overall index for a given dimension of brand power
(all α’s > .81). Additionally, the four items for naïve power were also averaged (α = .95).
As expected, all dimensions of power correlated with the measure of naïve power (p’s <
.001) suggesting that all of these dimensions are related to an overall concept of brand
power in the consumer’s mind. Market dominance was the most strongly correlated with
the overall measure of power (r = .54), followed by control of information resources (r =
.44), associations with status (r = .39), and control of essential resources (r = .29). In this

27
study, the only dimensions not correlated with each other were control of essential
resources and associations with status (r = .04, p = .47, see table 5 for all correlations).
------------
Insert Table 5 here
-------------
Predictive validity. We once again assessed the extent to which the different
brands used as stimuli scored as expected on their corresponding dimension. Each brand
scored highly on its associated dimension of power (see table 6 for all brands’ means).
-----------
Insert Table 6 here
-------------
Discussion
Study 2 supports the findings of Study 1 by demonstrating that the proposed
dimensions of power are again correlated with an overall concept of brand power.
Additionally, the individual items for each dimension loaded appropriately onto the
factors and were a valid measure of each dimension of power. However, both Study 1
and Study 2 have used an exploratory factor analysis in order to assess the fit of the
individual items to each of the dimensions of power. Study 3 will use a confirmatory
factor model in order to provide further evidence for the validity of the dimensional
structure of brand power.
28
Study 3
Study 3 used the same scale items as Study 2 but will use a confirmatory factor
analysis to test the fit of the dimensional structure of brand power.
Method
One hundred and twenty-four participants were recruited from Amazon’s mTurk
for a study on Brand Perceptions and were paid a small amount of money in exchange for
their participation. The same brands that were used in the first two studies were also used
for Study 3. Study 3 followed the exact same design as Study 2 except that it excluded
the naïve power measure and was conducted with the intention of submitting the results
to a confirmatory factor analysis instead of an exploratory factor analysis.
Results
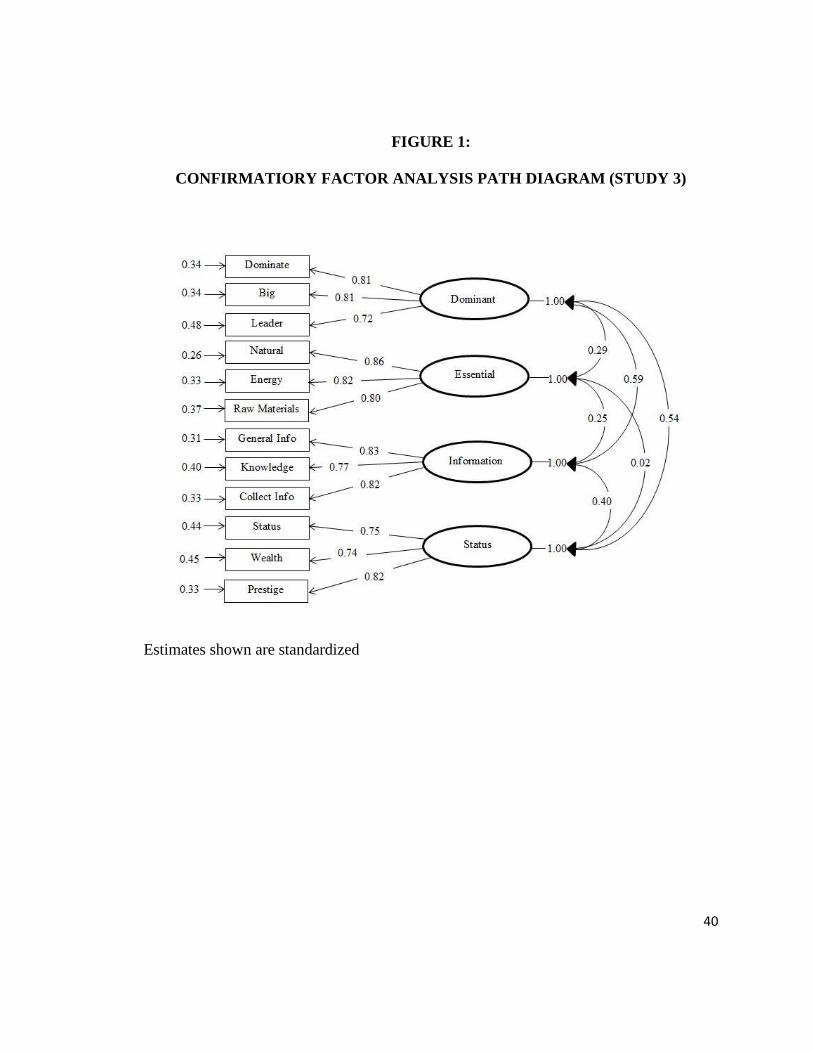
LISREL software was used to run a confirmatory factor analysis with the four
dimensions of brand power as latent variables and three items as indicators for each
dimension. All of the latent variables were allowed to correlate with each other since the
previous studies demonstrate that, as hypothesized, most of the dimensions of power are
interrelated (see figure 1 for path diagram).
While LISREL returned a significant Chi-square (χ2 = 79.17, p < .01), Hu and
Bentler (1999) recommend rules for two other fit indices to determine acceptance of this
type of model: CFI > .96 and RMSEA < .09. The CFI (.99) and RMSEA (.04) of our
model are well within these acceptable ranges. Based on these measures we concluded
that this model was a good fit and accepted the twelve scale items.

29
-------------------
Insert Figure 1 here
-----------------
Discussion
Study 3 used the more stringent confirmatory factor analysis to validate the
dimensional structure of the brand power scale. Together with the previous two studies,
our results provide evidence for the validity and reliability of a four dimensional scale to
measure the embodiment of power in brands. Study 4, was designed to further investigate
the dimension of market dominance, the emphasis of Essays 2 and 3, in order to provide
further discriminant and convergent validity for this dimension.
Study 4
While our first three studies investigate our four proposed dimensions of power,
our final study aims to delve deeper into the dimension of market dominance. Is market
dominance as we have defined it (“being big”, “a leader in the market”, and “dominating
competition”) related with other concepts such as being a bully, being popular, or simply
having a high level of sales? This study is designed to answer this question.
In this study, we chose six different concepts that could potentially be related to
market dominance: bullying, popularity, high level of sales, trendsetting, iconicity, and
dominant personality. Previous literature and conceptions of market dominance led to the
inclusion of these concepts. Because “being big” and “dominating the competition” have
30
been associated with stronger methods of influence with channel members (Wilkinson
and Kipnis 1978), it could be that market dominance is related with being seen as a
channel “bully” and having a dominant brand personality. Additionally, perceptions of
market dominance can be framed as the concrete levels of sales and market share that the
brand enjoys or as the large number of people purchasing the brand (i.e. the brand’s
popularity). Finally, brands that are market dominant may set the standard in the category
(Carpenter and Nakamoto 1989; Kamins et al. 2007) which could mean they are
perceived either as a trendsetter or an icon in their product category.
Pretest
We first conducted a pretest to identify brands to be used as stimuli. Forty-seven
participants were recruited from a large American university in exchange for course
credit for a study on brand perceptions. The motivation of this pretest was to uncover
brands associated with market dominance. These participants completed six open ended
questions in which they were asked to name brands associated with concepts that overlap
with our definition of market dominance: bullying, popularity, high level of sales,
trendsetting, iconicity, and dominant personality (see appendix A for exact wording of
the questions). Additionally, participants were asked a final open ended question asking
them to list a brand defined by the items used to measure market dominance in Studies 2
and 3.
We compiled the answers for each open ended response. For Study 4, brands that
at least three participants had listed as representative of a given question were chosen as
stimuli. Additionally, we included the two brands associated with control of essential
31
resources from Studies 1-3 as that dimension was underrepresented (see appendix A for
complete list of brands).
Method
One hundred and sixty-six participants were recruited from Amazon’s mTurk for
a survey on brand perceptions and were paid a small amount of money for their
participation. Participants were randomly assigned to answer questions for one of the
seventeen stimuli brands chosen from the open ended questions described above.
Participants completed three items associated with each of the six concepts related
to market dominance. These questions were worded and responded to in a manner similar
to the dimensions of power measures used in prior studies: (“How much power does
<BRAND> have when power is defined as…?” 1 = “None”, 7 = “A Lot”). Three items
pertaining to each concept related to market dominance were added: bullying (forcing
buyers and suppliers to do what it wants, always getting its way, getting others to do as it
wants), popularity (being used by a wide variety of people, having widespread
acceptance, being regularly used by many people), high level of sales (generating high
levels of revenue, accounting for a high percentage of sales in a given product category,
producing a lot of income), trendsetting (being a trendsetter, setting the trend for the
product category, being a brand that all competitors want to be), iconicity (being iconic
for the category, being the standard that competitors are compared to, being used as a
point of comparison for other products in the category), and dominant personality (having
a dominant personality, being forceful, being assertive). Additionally, participants
32
completed the three items associated with the market dominance dimension of brand
power used in Studies 2 and 3.
Results
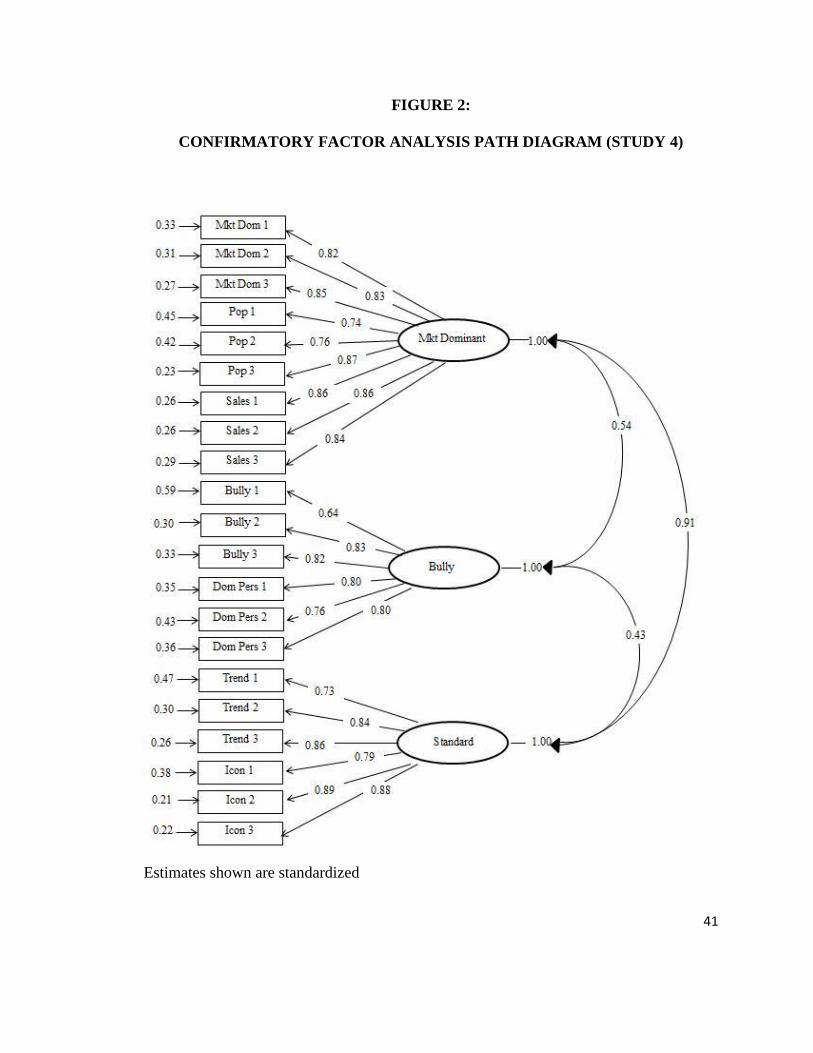
LISREL software was once again used to run a confirmatory factor analysis. A
model with a single latent factor resulted in a poor fit , (χ2 = 1394, p < .001, CFI = .93,
RMSEA = 0.20). However, a three factor model (market dominance: market dominance,
high level of sales, and popularity; channel bully: bullying and dominant personality; and
point of comparison within the category: iconicity and trendsetter) showed a good fit to
the data using the fit indices recommended by Hu and Bentler (1999) (χ2 = 410.75, p <
.001, CFI = .98, RMSEA = 0.086, see figure 2 for path diagram).
---------------
Insert Figure 2 here
--------------
Discussion
Study 4 explored the dimension of market dominance to further clarify the brand
attributes associated with this dimension in the minds of consumers. Underlying the
marketing dominance latent variable was not only the market dominance items used in
the previous studies but also the individual items measuring popularity and having high
sales. Bullying and a dominant personality were related to a separate latent variable and
trendsetting and iconicity were related to a third latent variable. This suggests that these
four concepts—bullying, having a dominant personality, trendsetting, and iconicity—are
distinct from market dominance.

33
General Discussion
This research proposed and validated four dimensions of brand power. We find
evidence that associations with status, control of essential resources, control of
information resources, and market dominance are all related to an overall concept of
brand power. Furthermore, we developed a scale to measure these four dimensions.
Future research should explore the implications of each of these various dimensions of
power in not only how are they developed in the mind of the consumer but also what
implications having or communicating these dimensions of power have for a brand.
Additionally, we find evidence demonstrating that market dominance is related to but
distinct from brand bullying, having a dominant personality, trendsetting and iconicity.
In the remainder of this dissertation, I choose to focus on the dimension of market
dominance. I chose to start with this dimension for a few reasons. First, Essay 1 has
demonstrated that market dominance is one of the most highly correlated dimensions
with an overall concept of power. Furthermore, it is one of the most communicated by
brands through messages of market leadership and yet is understudied in current
marketing literature.

34
TABLE 1:
STRUCTURE MATRIX WITH FACTOR LOADINGS (STUDY 1)
Factor
1 2 3 4
Preventing Switching 0.272 0.402 -0.181 0.272
Dominating Competition 0.290 0.212 -0.349 0.803
Being Big 0.279 0.127 -0.273 0.741
Control Natural Resources 0.027 0.888 -0.010 0.101
Control Energy Resources 0.055 0.823 0.016 0.190
Control of Raw Materials 0.108 0.809 0.018 0.134
Control General Information
Resources 0.803 0.178 -0.371 0.366
Ability to Spread Knowledge 0.759 0.033 -0.356 0.208
Collect Large Amounts of
Information 0.819 0.145 -0.360 0.495
Associated with Status 0.327 -0.038 -0.858 0.309
Associated with Wealth 0.322 0.130 -0.596 0.340
Associated with Prestige 0.382 0.013 -0.836 0.225
35
TABLE 2:
CORRELATIONS WITH NAÏVE POWER AND
INDIVIDUAL DIMENSIONS OF POWER (STUDY 1)
Market
Dominance
Essential
Resources
Information
Resources Status
Naïve Power .478***
.138**
.295***
.490***
Market Dominance .284***
.412***
.340***
Control of Essential
Resources 0.072 -0.009
Control of Information
Resources .394***
(**, p < .01; ***, p < .001)

36
TABLE 3:
BRAND MEANS FOR VARIOUS DIMENSIONS OF BRAND POWER (STUDY 1)
Market
Dominance
Essential
Resources
Information
Resources Status
GE 5.62 5.36 4.30 4.70
Wal-mart 5.90 3.34 4.51 4.18
American Water 4.61 5.60 3.08 3.68
Pacific Gas 5.04 5.89 4.26 4.22
New York Times 4.75 3.17 6.17 5.13
CNN 4.89 2.24 5.97 4.87
Porsche 4.14 3.20 2.83 6.38
Versace 4.63 3.30 3.63 5.77
Winchester Arms 4.46 3.75 3.77 4.11
U.S. Army 5.12 4.04 4.81 4.97
Bank of America 5.40 3.83 5.58 5.40
Wells Fargo 4.91 2.94 4.96 5.39

37
TABLE 4:
STRUCTURE MATRIX WITH FACTOR LOADINGS (STUDY 2)
Factor
1 2 3 4
Market Leader 0.466 0.150 0.402 0.787
Dominating Competition 0.440 0.233 0.455 0.807
Being Big 0.364 0.105 0.507 0.731
Control Natural Resources 0.035 0.894 0.165 0.205
Control Energy Resources 0.027 0.873 0.108 0.107
Control of Raw Materials 0.057 0.863 0.155 0.232
Control General Information
Resources 0.350 0.151 0.893 0.503
Ability to Spread Knowledge 0.335 0.129 0.717 0.415
Collect Large Amounts of
Information 0.259 0.115 0.825 0.481
Associated with Status 0.960 0.036 0.314 0.438
Associated with Wealth 0.669 0.023 0.322 0.451
Associated with Prestige 0.710 0.046 0.299 0.407
38
TABLE 5:
CORRELATIONS WITH NAÏVE POWER AND
INDIVIDUAL DIMENSIONS OF POWER (STUDY 2)
Market
Dominance
Essential
Resources
Information
Resources Status
Naïve Power .542***
.294***
.440***
.387***
Market Dominance .189**
.503***
.474***
Control of Essential
Resources .152* 0.043
Control of Information
Resources .351***
(*, p < .05; **, p < .01; ***, p < .001)

39
TABLE 6:
BRAND MEANS FOR VARIOUS DIMENSIONS OF BRAND POWER (STUDY 2)
Market
Dominance
Essential
Resources
Information
Resources Status
GE 5.64 5.02 3.98 4.96
Wal-mart 6.16 3.17 4.68 3.97
American Water 4.29 5.03 3.41 3.61
Pacific Gas 4.95 5.80 4.48 4.11
New York Times 5.31 3.42 5.82 5.02
CNN 5.13 2.40 5.87 4.69
Porsche 5.11 3.11 3.47 6.04
Versace 4.59 3.00 3.44 5.42
Winchester Arms 4.64 3.53 3.76 4.30
U.S. Army 5.55 4.12 5.04 4.63
Bank of America 5.71 3.50 5.32 5.26
Wells Fargo 5.19 2.77 5.00 5.41
40
FIGURE 1:
CONFIRMATIORY FACTOR ANALYSIS PATH DIAGRAM (STUDY 3)
Estimates shown are standardized
41
FIGURE 2:
CONFIRMATORY FACTOR ANALYSIS PATH DIAGRAM (STUDY 4)
Estimates shown are standardized
42
Essay 2
Too Nice to Be Dominant:
How Brand Warmth Impacts
Perceptions of Market Dominance

43
Many brands have adopted brand images high in warmth in order to differentiate
themselves from the competition. Snuggle fabric softener uses the cuddly Snuggle bear
character to differentiate itself from other products in the category, such as Bounce.
Marie Callendar’s frozen meals feature product lines like “comfort bakes” and focus on
their “just like homemade” taste to differentiate from less warm brands in the freezer
section like Hungry Man. While perceptions of warmth may increase positive and
comforting associations with these brands, we propose that it may have a negative impact
on perceptions of the brand’s market dominance in the category.
Perceptions of high market share, one measure of market dominance, have been
linked to positive consumer evaluations as consumers may assume that proficient brands
grow market share (Kamins, Alpert, and Perner 2003). Consumers may also enjoy the
broad availability, perceived social benefits, and reduced risk associated with high market
share brands (Hellofs and Jacobson 1999). However, consumers are not always aware of
which brand is the market leader in a given product category (Kamins, Alpert, and Perner
2007). Confusion over the leadership positions of brands in a category is important given
that even misperception as a market dominant brand leads to positive evaluations from
consumers (Kamins et al 2003).
Because being perceived, even wrongly, as market dominant can have positive
consequences, it is important for marketers to understand how consumers judge the
market share hierarchy in product categories. We propose that one cue that participants
use for making inferences about a brand’s market dominance is the brand’s image,
specifically the (lack of) warmth. Just as people rely on personality cues to make

44
inferences about leadership abilities (Lord, DeVader, and Alliger 1986), we believe that
consumers rely on brand image cues to make inferences about the leadership position of
brands in a product category.
Consumer Perceptions of Market Share
While some consumers may be highly knowledgeable about the brands in a given
product category and be able to retrieve information on a brand’s market dominance
directly from memory, many consumers are relatively unaware of market share
hierarchies (Kamins et al. 2003). Consumer confusion is increased by marketing
strategies meant to imitate other brands and by an excess of brand information (Kamins et
al. 2003). One brand may advertise that it is the leader in quality while another might
claim to be the leader in customer satisfaction. All of these claims about leadership along
a variety of market dimensions can lead to consumer uncertainty over who the true
leaders are in terms of sales in the category. This ambiguity about market dominance in
consumer memory, may lead consumers to make inferences based on available
information (Kamins et al. 2007). Kamins and coauthors (2007) demonstrated that most
consumers use schematic inferencing, deriving inferences based on their general
knowledge, to identify market dominant brands. What type of general knowledge might
consumers draw from in order to make these inferences? We propose that the brand’s
image is one accessible cue used by consumers.

45
Market Dominance and Brand Image
While specific leadership claims may get lost in consumers’ memory, brand
image may be more easily accessible as marketers aim to strengthen their brand’s image
in the minds of target consumers. In fact, brand equity is based on building these strong
associations in consumers’ minds (Keller 1993). Park, Jaworski, and MacInnis (1986) go
so far as to say that “conveying a brand image to a target market is a fundamental
marketing activity” (pg. 135). The strong association between a brand name and brand
image suggests that brand image would be an accessible cue for inference making in
regards to a brand. Research has shown that consumers use brand image as a cue for
inferences about products in regards to quality (Jacoby, Olson, and Haddock 1971) and
attributes of brand extensions (Aaker and Keller 1990). We propose that consumers also
use brand image to make inferences about a brand’s market dominance in the absence of
objective market information. We begin to explore what types of brand image attributes
maybe (in)compatible with concepts of market dominance.
Market Dominance and Power
Apart from the impact on consumer evaluations (Kamins et al. 2003), little is
known about how consumers perceive of a brand’s dominance in a product category.
Some marketing literature has suggested market leadership is an embodiment of power in
a brand (Sundar and Noseworthy 2014). While power has been of interest in consumer
research, the majority of this research focuses on how having or lacking power affects’

46
consumer choices (Galinsky, Rucker, and Magee 2015; Rucker, Galinsky, and Dubois
2012). Little research has explored how power is embodied by a brand.
Market dominance can grant power to a brand through influence and leadership.
A dominant market position may also lead to a brand’s status as a category exemplar and
thus dictate what attributes competing brands must have in order to be perceived as a
member of the product category (Carpenter and Nakamoto 1989; Kamins et al. 2007).
Market dominance may also provide a brand with power over members of the supply
chain via purchasing and selling power (Porter 1979). Dominant brands have been shown
to use stronger methods of influence, such as withholding payment, on channel partners
(Wilkinson and Kipnis 1978). These methods of influence seem to map well onto the
coercive base of social power as defined by French and Raven (1959).
While past literature seems to support the link between market dominance and
brand power, we constructed a pilot test to assess the relationship more directly.
Participants (N = 124) were recruited on mTurk and were paid a small amount of money
to complete a study on brand perceptions. Each participant answered questions about
three brands from a set of twelve total brands (see appendix B for brand stimuli).
Participants first responded on a 7-point scale (1 = None/Not at All and 7 = A Lot/Very
Much) to four items to measure their general views about the brand’s power: “How much
power does <brand> have?”, “To what extent is <brand> associated with power?”, “To
what extent does <brand> embody power?”, and “To what extent does <brand> typify
power?” After completing all the measures of general brand power, participants then
completed three individual items associated with market dominance: Market Dominance
47
(“dominating the competition,” “being a leader in the market,” “being big”). All
questions began with “How much power does <brand> have when power is defined
as…[dominating the competition, being a leader in the market, being big]” and were
responded to using a 1 (“None”) to 7 (“A Lot) scale (Stoner and Torelli 2015). The order
of all questions, including the brands listed in the questions, was randomized. Results
from this pilot study demonstrated that participants’ perceptions about the general
embodiment of power in a brand (α = .93) was significantly correlated with their
perceptions of the brand’s market dominance (α = .82, r = .62, p < .01). This suggests
that, as hypothesized and consistent with prior research, an overall concept of brand
power is related to power derived from perceptions of market dominance.
Given that market dominance is perceived by consumers as an embodiment of
power, we propose that these images may conflict with certain brand images, specifically
images of warmth. We turn to this issue next.
Market Dominance and Warmth
Warmth is one basic dimension used for making social judgments and one that
has recently been used to describe brand imagery (Aaker, Garbinsky, and Vohs 2012;
Aaker, Vohs, and Mogilner 2010; Bennett and Hill 2012; Kervyn, Fiske, and Malone
2012). Research has shown that powerful people (i.e. leaders), a desire for leadership, and
perceptions of leaders have been related to dominance and dominant behaviors (Fragale,
Overbeck, and Neale 2011; Lord et al. 1986), selfishness (Rucker, Dubois, and Galinsky
2011), and general masculinity (Koenig et al. 2011, Lord et al. 1986). All of these
findings seem to be in conflict with the image of high warmth brands which are seen as

48
having cooperative intentions and demonstrating sincerity and trustworthiness (Kervyn et
al 2012; Aaker et al. 2012). Furthermore, social judgments of a person’s power have been
demonstrated to be negatively related to perceptions of warmth (Fragale et al. 2011).
Given this negative relationship between power and warmth, consumers should perceive
that a high warmth brand will have less power and thus less dominance (an embodiment
of power) in the product category.
Finally, research on brands as embodying human values also supports the theory
that consumers may perceive a conflict between market dominance and a brand’s
warmth. Prior research suggests that a high warmth brand, as being associated with
benevolent values within the higher-order dimension of self-transcendence, which
includes items such as helpfulness, honesty, forgiveness and responsibility, and market
dominance, as being associated with power and achievement values within the higher
order self-enhancement dimension, which includes items such as success, ambition, and
influence on people and events (Schwartz and Boehnke 2004), are incompatible values
(Torelli et al. 2012; Torelli, Monga, and Kaikati 2012). Drawing on prior research
regarding the perceptions of leaders, high warmth brands, and power, we hypothesize that
being high in warmth will cause consumers to perceive that a given brand will be less
dominant than a brand lower in warmth. Stated more formally:
H1: Perceptions of market dominance will be negatively impacted for brands
high (versus low) in warmth.
Additional research has found that perceptions of warmth are associated with a
lack of competition (Fiske et al. 2002; Fiske et al. 1999; Russell and Fiske 2008).

49
Applying these findings to the marketing context, we propose that warmth will also
negatively impact perceptions of the brand’s competitiveness. Competitive brands are
thought to be strategic in order to gain positions of market dominance (Stalk, Evans, and
Shulman 1992). Therefore, we believe that the negative effect of warmth on perceptions
of competitiveness in turn negatively affects perceptions of market dominance. Stated
more formally:
H2: The negative impact of warmth on perceptions of market dominance is
due to decreased perceptions of market competitiveness.
While most consumers use schematic inferencing to develop perceptions of a
brand’s market dominance (Kamins et al. 2007), some consumers may be highly
knowledgeable in the product category and retrieve market dominance information
directly from memory. These consumers will not need to rely on a brand’s warmth as a
cue. Thus, for consumers that are highly knowledgeable about a product category, the
impact of warmth on perceptions of market dominance will be decreased. Stated more
formally:
H3: Knowledge about the category will moderate the effects of warmth on
perceptions of market dominance.
H3a: When product category knowledge is high, the negative impact of warmth
on perceptions of market dominance will be attenuated.
But can the negative effect of market dominance on warmth impact a brand in an
actual choice situation? Decreased (increased) perceptions of market dominance may
make it easier (harder) for a brand to be seen as an underdog based on its weak market
50
standing (Hoch and Deighton 1989) which has been shown to impact brand preference
(Kim et al. 2008; Paharia et al. 2009).
Market Dominance as a Top Dog
Being perceived as more (less) market dominant may lead consumers to conclude
that brand is a(n) top dog (underdog) (Hoch and Deighton 1989). Underdogs have not
only been defined as brands with a weak market position (Hoch and Deighton 1989) but
also as those that have a built stories of struggling against the odds in the face of
competitors with extensive resources (Kim et al. 2008; Paharia et al. 2009). However,
while the story of the underdog may tug on consumers’ heart strings, they may realize
market dominant brands offer superior products (Kim et al. 2008). Research has shown
that when consumers are faced with self-relevant purchase situations, they show greater
(lower) preference for these potentially superior (inferior) brands that are perceived to be
top dogs (underdogs) (Kim et al. 2008). We propose that if, as we hypothesize,
perceptions of market dominance are negatively impacted by warmth, then when choices
are highly self-relevant, consumers should show a lower preference for high warmth
brands which would be perceived less (more) as a top dog (underdog). Stated more
formally:
H4: In highly self-relevant consumption settings, consumers will show a
decreased preference for high warmth brands.

51
Overview of Studies
Five experiments were conducted to investigate the impact of warmth on
consumers’ inferences about market dominance, of category knowledge as a boundary
condition, and of warmth on consumer choice. In Study 1, we use real brands in two
different product categories, cough syrup and fabric softener, to find initial evidence for
hypothesis 1: warmth can negatively impact perceptions of market dominance. Study 2
replicates these findings using fictitious brands in two different product categories, pens
and adhesive bandages. Study 3 explores the decreased perceptions of competitiveness as
the mechanism behind our effect (H2). Study 4 examines the role of product category
knowledge using real brands in a category where consumers vary in knowledge (H3).
Finally, Study 5 demonstrates the implications for brand preferences on the proposed
effect (H4).
Study 1: Real Brands
Study 1 investigates the impact of warmth on perceptions of market dominance as
measured by market share. This study uses real brands in two product categories in order
to increase the external validity of the findings.
Method
One hundred and five undergraduate students at a large American university were
recruited for a study on brands and received course credit in exchange for their
52
participation. Participants were randomly assigned to conditions in a 2 (brand: high
warmth/low warmth) X 2 (product category: cough syrup/fabric softener) mixed design
with brand as a within subjects factor and product category as a between subjects factor.
The fabric softener and cough syrup categories were chosen as target product categories
based on pretests that suggested that college students have limited knowledge of those
categories. College students would, therefore, need to rely on inferences rather than
retrieval of knowledge from memory in order to make judgments about the market
dominance of the brands (see results below).
All participants were given a brief explanation of what market share is. They were
then asked the market share of both the high warmth and low warmth brands in either the
cough syrup (low warmth: Robitussin, high warmth: Triaminic) or fabric softener (low
warmth: Bounce, high warmth: Snuggle) product categories. The order of the brands was
randomized so that approximately half of the participants were asked about the high
warmth brand first and the other half were asked about the low warmth brand first.
Participants completed demographic information and were debriefed and dismissed.
Results
Manipulation checks. A group of participant (N = 25) from the same participant
pool were asked questions to assess their knowledge of both the fabric softener and cough
syrup categories. For each category participants were asked two questions to evaluate
their overall familiarity and knowledge of the category on two 7-point scales: “How
familiar are you with the <PRODUCT> category? 1 = Not at All, 7 = Very Much”; “How
much do you know about <PRODUCT> category? 1 = Nothing, 7 = Everything”.
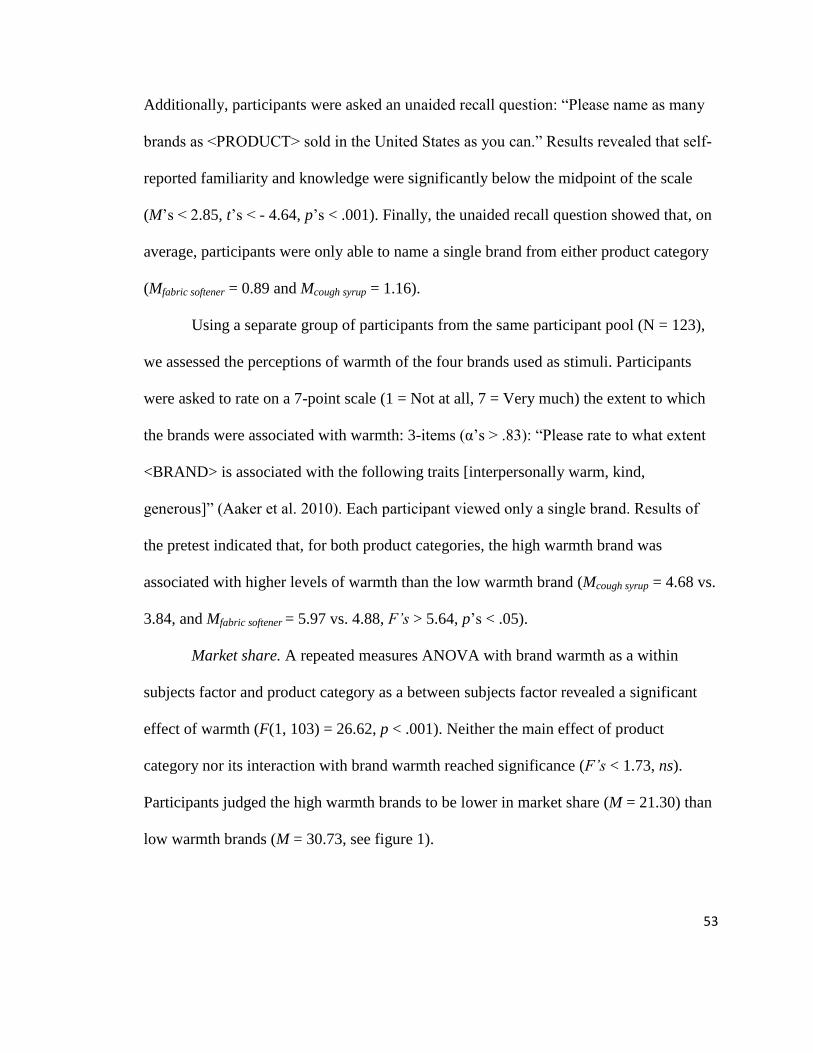
53
Additionally, participants were asked an unaided recall question: “Please name as many
brands as <PRODUCT> sold in the United States as you can.” Results revealed that self-
reported familiarity and knowledge were significantly below the midpoint of the scale
(M’s < 2.85, t’s < - 4.64, p’s < .001). Finally, the unaided recall question showed that, on
average, participants were only able to name a single brand from either product category
(Mfabric softener = 0.89 and Mcough syrup = 1.16).
Using a separate group of participants from the same participant pool (N = 123),
we assessed the perceptions of warmth of the four brands used as stimuli. Participants
were asked to rate on a 7-point scale (1 = Not at all, 7 = Very much) the extent to which
the brands were associated with warmth: 3-items (α’s > .83): “Please rate to what extent
<BRAND> is associated with the following traits [interpersonally warm, kind,
generous]” (Aaker et al. 2010). Each participant viewed only a single brand. Results of
the pretest indicated that, for both product categories, the high warmth brand was
associated with higher levels of warmth than the low warmth brand (Mcough syrup = 4.68 vs.
3.84, and Mfabric softener = 5.97 vs. 4.88, F’s > 5.64, p’s < .05).
Market share. A repeated measures ANOVA with brand warmth as a within
subjects factor and product category as a between subjects factor revealed a significant
effect of warmth (F(1, 103) = 26.62, p < .001). Neither the main effect of product
category nor its interaction with brand warmth reached significance (F’s < 1.73, ns).
Participants judged the high warmth brands to be lower in market share (M = 21.30) than
low warmth brands (M = 30.73, see figure 1).
54
-------------------------
Insert Figure 1 here
------------------------
Discussion
Using real brands, Study 1 provides initial support for hypothesis 1. Brands high
in warmth are perceived as being less market dominant than brands low in warmth. While
using real brands provides realism and external validity, the brands could be confounded
on variables other than warmth. For our next study, we provide participants with
information on fictitious brands and manipulate perceptions of warmth.
Study 2: Fictitious Brands
Study 2 was designed to find additional support for hypothesis 1. Unlike Study 1,
we use fictitious brands and manipulated the extent to which the brand embodied warmth.
Method
Eighty-one undergraduate students at a large American university were recruited
for a study on brand perceptions in exchange for course credit. The experiment was a 2
(brand: high warmth/low warmth) x 2 (product category: adhesive bandages/pens) within
subjects design where the order of conditions was randomized for each participant.
Participants were given a brief explanation of what market share is and were
informed that they would view some brand descriptions. They viewed the description of a
fictitious brand and indicated their market share estimate for the brand. The high warmth

55
brand descriptions highlighted relationships between people while the low warmth brand
did not. For instance, the high warmth pen brand description emphasized an advertising
campaign promoting the ability of the written word to connect people (see appendix B for
description of brands). Each participant repeated the procedure for all four brands.
Results
Manipulation checks. A separate group of participants from the same subject pool
(N = 143) rated the brand descriptions in terms of warmth associations on the same items
used in Study 1’s pretest. Participants rated the high warmth brand descriptions as
significantly higher in warmth than the low warmth brand descriptions for both product
categories (α’s > .94, Mbandage = 5.39 vs. 4.31, and Mpen = 4.95 vs. 3.87, F’s > 10.59, p’s
<.01)
Market share. A repeated measures ANOVA with two factors (product category
and brand warmth) revealed a main effect of product category (F(1, 80) = 24.63, p < .01)
with participants judging brands in the adhesive bandage category to have overall higher
market shares (M = 20.60) than the brands in the pen category (M = 15.52). More
importantly, and consistent with hypothesis 1 and the findings of Study 1, there was also
a significant main effect of brand warmth (F(1, 80) = 21.94, p < .001). The interaction of
brand with product category did not reach significance (F(1,80) = .277, ns). As predicted,
brands low in warmth were judged to have greater market share (M = 20.30) than those
high in warmth (M = 15.83). Participants estimated that the market share for the high
warmth brand was lower than the low warmth brand in both the adhesive bandage (M =
18.11 vs. 23.08) and the pen (M = 13.54 vs. 17.50) product categories (see figure 2).

56
--------------
Insert Figure 2 here
--------------
Discussion
Studies 1 and 2 find support for hypothesis 1 using both real and fictitious brands,
demonstrating that consumers judge high warmth brands to be less market dominant than
low warmth brands. We propose that this effect emerges because of the decreased
perceptions of competitiveness for a high (vs. low) warmth brand. Study 3 was designed
to explore this underlying mechanism, as well as to replicate the effect using a scale
measure of market dominance (rather than market share) as the dependent variable.
Study 3: Competitiveness as a Mediator
Study 3 builds on the findings of Studies 1 and 2 to further demonstrate the effect
of brand image warmth on perceptions of market dominance via reduced perceptions of
competitiveness. Similar to Study 1, we again used real brands in the cough syrup
category. Perceptions of market dominance were measured using a Likert-type scale
(instead of via market share estimates). We also measured competitiveness to explore the
underlying mechanism for the effect found in Studies 1 and 2.
Method
One hundred and four undergraduate students from a large American university
participated in the study in exchange for course credit. Participants were assigned to one

57
of two conditions (brand: high warmth/low warmth). The brands used in this study were
the same real cough syrup brands used in Study 1 (Triaminic and Robitussin).
In this study, rather than measure market dominance by having participants
estimate market share, participants rated the brands on the same 3-item, 7 point market
dominance scale used in the pilot study reported earlier. Following the market dominance
measure, participants rated on a 7 point scale (1 = “Strongly Disagree”, 7 = “Strongly
Agree”) the extent to which they agreed with four items of brand competitiveness: “If
<brand> got special breaks, this is likely to make things difficult for other brands in its
category,” “The more power <brand> has, the less power other brands in the category
have,” “Resources that go to <brand> are likely to take away from other brands in the
category,” and “<Brand> is very concerned with being competitive with other brands in
its category.” These items were based on Fiske et al.’s (1999) measure of
competitiveness but adapted for brands.
Results
Market dominance. The four items measuring consumers’ perceptions of the
brand were averaged into an index of market dominance (α = .96). An ANOVA on the
market dominance index revealed a significant main effect of brand in which the high
warmth brand, Triaminic, was perceived as being less dominant in the market than the
low warmth brand, Robitussin (M’s = 3.95 vs. 4.85, F(1, 102) = 10.98, p = .001).
Mediation analyses. The four competitiveness items were averaged into an index
of market competitiveness (α = .79). To assess the extent to which perception of the
brand’s market competitiveness is an underlying mechanism of our basic effect, we

58
estimated bootstrapped confidence intervals, as recommended by Preacher and Hayes
(2008), using Model 4 of the PROCESS Macro. In support of hypothesis 2, perceptions
of competitiveness mediated the impact of brand warmth on perceptions of market
dominance (95% CI of the indirect effect = -47 to -.02, see figure 3).
-------------------
Insert Figure 3 here
-----------------
Discussion
Study 3 finds support for the underlying process by which warmth has a negative
impact on perceptions of market dominance. As expected and consistent with hypothesis
2, participants judged the high warmth brand to be less competitive in the market which
led to lower market dominance perceptions. In addition to finding process evidence,
Study 3 also uses a scale measure, rather than market share, to measure perceived market
dominance. In the first three studies, participants viewed real brands in low knowledge
categories or fictitious brands. Study 4 looks at the moderating role of category
knowledge by exploring a category in which average knowledge is higher and
participants vary in their level of knowledge.
Study 4: The Role of Product Category Knowledge
The first three studies demonstrate the negative impact of brand image warmth on
perceptions of market dominance in product categories where participants had little
59
knowledge of brands’ market dominance. Study 4 was designed to investigate the role of
product category knowledge (H3) as a moderator of the effects. In this study we use a
product category (soup) in which knowledge of the category is higher among our
participant population. Additionally, in the soup category, the high warmth competitor
(Campbell’s) dominates the low warmth competitor (Progresso). Therefore, we expect
that category knowledge will have a positive impact for the high warmth brand; that is,
participants with high knowledge should draw on prior knowledge regarding Campbell’s
dominance in the category and rate it more market dominant than Progresso. We do not
expect to see a significant relationship between market dominance and category
knowledge for the low warmth brand.
Method
Sixty-seven undergraduate students at a large American university were recruited
for a study on brand perceptions in exchange for course credit. The experiment had 2
(brand: high warmth/low warmth) within subjects conditions. The order in which the
brands were presented was randomized so that approximately half the participants viewed
the high warmth brand (Campbell’s) first and the other half viewed the low warmth brand
(Progresso) first.
Participants first responded to a scale aimed to measure knowledge of market
dominance in the product category. Participants were asked to rate on a 7-point scale (1=
Strongly disagree, 7 = Strongly agree) the extent to which they agreed with five items
related to their knowledge about the brands, market share, and leader in the given
category (see appendix B for all scale items). Additionally, they were asked to write
60
down the name of the brand they believed was the market leader in the soup product
category, or write “I don’t know” if they did not know. After several unrelated filler
questions, participants rated the market dominance of Campbell’s (a high warmth brand)
and Progresso (a low warmth brand) using the same 3-item market dominance scale used
in Study 3.
Results
Manipulation checks. A separate sample of participants from the same participant
pool (N = 30) completed the same items regarding their familiarity and general
knowledge of the soup category as used in Study 1. In this case both the mean rating of
familiarity (M = 4.13) and knowledge (M = 3.70) were not significantly different than
the midpoint (|t’s| < 1.22, ns) . Additionally in the unaided recall question, participants
were able to name an average of two soup brands (M = 2.09). Furthermore, twenty-one
participants could name zero or one soup brands, while seventeen participants were able
to name three or more. This suggests that participants vary in their level of knowledge
about brands in the soup product category.
A second pretest with participants from the same participant pool (N = 47)
confirmed that as expected Campbell’s was higher in warmth than Progresso (α = .95, M
= 5.84 vs. 5.10, F(1, 45) = 4.06, p = .05).
Market dominance and category knowledge. Ten participants were removed from
the sample because they named a soap brand rather than a soup brand as the leader of the
category and thus may have answered the questions about category knowledge based on
the wrong product category. For the remaining fifty-seven participants, the three items of

61
market dominance were averaged to create an index for both Campbell’s (α = .95) and
Progresso (α = .88). Additionally, the five items of category knowledge were averaged
(α = .85) to create a measure of each participants’ knowledge about the soup category. A
repeated measures ANOVA with brand warmth as a within subjects factor and category
knowledge as a continuous predictor revealed a significant main effect of category
knowledge (F(1,55) = 10.37, p < .01). More importantly and consistent with our
prediction, there was a significant interaction of brand warmth and category knowledge
(F(1, 55) = 5.13, p < .05). The main effect of brand warmth did not reach significance
(F(1, 55) = .29, ns).
In order to analyze the significant interaction of brand warmth and category
knowledge, separate regression equations were run for both Progresso (low warmth
brand) and Campbell’s (high warmth brand). As expected category knowledge was a
significant predictor of market dominance for the high warmth brand, Campbell’s (β =
.41, t(55) = 3.79, p < .001) suggesting that those with lower knowledge relied more on
the brand’s warmth than those with higher category knowledge. Knowledge was not
significant for the low warmth brand, Progresso (β = .10, t(55) = .94, ns, see figure 4).
---------------
Insert Figure 4 here
---------------
Discussion
As expected the results suggest that participants with low knowledge about the
product category used Campbell’s warmth to make inferences about its market
62
dominance. Knowledge was a significant predictor of the high warmth brand’s market
dominance but was not significant for the low warmth brand. This provides support for
hypothesis 3: warmth is used for inferences about market dominance when category
knowledge is not available in memory. Our final study borrows from literature on top
dogs and underdogs to demonstrate the implications of the effect on product preferences.
Study 5: Impact on Consumer Preference
Our first four studies find that warmth negatively impacts perceptions of market
dominance. In our final study, we extend these findings to a choice setting. In some
purchase settings, such as when traveling abroad, consumers may have no brand
knowledge other than the brand image presented through advertisements or packaging. In
these cases, we propose that the decrease in perceptions of market dominance caused by
warmth can impact consumer preferences in self-relevant decisions. High market
dominant brands, perceived as a top dog, may be inferred to offer a superior product
(Kim et al. 2008) which could increase preference for these brands in high self-relevant
choice conditions.
Method
One hundred and twenty-six undergraduate students were recruited from a large
American university for a study on object perceptions in exchange for course credit. The
experiment was a mixed design with self-relevance (high/low) as a between subjects

63
factor and product category (orange juice/popcorn/cookies/soup) as a within subjects
factor.
Participants were randomly divided into two groups and read an introduction for
the experiment. One group was told that they were going to give their preference for
some brands that they may be asked to try later in the study (high self-relevance
condition). The second group was told that they were going to give their preference for
brands that would be used for studies the following semester (low self-relevance
condition). Participants in both groups then read that they would be viewing pictures
taken from the advertisements of two different brands in order to rate their preferences.
Participants viewed both a high warmth and low warmth picture for all four
product categories: orange juice, popcorn, cookies, and soup. The high warmth brands
featured two or more people with the product while the low warmth brands featured just
an artistic picture of the product or a single person consuming the product (see appendix
B for picture stimuli). Participants were asked to select which brand they (the
participants) would be eating on a 9-point scale (1 = Definitely Brand A to 9 = Definitely
Brand B). Brand A was the high warmth brand for all product categories; that is, a higher
response number meant decreased preference for the high warmth brand.
Results
Manipulation checks. Using the same warmth measure used for brands in prior
pretests, a separate group of participants (N = 111) from the same participant pool rated
the high warmth brand picture as communicating higher warmth than the low warmth
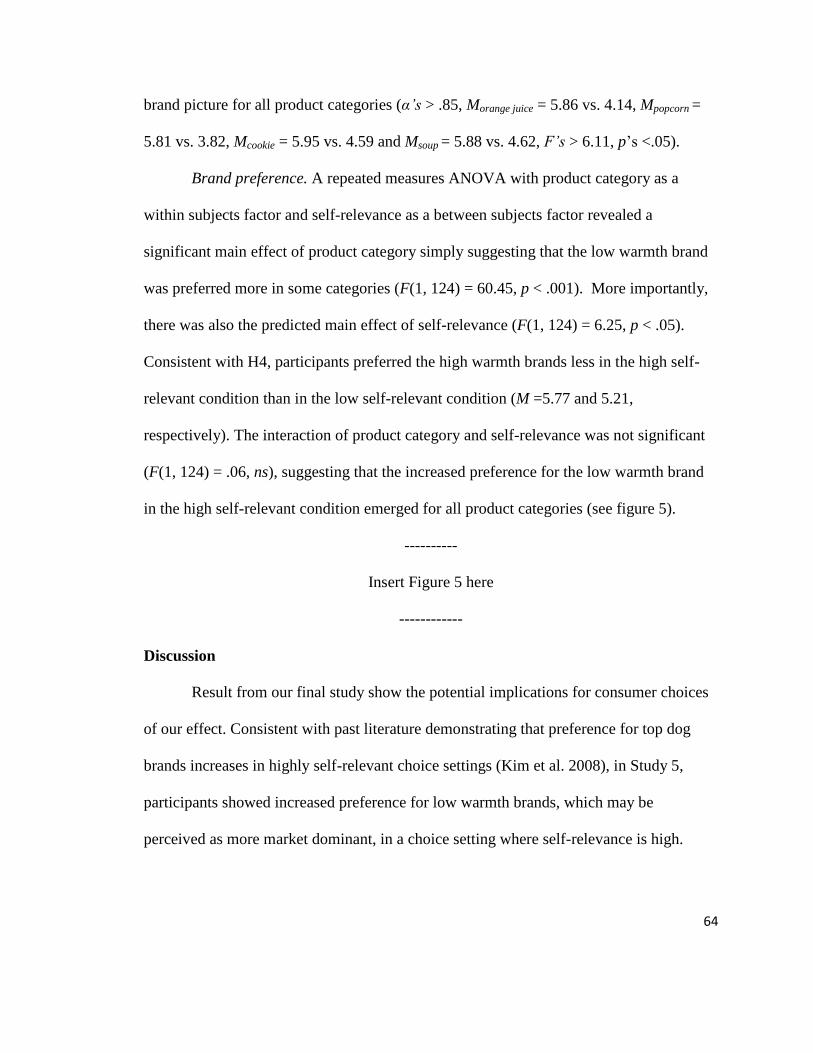
64
brand picture for all product categories (α’s > .85, Morange juice = 5.86 vs. 4.14, Mpopcorn =
5.81 vs. 3.82, Mcookie = 5.95 vs. 4.59 and Msoup = 5.88 vs. 4.62, F’s > 6.11, p’s <.05).
Brand preference. A repeated measures ANOVA with product category as a
within subjects factor and self-relevance as a between subjects factor revealed a
significant main effect of product category simply suggesting that the low warmth brand
was preferred more in some categories (F(1, 124) = 60.45, p < .001). More importantly,
there was also the predicted main effect of self-relevance (F(1, 124) = 6.25, p < .05).
Consistent with H4, participants preferred the high warmth brands less in the high self-
relevant condition than in the low self-relevant condition (M =5.77 and 5.21,
respectively). The interaction of product category and self-relevance was not significant
(F(1, 124) = .06, ns), suggesting that the increased preference for the low warmth brand
in the high self-relevant condition emerged for all product categories (see figure 5).
----------
Insert Figure 5 here
------------
Discussion
Result from our final study show the potential implications for consumer choices
of our effect. Consistent with past literature demonstrating that preference for top dog
brands increases in highly self-relevant choice settings (Kim et al. 2008), in Study 5,
participants showed increased preference for low warmth brands, which may be
perceived as more market dominant, in a choice setting where self-relevance is high.
65
General Discussion
Past research suggests that consumers draw on general knowledge to make
inferences to identify market dominant brands when they do not have specific knowledge
about the market dominance hierarchy in a category. However, this prior research offers
no suggestions as to what type of general knowledge consumers draw from in order to
make these inferences. Our research finds that consumers use the brand’s warmth as one
accessible cue used by consumers. Results from four studies, using both real and
fictitious brands in a variety of product categories (fabric softener, cough syrup, pens,
adhesive bandages, and soup) demonstrates that warmth has a negative impact on
perceptions of market dominance. This effect is driven by decreased perceptions of
competitiveness triggered by the brand’s warmth. Evidence of this mechanism emerged
in a mediation analysis using a scale measure of competitiveness (Study 3). Our findings
also demonstrate the negative impact of warmth on market dominance occurs only for
consumers with low product category knowledge (Study 4). When brand warmth is low,
category knowledge has no impact on perceptions of market dominance. Finally, in Study
5 we extended the results of our previous studies to a choice setting. Consumers had a
decreased preference for high warmth brands when a choice was high (versus low) in
self-relevance.
Theoretical Contributions
This research makes important contributions to the areas of power, market
leadership, and branding. Past research in consumer behavior has focused on how the
66
power state of the consumer can impact consumer preferences and attitudes (Rucker et al.
2012). For instance, Rucker and co-authors (2011) found that participants in a high power
state spent more money on an assortment of chocolate for themselves than on an
assortment intended for others. Our research approaches the concept of power from a
different angle. We focus on how brands can be an embodiment of power, embedded in
perceptions of market dominance, and how the perceptions of such embodiments can be
formed by existing brand imagery. Our research emphasizes that apart from experiencing
power as a psychological state, consumers can perceive of brands as being an
embodiment of power.
Our research contributes to existing literature on market dominance in both the
market leadership and top dog/underdog streams by demonstrating how warmth can
negatively impact perceptions of market dominance. Brands can be perceived as a market
dominant brand because of specific consumer knowledge of actual brand dominance or
inferences made from general knowledge (Kamins et al. 1999); however, little was
known about what general information helped or hurt perceptions of market dominance,
or more generally what type of information was used for inferences about market
dominance. Adding to this research, we find that brand images, specifically brand
warmth, is drawn from to make inferences about market competitiveness and market
dominance. This adds to a stream of literature demonstrating that brand images are used
by consumers as an accessible cue for brand inference making (Aaker and Keller 1990;
Jacoby et al. 1971).

67
This research also contributes to branding literature by demonstrating how
warmth can be incompatible with market dominance. Marketers’ attempt to imbue brands
with human-like characteristics, such as warmth, to connect with consumers’ higher-level
motivations in order to gain loyalty (Gutman 1982; Keller 2007b). However, while
warmth may have positive implications and potentially inspire awe (Aaker et al. 2012),
we demonstrate that it may also have unintended negative consequences in that it
decreases perceptions of market dominance – which have been associated with quality
perceptions.
Managerial Implications
Our findings offer actionable implications for brand managers. First, our research
emphasizes the importance of understanding not only what is compatible with certain
brand images but also what is incompatible. The incompatibility of market dominance
and warmth is not overtly obvious. It is necessary to understand the underlying
implications of this imagery (market dominance with power and warmth with a lack of
competitiveness) to comprehend how these concepts may be in opposition to one another.
Once the incongruity of warmth and market dominance is recognized, marketers should
fully evaluate how building a high warmth brand could impact their market strategy via
consumer perceptions. For instance, if a brand is competing in a category where quality
perceptions are important, a brand manager may not want to attempt to imbue its brand
with warmth because of the negative impact on perceptions of market dominance – a
concept known to be linked with quality (Hellofs and Jacobson 1999).

68
Our research has special implications for managers of high warmth brands. Given
that these brands may be seen as less market dominant, these managers may want to
embrace its position of non-dominance by communicating an underdog brand biography
(Paharia et al.2011). However, this positioning will not benefit from the quality
perceptions associated with market dominance (Hellofs and Jacobson 1999); therefore,
these brands may need to communicate quality in other ways such as in third party
endorsements.
Limitations and Future Research
While the empirical evidence supporting our hypotheses is robust, there are some
limitations which should be acknowledged. First of all, the participants used in these
studies, except for the pilot study, were American undergraduate students. We do not
expect any differences for other populations with similar category knowledge and value
concepts. However, cultural differences may exist for populations that do not see warmth
and power as inconsistent values. For instance, Torelli et al. (2014), find that in more
collectivistic (vs. individualistic) cultures, warmth is a determinant for workplace status
ascription and attainment. Because status and power are reinforcing dimensions of social
hierarchy (Fragale et al. 2011; Magee and Galinsky 2008), we may expect that a similar
pattern follows for power associations, such as market dominance. That is, in more
collectivistic (vs. individualistic) cultures, warmth may be consistent with power rather
than incongruent with it. Furthermore, additional research needs to investigate if market
dominance is consistently seen as an embodiment of power. In less capitalistic countries,
it is an empirical question as to whether dominant brands are seen as more or less

69
powerful. Exploring cultural nuances of our reported effects is a fruitful area for future
exploration.
While we used a variety of product categories and both real and fictitious brands
for our research, none of our low warmth brands were truly “cold” (i.e. brands at the very
lowest end of the warmth spectrum). It is unclear what reaction consumers would have to
a cold brand as coldness is not a trait that brands typically try to promote. It could be that
coldness does lead to higher perceptions of market dominance as suggested by our
current findings; however, consumers might not credibly believe that a cold brand has
achieved market dominance. This effect may also be category dependent as some existing
research has found that brand rejection---an action potentially seen as cold—can benefit
aspirational brands (Ward and Dahl 2014). Future research should investigate consumers’
market dominance perceptions of cold brands.
Finally, our research focused on market dominance as an embodiment of power.
We demonstrate that viewing market dominance as power can lead to novel predictions
regarding the inferences consumers make based on a brand’s warmth. However, brands
may be seen as embodying power through other means such as controlling natural,
informational, or other resources and warmth may lead to decreased perceptions of all of
these. We hope that this research is a call to other researchers to further explore and
understand how power is embodied in brands.
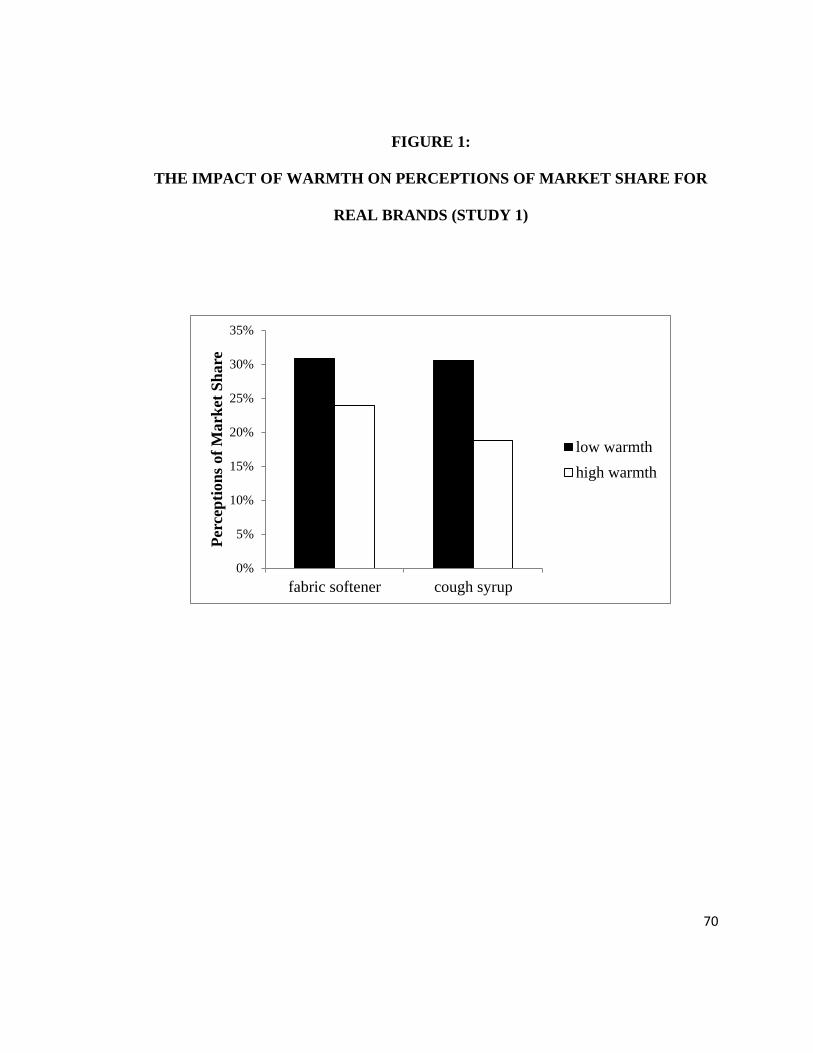
70
FIGURE 1:
THE IMPACT OF WARMTH ON PERCEPTIONS OF MARKET SHARE FOR
REAL BRANDS (STUDY 1)
0%
5%
10%
15%
20%
25%
30%
35%
fabric softener cough syrup
Per
cep
tion
s of
Mark
et S
ha
re
low warmth
high warmth

71
FIGURE 2:
THE IMPACT OF WARMTH ON PERCEPTIONS OF MARKET SHARE FOR
FICTITIOUS BRANDS (STUDY 2)
0%
5%
10%
15%
20%
25%
adhesive bandages pens
Per
cep
tion
s of
Mark
et S
hare
low warmth
high warmth

72
FIGURE 3:
MEDIATION PATH OF BRAND WARMTH ON MARKET DOMINANCE
THROUGH COMPETITIVENESS (STUDY 3)
Brand Warmth
Competitiveness
Market Dominance
-.43*
.43***
-.90**
(-.72**)

73
FIGURE 4:
THE IMPACT OF PRODUCT CATEGORY KNOWLEDGE ON PERCEPTIONS
OF MARKET DOMINANCE FOR A HIGH WARMTH VERSUS LOW
WARMTH BRAND (STUDY 4)
Endpoints are based at one SD above and below the mean for category knowledge
1
2
3
4
5
6
7
Mark
et D
om
inan
ce
Product Category Knowledge
Campbell's
Progresso

74
FIGURE 5:
THE IMPACT OF SELF RELEVANCE ON PREFERENCE FOR A HIGH
WARMTH BRAND (STUDY 5)
1
2
3
4
5
6
7
8
9
orange
juice
popcorn cookie soup
Pre
fere
nce
for
low
warm
th
bra
nd
low self relevance
high self relevance

75
Essay 3
When Bigger Isn’t Better:
How Perceptions of Market Dominance
Interact with Existing Brand Images to
Impact Brand Favorability

76
Brands regularly tout their leadership in a product category through
advertisements and even slogans (i.e. “ESPN – the worldwide leader in sports”).
Considering that market leadership seems to bring with it perceptual benefits, this is not
surprising. However, we propose that taking this positioning may be detrimental to
certain brands. Specifically, our research explores how communicating dominance of
competitors lowers positive attitudes towards high warmth brands. Warmth is commonly
used in many categories as a way to distinctively position products in the market. For
instance, Snuggle fabric softener uses a cuddly bear along with its warm name in order to
distinctively promote warmth that can differentiate its products from competitors, such as
Bounce. If Snuggle were to claim market leadership or dominance of competitors in the
category, would this message negatively impact its warmth and the favorable consumer
reactions to such image? We believe that it would.
We argue that perceptions of dominance, associated with power-related traits such
as aggression and self-assuredness, are in conflict with perceptions of warmth—kindness
and sincerity. Furthermore, we propose and find that promoting the dominance in the
marketplace of a high warmth brand dilutes its warmth and leads to unfavorable
consumer reactions. Because communicating market dominance certainly has its benefits
(Hellofs and Jacobson 1999; Kamins, Alpert, and Perner 2003), we further investigate
ways to mitigate the negative effects just described by framing market leadership in terms
of the norms that describe consumer behavior in the category.

77
Benefits of Market Dominance
One way that market dominance can be communicated is through messages about
a brand’s leadership position in the category. Because perceptions of market leadership
(even if these perceptions are not accurate) can result in positive consumer evaluations
and purchase intentions (Kamins et al. 2003), brands often adopt communication
messages that promote dominance in the hope of reaping these benefits. Consumers may
infer that a market leader must offer quality products in order to have built such a large
market share (Hellofs and Jacobson 1999). Individuals may also experience lower
perceptions of risk, positive network effects or psychological benefits from using a
popular, market dominant brand (Hellofs and Jacobson 1999; Kamins et al. 2003). When
overwhelmed by other information about the brand, consumers may use perceptions of
market leadership as a convenient cue to drive purchase intentions (Kamins et al. 2003).
These benefits explain why it is often recommended for brands that cannot claim
leadership in a large product category to define themselves in terms of a subcategory in
which leadership can be claimed (Kamins et al. 2003).
Past research seems to suggest a universal benefit from communicating market
dominance or otherwise increasing perceptions of market leadership. However, it is
unclear how communicating market dominance affects a brand’s image beyond
enhancing quality perceptions. We argue that it is important for marketers to understand
how perceptions of market dominance interact with an existing brand image in order to
predict how promoting dominance can impact consumer attitudes towards the brand.

78
While market dominance may be a signal of product quality, as suggested in past
research (Hellofs and Jacobson 1999), we propose that market dominance can also be a
signal of a brand’s power. For certain brands, this signal might have unintended
consequences.
Market Dominance as an Embodiment of Power
Power is a commonly used construct in social psychology research and more
recently has been of interest in consumer research (Galinsky, Rucker, and Magee 2015;
Rucker, Galinsky, and Dubois 2012). Past research has focused on how having or lacking
power affects consumers’ attitudes and choices. However, little is known about how
consumers respond to the embodiment of power by brands. In other words, what does it
mean to be a “powerful brand” and how do people react to such power-related brand
images? This is particularly important given how ubiquitous it is for marketers and
consumers alike to refer to brands as possessing or embodying power. For instance, a
google search for “powerful brands” returns lists of brands including Apple, McDonald’s,
Disney and Coca-Cola that are dominant in their categories (Forbes 2014).
Past research suggests that market dominance grants a brand with influence and
leadership that can be interpreted as power. A dominant brand may serve as a category
exemplar and thus dictate what attributes a competing brand must have in order to be
perceived as a member of the category (Carpenter and Nakamoto 1989; Kamins, Alpert,
and Perner 2007). Dominant brands also have power over members of the supply chain

79
due to asymmetries in buyer and seller power (Porter 1979) and such brands have been
shown to use stronger methods of influence, such as withholding payment, on channel
partners (Wilkinson and Kipnis 1978). Furthermore, recent research suggests that
consumers indeed perceive dominant brands as embodying power, as having a dominant
brand image (e.g. being big, being a leader in the market, and dominating the
competition) is positively correlated with consumers’ perceptions of brand power (Stoner
and Torelli 2015). Given that dominance and power perceptions are linked to high market
share and category leadership, we believe that these images may conflict with certain
brand images, specifically images of warmth. We turn to this issue next.
Warmth and the Conflict with Market Dominance
Warmth has been shown to not only be a common dimension of social judgments
(Fiske et al. 1999, 2002) but also one that applies to consumers’ views of companies and
brands (Aaker, Garbinsky, and Vohs 2012; Aaker, Vohs, and Mogilner 2010; Bennett and
Hill 2012). Brands may build warmth to differentiate themselves from competitors
(Aaker 1996). Furthermore, brands may simultaneously attempt to promote their
competence in order to reach the “golden quadrant”—high perceptions of both
competence and warmth—which translates to admiration for the brand and thus greater
purchase intentions (Aaker et al. 2010, 2012). Based on this, high warmth brands might
be tempted to communicate their market leadership in the hopes of heightening
perceptions of competence intuitively associated with a market leader via quality

80
perceptions (Hellofs and Jacobson 1999). However, counter to this intuition, we argue
that communicating market dominance will negatively impact consumer attitudes
towards high warmth brands. We further propose this occurs because promoting
dominance, an embodiment of power, is in conflict with the brand’s warmth.
There are several reasons to believe that images of dominance that are associated
with power are in conflict with images of warmth. First, given that brands are often seen
as embodying human traits (Aaker 1997), and in view of the fact that powerful leaders
are typically seen as associated with traits inconsistent with warmth—such as masculinity
(Koenig et al 2011) and dominance (Lord, De Vader, and Alliger 1986)—it is possible
that consumers apply these same warmth-inconsistent traits to brands that are seen as
category leaders. More directly related to our argument, research by Fragale, Overbeck,
and Neale (2011) shows that powerful people are perceived to lack warmth. Powerful
people are known to behave in ways inconsistent with what is expected from a high
warmth person, such as showing a lack of perspective taking (Galinsky et al. 2006) and
spending more money on the self than on others (Rucker, Dubois, and Galinsky 2011).
Second, promoting dominance over competitors might heighten perceptions that
the brand is competitive and motivated to fight for their marketplace position.
Competitive brands are strategic in their actions to outmaneuver rivals and gain
leadership positions (Stalk, Evans, and Shulman 1992). Promoting dominance can then
heighten perceptions of being competitive, a trait inconsistent with warmth, as people are
seen as high in warmth to the extent that they do not compete with others (Fiske et al.
1999, 2002).

81
Third, research on brands as embodying human values also supports the notion
that warmth may be in conflict with communication of market and competitor
dominance. Prior research suggests that messages that combine images associated with
incompatible values (as defined in Schwartz 1992’s model) are negatively evaluated by
consumers (Torelli et al. 2012; Torelli, Monga, and Kaikati 2012). Considering warmth
as being associated with benevolent values within the higher-order dimension of self-
transcendence, which includes items such as helpfulness, honesty, forgiveness and
responsibility, and market dominance as being associated with power and achievement
values within the higher order self-enhancement dimension, which includes items such as
success, ambition, and influence on people and events (Schwartz and Boehnke 2004),
combining these two incompatible images in a dominant message for a high warmth
brand could backfire and trigger unfavorable consumer reactions.
Based on the above arguments, we hypothesize that high warmth brands that
communicate (vs. not) their marketplace dominance will receive less favorable consumer
responses. This effect is due to the incompatibility between the power image associated
with the dominant message and the brand’s warmth, which dilutes such warmth and thus
leads to less favorable brand evaluations. Stated more formally:
H1: High warmth brands that communicate (vs. not) their market
dominance will receive less favorable evaluations from consumers.
H2: The decrease in favorable evaluations for high warmth brands
which communicate market dominance is due to dilution of the
brand’s warmth.
82
Thus, communicating market dominance has negative effects on brand attitudes
because dominance is associated with competitiveness and power. What if dominance is
asserted in a less competitive fashion? We explore this issue next and suggest that
communicating dominance as a descriptive norm that is relatively free from
competitiveness associations can offset the negative effects hypothesized earlier.
Market Dominance as Normative Behavior
While having high market share can be framed as dominance of the competition,
companies can also emphasize the power-related implication of dominance less by
communicating high market share as the norm that describes the behavior of the majority
of consumers in the category (i.e. the majority of consumers prefer this brand). Having
high market share typically means that more people are purchasing that brand, so the
descriptive norm of behavior in the category is that consumers prefer that brand over
competitors. Prior research has demonstrated that framing a message in terms of the norm
that describes people’s behavior increases its persuasiveness (Cialdini et al. 2006;
Goldstein, Cialdini, and Griskevicius 2008). For instance, guests at a hotel who saw signs
informing them that the majority of guests reused their towels were more likely to reuse
their towels than guests that were just urged to help save the environment (Goldstein et
al. 2008). Unlike communicating dominance of the competition, framing a message about
a brand’s market dominance in terms of descriptive norms should not be in conflict with
the warmth of the brand. Messages with descriptive norms are helpful—a warmth-
83
compatible trait—in informing individuals what the majority of people are doing, and
thus what is likely to be an effective response to a situation, such as which brand to buy
in a specific product category (Cialdini, Kallgren, and Reno 1991; Goldstein et al. 2008).
Therefore, we propose that high warmth brands can leverage their leadership status by
framing their market leadership as a descriptive norm. We hypothesize that, for a high
warmth brand, promoting its market leadership as the norm that describes consumer
behavior in the category will be more favorably evaluated by consumers than doing so as
dominance of the competition. Stated more formally:
H3: Communicating market leadership of a high warmth brand as a
descriptive norm will be evaluated more favorably by consumers
than communicating market leadership as dominance over the
competition.
But what if the norm for the category is for all brands are high in warmth? Would
that norm change how consumers evaluate dominant messages? We turn to this issue
next.
Moderating Impact of Product Category
We argue that communicating market dominance negatively impacts a high
warmth brand because a dominant message dilutes the brand’s warmth and consequently
results in less favorable brand attitudes. However, one implicit assumption in this
reasoning is that warmth is a distinctive attribute that drives evaluations. What if warmth
84
is not a distinctive attribute but one shared by all the brands in the category? Product
categories are often seen as attribute bundles (Hellofs and Jacobson 1999). Past research
suggests that when an attribute is shared by all brands in the category (e.g. warmth), the
normative attributes will be stored at the category level thus facilitating brand
differentiation along other dimensions (LaBoeuf and Simmons 2010). For instance in
symbolic categories such as American flags, brands which differentiated themselves by
communicating the utilitarian benefit of being inexpensive were not preferred less than
brands that communicated their symbolism of patriotism (LaBoeuf and Simmons 2010).
Extending this reasoning to our context, we would anticipate that in categories in
which warmth is a normative attribute (e.g. greeting cards), a brand’s dominant message
would have less of an impact on the warmth associated with the brand (because this
attribute is stored at the category level) and could even be perceived as a differentiating
factor. Thus, we hypothesize that the effects predicted earlier will emerge for brands in
categories in which warmth is not a normative attribute but will be attenuated for brands
in high warmth categories. Stated more formally:
H4: The extent to which warmth is a normative attribute of a product
category will moderate the effect of promoting market dominance
on consumers’ evaluations of a high warmth brand.
H4a: For categories where warmth is not a normative attribute, high
warmth brands that communicate (vs. not) their market dominance
will receive less favorable evaluations from consumers.
85
H4b: For categories where warmth is a normative attribute, the negative
impact on high warmth brands of communicating (vs. not) their
market dominance will be attenuated.
Overview of Studies
Four studies were conducted to test the hypotheses derived in this research. The
first study explores the basic prediction in hypothesis 1 and demonstrates that promoting
market dominance in an ad can be harmful for a high warmth brand. Study 2 replicates
the findings of Study 1 with brands from three different product categories while adding a
more conservative baseline condition. Furthermore, this study finds support for
hypothesis 2 by demonstrating that dilution of the brand’s warmth underlies the effect.
Study 3 explores hypothesis 3 by studying how high warmth brands can successfully
communicate a leadership position by framing the message in terms of descriptive norms.
Additionally, this study uses a real brand that has built a well-known image of warmth,
Johnson’s baby shampoo. Study 4 explores hypothesis 4 and the boundary condition of
category warmth, as well as demonstrates that the negative impact of market dominance
occurs only for high warmth brands and not for low warmth brands.
86
Study 1: The Impact of Market Dominance on a High Warmth Brand
Study 1 was designed to test the basic prediction outlined in hypothesis 1—that
promoting (vs. not) a high warmth brand with a dominant message backfires and triggers
less favorable brand evaluations. We used a fictitious soap brand as stimuli and
manipulated the warmth of the brand prior to the introduction of the message.
Method
Eighty-one undergraduate students at a large American university were recruited
for a study on brands and received course credit in exchange for their participation.
Participants were assigned to one of two conditions: market dominant advertisement or
control advertisement.
All participants viewed a description of the “Fresh” soap brand. Soap was chosen
as the target product category as it is a category in which warmth is not a normative
attribute (i.e. a warmth-neutral category including a variety of brands and in which
brands position themselves as being high in warmth or not). Each participant viewed a
description of the brand aimed at positioning it as a high warmth brand. Participants were
told that Fresh was known for being gentle and mild, was sold in children’s stores, and
had ads that featured families and children.
After viewing the description of the Fresh brand, participants were randomly
divided in two groups and presented with an ad which featured a set of hands being
lathered with soap under running water. For one group, the ad copy communicated the
brand’s dominance over the competition and its germ killing ability (dominant ad

87
condition—see appendix C for ad stimuli). For the second group, the copy simply stated
the brand’s competence in terms of germ killing ability as endorsed by a trusted third
party (control ad condition).
Following the advertisement, participants responded on a 7-point scale to four
items to measure favorable attitudes toward the Fresh brand and the ad: “How much do
you like the Fresh brand?” Not at all (1) – A lot (7), “My attitude towards Fresh
is…Unfavorable (1) – Favorable (7)”, “I think Fresh is a …Bad Brand (1) – Good Brand
(7)”, and “How much do you like the advertisement?” Not at all (1) – A lot (7).
Participants filled in demographic questions and were debriefed and dismissed.
Results
Manipulation checks. Using a separate group of participants from the same
participant pool (N = 28), we assessed the extent to which soap was perceived as being a
neutral category in terms of warmth. Participants were asked to rate on a 7-point scale (1
= Not at all, 7 = Very much) the extent to which warmth was a normative attribute
strongly associated with the soap category (3-items: “To what extent is the soap category
associated with [interpersonally warm, kind, generous]”) (Aaker et al. 2010). We
averaged participants’ response to the 3-items (α = .92) and used this average as an index
of warmth associated with the soap category. This index was not significantly different
than the midpoint of the scale, demonstrating that soap is relatively neutral in terms of its
overall associations with warmth (M = 3.95, t(27) = -.16, ns).
A second group of participants from the same participant pool (N = 11) rated the
warmth of the Fresh brand description using the same 3-items (α = .90) from the product

88
category pre-test. The Fresh brand was rated high in terms of warmth associations (M =
5.33, t(10) = 3.77, p < .01, significantly above the midpoint of the scale).
Finally, a third pretest (N = 66) was conducted to assess the extent to which the
ads worked as intended in terms of conveying (or not) dominance. Participants were
divided into two groups and presented with one of the ads used in the main study. They
rated the ad on how much it communicated dominance: 3-items (α = .89) – “To what
extent does the ad communicate being: [big, dominant of the competition, a leader in the
market]” (1 = Not at all, 7 = Very much). The pretest demonstrated that the dominant
advertisement did in fact communicate the brand’s market dominance more than the
control advertisement (M = 5.29 vs. 3.46, F(1, 64) = 31.29, p < .001). Additionally we
measured the extent to which the ads communicated the brand’s competence: 3- items (α
= .86) —“To what extent does the ad communicate being: [competent, efficient,
effective]” (1 =Not at all, 7 = Very much) (Aaker et al 2010). Results showed that the
two ads conveyed similar levels of competence (MDominant Ad = 4.98 vs. MControl Ad = 5.28,
F(1, 64) = 1.16, ns).
Brand favorability. The four items measuring consumers’ evaluations of the brand
were averaged in a single index of brand favorability (α = .90). An ANOVA on this index
with ad type as a fixed factor revealed a significant effect of ad type (F(1, 79) = 3.89, p <
.05). Participants evaluated the brand less favorably when they viewed the dominant ad
(M = 3.89) then when they viewed the control ad (M = 4.41).
89
Discussion
Study 1 finds initial support for hypothesis 1. Communicating (vs. not) market
dominance in an advertisement can negatively impact consumers’ evaluations of a high
warmth brand. We argue that this effect emerges because of the dilution of the brand’s
warmth triggered by the dominant ad. Study 2 was designed to explore this underlying
mechanism, as well as to replicate the effect using different product categories and a
more conservative baseline condition.
Study 2: The Impact of Market Dominance and the Mediating Role of Warmth
Dilution
Study 2 was designed to directly assess the extent to which dilution of the brand’s
warmth mediates the negative effect of a dominant ad on brand evaluation. This study
also included three different product categories – pens, bandages, and rice—and
compared the impact of dominant advertisements to control advertisements that present
only the brand’s logo and communicate no information via text.
Method
One hundred and seventy students from a large American university were
recruited for a study on brand perceptions and were given course credit in exchange for
their participation. Participants were randomly assigned to conditions in a 3 (product
category: bandage, pen, or rice) × 2 (ad type: market dominant ad or control ad) between
subjects design.
90
The procedure for this experiment was similar to that of the first study.
Participants viewed a description for a brand positioning it as a high warmth brand in the
pen, adhesive bandage, or rice product category (see appendix C for brand descriptions).
After reading this description participants were presented with either a dominant or a
control ad for the same brand. For this study, unlike in study 1, the control ad
communicated no information about competence and presented merely the brand logo
and an image. This was meant to establish a comparison against a baseline condition free
of information that might bias responses in favor of the control ad (see appendix C for
advertisement stimuli). Participants then completed the same favorability scale that was
used in the first study. Additionally, after they stated their favorability, participants rated
on a 7-point scale (1 = Not at all, 7 = Very much) the extent to which the brand was
associated with fifteen various traits. Embedded within these trait items were three items
intended to measure associations with warmth—interpersonally warm, kind, and
generous (Aaker et al. 2010). Finally, participants completed demographic information
and were debriefed and dismissed.
Results
Manipulation checks. Three pretests with participants from the same pool were
conducted using the same methodology as in Study 1’s pretests. A first pretest (N = 67)
assessed the extent to which the three categories were neutral in terms of normative
warmth-related attributes. As expected, participants in this pretest rated the three
categories not significantly different from the midpoint of the scale (α’s > .71, Mbandages =
4.35, Mpens = 3.48, Mrice = 3.92, |t’s| < 1.80, ns).
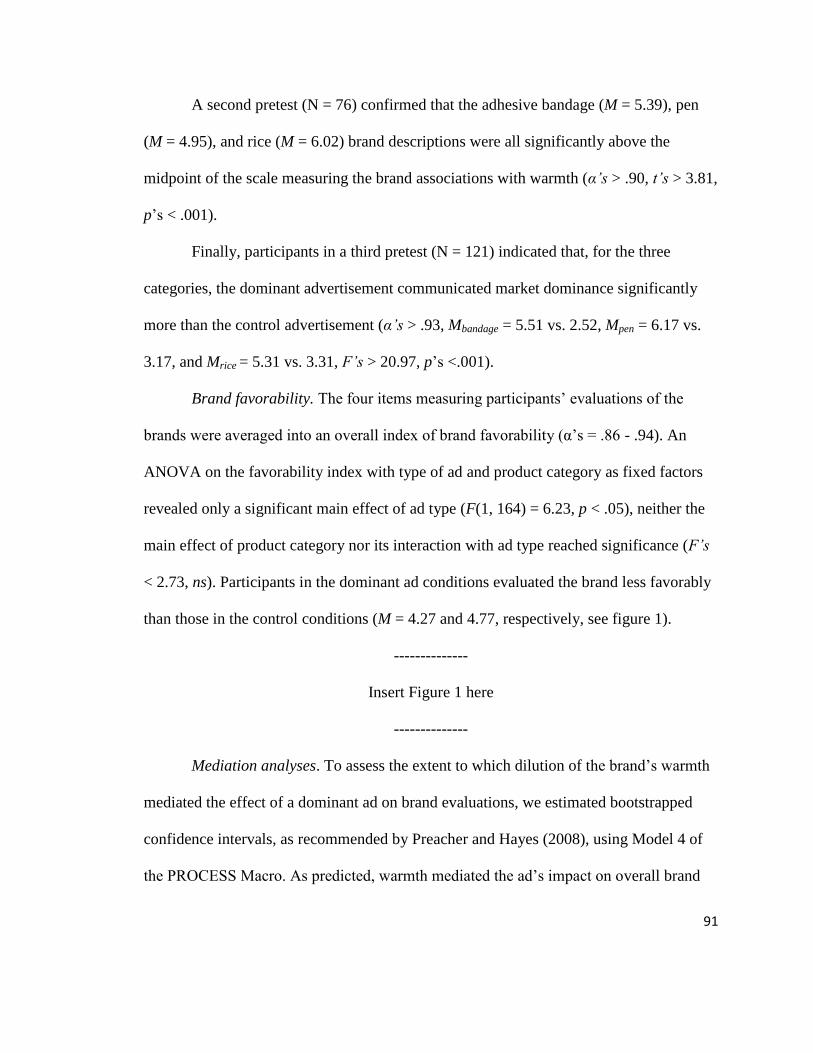
91
A second pretest (N = 76) confirmed that the adhesive bandage (M = 5.39), pen
(M = 4.95), and rice (M = 6.02) brand descriptions were all significantly above the
midpoint of the scale measuring the brand associations with warmth (α’s > .90, t’s > 3.81,
p’s < .001).
Finally, participants in a third pretest (N = 121) indicated that, for the three
categories, the dominant advertisement communicated market dominance significantly
more than the control advertisement (α’s > .93, Mbandage = 5.51 vs. 2.52, Mpen = 6.17 vs.
3.17, and Mrice = 5.31 vs. 3.31, F’s > 20.97, p’s <.001).
Brand favorability. The four items measuring participants’ evaluations of the
brands were averaged into an overall index of brand favorability (α’s = .86 - .94). An
ANOVA on the favorability index with type of ad and product category as fixed factors
revealed only a significant main effect of ad type (F(1, 164) = 6.23, p < .05), neither the
main effect of product category nor its interaction with ad type reached significance (F’s
< 2.73, ns). Participants in the dominant ad conditions evaluated the brand less favorably
than those in the control conditions (M = 4.27 and 4.77, respectively, see figure 1).
--------------
Insert Figure 1 here
--------------
Mediation analyses. To assess the extent to which dilution of the brand’s warmth
mediated the effect of a dominant ad on brand evaluations, we estimated bootstrapped
confidence intervals, as recommended by Preacher and Hayes (2008), using Model 4 of
the PROCESS Macro. As predicted, warmth mediated the ad’s impact on overall brand
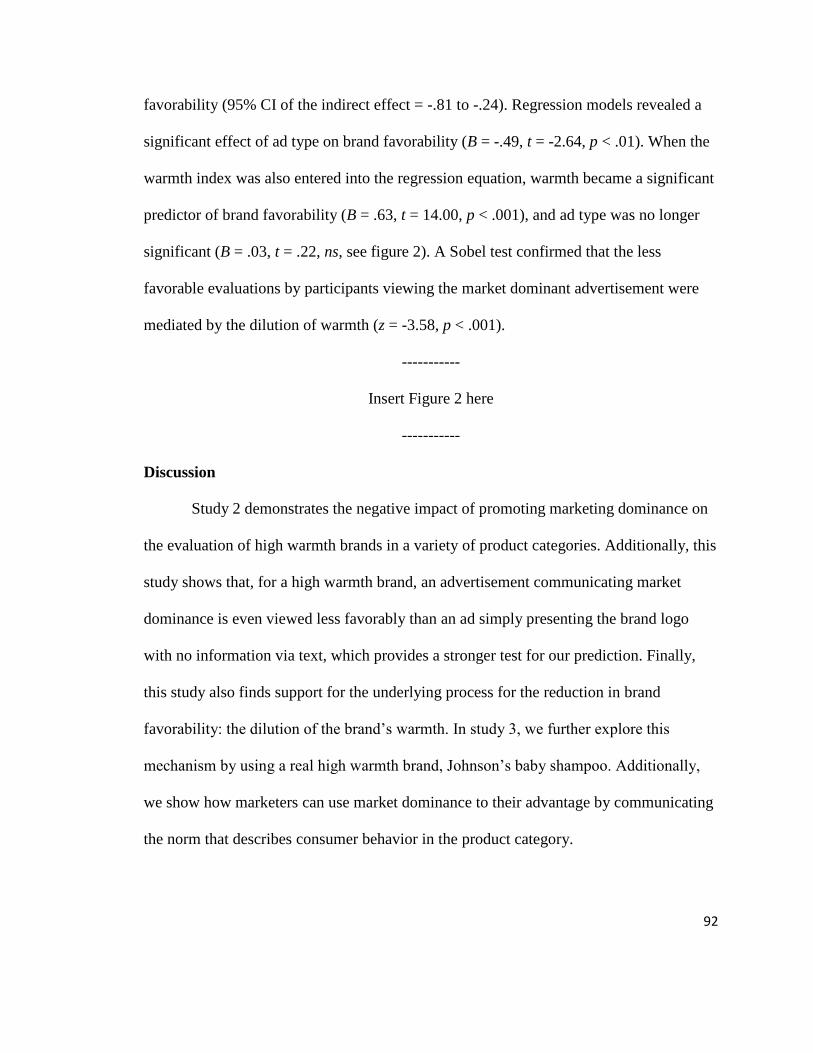
92
favorability (95% CI of the indirect effect = -.81 to -.24). Regression models revealed a
significant effect of ad type on brand favorability (B = -.49, t = -2.64, p < .01). When the
warmth index was also entered into the regression equation, warmth became a significant
predictor of brand favorability (B = .63, t = 14.00, p < .001), and ad type was no longer
significant (B = .03, t = .22, ns, see figure 2). A Sobel test confirmed that the less
favorable evaluations by participants viewing the market dominant advertisement were
mediated by the dilution of warmth (z = -3.58, p < .001).
-----------
Insert Figure 2 here
-----------
Discussion
Study 2 demonstrates the negative impact of promoting marketing dominance on
the evaluation of high warmth brands in a variety of product categories. Additionally, this
study shows that, for a high warmth brand, an advertisement communicating market
dominance is even viewed less favorably than an ad simply presenting the brand logo
with no information via text, which provides a stronger test for our prediction. Finally,
this study also finds support for the underlying process for the reduction in brand
favorability: the dilution of the brand’s warmth. In study 3, we further explore this
mechanism by using a real high warmth brand, Johnson’s baby shampoo. Additionally,
we show how marketers can use market dominance to their advantage by communicating
the norm that describes consumer behavior in the product category.
93
Study 3: The Impact of Market Dominance on a Real, High Warmth Brand
Study 3 builds on the findings of Studies 1 and 2 to further demonstrate the
negative effect of communicating market dominance on brand favorability via dilution of
the brand’s warm image. This study introduced a few changes into the design. First, we
used a real brand with a well-known high warmth image (Johnson’s) that has a leading
position in a warmth-neutral product category (baby shampoo) (John, Loken, and Joiner
1998; Kervyn, Fiske, and Malone 2012). Second, this study used a different pool of
participants, mTurk workers, to increase the generalizability of our findings to non-
student populations. Finally, Study 3 explores the prediction in hypothesis 3 about how
marketers can successfully communicate brand leadership in a category by toning down
power-related associations with dominance—via framing the message in terms of
descriptive norms about consumer purchasing behavior in the category.
Method
One hundred and fourteen participants were recruited from Amazon’s mTurk for
a study on brand perceptions and were paid a small amount of money in exchange for
their participation. Participants were randomly assigned to one of two conditions: market
dominant ad or descriptive norms ad. In both conditions participants viewed an ad for
Johnson’s baby shampoo. The ad featured the same graphics in each condition with only
the text changing. In the market dominance condition the ad read “There’s a reason
Johnson’s continues to dominate the competition with 70% of all baby shampoo sold
bearing the Johnson’s name.” In the descriptive norms condition, the ad read “there’s a

94
reason 7 out of 10 moms purchase Johnson’s baby shampoo” (see appendix C for
advertisements). Following the ad, participants responded on the same scales to measure
their attitudes toward the Johnson’s brand as used in prior studies. Participants also rated
the extent to which the branded product was associated with warmth and warmth-related
feelings (3-items: “Johnson’s baby shampoo is a mild product” [1 = Strongly Disagree, 7
= Strongly Agree], “Johnson’s baby shampoo is good for delicate skin and hair” [1 =
Strongly Disagree, 7 = Strongly Agree], “My feelings towards Johnson’s are” [1 = Cold,
7 = Warm]). Participants then completed several demographic measures and were
thanked for their participation.
Results
Manipulation checks. Three pretests were conducted following the same
procedures used in past studies. Participants in a first pretest (N = 28) rated the children’s
shampoo category as being relatively neutral in terms of normative attributes of warmth
(α = .89, M = 4.36, not significantly different than the midpoint of the scale, t(27) = 1.36,
ns).
A second group of participants (N = 24) rated the Johnson’s brand above the
midpoint of the warmth scale (α = .97, M = 5.82, t(23) = 9.02, p < .001), confirming that
Johnson’s is a brand that is perceived as being high in warmth.
A third set of participants (N = 44) also rated the ad in the dominant condition as
communicating the brand’s market dominance more than the ad in the descriptive norms
condition (α = .78, M’s = 6.32 vs. 5.23, F(1, 42) = 16.29, p < .001).

95
Brand favorability. The four items measuring participants’ evaluation of the
Johnson’s brand were averaged into a single index of brand favorability (α = .94). An
ANOVA on this index with the type of ad as a fixed factor revealed a significant effect of
ad type (F(1, 71) = 4.68, p < .05). Consistent with hypothesis 3, participants viewing the
market dominant ad evaluated the Johnson’s brand less favorably (M = 5.00) than those
viewing the descriptive norms ad (M = 5.66).
Brand warmth. The three items used to measure warmth were averaged into an
overall index of warmth (α = .88). An ANOVA on this index with ad type as a fixed
factor revealed a significant effect of ad type (F(1, 71) = 3.65, p < .05, one-tailed).
Participants in the dominant ad condition rated Johnson’s as being less warm (M = 5.33)
than participants in the descriptive norms ad condition (M = 5.90).
Mediation analyses. To assess the extent to which dilution of the brand’s warmth
mediated the effect of a dominant ad on brand evaluations, we estimated bootstrapped
confidence intervals, as recommended by Preacher and Hayes (2008), using Model 4 of
the PROCESS Macro. As predicted, the warmth index mediated the impact of the
dominant ad on overall brand favorability (95% CI of the indirect effect = .01 to 1.06).
The mediation model showed that the impact of the dominant ad on brand evaluation,
which was initially significant (B = -.66, t = -2.16, p < .05) became non-significant when
warmth was added into the model (B = -.14, t = -.98, ns). A Sobel test confirmed that the
negative impact of the market dominant ad on brand favorability was mediated by
dilution of the brand’s warmth (z = - 1.90, p = .05).

96
Discussion
Study 3 expands our findings to a real brand context and demonstrates how
managers for high warmth brands can successfully leverage their market leadership by
framing a message in terms of the norms that describe the consumer behavior in the
product category. In addition, this study provides further evidence for our proposed
mechanism. A dominant ad negatively impacts brand evaluation via dilution of the
brand’s warmth. In Study 4, we find further evidence for the benefits of framing market
dominance as a descriptive buying norm using fictitious brands. Additionally, we explore
a potential boundary condition of this effect—product categories in which warmth is a
normative attribute.
Study 4: The Moderating Role of Product Category
The past three studies have demonstrated how communicating dominance hurts
consumers’ evaluations of a high warmth brand and that this effect is driven by dilution
of the brand’s warmth. These effects emerged using both fictitious as well as real brands.
In addition, our findings also demonstrate that toning down power-related associations
via framing leadership as the norms that describe purchasing behavior in the category
offsets the effects. Study 4 was designed to investigate the role of product category
(hypothesis 4) as another moderator of the effects. Accordingly, this study focused on the
same high warmth brand from the soap category (Study 1), for which warmth is not a
normative attribute (warmth-neutral category). In addition, we added conditions for a

97
high warmth brand from the greeting cards category—where warmth is a normative
attribute (high warmth category). As in Study 3, participants were presented with
advertisements that either promoted dominance or were framed in terms of descriptive
norms. In addition, this study added a baseline condition of a low warmth brand in the
neutral category to show the specificity of the effects to high warmth brands only. Notice
that a low warmth brand in the high warmth category would be an atypical exemplar that
wouldn’t credibly promote market leadership. For this reason, we did not include in the
design such condition.
Method
One hundred and twenty-one undergraduate students at a large American
university were recruited for a study on brand perceptions in exchange for course credit.
The experiment was a 3 (brand descriptions: high warmth brand in warmth-neutral
category, high warmth brand in high warmth category, or low warmth brand in warmth-
neutral category) × 2 (type of ad: market dominant ad or descriptive norms ad) between
subjects design in which participants were randomly assigned to the conditions.
Participants were first divided in three groups and presented with a brand
description aimed at positioning the brand as intended according to condition (see
appendix C for the three brand descriptions used in this study). After this, they were
further divided in two groups and shown either the dominant ad or the descriptive norms
ad for the corresponding brand (see appendix C for the ad stimuli). After viewing the
advertisement, participants evaluated the brand on the same measures used in the prior

98
studies. Finally, they completed several demographic measures and were debriefed and
dismissed.
Results
Manipulation checks. Using the same procedures from past studies, a separate
group of participants (N = 28) from the same participant pool rated the greeting card
category significantly above the midpoint of the warmth scale (α = .90, M = 4.96, t(27) =
3.64, p = .001), showing that warmth is a normative attribute for the greeting card
category.
A second pretest using another group of participants similar to those in the main
study (N = 47) rated the warmth of the brand descriptions using the same measures as in
prior pretests. An ANOVA on the mean warmth index (α = .95) with the three brand
descriptions as a fixed factor revealed a main effect of brand description (F(2, 44) = 6.69,
p < .01). Simple contrasts revealed that the low warmth soap brand description (M =
3.70) was lower in warmth than both the high warmth soap brand (M = 5.33, F(2, 44) =
6.28, p < .01) and the high warmth greeting card brand (M = 5.29, F(2, 44) = 8.11, p =
.001). There was no significant difference in warmth between the two high warmth brand
descriptions of soap and greeting card (F(2, 44) = .07, ns). Additionally, this pretest also
assessed associations with competence (same items as Study 1’s pretest, α = .84),
showing that the brand descriptions were not significantly different in their associations
with competence (Mwarm soap = 5.06, Mnon-warm soap = 5.07, Mgreeting card = 4.68, F(2, 44) =
.67, ns).

99
In a third pretest using another group of participants (N = 122), the ads were
tested to ensure that the dominant advertisements communicated the brand’s market
dominance more than the descriptive norms advertisement. Using the same measures as
in the previous studies (α’s > .89), this pretest demonstrated that the dominant
advertisements did in fact communicate the brand’s market dominance more than the
descriptive norms advertisement for both soap (M = 5.36 vs. 4.49, F(1, 45) = 4.64, p <
.05) and greeting card (M = 5.22 vs. 4.57, F(1, 73) = 4.58, p < .05).
Brand favorability. The four items measuring participants’ brand evaluation were
averaged into an overall index of brand favorability (α = .90). As expected, an ANOVA
on this index with the brand description and the type of ad as a fixed factors revealed a
significant brand description × type of ad interaction, (F(2, 115) = 3.10, p < .05). There
was also a significant main effect of type of brand (F(2, 115) = 8.04, p = .001), driven by
the less favorable evaluations of the high warmth greeting card brand. The main effect of
ad type was not significant (F(1, 115) = .13, ns). Planned contrasts revealed that, as
predicted in hypothesis 4, the dominant (vs. descriptive norms) ad triggered less
favorable brand evaluations for the high warmth brand in the warmth-neutral category (M
= 4.37 and 5.01 respectively, F(2, 115) = 2.72, p < .05, one-tailed). In contrast, there was
no difference in evaluations of the high warmth brand in the high warmth category
(MDominant ad = 3.93 and MDescriptive norms ad = 3.46, F(2, 115) = 1.65, ns). In addition, there
were no significant differences between the dominant and descriptive norms ads for the
low warmth brand in the warmth-neutral soap category (M = 4.51 and 4.11 respectively,
F(2, 115) = 1.37 , ns, see figure 3).

100
--------------
Insert Figure 3 here
-------------
Discussion
Study 4 demonstrates that the extent to which warmth is a normative attribute for
brands in a product category moderates the effects uncovered in the past studies.
Participants evaluated less favorably a high warmth soap brand (warmth-neutral
category) when the brand was promoted with a dominant ad than when the ad conveyed
the buying norm for the category. However, this effect disappeared for the high warmth
greeting card that belonged to a category in which warmth is a normative attribute (high
warmth category). In addition, this study demonstrated the specificity of the effects to
high warmth brands, as a dominant ad had no negative effects on evaluations of the low
warmth soap brand.
General Discussion
Past research has suggested that communicating dominance over competitors can
be beneficial to a brand (Hellofs and Jacobson 1999; Kamins et al. 2003). However, our
research finds that certain brands might not benefit from communicating market
dominance. Results from four studies, using both real and fictitious brands in a variety of
product categories (hand soap, rice, adhesive bandages, pens, and baby shampoo)
demonstrate that communicating dominance over the competition can be harmful to high

101
warmth brands. This effect is driven by dilution of the brand’s warmth triggered by the
power meanings in a dominant message. Evidence for the underlying mechanism
emerged in mediation analyses using measures of warmth (Studies 2 and 3). Additional
evidence was provided by demonstrating that toning down power-related meanings in a
dominant message—via framing the message in terms of the norms that describe the
behavior of consumers in the category—attenuates the effects (Studies 3 and 4). Finally,
our findings demonstrate that the dilution effects triggered by a dominant message only
emerge for high warmth brands from categories in which warmth is not a normative
attribute (i.e., warmth-neutral categories). When this is not the case, and warmth is a
normative attribute stored at the category level (i.e., high warmth categories), high
warmth brands can communicate their market dominance without fearing negative
consumer responses.
Theoretical Contributions
This research makes important contributions to consumer behavior theories of
power, branding, and persuasion. In the consumer domain, past research in power has
mainly focused on how experiencing power (having it or lacking it) guides and shapes
consumers’ attitudes and product preferences (Rucker et al. 2012). For instance, having
power leads to a preference for products that offer utility (e.g., performance or quality) to
the consumer, whereas lacking power leads to a preference for luxury products that signal
status to others (Rucker and Galinsky 2009). Thus past research emphasizes how feelings
of power can shift the balance between preferences for utilitarian product attributes
versus the product’s status affordances. Taking a different approach, our research focuses
102
on how branded products can be imbued with power meanings (embedded in a
communication message about market dominance) and how such power meanings can
interact with existing brand meanings to shape consumer attitudes. Thus our research
emphasizes that, apart from psychologically experiencing power, consumers can interpret
brand messages in terms of power affordances, and integrate such information with their
prior brand knowledge for evaluating the brand. In other words, because power is such a
ubiquitous social construct, it is not only a psychological state experienced by consumers,
but power can also be present in brand-related messages and shape consumers’ brand
attitudes.
Although marketers and consumers alike, commonly refer to brands as possessing
power, surprisingly little research has been devoted to systematically investigate how
power is embodied by brands. Past research has mainly focused on status as a source of
power, and hence argued that products and brands that can signal a high-status (e.g.,
luxury products) can provide a sense of power (Rucker and Galinsky 2008), as well as
embody power values (Torelli and Shavitt 2010). However, our research demonstrates
that non-luxury products can also be imbued with power—by means of promoting their
market dominance. Thus, our research highlights the importance of considering
consumers’ views about a brand’s dominance in the market as a key factor for
understanding the embodiment of power by brands.
Our research also contributes to the branding literature by showing how images of
market dominance, associated with power, can be incompatible with a brand’s warmth. In
the hyper-competitive markets of the 21st century, firms are building more complex

103
brands that not only stand for a collection of desirable attributes/benefits but that also
include personality traits (e.g., caring), emotions (e.g., warmth), and values (e.g.,
benevolence). Marketers imbue brands with these human characteristics to connect with
consumers’ high-level motivations in order to gain their attention and loyalty (Gutman
1982; Keller 2007b). Building more complex brands that symbolize multiple traits and
values (e.g., excitement and power) allows firms to connect with different segments of
consumers and provides multiple bases for differentiation. However, this added
complexity also raises the risk that incompatible elements will be incorporated into the
brand, which can evoke negative responses from consumers (Torelli et al.2012). For
instance, consumers evaluate negatively a luxury brand (that symbolizes self-
enhancement values of status and power) that promotes its socially responsible actions
(associated with self-transcendence values of social concerns) due to the incompatibility
between the brand’s high-status image and the prosocial meanings of its actions (Torelli
et al. 2012). Adding to this stream of research, findings here demonstrate that consumers
evaluate negatively a high warmth brand that promotes its dominance in the market due
to the incompatibility between the brand’s warmth and the power connotations of the
dominant message.
Our research also contributes to consumer theories about the persuasiveness of
different message appeals. Past research highlighting the benefits from promoting market
dominance, in terms of heightened quality perceptions and lowered risk perceptions,
suggests that brands should define their markets in a way that allows them to
communicate a dominant market position (Kamins et al. 2003). However, our research

104
demonstrates that such communication approach can also convey images of power, which
might interact with the existing brand image and affect the persuasiveness of the
message. Specifically, communicating dominance backfires for a high warmth brand. Our
research shows how the power meanings in a dominant message can be toned down and
its negative consequences for high warmth brands attenuated, by framing the message in
terms of the norms that describe consumer behavior in the category. These findings add
to the growing literature that demonstrates how social norms can be successfully
leveraged by marketers for developing persuasive message appeals (Cialdini et al. 2006;
Goldstein et al. 2008).
Managerial Implications
This research offers actionable implications for brand managers. First, our
research demonstrates the importance of understanding that messages of market
dominance not only might impact perceptions of quality and risk (Hellofs and Jacobson
1999) but also convey power meanings. Furthermore, these power meanings can interact
with the brand’s existing image and affect consumers’ responses. Specifically, marketers
of high warmth brands should be very careful when communicating market dominance.
They should avoid doing so via power-related claims of dominance over the competition
and instead frame the message in terms of how normative it is for consumers to buy the
brand. However, this would be more of a concern for managers of brands competing in
warmth-neutral categories, in which communicating market dominance hurts a high
warmth brand. Managers of high warmth brands competing in high warmth categories
have more freedom to communicate their market dominance without risking a consumer
105
backlash. Similarly, managers of low warmth brands (e.g., ESPN) should not be
concerned with publicly asserting their dominance in the marketplace (e.g. “ESPN – the
worldwide leader in sports”).
Our findings have special implications for managers of leading brands that have
successfully built a high warmth image (e.g., Johnson’s brand). While communicating the
brand’s market dominance may be beneficial in messages catering to investors,
stockholders, and top executives, openly advertising to consumers dominance over the
competition might backfire. In this context, managers should be very careful in
coordinating public relation releases and marketing campaigns that communicate
dominance. All of these messages should be framed in a way that tones down power
associations in order to avoid unintended dilution of the brand’s warmth.
Limitations and Future Research
Although the empirical evidence for our hypotheses is robust, there are some
limitations that should be acknowledged. We used brands from a variety of product
categories (hand soap, rice, adhesive bandages, pens, and baby shampoo) to illustrate the
negative effects of a dominant message by a high warmth brand. We chose these products
to be relatively neutral in terms of the extent to which warmth is a normative attribute for
brands in the category. This facilitated finding, or credibly manipulating, brands with a
high warmth image, as well as demonstrating that the effects only emerge for these types
of warmth-neutral categories and not for those in which warmth is a normative attribute
(e.g., greeting cards). Thus, we did not explore product categories for which warmth is
more of an atypical attribute for brands in the category (i.e., categories at the lower end

106
of the warmth scale). It is a bit unclear what reaction consumers would have to high
warmth brands that communicate their market dominance in this type of category.
Because warmth is an atypical attribute in this type of category, it might be difficult to
credibly and successfully position a brand as being high on warmth. Consider for instance
the gun category. This is a category in which warmth is probably a very atypical brand
attribute, as well as one in which power and dominance are likely to be typical ones.
Although most brands in this category likely position themselves in terms of power and
dominance (i.e., points of parity), one can still find brands that promote the brand’s
warmth. Crickett rifles sells guns for youth shooters under the slogan “My first rifle” and
using a child-friendly cricket character (Crickett 2010). To what extent can the Crickett
brand develop a high warmth positioning? How would consumers react to a dominant
message that, although inconsistent with the high warmth image, might be consistent with
the category image? Future research should investigate consumers’ responses to
dominant messages by high warmth brands from categories in which warmth is very
atypical.
Our studies focused on market dominance communicated through advertising
messages. However, consumers may learn of a brand’s market dominance through other
sources, such as newspaper articles or public relation releases. Would this change how
people view the brand-related message? It seems reasonable to expect that reading such
messages would still be in conflict with a brand’s warmth and lead to the same negative
consumer reactions uncovered in our research. However, the third party reporting of the
dominance may prompt consumers to separate this message from the existing brand
107
image and attenuate the negative reactions. Future research should explore how the
channel of communication of the brand’s market dominance can impact consumers’
brand evaluations.
Finally, our research focused solely on market dominance as a source of power in
brands. We demonstrate that a view of market dominance as power can lead to novel
predictions about the effectiveness of different types of message appeals. However, there
can be other sources of power, as brands can also control natural, informational, or other
types of resources. Our research opens the door for a broader understanding of the
embodiment of power in brands that goes well beyond notions of power as status. We
hope that our research is a stepping stone in this direction.

108
FIGURE 1
BRAND FAVORABILITY AS A FUNCTION OF PRODUCT CATEGORY AND
TYPE OF AD (STUDY 2)
1
2
3
4
5
6
7
bandage pen rice
Favora
bil
ity
control ad
dominant ad

109
FIGURE 2:
MEDIATION PATH OF MARKET DOMINANCE ON BRAND FAVORABILITY
THROUGH WARMTH (STUDY 2)
Market Dominance
Warmth
Brand Favorability
-.82***
.63***
-.49**
(.03)

110
FIGURE 3:
BRAND FAVORABILITY AS A FUNCTION OF BRAND DESCRIPTION AND
TYPE OF AD (STUDY 4)
1
2
3
4
5
6
7
soap (high
warmth)
soap (low
warmth)
greeting card
Favora
bil
ity
descriptive norm ad
dominant ad
111
SUMMARY AND FUTURE DIRECTIONS
Prior research has examined various psychological constructs as applied to
brands, but one of the most pervasive constructs in psychological literature has been
somewhat ignored—power. My dissertation examined how consumers perceive brands as
embodying power. What exactly is a “powerful brand”? How are perceptions regarding
the embodiment of power in a brand formed? How do existing brand images interact with
marketing messages that communicate a brand’s embodiment of power? Three essays
investigated the overall brand power construct as well as further exploring the dimension
of market dominance.
In the first essay, I outlined the four distinct dimensions by which consumers
perceive of brands as embodying power: control of essential resources, control of
information resources, associations with status, and market dominance. These four
dimensions are correlated with an overall perception of brand power but are distinct
factors. Additionally, I developed and validated a scale to measure these distinct
dimensions of brand power. Finally, I discovered that the dimension of market
dominance is closely related to the constructs of popularity and high levels of sales but
distinct from bullying consumers and channel partners, having a dominant personality, or
being seen as a trendsetting or category icon.
Essay 2 examined how warmth impacts consumers’ perceptions of a brand’s
market dominance. Across four studies, I found that warmth negatively impacted
perceptions of market dominance for both real and fictitious brands in a variety of
112
product categories. High warmth (low warmth) brands were perceived as being less
(more) competitive in the market which led to perceptions of lower (higher) market
dominance. Furthermore, because brand images are used as a cue for market dominance
perceptions when inferences are made, this effect was attenuated for consumers with high
category knowledge who draw market dominance information directly from memory
rather than relying on inferences. Finally, I demonstrated how these findings impacted
consumer choice, by demonstrating that in a high (low) self-relevant choice situation
preference for high warmth brands increased (decreased). Taken together, these findings
revealed how consumers form perceptions of market dominance and how warmth
negatively impacts these perceptions.
In the experiments of Essay 3, I examined the negative consequences of
communicating an embodiment of power through messages of market dominance. Across
several product categories, consumers had less favorable reactions to high warmth brands
advertising market dominance when compared to those advertising non-dominant
messages. This decrease in favorability was due to a dilution of the brand’s warmth.
Furthermore, I demonstrated how marketers can communicate market dominance without
this decrease in favorability by framing market dominance as a descriptive norm.
Additionally, I found that for brands in categories where warmth is a normative attribute
(such as the greeting card category) the negative impact of communicating market
dominance was attenuated.
In conclusion, thirteen studies in three essays revealed how consumers perceive of
embodiments of power in brands, develop perceptions of market dominance based on

113
warmth, and react negatively to high warmth brands that communicate market
dominance. In the next sections, I discuss both the theoretical and managerial
contributions of these findings as well as suggest potential avenues of future research.
Theoretical Contributions
One contribution of my research to existing branding literature is the introduction
of the construct of brand power. This dissertation is the first to explore in detail how
consumers perceive of brands as embodiments of power. My research, in contrast to past
marketing research which studies power as a psychological state experienced by the
consumer, suggests that power can be embodied and communicated by brands. I
specifically outline four dimensions by which brands embody power and develop a scale
measure that can be used in future research to measure each of the dimensions of brand
power.
My research also contributes to existing literature on brand image by showing
how warmth can be incompatible with perceptions and communication of market
dominance, one of the dimensions of brand power. Both perceptions of market
dominance and perceptions of warmth have been demonstrated to have positive
associations for consumers (Aaker, Garbinsky, and Vohs 2012; Hellofs and Jacobson
1999); however, I find that due to the conflict between these two dimensions, attempting
to combine these can lead to decreased favorable reactions by consumers. In this way, my
research contributes to the existing literature demonstrating that brands which attempt to
combine discordant imagery may evoke negative reactions from consumers (Torelli,
Monga, and Kaikati 2012). Furthermore, I contribute to literature on consumers’ use of
114
brand images as cues for inference making (Aaker and Keller 1990; Jacoby, Olson, and
Haddock 1971) by demonstrating how brand image can impact perceptions of market
dominance.
Additionally, my research contributes to the limited consumer behavior literature
on consumers’ reactions and perceptions of a brand’s market dominance. Not only do I
find that market dominance is an embodiment of power, I also am the first to theorize and
find evidence that market dominance and warmth are inconsistent brand traits. While
prior research has shown that consumers make inferences in order to determine the leader
in a product category (Kamins, Alpert, and Perner 2007), my research sheds light on one
of the cues used to make these inferences, warmth. Furthermore, while past research on
market dominance has suggested universally positive consequences of communicating
market dominance (Hellofs and Jacobson 1999), I find that for some brands – those high
in warmth—communicating market dominance may have a negative impact on consumer
perceptions.
Managerial Implications
My research offers actionable suggestions for brand managers. It is not
uncommon for a brand to communicate its dominance in a product category or its
warmth. However, my research suggests that brand managers should carefully weigh the
benefits and costs of each strategy rather than trying to combine the two. Managers need
to consider that a marketing dominant message might not only bring with it increased
perceptions of quality (Kamins, Alpert, and Perner 2003) but also an embodiment of
power. Marketers should approach communications of market dominance with caution,

115
particularly so for high warmth brands, and realize that how they communicate a
leadership position in a product category can impact consumer attitudes.
My findings are especially relevant to managers of high warmth brands.
Communicating a position of market dominance may be beneficial while addressing
certain stakeholders such as financial investors or employees. However, high warmth
brands may face unexpected difficulties in building these perceptions in consumers’
minds as my research shows that high warmth brands may be inferred to be less
competitive and market dominant. Additionally, directly communicating market
dominance may receive negative reactions from consumers and dilute the brand’s
warmth. Managers of high warmth brands will want to carefully design public relation
releases and marketing messages of market dominance in order to tone down power
associations. While highly coordinated branded messaging may have its benefits,
managers of market dominant, high warmth brands should considering carefully crafting
different messages depending on the values of the audience (e.g. employees and investors
may value market dominance over warmth while customers may value warmth over
market dominance).
Limitations and Future Directions
All thirteen of the experiments in my dissertation were conducted with
participants from the United States. This may have an impact not only on the relationship
between the various dimensions of power but also on the congruity of warmth and market
dominance. For instance, Essay 1 demonstrated that the power dimension related to
control of essential resources, while consistently correlated with naïve associations of

116
power, was the least inter-correlated of the four dimensions. This low correlation may be
related to the fact that utility companies, those with the greatest control of essential
resources, are highly regulated and generally offer consistent quality in the United States.
In developing countries, where electricity and clean water may offer less consistent
quality and may be less regulated, the essential resources dimension may be more highly
correlated with the general measure of brand power. Furthermore, in cultures in which
self-transcendence (rather than self-enhancement) is more highly valued, the incongruity
between dominance and warmth seen with American participants, may be attenuated.
Further research should attempt to replicate the results of this dissertation with other
cultural groups.
While this research used both high warmth and low warmth brands, the low
warmth brands used in the experiments were warmth neutral. We did not investigate
consumer responses to “cold” brands—those at the very opposite end of the warmth
spectrum. It is unclear what reaction consumers would have to cold brands. On one hand,
dominance/power and coldness seem to be congruent and may receive favorable
reactions from consumers. On the other hand, coldness seems to be an atypical trait for
brands: few brands plan to build a brand that is seen as interpersonally cold, unkind, and
ungenerous. Therefore, it may not be believable that a cold brand is also market
dominant. Furthermore, a brand that is seen as cold and dominant may be disliked as it
could be seen as a dictator in its category.
Finally, Essays 2 and 3 of this dissertation chose to focus on the dimension of
market dominance. I expect that the findings of these essays would replicate if any other
117
dimension of power were substituted for market dominance. For instance, I would expect
that high warmth brands would also be perceived as having fewer associations with status
and less control of information and essential resources. Communicating a high level of
any of these dimensions would be also incongruent with warmth and reduce favorable
consumer reactions. However, this is an empirical question, and future research should
aim to explore the similarities and differences between the various dimensions of brand
power. I hope that this research serves as a starting point to further explore the construct
of brand power in the marketing literature.

118
BIBLIOGRAPHY
Aaker, David A. (1996), "Measuring Brand Equity across Products and Markets,
California Management Review, 38(3), 102-20.
Aaker, David A. and Kevin Lane Keller (1991), “Consumer Evaluations of Brand
Extensions,” Journal of Marketing, 54(1), 27-41.
Aaker, Jennifer L (1997), "Dimensions of Brand Personality," Journal of Marketing
Research, 34(Aug), 347-56.
Aaker, Jennifer L. (1999), “The Malleable Self: The Role of Self-Expression in
Persuasion,” Journal of Marketing Research, 36(February), 45-57.
Aaker, Jennifer L., Emily N. Garbinsky, and Kathleen D. Vohs (2012), “Cultivating
Admiration in Brands: Warmth, Competence, and Landing in the ‘Golden
Quadrant’,” Journal of Consumer Psychology, 22, 191-94.
Aaker, Jennifer, Kathleen D. Vohs, and Cassie Mogilner (2010), “Nonprofits Are Seen as
Warm and For-Profits as Competent: Firm Stereotypes Matter,” Journal of
Consumer Research, 37, 224-37.
Ahluwalia, Rohini, and Andrew M. Kaikati (2010), "Traveling the Paths to Brand
Loyalty," Barbara Loken, Rohini Ahluwalia, and Michael J. Houston, eds. Brands
and Brand Management: Contemporary Research Perspectives. Routledge: New
York, 91-106.
Allen, Michael W., Richa Gupta, and Arnaud Monnier (2008), "The Interactive Effect of
Cultural Symbols and Human Values on Taste Evaluation," Journal of Consumer
Research, 35(2), 294-308.
Anderson, Cameron, and Gavin J. Kilduff (2009), "The Pursuit of Status in Social
Groups," Current Directions in Psychological Science, 18(5), 295-8.
Archer, John (2006), "Testosterone and Human Aggression: An Evaluation of the
Challenge Hypothesis," Neuroscience and Biobehavioral Reviews, 30(3), 319-45.
Bennett, Aronté Marie and Ronald Paul Hill (2012), “The Universality of Warmth and
Competence: A Response to Brands as Intentional Agents,” Journal of Consumer
Psychology, 22, 199-204.
Carpenter, Gregory S., and Kent Nakamoto (1989), “Consumer Preference Formation and
Pioneering Advantage,” Journal of Marketing Research, 26(3), 285-98.
Cialdini, Robert B., Linda J. Demaine, Brad J. Sagarin, Daniel W. Barrett, Kelton
Rhoads, and Patricia L. Winter (2006), "Managing Social Norms for Persuasive
Impact," Social Influence, 1(1), 3-15.
Cialdini, Robert B., Carl A. Kallgren, and Raymond R. Reno (1991), "A Focus Theory of
Normative Conduct: A Theoretical Refinement and Reevaluation of the Role of
Norms in Human Behavior," in Advances in Experimental SocialPsychology, Vol.
24, ed. Leonard Berkowitz, San Diego: Academic Press, 201-34.
Crickett Firearms: My First Rifle (2010), Retrieved May 30, 2016 from <crickett.com>.
Dill, Kathryn (2015), “Lego Tops Global Ranking of the Most Powerful Brands in 2015,”
Forbes, Retrieved February 11, 2015 from
<http://www.forbes.com/sites/kathryndill/2015/02/19/lego-tops-global-ranking-
of-the-most-powerful-brands-in-2015/#4795bbd057f5>.

119
Fiske, Susan T., Amy J. C. Cuddy, Peter Glick, and Jun Xu (2002), “A Model of (Often
Mixed) Stereotype Content: Competence and Warmth Respectively Follow From
Perceived Status and Competition,” Journal of Personality and Social
Psychology, 82(6), 878-902.
Fiske, Susan T., Jun Xu, Amy C. Cuddy, and Peter Glick (1999), “(Dis)respecting versus
(Dis)liking: Status and Interdependence Predict Ambivalent Stereotype of
Competence and Warmth,” Journal of Social Issues, 55(3), 473-89.
“Forbes’ World’s Most Powerful Brands,” Forbes (2014), Retrieved November 30, 2014
from <http://www.forbes.com/pictures/eekg45figj/no-1-apple/>.
Fornell, Claes, and David F. Larcker (1981), “Structural Equation Models with
Unobservable Variables and Measurement Error: Algebra and Statistics,” Journal
of Marketing Research, 382-8.
Fournier, Susan (1998), "Consumers and Their Brands: Developing Relationship Theory
in Consumer Research," Journal of Consumer Research, 24(4), 343-53.
Fragale, Alison R., Jennifer R. Overbeck, and Margaret A. Neale (2011), “Resources
versus Respect: Social Judgments Based on Targets’ Power and Status Positions,”
Journal of Experimental Social Psychology, 57, 767-75.
Francis, Hannah (2015), “In Connected Future, Big Mother is Watching,” The Digital
Age, Retrieved January 11, 2015 from <http://www.theage.com.au/digital-
life/digital-life-news/in-connected-future-big-mother-is-watching-20150110-
12kylu.html>.
French Jr, John RP, and Bertram Raven (1959), “The Bases of Social Power,” Studies in
Social Power. Ann Arbor, MI: Institute for Social Research, 259-69.
Galinsky, Adam D., Joe C. Magee, M. Ena Inesi and Deborah H. Gruenfeld (2006),
“Power and Perspectives Not Taken,” Psychological Science, 17(12), 1068-74.
Galinsky, Adam D., Derek D. Rucker, and Joe C. Magee (2015), "Power: Past Findings,
Present Considerations, and Future Directions," in Handbook of Personality and
Social Psychology: Vol. 3, Interpersonal Relations, ed. Mario Mikulincer, Phillip
R. Shaver, Jeffry A. Simpson, and John F. Dovidio, Washington, DC: American
Psychological Association, 421-60.
Gaski, John F. (1984), "The Theory of Power and Conflict in Channels of Distribution,"
The Journal of Marketing, 48(3), 9-29.
Goldstein, Noah J., Robert B. Cialdini, and Vladas Griskevicius (2008), "A Room with a
Viewpoint: Using Social Norms to Motivate Environmental Conservation in
Hotels," Journal of Consumer Research, 35(3), 472-82.
Gutman, Jonathan (1982), "A Means-End Chain Model Based on Consumer
Categorization Processes," The Journal of Marketing, 46(2), 60-72.
Guinote, Ana and Theresa Vescio, eds. (2010), Social Psychology of Power, New York:
Gulford Press.
Hellofs, Linda L. and Robert Jacobson (1999), “Market Share and Customers’
Perceptions of Quality: When Can Firms Grow Their Way to Higher versus
Lower Quality?” Journal of Marketing, 63(1), 16-25.
Hoch, Stephen J., and John Deighton (1989), "Managing What Consumers Learn from
Experience," The Journal of Marketing, 53(2), 1-20.
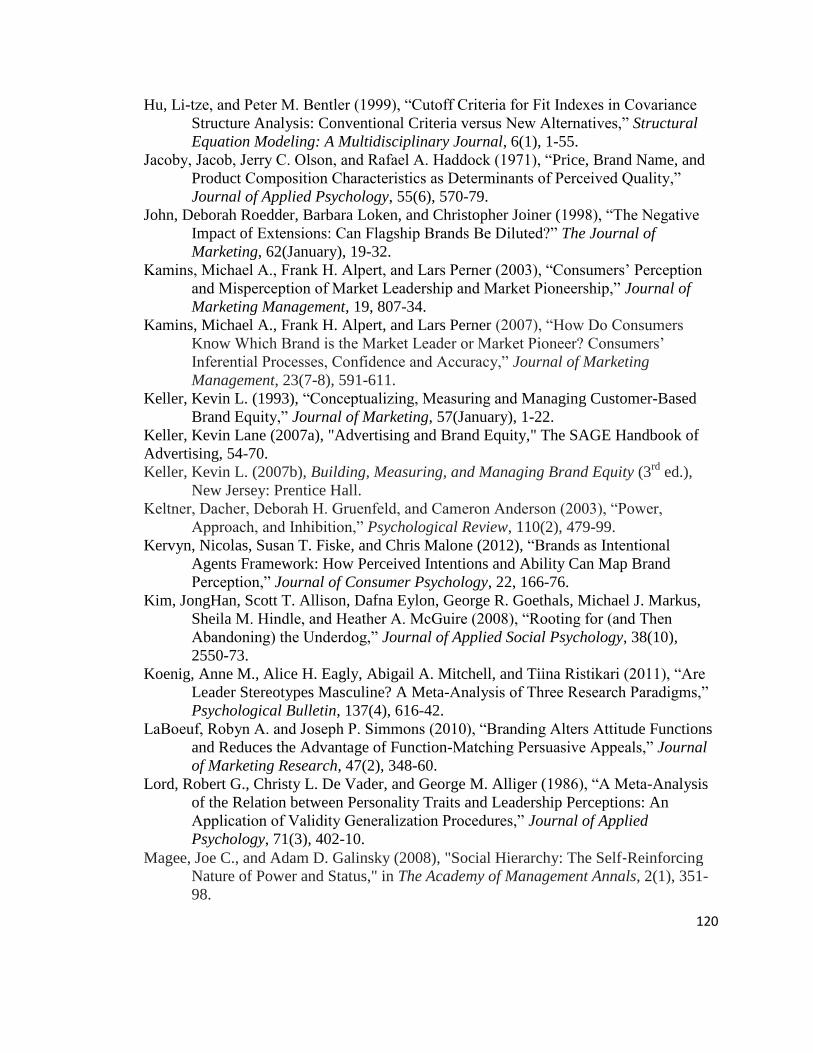
120
Hu, Li-tze, and Peter M. Bentler (1999), “Cutoff Criteria for Fit Indexes in Covariance
Structure Analysis: Conventional Criteria versus New Alternatives,” Structural
Equation Modeling: A Multidisciplinary Journal, 6(1), 1-55.
Jacoby, Jacob, Jerry C. Olson, and Rafael A. Haddock (1971), “Price, Brand Name, and
Product Composition Characteristics as Determinants of Perceived Quality,”
Journal of Applied Psychology, 55(6), 570-79.
John, Deborah Roedder, Barbara Loken, and Christopher Joiner (1998), “The Negative
Impact of Extensions: Can Flagship Brands Be Diluted?” The Journal of
Marketing, 62(January), 19-32.
Kamins, Michael A., Frank H. Alpert, and Lars Perner (2003), “Consumers’ Perception
and Misperception of Market Leadership and Market Pioneership,” Journal of
Marketing Management, 19, 807-34.
Kamins, Michael A., Frank H. Alpert, and Lars Perner (2007), “How Do Consumers
Know Which Brand is the Market Leader or Market Pioneer? Consumers’
Inferential Processes, Confidence and Accuracy,” Journal of Marketing
Management, 23(7-8), 591-611.
Keller, Kevin L. (1993), “Conceptualizing, Measuring and Managing Customer-Based
Brand Equity,” Journal of Marketing, 57(January), 1-22.
Keller, Kevin Lane (2007a), "Advertising and Brand Equity," The SAGE Handbook of
Advertising, 54-70.
Keller, Kevin L. (2007b), Building, Measuring, and Managing Brand Equity (3rd
ed.),
New Jersey: Prentice Hall.
Keltner, Dacher, Deborah H. Gruenfeld, and Cameron Anderson (2003), “Power,
Approach, and Inhibition,” Psychological Review, 110(2), 479-99.
Kervyn, Nicolas, Susan T. Fiske, and Chris Malone (2012), “Brands as Intentional
Agents Framework: How Perceived Intentions and Ability Can Map Brand
Perception,” Journal of Consumer Psychology, 22, 166-76.
Kim, JongHan, Scott T. Allison, Dafna Eylon, George R. Goethals, Michael J. Markus,
Sheila M. Hindle, and Heather A. McGuire (2008), “Rooting for (and Then
Abandoning) the Underdog,” Journal of Applied Social Psychology, 38(10),
2550-73.
Koenig, Anne M., Alice H. Eagly, Abigail A. Mitchell, and Tiina Ristikari (2011), “Are
Leader Stereotypes Masculine? A Meta-Analysis of Three Research Paradigms,”
Psychological Bulletin, 137(4), 616-42.
LaBoeuf, Robyn A. and Joseph P. Simmons (2010), “Branding Alters Attitude Functions
and Reduces the Advantage of Function-Matching Persuasive Appeals,” Journal
of Marketing Research, 47(2), 348-60.
Lord, Robert G., Christy L. De Vader, and George M. Alliger (1986), “A Meta-Analysis
of the Relation between Personality Traits and Leadership Perceptions: An
Application of Validity Generalization Procedures,” Journal of Applied
Psychology, 71(3), 402-10.
Magee, Joe C., and Adam D. Galinsky (2008), "Social Hierarchy: The Self‐Reinforcing
Nature of Power and Status," in The Academy of Management Annals, 2(1), 351-
98.

121
Nelissen, Rob, and Marijn H.C. Meijers (2011), "Social benefits of Luxury Brands as
Costly Signals of Wealth and Status," Evolution and Human Behavior, 32(5),
343-55.
Paharia, Neeru, Anat Keinan, Jill Avery, and Juliet B. Schor (2011), "The Underdog
Effect: The Marketing of Disadvantage and Determination through Brand
Biography," Journal of Consumer Research, 37(5), 775-90.
Park, C. Whan, Bernard J. Jaworski, and Deborah J. MacInnis (1986), “Strategic Brand
Concept-Image Management,” Journal of Marketing, 50(Oct), 135-45.
Porter, Michael E. (1979), “How Competitive Forces Shape Strategy,” Harvard Business
Review, 57, 137-45.
Preacher, Kristopher J. and Andrew F. Hayes (2008), "Asymptotic and Resampling
Strategies for Assessing and Comparing Indirect Effects in Multiple Mediator
Models," Behavior Research Methods, 40 (3), 879-91.
Rucker, Derek D., David Dubois, and Adam D. Galinsky (2011), “Generous Paupers and
Stingy Princes: Power Drives Consumer Spending on Self versus Others,”
Journal of Consumer Research, 37(6), 1015-29.
Rucker, Derek D., and Adam D. Galinsky (2008), "Desire to Acquire: Powerlessness and
Compensatory Consumption," Journal of Consumer Research, 35(2), 257-67.
Rucker, Derek D., and Adam D. Galinsky (2009), "Conspicuous Consumption versus
Utilitarian Ideals: How Different Levels of Power Shape Consumer Behavior,"
Journal of Experimental Social Psychology, 45(3), 549-55.
Rucker, Derek D., Adam D. Galinsky, and David Dubois (2012), "Power and Consumer
Behavior: How Power Shapes Who and What Consumers Value," Journal of
Consumer Psychology 22(3), 352-68.
Rucker, Derek D., Miao Hu, and Adam D. Galinsky (2014), "The Experience Versus the
Expectations of Power: A Recipe for Altering the Effects of Power on Behavior,"
Journal of Consumer Research, 41(2), 381-96.
Russell, Ann Marie T. and Susan Fiske (2008), “It’s All Relative: Competition and Status
Drive Interpersonal Perception,” European Journal of Social Psychology, 38(7),
1193-1201.
Schwartz, Shalom H. (1992), “Universals in the Content and Structure of Values:
Theoretical Advances and Empirical Tests in 20 Countries,” in Advances in
Experimental Social Psychology, Vol. 25, Mark P. Zanna, ed. San Diego:
Academic Press, 1-65.
Schwartz, Shalom H. and Klaus Boehnke (2004), “Evaluating the Structure of Human
Values with Confirmatory Factor Analysis,” Journal of Research in Personality,
38(31), 230-55.
Simpson, Jeffry A., Allison K. Farrell, M. Minda Orina, and Alexander J. Rothman
(2015), “Power and Social Influence in Relationships,” in Handbook of
Personality and Social Psychology: Vol. 3, Interpersonal Relations, Mario
Mikulincer, Phillip R. Shaver, Jeffry A. Simpson, and John F. Dovidio, eds.,
Washington, DC: American Psychological Association, 393-419.

122
Stalk, George, Philip Evans, and Lawrence E. Shulman (1992), “Competing on
Capabilities: The New Rules of Corporate Strategy,” Harvard Business Review,
63, 57-69.
Stoner, Jennifer L., and Carlos J. Torelli (2015), “A Typology of Brand Power,” paper
presented at American Marketing Association Winter Educators’ Conference, San
Antonio, TX.
Sundar, Aparna, and Theodore J. Noseworthy (2014), “Place the Logo High or Low?
Using Conceptual Metaphors of Power in Packaging Design,” Journal of
Marketing, 78(5), 138-51.
Torelli, Carlos J., Lisa M. Leslie, Jennifer L. Stoner, and Raquel Puente (2014), "Cultural
Determinants of Status: Implications for Workplace Evaluations and
Behaviors," Organizational Behavior and Human Decision Processes, 123(1), 34-
48.
Torelli, Carlos J., Alokparna Basu Monga, and Andrew M. Kaikati (2012), "Doing
Poorly by Doing Good: Corporate Social Responsibility and Brand
Concepts," Journal of Consumer Research, 38(5), 948-63.
Torelli, Carlos J., Aysegül Özsomer, Sergio W. Carvalho, Hean Tat Keh, and Natalia
Maehle (2012), "Brand Concepts as Representations of Human Values: Do
Cultural Congruity and Compatibility between Values Matter?" Journal of
Marketing, 76(4), 92-108.
Torelli, Carlos J., and Sharon Shavitt (2010), "Culture and Concepts of Power," Journal
of Personality and Social Psychology, 99(4), 703-23.
Ward, Morgan K., and Darren W. Dahl (2014), "Should the Devil Sell Prada? Retail
Rejection Increases Aspiring Consumers' Desire for the Brand," Journal of
Consumer Research, 41(3), 590-609.
Wartenberg, Thomas E. (1990), The Forms of Power: From Domination to
Transformation, Philadelphia: Temple University Press.
Wilkinson, Ian, and David Kipnis (1978), "Interfirm Use of Power," Journal of Applied
Psychology, 63(3), 315-20.
Winter, David G. (1973), The Power Motive, New York: Free Press.
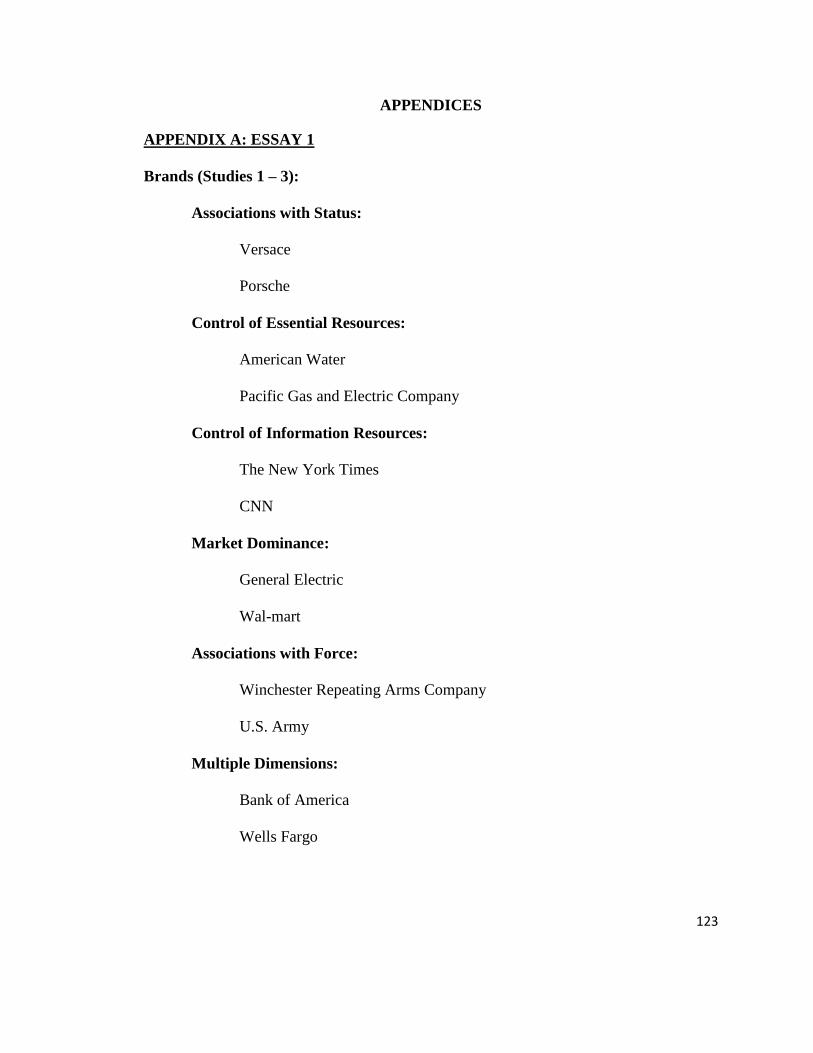
123
APPENDICES
APPENDIX A: ESSAY 1
Brands (Studies 1 – 3):
Associations with Status:
Versace
Porsche
Control of Essential Resources:
American Water
Pacific Gas and Electric Company
Control of Information Resources:
The New York Times
CNN
Market Dominance:
General Electric
Wal-mart
Associations with Force:
Winchester Repeating Arms Company
U.S. Army
Multiple Dimensions:
Bank of America
Wells Fargo

124
Questions used to develop stimuli (Study 4):
1. This brand can be called a bully. It forces suppliers and buyers to do as it wants and is
always getting its way.
2. This brand is very popular. It has widespread acceptance and is used by a wide variety
of people.
3. This brand is known for having a high level of sales and producing a lot of income. It
has high market share in its given product category.
4. This brand could be called a trendsetter by continuously developing what is
fashionable for its product category. Other brands want to be this brand and try to copy
them.
5. This brand is iconic for its product category. It is the prototype of that category that all
other brands in that category are compared to.
6. This brand has a dominant personality. It's self-assured, forceful, and assertive.
7. This brand is big, a market leader, and dominates the competition.

125
Brands (Study 4):
Apple
Wal-mart
Target
Sam’s Club
Coca-Cola
Microsoft
Nike
Starbucks
Johnson & Johnson
Amazon
Zara
Ford
Kleenex
General Mills
American Water
Pacfic Water and Gas Company

126
APPENDIX B: ESSAY 2
Brands (Pilot Study):
Versace
Porsche
American Water
Pacific Gas and Electric Company
The New York Times
CNN
General Electric
Wal-mart
Winchester Repeating Arms Company
U.S. Army
Bank of America
Wells Fargo
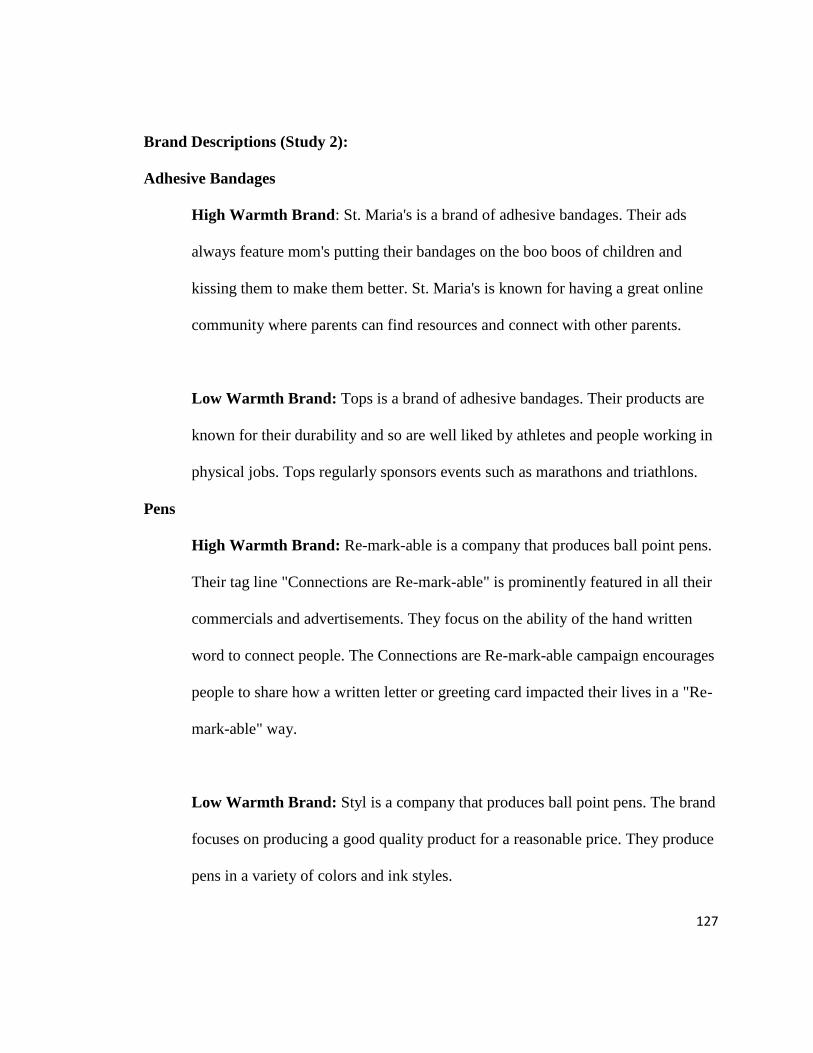
127
Brand Descriptions (Study 2):
Adhesive Bandages
High Warmth Brand: St. Maria's is a brand of adhesive bandages. Their ads
always feature mom's putting their bandages on the boo boos of children and
kissing them to make them better. St. Maria's is known for having a great online
community where parents can find resources and connect with other parents.
Low Warmth Brand: Tops is a brand of adhesive bandages. Their products are
known for their durability and so are well liked by athletes and people working in
physical jobs. Tops regularly sponsors events such as marathons and triathlons.
Pens
High Warmth Brand: Re-mark-able is a company that produces ball point pens.
Their tag line "Connections are Re-mark-able" is prominently featured in all their
commercials and advertisements. They focus on the ability of the hand written
word to connect people. The Connections are Re-mark-able campaign encourages
people to share how a written letter or greeting card impacted their lives in a "Re-
mark-able" way.
Low Warmth Brand: Styl is a company that produces ball point pens. The brand
focuses on producing a good quality product for a reasonable price. They produce
pens in a variety of colors and ink styles.
128
Category Knowledge Scale (Study 4):
The product category that you are going to be asked to evaluate is the soup category.
Think of all the brands and products that you know of in the soup product category and
then rate how much you agree or disagree with each of the following statements. (1=
Strongly Disagree, 7 = Strongly Agree)
1. I am sure I know which brand sells the most soup.
2. I know for certain who the leader in the soup category is.
3. I could accurately tell you the market share of various brands in the soup product
category.
4. I know a lot about the brands in the soup category.
5. I could easily rank the brands in the soup category based on total sales.

129
Advertisement stimuli (Study 5):
Orange Juice
High Warmth Brand Low Warmth Brand
Popcorn
High Warmth Brand Low Warmth Brand
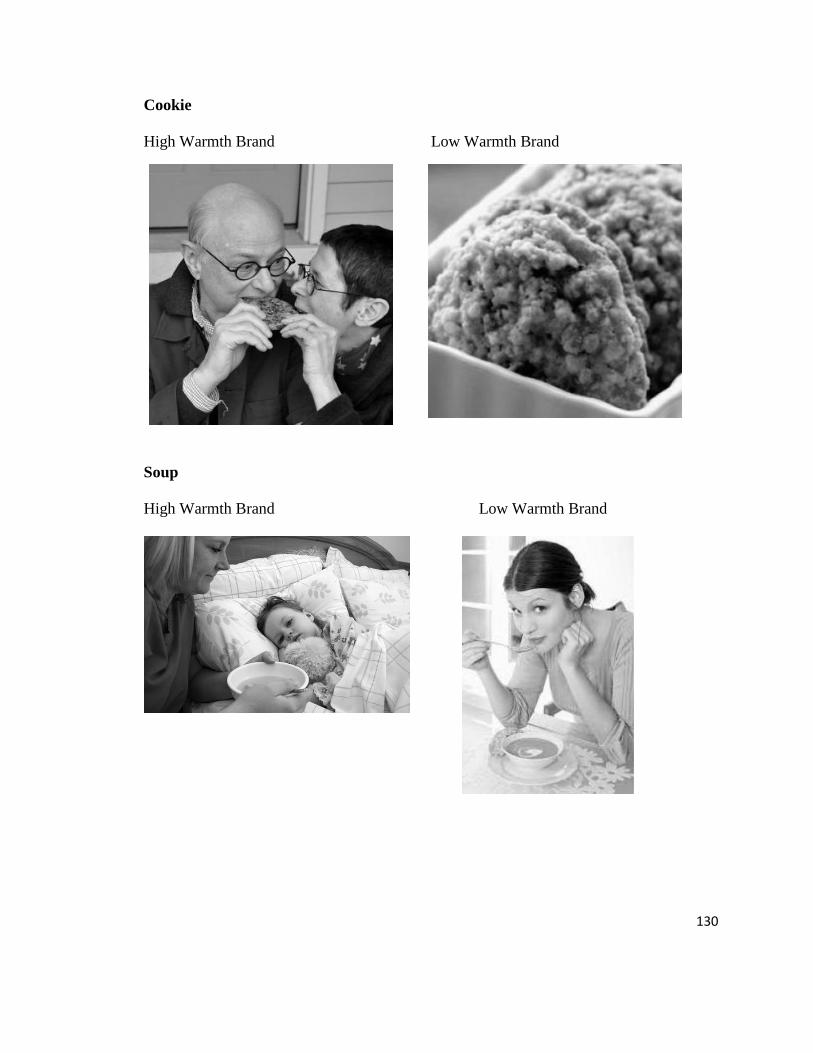
130
Cookie
High Warmth Brand Low Warmth Brand
Soup
High Warmth Brand Low Warmth Brand

131
APPENDIX C: ESSAY 3
Advertisements (Study 1)
Dominant Advertisement Control Advertisement

132
Brand descriptions (Study 2):
Adhesive Bandage: St. Maria's is a brand of adhesive bandages. St. Maria's is
known for an adhesive which is gentle on the skin. St. Maria's is known for having a
great online community where parents can find resources and connect with other parents.
The brand is known for its support of various community clinics that serve low income
families.
Pen: ReMARKable is a company that produces ball point pens. Their tag line
"Connections are ReMARKable" is prominently featured in all their commercials and
advertisements. They focus on the ability of the hand written word to connect people. The
Connections are ReMARKable campaign encourages people to share how a written letter
or greeting card impacted their lives in a "ReMARKable" way.
Rice: Morgan Rice is a company that produces raw grains of rice. They are
known for promoting the nutritional benefits of rice. Additionally, a portion of all bags of
rice they sell go to provide rice for people in poverty stricken countries in Africa.
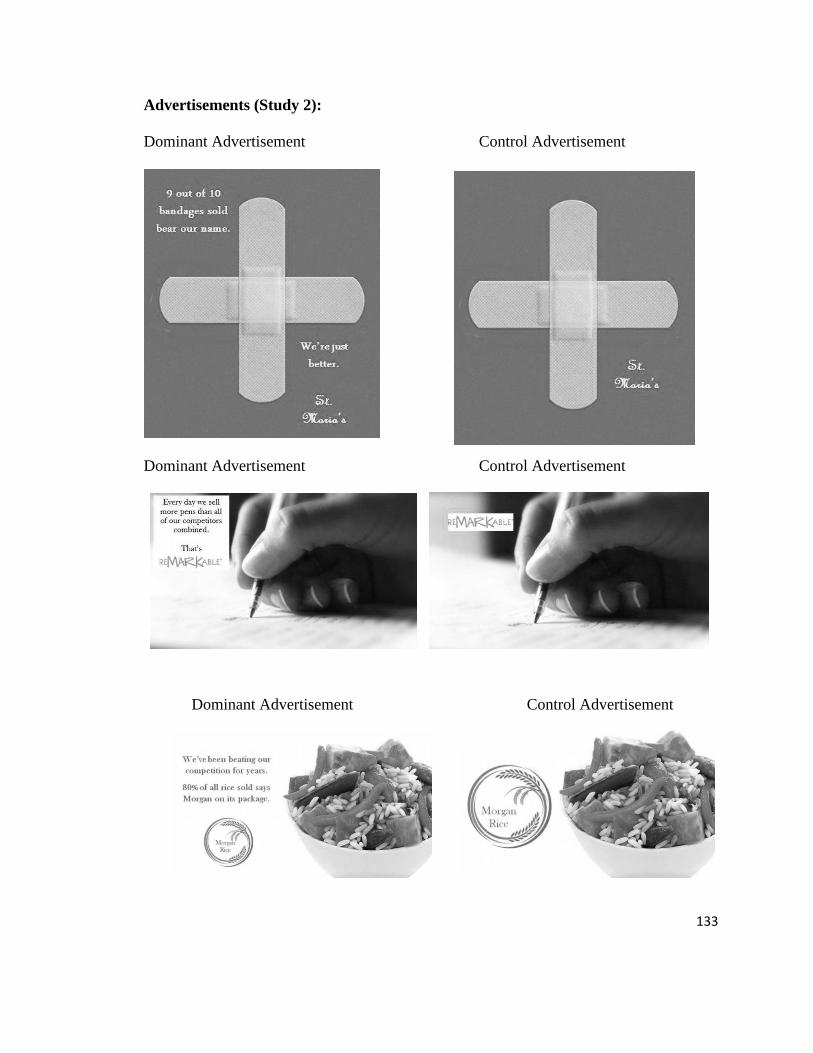
133
Advertisements (Study 2):
Dominant Advertisement Control Advertisement
Dominant Advertisement Control Advertisement
Dominant Advertisement Control Advertisement

134
Advertisements (Study 3):
Dominant Advertisement
Descriptive Norms Advertisement
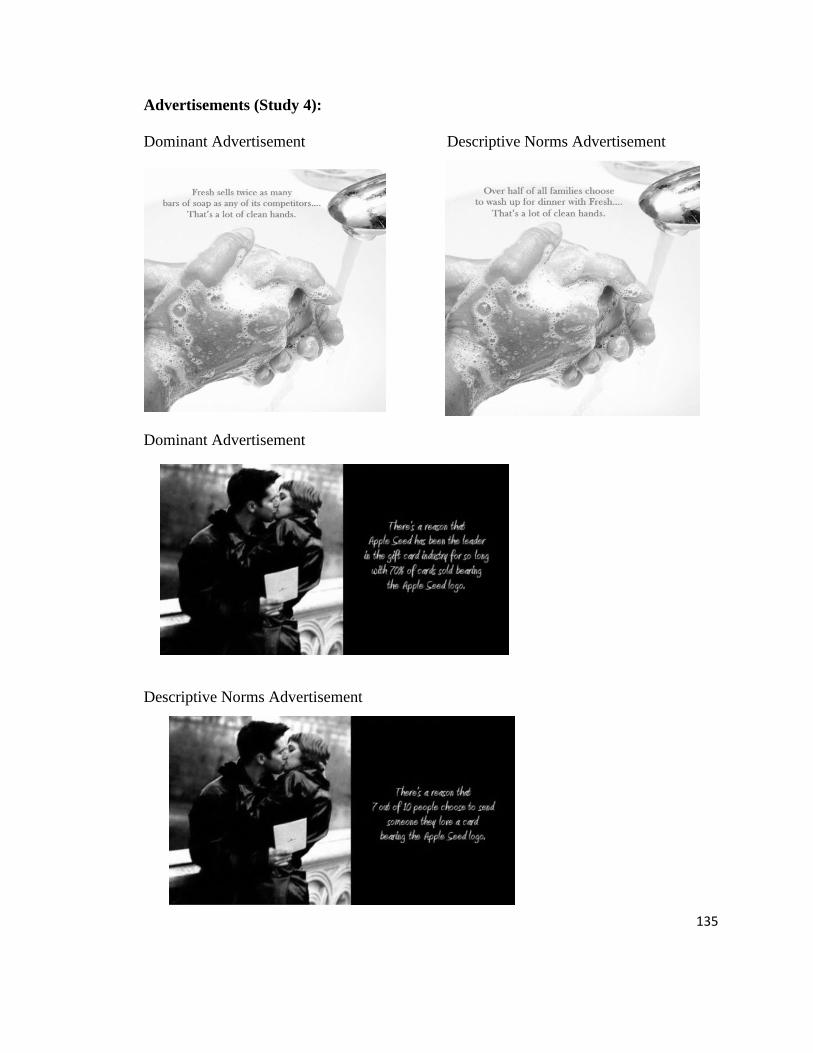
135
Advertisements (Study 4):
Dominant Advertisement Descriptive Norms Advertisement
Dominant Advertisement
Descriptive Norms Advertisement