performance analysis and tuning – part i - red hat...red hat enterprise linux performance...
TRANSCRIPT

D. John Shakshober (Shak) – Tech Director Performance Engineering
Larry Woodman - Senior Consulting Engineer
Bill Gray – Senior Principal Performance Engineer
Joe Mario - Senior Principal Performance Engineer
Performance Analysis and Tuning – Part I Containers are Linux, run/optimized and tuned just like Linux.

Agenda: Performance Analysis Tuning Part I
• Part I - Containers are Linux, run/optimized and tuned just like Linux.
• RHEL Evolution 5->6->7 – Hybrid Clouds Atomic / OSE / RHOP
• System Performance/Tools Tuned profiles• NonUniform Memory Access (NUMA)
• What is NUMA, RHEL Architecture, Auto-NUMA-Balance• Network Performance – noHZ, Throughput vs Latency-performance
• Tuna – IRQ pinning, alter priorities, monitor • NFV w/ DPDK fastdata path • Perf advanced features, BW monitoring, Cache-line tears C-2-C
•“Performance + Scale Experts” - 205C - 5:30-7 PM
• Free - Soda/Beer/Wine

Red Hat Enterprise Linux Performance Evolution
• RHEL5 • 1000 Hz, CFQ IO elevator, ktune to change to deadline• Numactl, taskset affinity, static hugepages, IRQ balance, oprofile
• RHEL 6 • Tickless scheduler CFS, islocpus, userspace NUMAD tool• Transparent hugepages (THP), numa-IRQ balance, cGroups • Tuna, Perf, PCP ship w/ OS
• RHEL 7 • NoHZ_full for CFQ, islocpu, realtime ship same RHEL7 kernel• AutoNuma balance, THP, systemd – Atomic containers

Red Hat Confidential
Benchmarks – code path coverage
● CPU – linpack, lmbench
● Memory – lmbench, McCalpin STREAM
● Disk IO – iozone, fio – SCSI, FC, iSCSI
● Filesystems – iozone, ext3/4, xfs, gfs2, gluster
● Networks – netperf – 10/40Gbit, Infiniband/RoCE, Bypass
● Bare Metal, RHEL6/7 KVM, Atomic Containers
● White box AMD/Intel, with our OEM partners
Application Performance
● Linpack MPI, HPC workloads
● AIM 7 – shared, filesystem, db, compute
● Database: DB2, Oracle 11/12, Sybase 15.x , MySQL, MariaDB, Postgrs, MongoDB
● OLTP – TPC-C, TPC-VMS
● DSS – TPC-H/xDS
● Big Data – TPCx-HS, Bigbench
● SPEC cpu, jbb, sfs, virt, cloud
● SAP – SLCS, SD, Hana
● STAC = FSI (STAC-N)
● SAS mixed Analytic, SAS grid (gfs2)
RHEL Performance Workload Coverage (bare metal, KVM virt w/ RHEV and/or OSP, LXC Kube/OSEand Industry Standard Benchmarks)

RHEL / Intel Benchmarks Broadwell EP/EXred-hat-delivers-high-performance-on-critical-enterprise-workloads-with-the-latest-intel-xeon-e7-v4-processor-family
Red Hat Company Confidential, NDA Required
TPCx-BB TPCx-HS SPEC CPU2006 SPECjbb2015 SPECvirt_sc2013 SPEC OMP20120.00%
10.00%
20.00%
30.00%
40.00%
50.00%
60.00%
70.00%
80.00%
90.00%
100.00% 100%
89%
81%
67%63%
39%
Benchmark publications using Red Hat Enterprise Linux over past 24 months
Industry Benchmarks June 2016
Benchmark Name
Per
cen
t U
sin
g R
ed H
at E
nte
rpri
se L
inu
x

Key performance takeaways
–SQL Server 2017 on Red Hat Enterprise Linux surpasses the previous #1 TPC-H@1000GB result achieved with SQL Server 2016–6% higher performance–5% better price/performance
–The first and only result with Microsoft SQL Server 2017 Enterprise Edition–Results achieved on similarly configured servers with twoIntel® Xeon® E5-2699 v4 processors
#1 performance and price/performance on non-clustered TPC-H@1000GBHPE, Microsoft, and Red Hat deliver first-ever result with SQL Server 2017 Enterprise Edition
Read the performance brief at hpe.com/servers/benchmarks.© Copyright 2017 Hewlett Packard Enterprise Development LP. Microsoft and Windows are U.S. registered trademarks of Microsoft Corporation. Red Hat, Red Hat Enterprise Linux, and the Shadowman logo are registered trademarks of Red Hat, Inc. Linux is a registered trademark of Linus Torvalds. Intel and Xeon are trademarks of Intel Corporation in the U.S. and other countries. TPC and TPC-H are trademarks of the Transaction Processing Performance Council. TPC-H results show the HPE ProLiant DL380 Gen9 with a result of 717,101 QphH @ 1000GB and $0.61 USD/QphH with system availability as of 10-19-2017 (results published 04-19-2017; see tpc.org/3327); the HPE ProLiant DL380 Gen9 with a result of 678,492 QphH @1000GB and $0.64/QphH @ 1000GB with system availability as of 07-31-2016 (results published 03-24-2016; see tpc.org/3320). The TPC believes that comparisons of TPC-H results published with different scale factors are misleading and discourages such comparisons. Please see tpc.org for up-to-date information. Competitive claims valid as of 04-19-2017.
Winning partnerships!
QphH $ USD/QphH
Red Hat Enterprise Linux 7
HPE ProLiant DL380 Gen9
SQL Server 2017 Enterprise Edition
Higher performance Better price/performance
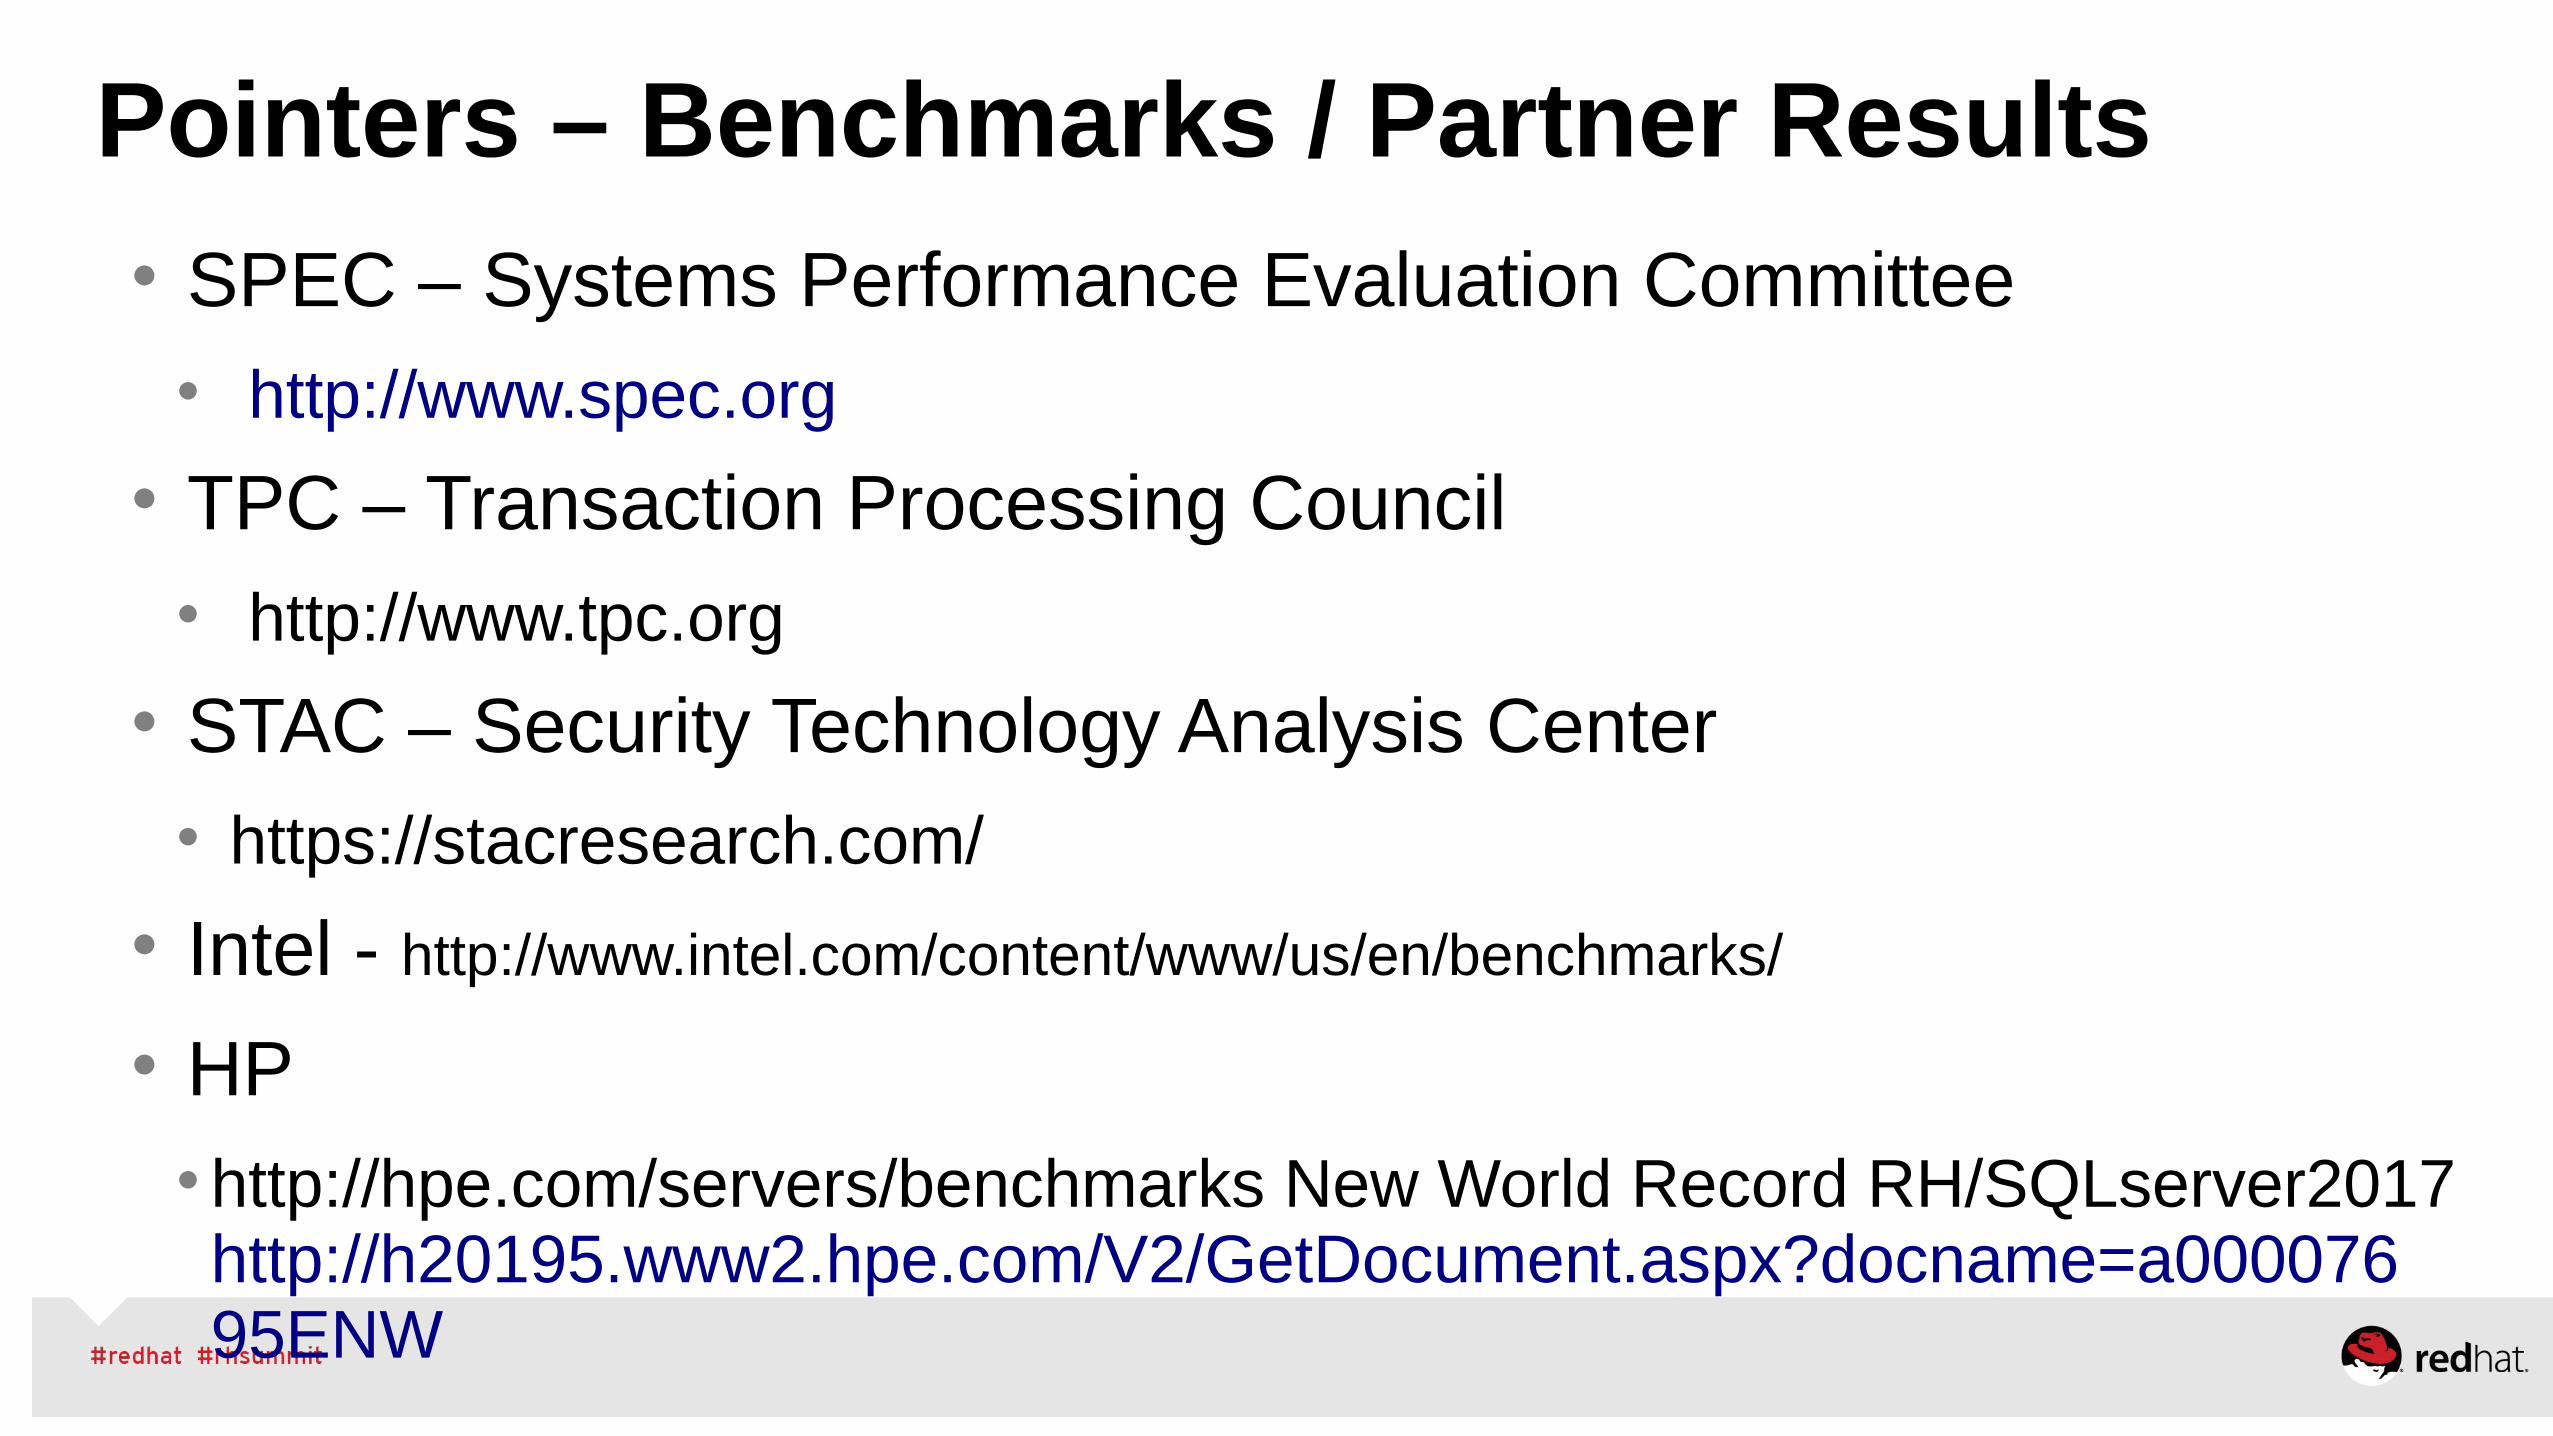
Pointers – Benchmarks / Partner Results• SPEC – Systems Performance Evaluation Committee
• http://www.spec.org
• TPC – Transaction Processing Council
• http://www.tpc.org
• STAC – Security Technology Analysis Center
• https://stacresearch.com/
• Intel - http://www.intel.com/content/www/us/en/benchmarks/
• HP
•http://hpe.com/servers/benchmarks New World Record RH/SQLserver2017 http://h20195.www2.hpe.com/V2/GetDocument.aspx?docname=a00007695ENW

Performance Tools - Tuned

tuned is a tool to dynamically tuneRed Hat Enterprise Linux.
You could improve workload performance by applying one of the predefined profiles or
use those that you’ve written yourself
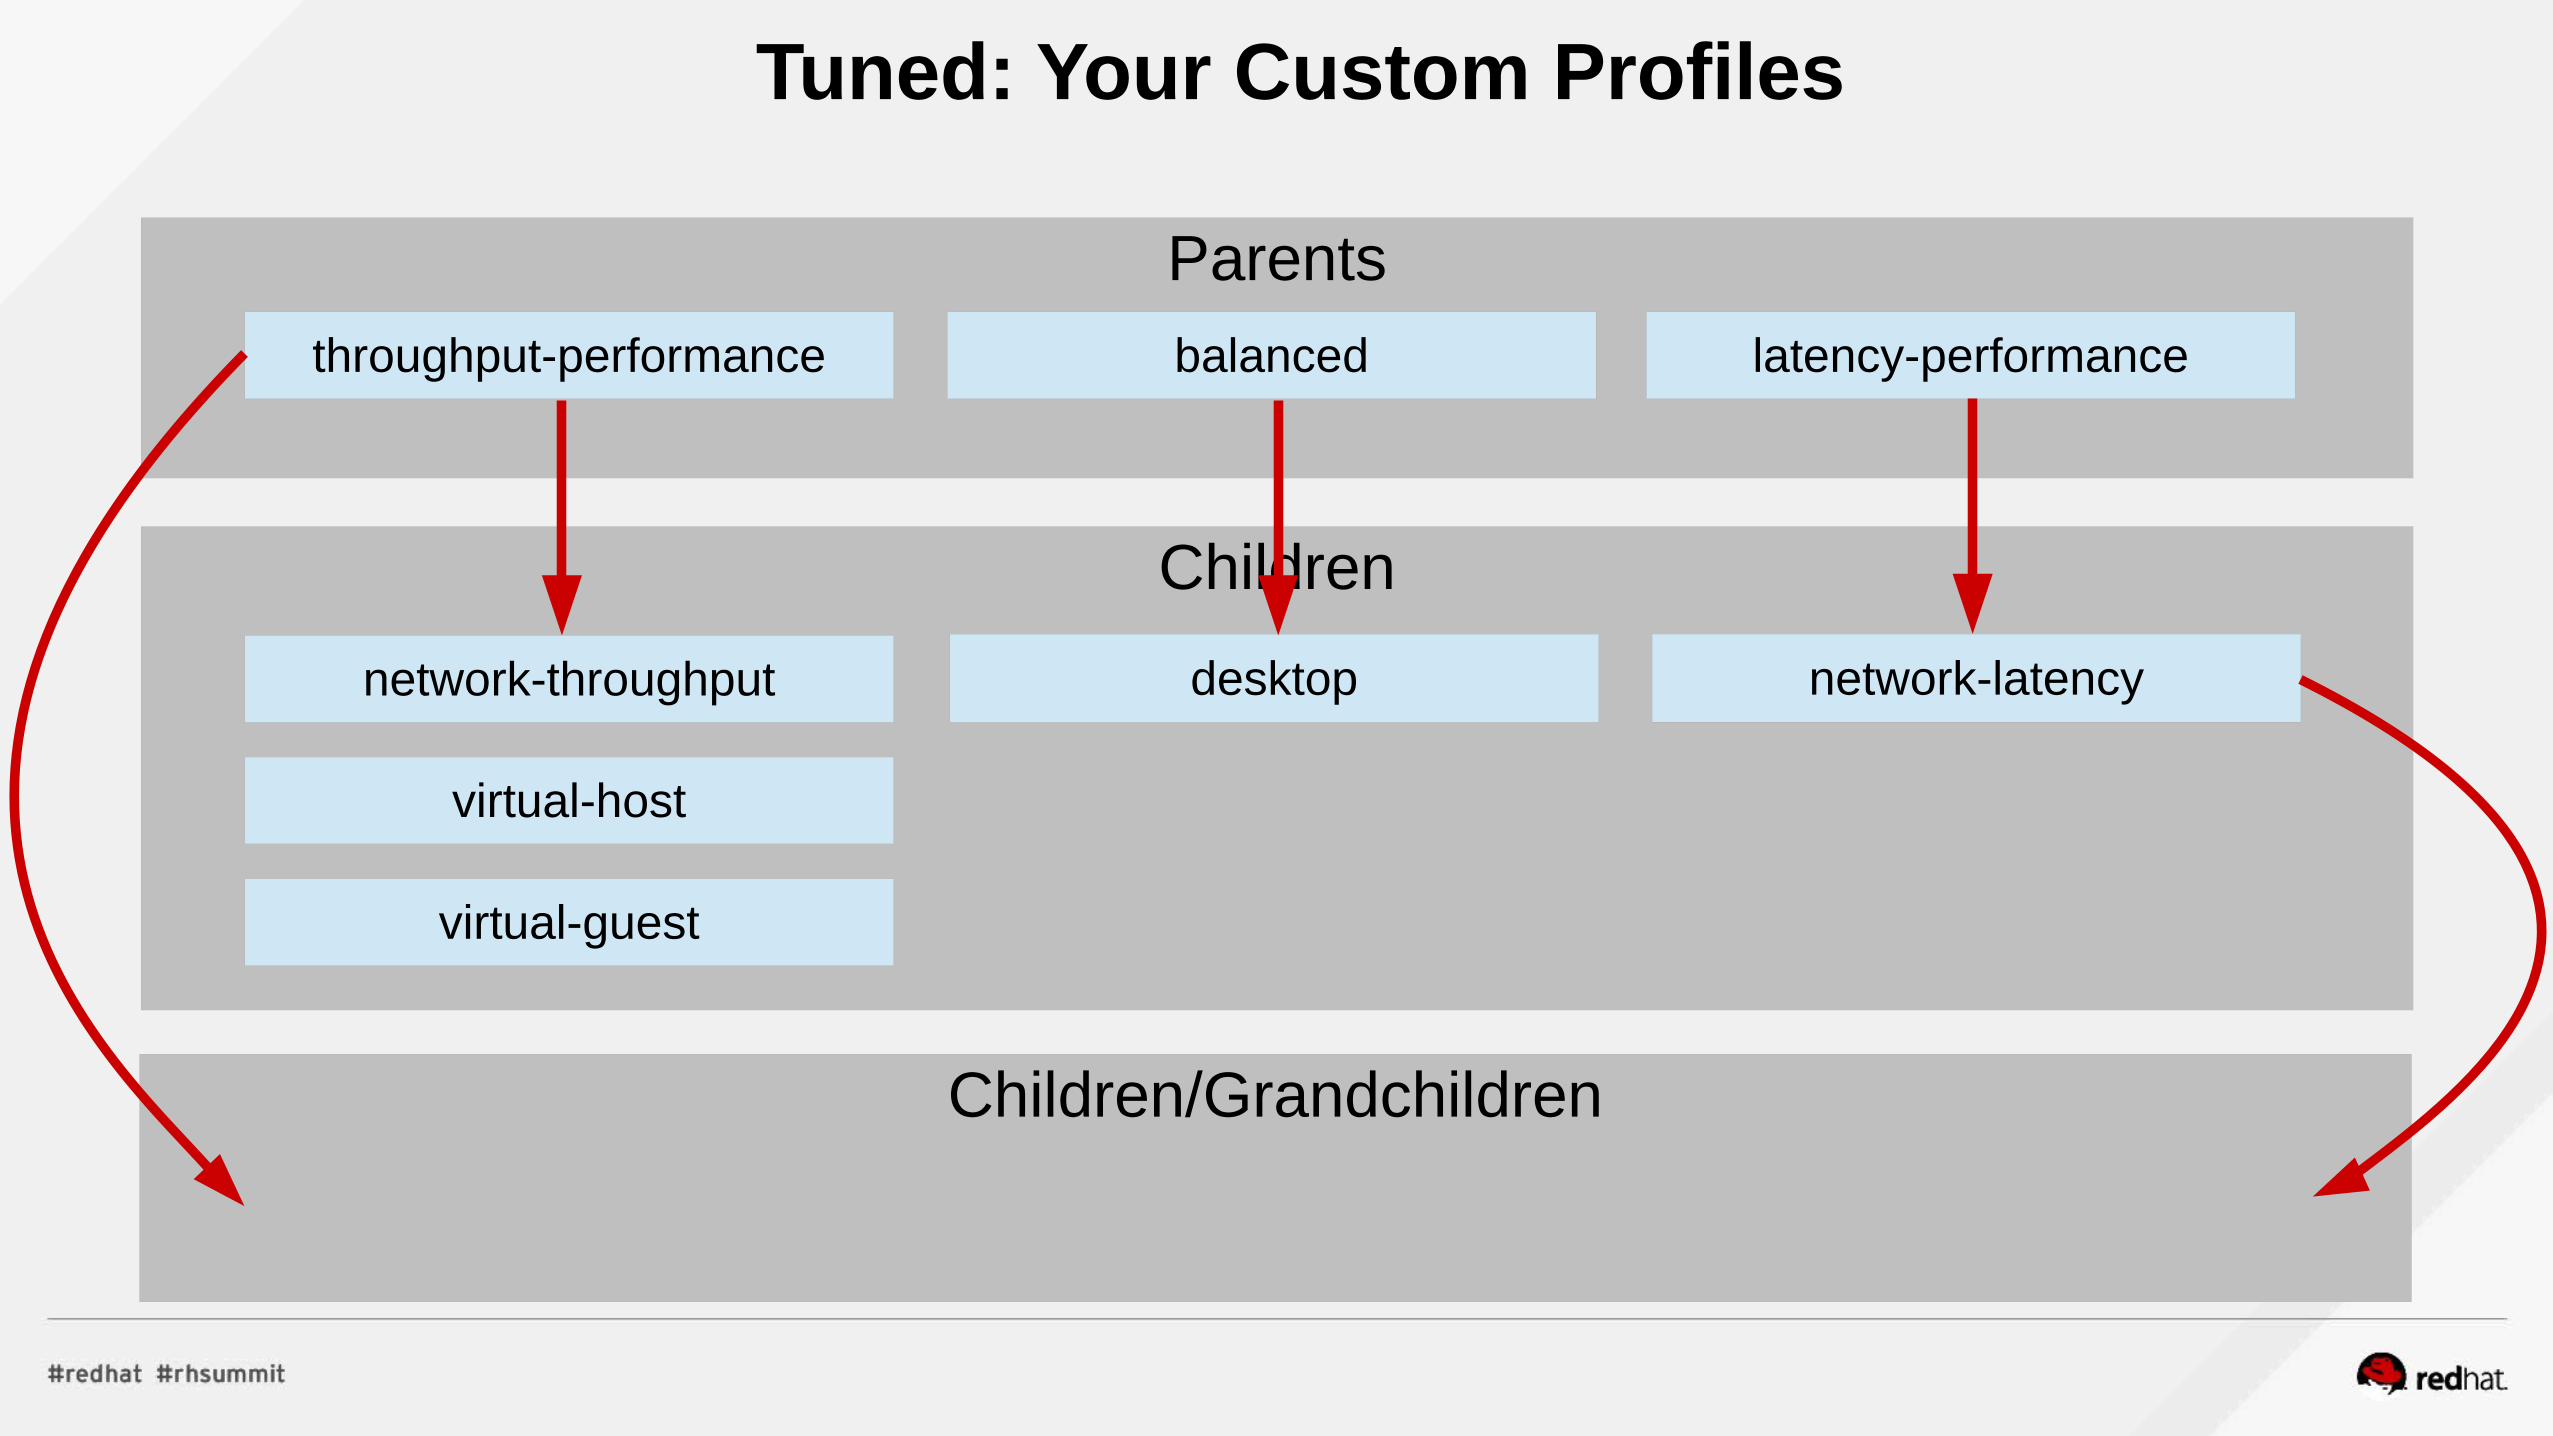
Children
Parents
Tuned: Your Custom Profiles
latency-performancethroughput-performance
network-latencynetwork-throughput
virtual-host
virtual-guest
balanced
desktop
Your Database ProfileYour Web Profile Your Middleware Profile
Children/Grandchildren

Performance Metrics - Latency==Speed - Throughput==Bandwidth
Throughput – Bandwidth - # lanes in Highway - Width of data path / cachelines - Bus Bandwidth, QPI links, PCI 1-2-3 - Network 1 / 10 / 40 Gb – aggregation, NAPI - Fiberchannel 4/8/16, SSD, NVME Drivers
Latency – Speed Limit- Ghz of CPU, Memory PCI- Small transfers, disable aggregation – TCP nodelay- Dataplane optimization DPDK

throughput-performance
governor=performance
energy_perf_bias=performance
min_perf_pct=100
transparent_hugepages=always
readahead=>4096
sched_min_granularity_ns = 10000000
sched_wakeup_granularity_ns = 15000000
vm.dirty_ratio = 40
vm.dirty_background_ratio = 10
vm.swappiness=10
latency-performance
force_latency=1
governor=performance
energy_perf_bias=performance
min_perf_pct=100
kernel.sched_min_granularity_ns=10000000
vm.dirty_ratio=10
vm.dirty_background_ratio=3
vm.swappiness=10
kernel.sched_migration_cost_ns=5000000
Tuned Profile Examples

Tuned: Storage Performance Boost:throughput-performance (default in RHEL7)
Larger is better

Mapping tuned profiles to Red Hat's product portfolio
RHEL Desktop/Workstationbalanced
RHV Host, Guestvirtual-host/guest
Red Hat Storagerhs-high-throughput, virt
RHEL Atomicatomic-host, atomic-guest
RHEL Server/HPCthroughput-performance
RHVvirtual-host
RHOSP (compute node)virtual-host
OpenShiftopenshift-master, node
RHEL for Real Timerealtime
RHEL for Real Time KVM/NFV
realtime-virtual-host/guest
RHEL + SAP
sap / sap-hana
RHOP - NFV (compute node)cpu-partitioning
New in7.4

RHEL 6/7 Non-Uniform Memory Access (NUMA)
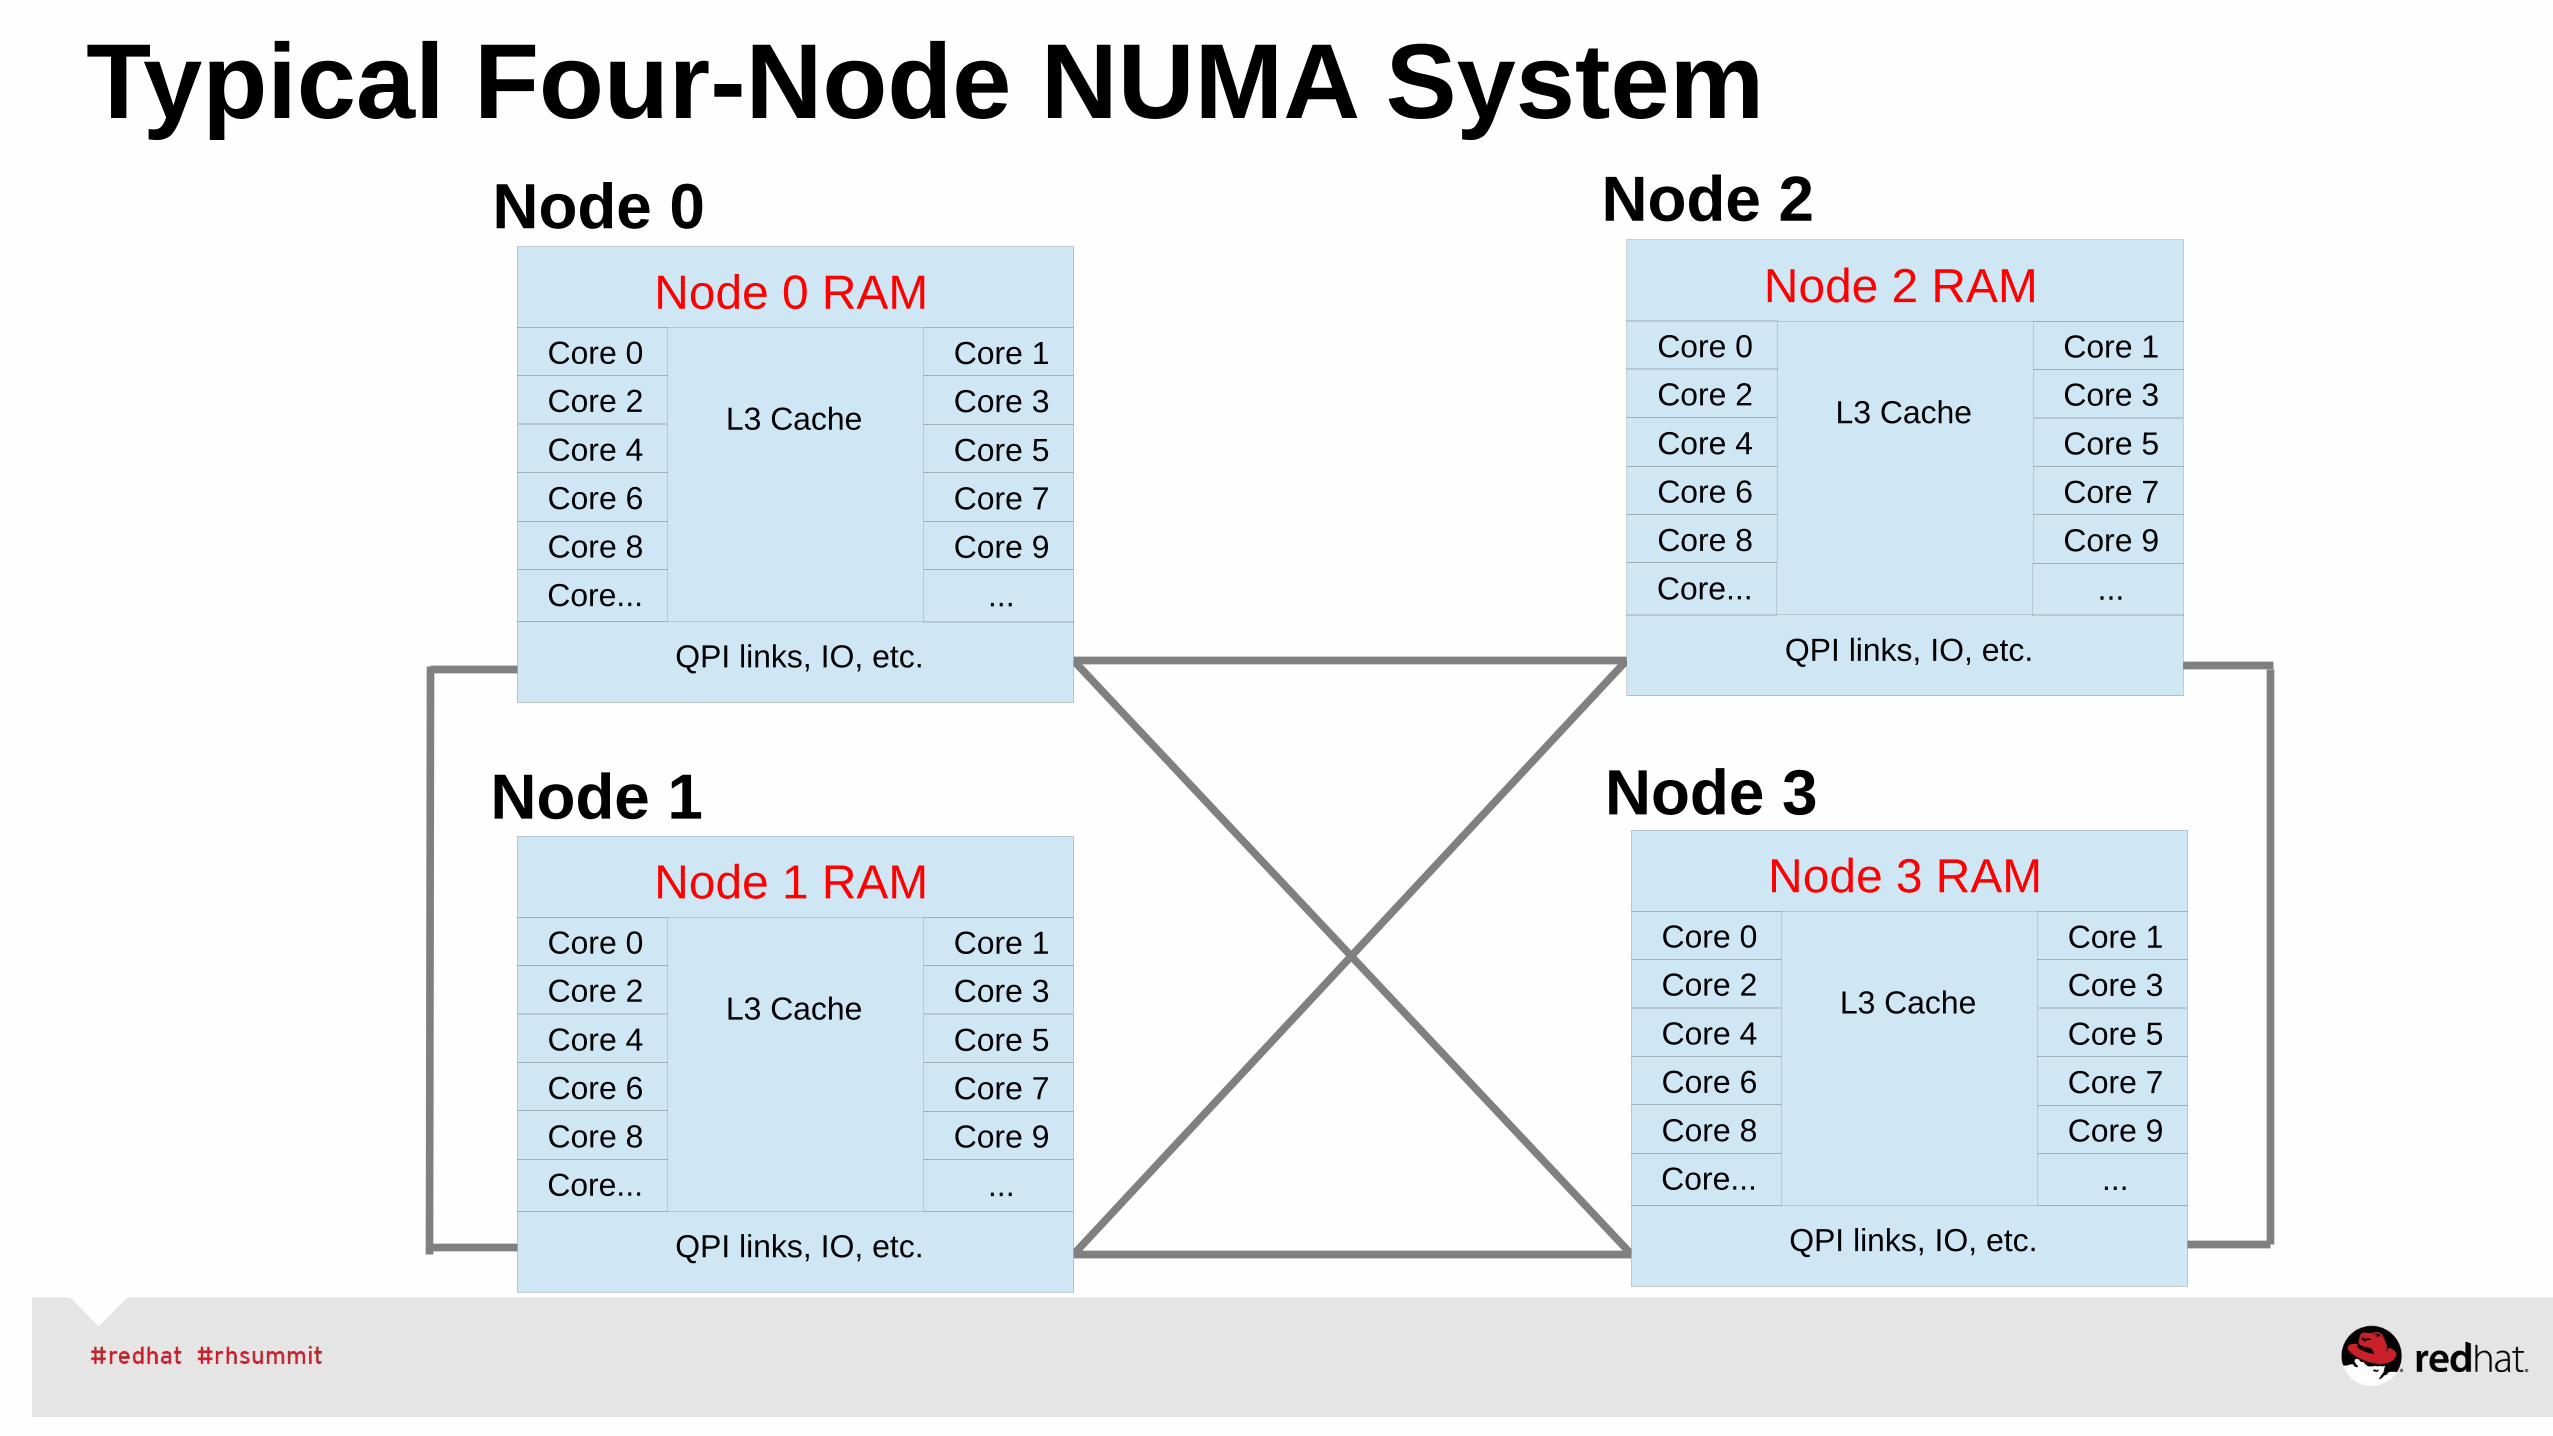
Typical Four-Node NUMA System
Node 0 RAM
QPI links, IO, etc.
L3 Cache
Node 3Node 1
Node 0 Node 2
Core 4
Core 2
Core 0
Core 6
Core 8
Core...
Core 5
Core 3
Core 1
Core 7
Core 9
...
Node 2 RAM
QPI links, IO, etc.
L3 CacheCore 4
Core 2
Core 0
Core 6
Core 8
Core...
Core 5
Core 3
Core 1
Core 7
Core 9
...
Node 3 RAM
QPI links, IO, etc.
L3 CacheCore 4
Core 2
Core 0
Core 6
Core 8
Core...
Core 5
Core 3
Core 1
Core 7
Core 9
...
Node 1 RAM
QPI links, IO, etc.
L3 CacheCore 4
Core 2
Core 0
Core 6
Core 8
Core...
Core 5
Core 3
Core 1
Core 7
Core 9
...

NUMA Especially Important When...•Server consolidation / replicated processes / virtual guests / containers
•Multiple processes (re)using mostly local data
•Multiple workloads / threads consuming fractional subsets of system resources
•Resource access patterns can be private, localized or contained
• Ideally, these workloads / threads can be sized to fit within NUMA nodes!
•Align CPUs, Memory, Devices, and Interrupts for workloads that can be localized to minimize latency, and isolated to avoid interference!
•System-wide monolithic processes with poor data locality are different...

Want to align process memory and CPU threads within NUMA nodes
Node 0 Node 2Node 1 Node 3
Process 37
Process 29
Process 19
Process 61
Node 0 Node 2Node 1 Node 3
Proc 37
Proc29
Proc19
Proc 61
No NUMA management With NUMA management
Process 61
RED HAT CONFIDENTIAL | Joe Mario#rhconvergence
19
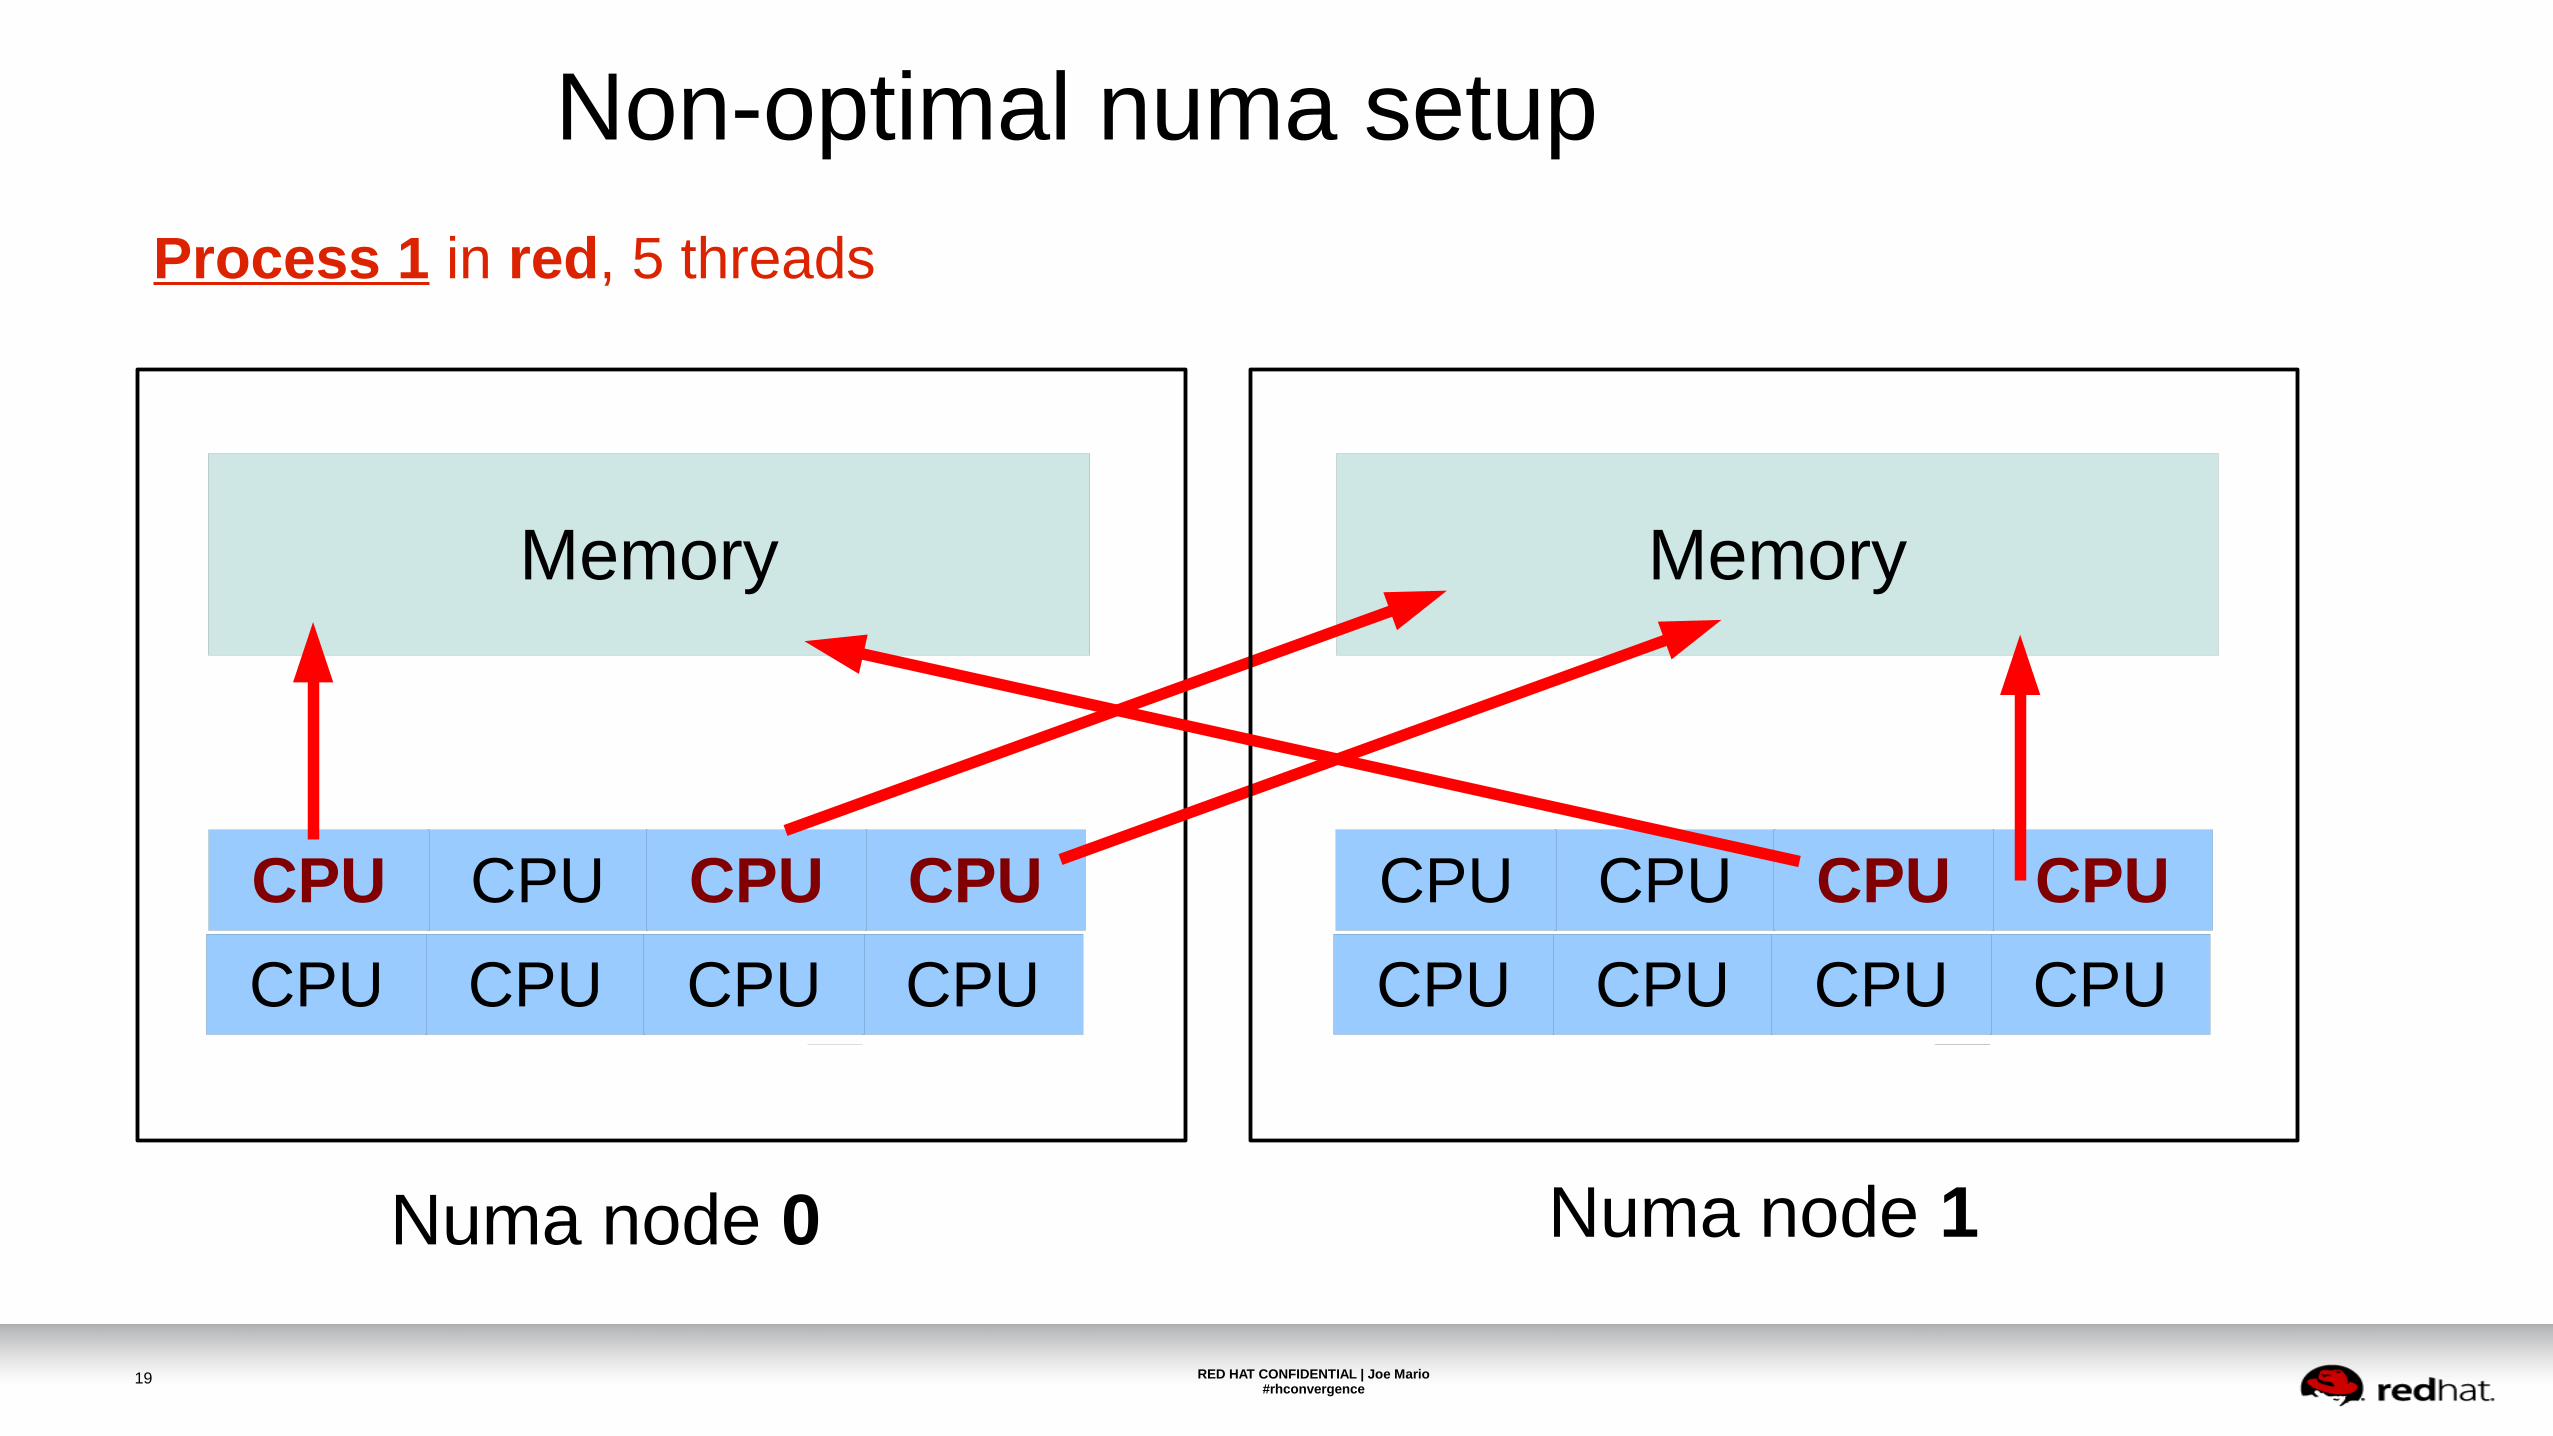
CPU CPUCPU CPU
Memory
Numa node 0
CPU CPUCPU CPU
Memory
Numa node 1
CPU CPUCPU CPU
CPU CPUCPU CPU
Non-optimal numa setup
Process 1 in red, 5 threads

RED HAT CONFIDENTIAL | Joe Mario#rhconvergence
20
CPU CPUCPU CPU
Memory
Numa node 0
CPU CPUCPU CPU
Memory
Numa node 1
CPU CPUCPU CPU
CPU CPUCPU CPU
Optimal numa setup
Process 1 in green, 4 threadsProcess 2 in red, 5 threads

Are my processes doing that?
•Variety of commands available to help:
• lscpu
•numactl
• lstopo
•numastat
•ps
• top

Tools to display CPU and Memory (NUMA) # lscpuArchitecture: x86_64CPU op-mode(s): 32-bit, 64-bitByte Order: Little EndianCPU(s): 40On-line CPU(s) list: 0-39Thread(s) per core: 1Core(s) per socket: 10CPU socket(s): 4NUMA node(s): 4 . . . .L1d cache: 32KL1i cache: 32KL2 cache: 256KL3 cache: 30720KNUMA node0 CPU(s): 0,4,8,12,16,20,24,28,32,36NUMA node1 CPU(s): 2,6,10,14,18,22,26,30,34,38NUMA node2 CPU(s): 1,5,9,13,17,21,25,29,33,37NUMA node3 CPU(s): 3,7,11,15,19,23,27,31,35,39
The cpu numbers for each node
cpu, core, socket, node info

Tools to display CPU and Memory (NUMA) # numactl --hardwareavailable: 4 nodes (0-3)node 0 cpus: 0 4 8 12 16 20 24 28 32 36node 0 size: 65415 MBnode 0 free: 63482 MBnode 1 cpus: 2 6 10 14 18 22 26 30 34 38node 1 size: 65536 MBnode 1 free: 63968 MBnode 2 cpus: 1 5 9 13 17 21 25 29 33 37node 2 size: 65536 MBnode 2 free: 63897 MBnode 3 cpus: 3 7 11 15 19 23 27 31 35 39node 3 size: 65536 MBnode 3 free: 63971 MBnode distances:node 0 1 2 3 0: 10 21 21 21 1: 21 10 21 21 2: 21 21 10 21 3: 21 21 21 10
cpus & memory for each node
Relative “node-to-node” latency costs.

Visualize NUMA Topology: lstopo
How can I visualize my system's NUMA topology in Red Hat Enterprise Linux?
https://access.redhat.com/site/solutions/62879
PCI Devices
NUMA Node 0 NUMA Node 1
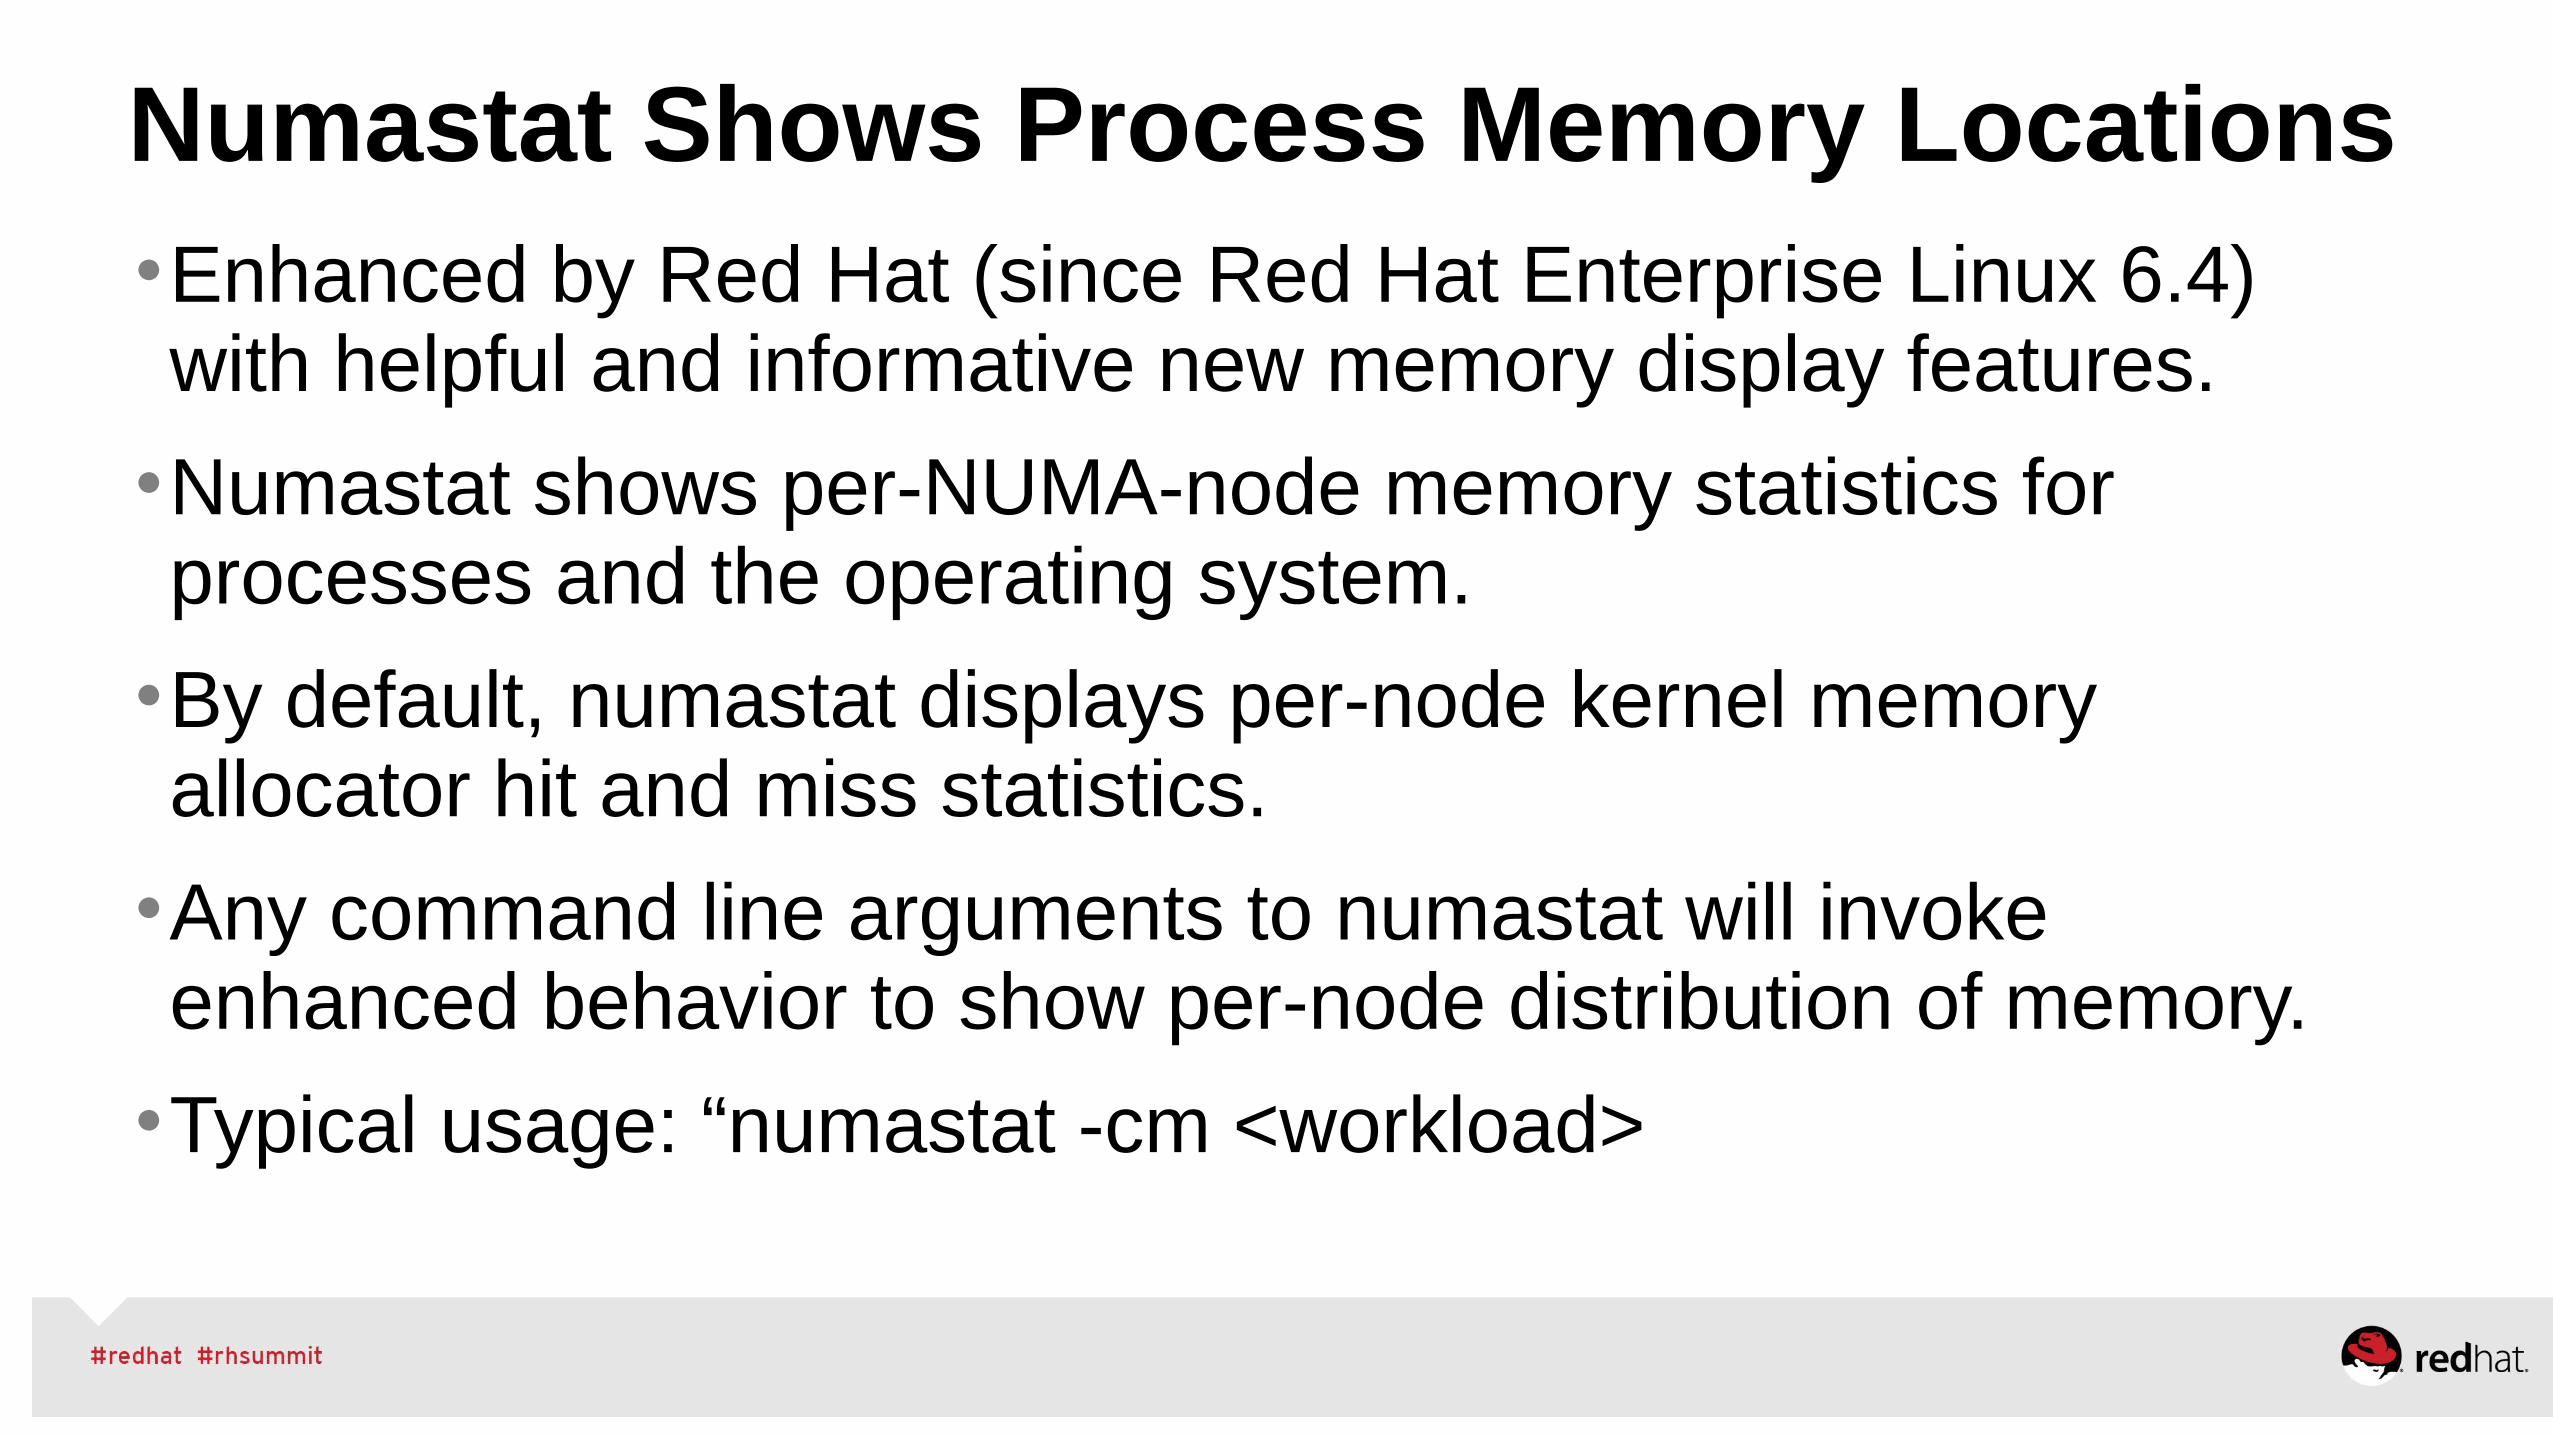
Numastat Shows Process Memory Locations•Enhanced by Red Hat (since Red Hat Enterprise Linux 6.4) with helpful and informative new memory display features.
•Numastat shows per-NUMA-node memory statistics for processes and the operating system.
•By default, numastat displays per-node kernel memory allocator hit and miss statistics.
•Any command line arguments to numastat will invoke enhanced behavior to show per-node distribution of memory.
•Typical usage: “numastat -cm <workload>

numastat shows need for NUMA management# numastat -c qemu Per-node process memory usage (in Mbs)
PID Node 0 Node 1 Node 2 Node 3 Total--------------- ------ ------ ------ ------ -----10587 (qemu-kvm) 1216 4022 4028 1456 1072210629 (qemu-kvm) 2108 56 473 8077 1071410671 (qemu-kvm) 4096 3470 3036 110 1071210713 (qemu-kvm) 4043 3498 2135 1055 10730--------------- ------ ------ ------ ------ -----Total 11462 11045 9672 10698 42877
# numastat -c qemu
Per-node process memory usage (in Mbs)
PID Node 0 Node 1 Node 2 Node 3 Total--------------- ------ ------ ------ ------ -----10587 (qemu-kvm) 0 10723 5 0 1072810629 (qemu-kvm) 0 0 5 10717 1072210671 (qemu-kvm) 0 0 10726 0 1072610713 (qemu-kvm) 10733 0 5 0 10738--------------- ------ ------ ------ ------ -----Total 10733 10723 10740 10717 42913
aligned
unaligned

What about my processes and threads?Two ways to see “where it last ran”.
1) ps -T -o pid,tid,psr,comm <pid># ps -T -o pid,tid,psr,comm `pidof pig`
PID TID PSR COMMAND 3175391 3175391 73 pig 3175391 3175392 1 pig 3175391 3175393 25 pig 3175391 3175394 49 pig 3175391 3175395 74 pig 3175391 3175396 2 pig 3175391 3175397 26 pig 3175391 3175398 50 pig 3175391 3175399 75 pig 3175391 3175400 3 pig
2) Run “top”, then enter “f”, then select “Last used cpu” field
”Last Ran CPU” column

Tips for Good NUMA Performance
•Never disable NUMA in the BIOS. Keep BIOS interleaved memory OFF (which should be the system BIOS default)
•Else OS will see only 1-NUMA node!
•Understand your system hardware NUMA topology, and basic operation and implications of NUMA
•(e.g. per-node resources, and zone_reclaim_mode setting)
•Know your workload resource consumption. If possible, size parallel jobs to fit entirely in NUMA nodes.
•Use appropriate tuning if necessary to control placement.

•Controls NUMA specific memory allocation policy
•To see current setting: cat /proc/sys/vm/zone_reclaim_mode
•Turn ON: echo 1 > /proc/sys/vm/zone_reclaim_mode
• Reclaim memory from local node rather than allocating from next node
•Turn OFF: echo 0 > /proc/sys/vm/zone_reclaim_mode
• Allocate from all nodes before reclaiming memory•Default is set at boot time based on NUMA factor
•In Red Hat Enterprise Linux 6.6+ and 7+, the default is usually OFF – because this is better for many applications
zone_reclaim_mode

•Low-memory SPEC CPU loses huge performance with wrong zone reclaim mode setting! Several benchmarks off more than 40%.
• (BTW, Don't run SPEC CPU with low memory!!)
zone_reclaim_mode (continued)

Techniques to control placement:
numactl: •Control NUMA policy for processes or shared memory:
taskset: •Retrieve or set a process's CPU affinity
sched_getaffinity(), sched_setaffinity() • for process affinity from within program
mbind(), get_mempolicy(), set_mempolicy()•set default NUMA memory policy for a process children.

Numactl
•The numactl command can launch commands with static NUMA memory and execution thread alignment • # numactl -m <NODES> -N <NODES> <Workload>
•Can specify devices of interest to process instead of explicit node list
•Numactl can interleave memory for large monolithic workloads• # numactl --interleave=all <Workload>
# numactl -m 6-7 -N 6-7 numactl --showpolicy: bindpreferred node: 6physcpubind: 60 61 62 63 64 65 66 67 68 69 70 71 72 73 74 75 76 77 78 79 cpubind: 6 7 nodebind: 6 7 membind: 6 7
# numactl -m netdev:ens6f2 -N netdev:ens6f2 numactl --showpolicy: bindpreferred node: 2physcpubind: 20 21 22 23 24 25 26 27 28 29 cpubind: 2 nodebind: 2 membind: 2
# numactl -m file:/data -N file:/data numactl --showpolicy: bindpreferred node: 0physcpubind: 0 1 2 3 4 5 6 7 8 9 cpubind: 0 nodebind: 0 membind: 0
# numactl --interleave=4-7 -N 4-7 numactl --showpolicy: interleavepreferred node: 5 (interleave next)interleavemask: 4 5 6 7 interleavenode: 5physcpubind: 40 41 42 43 44 45 46 47 48 49 50 51 52 53 54 55 56 57 58 59 60 61 62 63 64 65 66 67 68 69 70 71 72 73 74 75 76 77 78 79 cpubind: 4 5 6 7 nodebind: 4 5 6 7 membind: 0 1 2 3 4 5 6 7
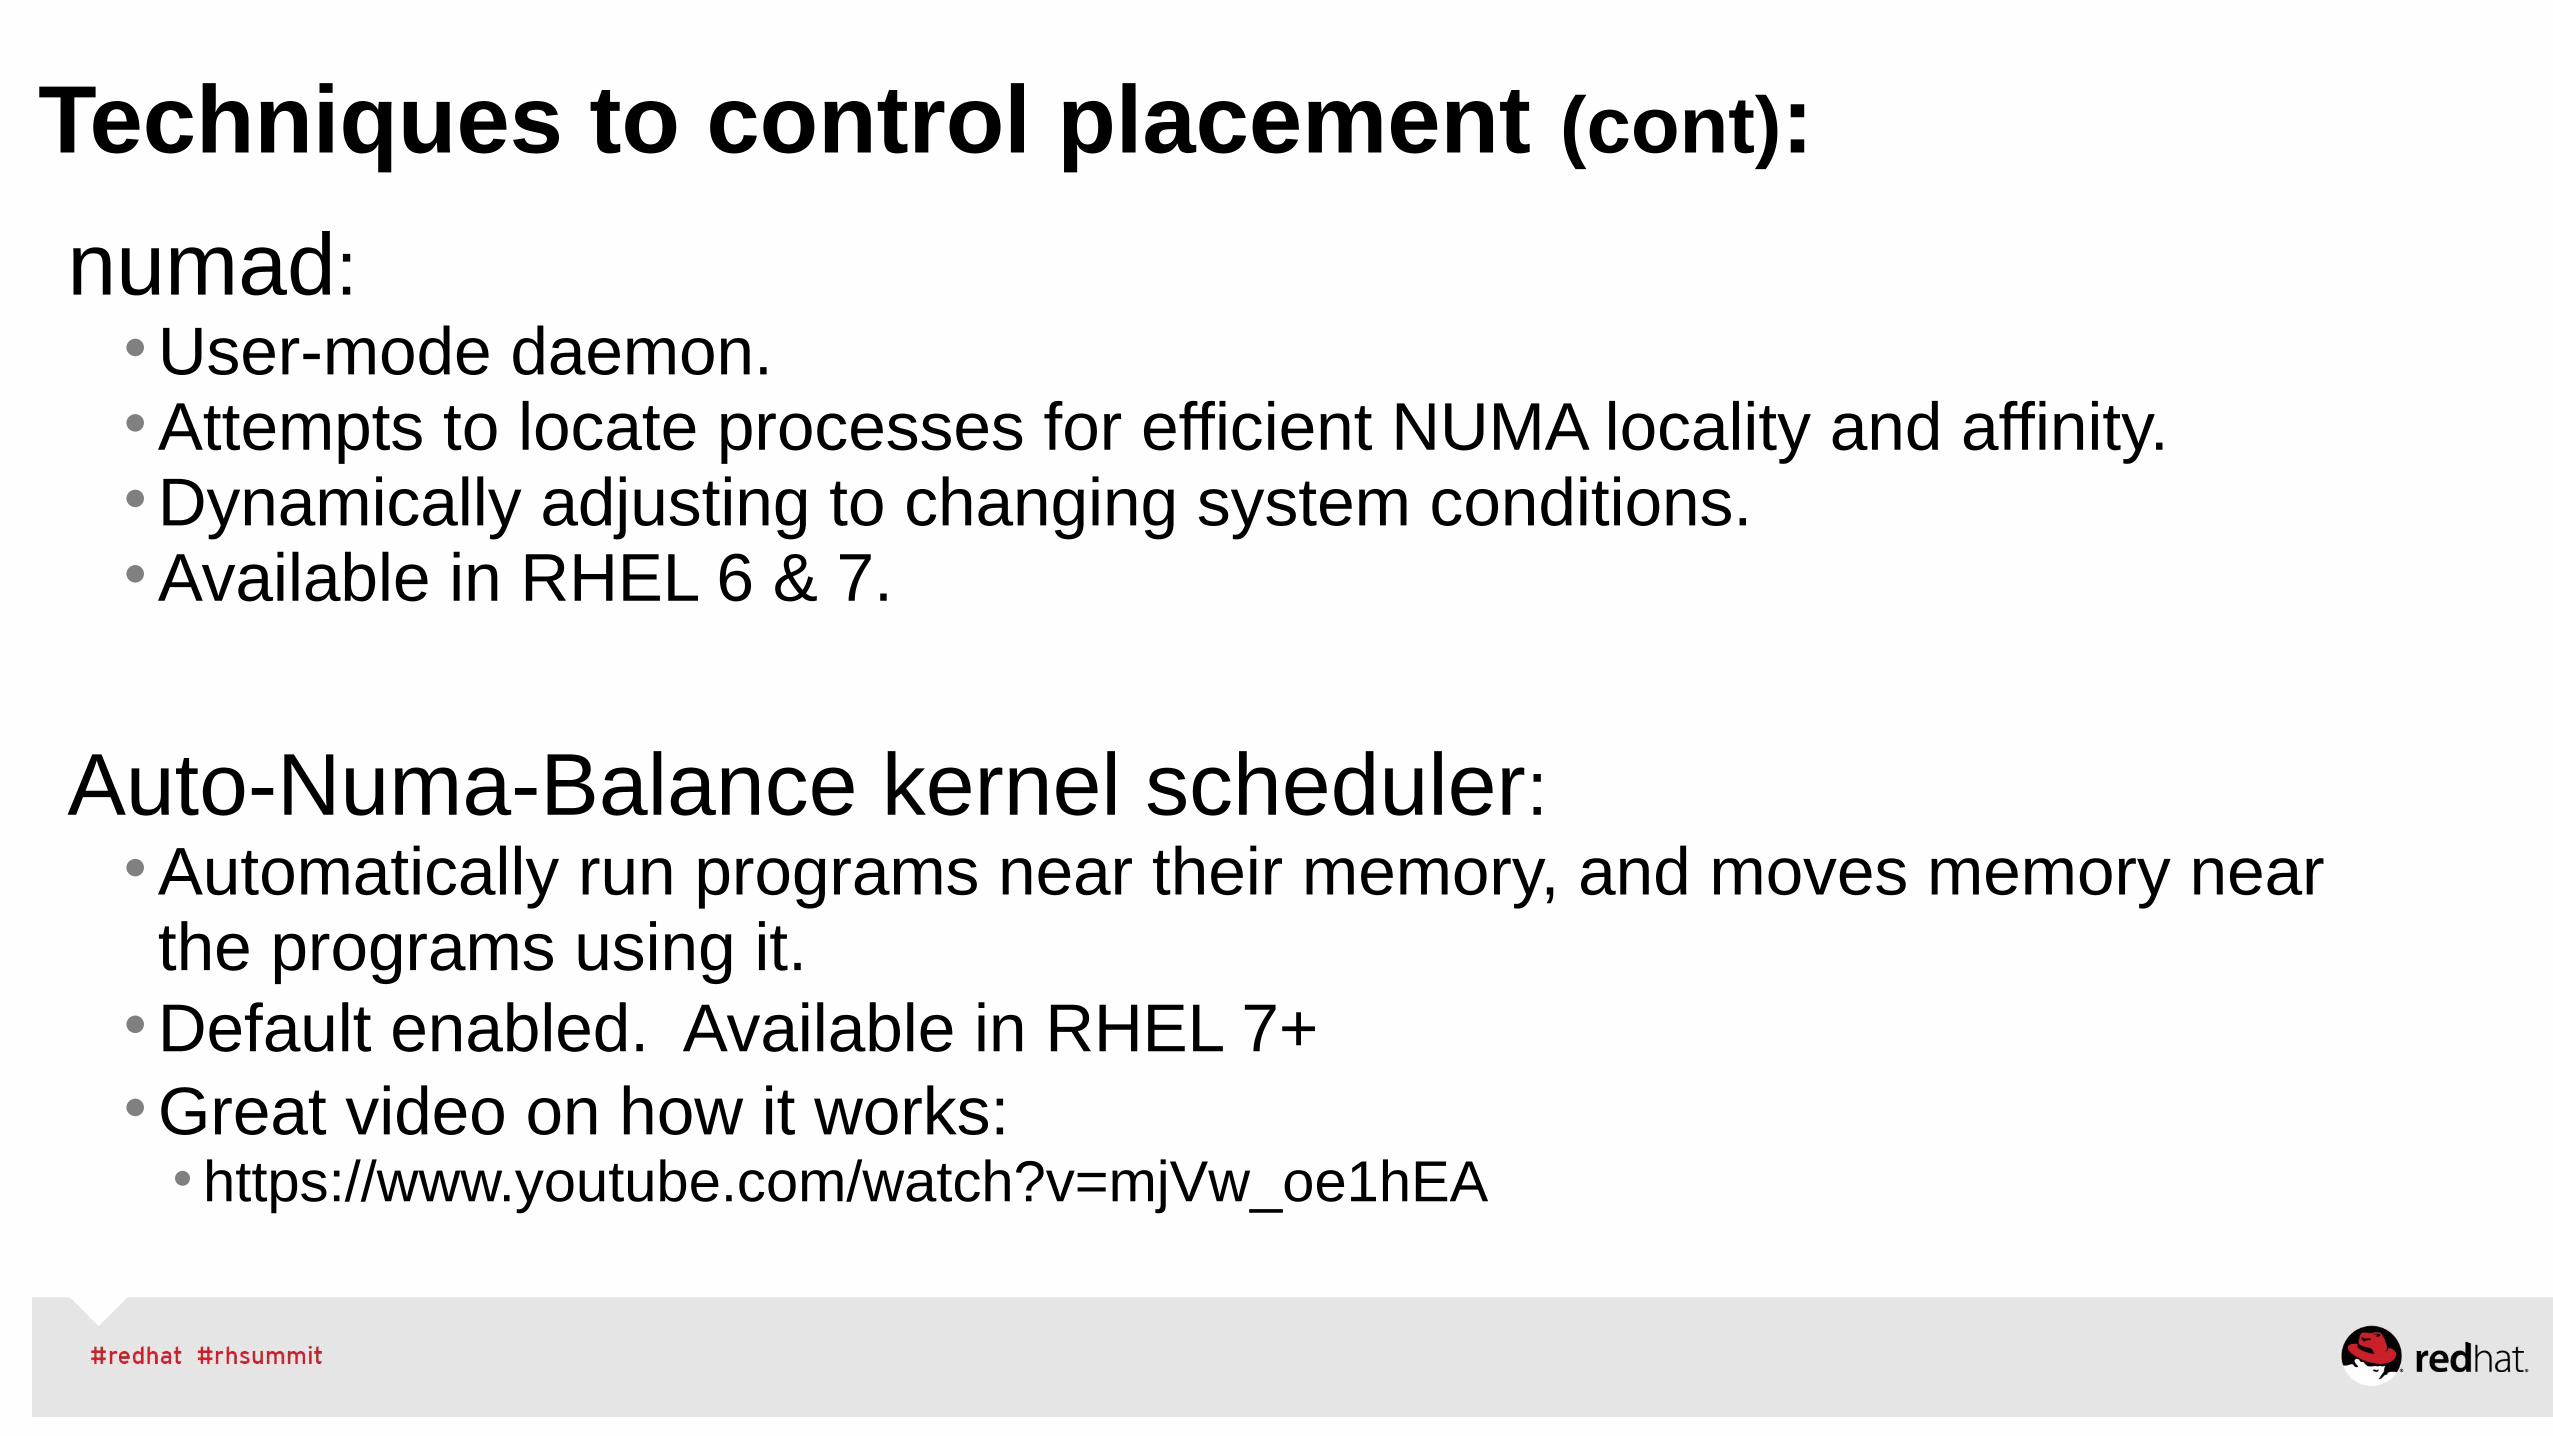
Techniques to control placement (cont):
numad:•User-mode daemon. •Attempts to locate processes for efficient NUMA locality and affinity.•Dynamically adjusting to changing system conditions.•Available in RHEL 6 & 7.
Auto-Numa-Balance kernel scheduler:•Automatically run programs near their memory, and moves memory near the programs using it.
•Default enabled. Available in RHEL 7+•Great video on how it works:
• https://www.youtube.com/watch?v=mjVw_oe1hEA

NUMA Alignment Makes SPECjbb2005 2x Faster
1 2 3 4 5 6 7 8 9 10 11 12 13 140
100000
200000
300000
400000
500000
600000
Multi-instance Java Workload
No NUMA
Autonuma (Default)
Numad
Numactl
Warehouses
Th
rou
gh
pu
t p
er
Ins
tan
ce

NUMA tuning for KVM / Containers is the same!
•Best performance is achieved if the size of the guest/container can fit into a single NUMA node.
•In RHEL7, auto-numa kernel scheduler will try to move guest to one node.
•Great doc with numerous examples: See the NUMA chapter in:
Red Hat Virtualization Tuning and Optimization Guide

RHEL Network Performance

Children
Parents
latency-performance
Network Tuned Profiles
network-latency
Children
Parents
throughput-performance
network-throughput
For throughput For latency
Network-throughput: • Inherits system tunables for throughput.• Bumps network tunables for increased network throughput.
Network-latency: • Inherits system tunables for latency• Bumps network tunables for latency• Disables:
• transparent hugepages • kernel numa balancing.
Red Hat Performance Engineering
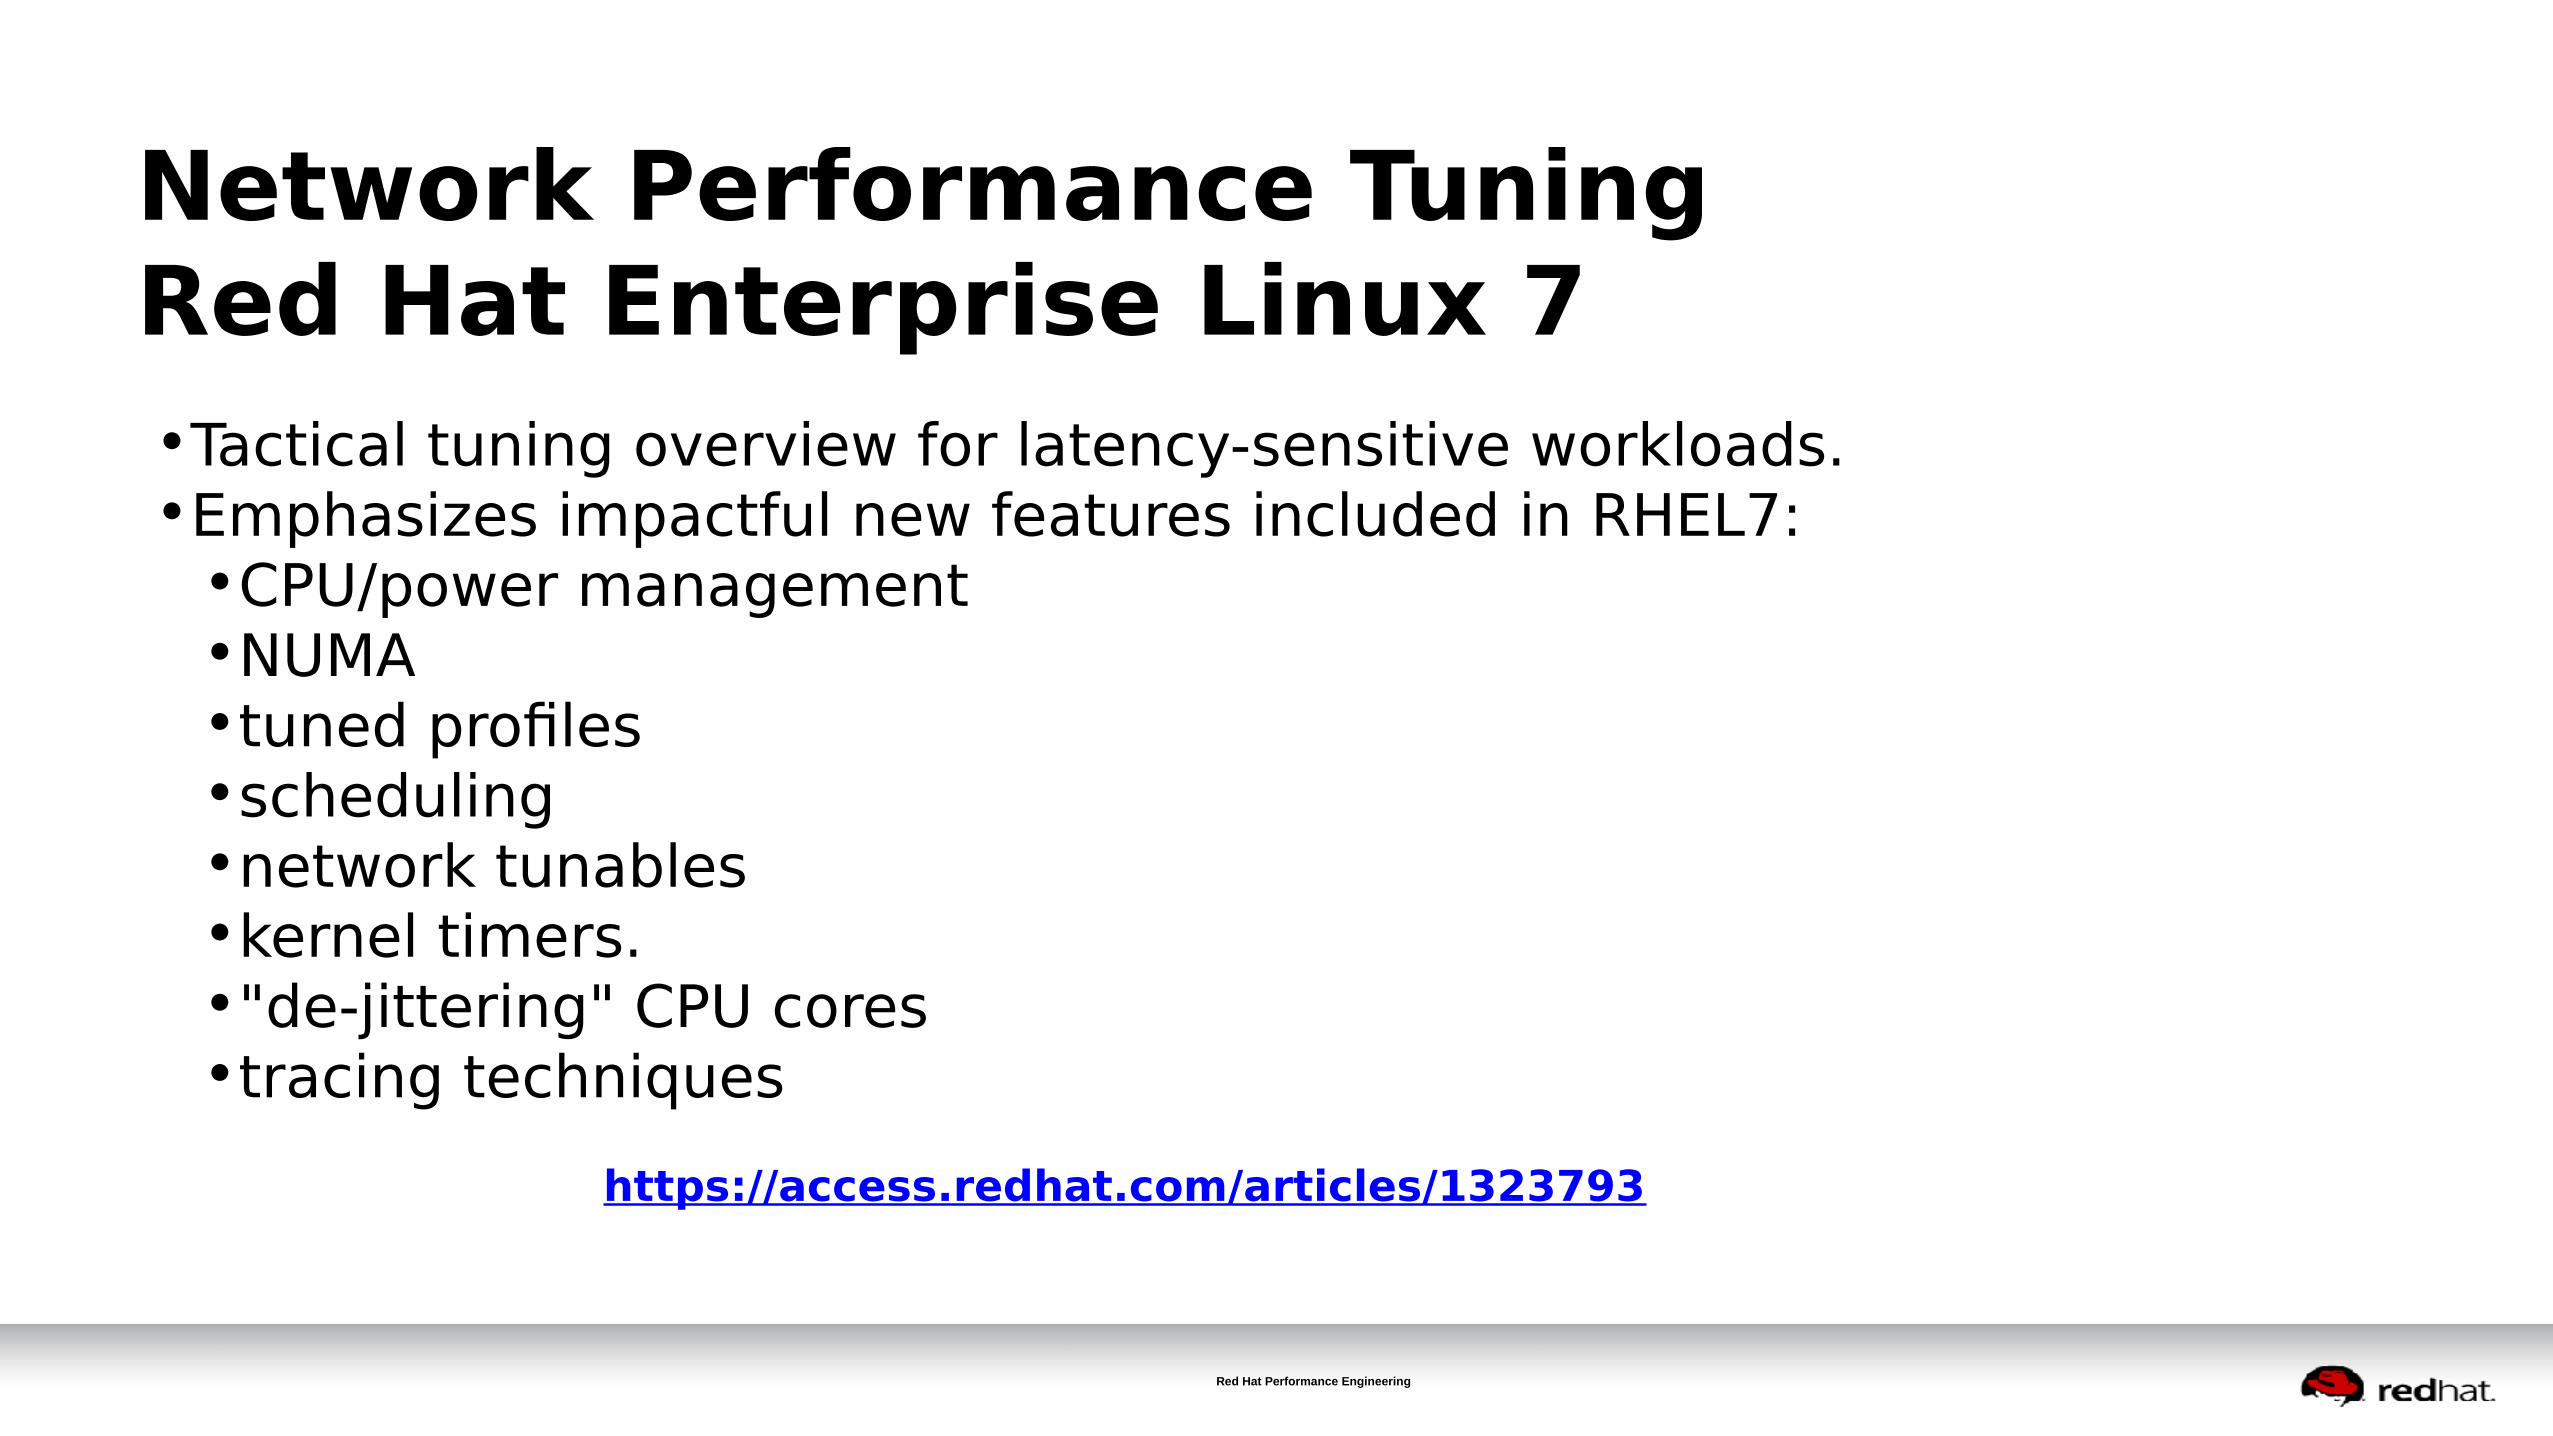
Network Performance Tuning Red Hat Enterprise Linux 7•Tactical tuning overview for latency-sensitive workloads.•Emphasizes impactful new features included in RHEL7:
•CPU/power management•NUMA•tuned profiles•scheduling•network tunables•kernel timers.•"de-jittering" CPU cores•tracing techniques
https://access.redhat.com/articles/1323793

RED HAT CONFIDENTIAL | Joe Mario#rhconvergence
40
Performance Optimizations in RHEL7
• busy_poll – new default
• tcp_fastopen● Reduce 1 round trip of handshake setting up TCP connection.
• nohz_full (tickless while active)● Timer ticks only on boot cpu or selected cpus
• Byte Queue Limits● Control bufferbloat in network queues● Helps tune high prio packets to get delivered w/reasonable latency

RHEL7 BUSY_POLL Socket Options
Baseline SO_BUSY_POLL0
10000
20000
30000
40000
50000
60000
70000
80000
netperf TCP_RR and UDP_RR Transactions/sec
TCP_RR-RXTCP_RR-TXUDP_RR-RXUDP_RR-TX
Tra
ns
/se
c
● Socket-layer code polls receive queue of NIC
● Replaces interrupts and NAPI
● Retains full capabilities of kernel network stack
● Set globally by tuned network-latency
To test if your device supports it: # ethtool -k device | grep "busy-poll"
If this returns busy-poll: on [fixed], busy polling is available on the device.

0
50
100
150
200
250
Max
Tuned: Network-Latency Performance Boost
C6 C3 C1 C0
Late
ncy
(Mic
rose
cond
s)
C-state lock improves determinism, reduces jitter
Time (1-sec intervals)

# tuned-adm profile throughput-performance
# turbostat sleep 5
Bzy_MHz TSC_MHz SMI CPU%c1 CPU%c3 CPU%c6
1866 2600 0 0.22 0.01 99.71
# tuned-adm profile network-latency
# turbostat sleep 5
Bzy_MHz TSC_MHz SMI CPU%c1 CPU%c3 CPU%c6
3108 2600 0 99.99 0.00 0.00
Turbostat: Idle States and Frequencies on Intel CPUs

RHEL7 nohz_full● Patchset Goal:
–Stop interrupting userspace tasks
–Move timekeeping to non-latency-sensitive cores
–
● If nr_running=1, then scheduler/tick can avoid that core
● Default disabled...Opt-in via nohz_full cmdline option
● Kernel Tick:● timekeeping (gettimeofday)● Scheduler load balancing● Memory statistics (vmstat)

Red Hat Performance Engineering
RHEL 7 nohz_full
No No No No No No NoTick Tick Tick Tick Tick Tick Tick Tick
Userspace Task Timer Interrupt Tick
Time (CONFIG_HZ=1000)
Task is interrupted

RHEL Network NFV – DPDK + OVS

RED HAT CONFIDENTIAL | D. John Shakshober#rhconvergence
47
DPDK+OVS – kernel bypass, poll mode driverRHEL 7.3 vhostuser – OVS 2.6 multi-queue
Upstream ovs-dpdk (2.6), Intel 10Gb 64-byte frames22.7 Million packets per second!OVS: 8 cores (16 threads), 2 bridges, each using 4 i40e PMD threads + 4 vhostuser PMD threadsVM 4: cores (8 threads), 2 vhostuser interfaces, each using 4 virtio PMD thread
VM L2fwdPMD
openvswitch
vhostuserPMD
linux kernel vfio
i40e PMD
hardware IntelXL710
New

64 256 512 1024 15000
2
4
6
8
10
12
14
0
2
4
6
8
10
12
14
16
18
WHY DPDK+OVS ? RHEL7.3 KVM kernel vs DPDK
(Intel Haswell EP, 20c, 256 MB mem, 2-10Gb Nic, uni-directional .002% loss
Vihost-user DPDK Mpps
Kernel Mpps
DPDK cores
Kernel cores
Packet Size (Bytes)
Mill
ion
Pac
kets
per
Sec
on
d (
Mp
ps)
Per
cen
t C
PU
Util
tizat
ion

New “cpu-partitioning” tuned profile
• Do you have a latency sensitive application to tune for?
• If so:
• Decide which cpus you want to allocated to it.
• Add those cpus to a tuned configuration file.
• Then reboot!
• A highly tuned low latency system with cores dedicated to your application.
• Numerous tedious tuning steps now handled by tuned!
New in7.4

Turkcell - Annex 4 - Reference Design50
System Partitioning
VNF Mobile Network - Graphical CPU Partitioning
0 40 1 41 2 42 3 43
4 44 5 45 6 46 7 47
8 48 9 49 10 50 11 51
12 52 13 53
20 60 21 61 22 62 23 63
24 64 25 65 26 66 27 67
28 68 29 69 30 70 31 71
32 72 33 73
QPI
14 54 15 55
16 56 17 57 18 58 19 59
34 74 35 75
36 76 37 77 38 78 39 79
Physical core
CPU Thread
KernelBackground activities
Kernel InterruptsOVS Background process
PMD Threads VNF NUMA 0 Threads VNF NUMA 1 ThreadsQEMU emulation process

Cpu-partitioning – What the profile does for you. •After reboot you have:
1) Cpus dedicated to your application are isolated (not via the isolcpus boot flag)
2) IRQs, RCU callbacks, kernel dirty page threads - all moved off the isolated cpus
3) nohz_full set on the isolated cpus
4) CPU frequency scaling set to maximum allowed
5) MCE interrupts disabled
6) Kernel workqueue requests moved off isolated cpus
7) Kernel numa_balance and transparent hugepages disabled
8) Various KVM options set to reduce latency and to remove unwanted VM Exits and interrupts
9) Numerous SYSCTL parameters set to optimal low latency values
• Repeatable, automated, and very cool!

RHOP 10 w/ DPDK17.01 + OVS 2.6 L2 Forward tuned-adm profile=cpu-partitioning – 0.002% packet loss
openvswitch
PCI NIC
PCI NIC
de-queueingen-queueing
vhostpci
virtio-ring
polling thread
pci
VM
virtio-ring
vhost
virtio virtio
virtio-ring
VM
virtio-ring
virtio virtio
vhost vhost
10GSFP+Cu
Framesize
%loss
%loss
Mpps/core
@0.002% loss
64 22.93[1] 15.41 5.73
256 9.04 19.96 2.26
1024 2.39 19.96 0.59
1500 1.63 19.88 0.40
(Intel Haswell EP, 20c, 256 MB mem, 2-10Gb Nic, uni-directional .002% loss
[1] Dual-port Intel 82599 based adapters are hardware limited to ~23Mpps

Noisy Cacheline NeighborCache Allocation & Cache Monitoring Technology
Hi Priority Program
LO PriorityProgram
CPU 0 CPU 1
Shared Last Level Cache: (Low Priority Program gets more cache)
Hi Priority Program
LO PriorityProgram
CPU 0 CPU 1
Shared Last Level Cache: (HIGH Priority Program gets more cache)
Available in RHEL 7.4 via the intel-cmt-cat-*.el7 package.See ‘man pqos’Intel only. Recent CPU models.
VS:
New in7.4

Memory latency testing using CAT

System Tuning Tool - tuna
● Tool for fine grained control
● Display applications / processes
● Displays CPU enumeration
● Socket (useful for NUMA tuning)
● Dynamic control of tuning
● Process affinity
● Parent & threads
● Scheduling policy
● Device IRQ priorities, etc

tuna command line

Tuna – command line examplesMove an irq to cpu 5
• tuna -c5 -q eth4-rx-4 –move
Move all irqs named “eth4*” away from numa node 1• tuna -S 1 -i -q ‘eth4*’
Move all rcu kernel threads to cpus 1 and 3• tuna -c1,3 -t ‘*rcu*’ --move

Tuna GUI Capabilities Updated for RHEL7

Performance Tools - Perf

Partial list of available pre-defined perf events

Most commonly used perf commands:

Example: perf record• Record system-wide (-a)
•perf record -a sleep 10•perf record -a // Hit ctrl-c when done.
• Or record a single command•perf record myapp.exe
• Or record an existing process (-p)•perf record -p <pid>
• Or add call-chain recording (-g)•perf record -g ls -rl /root
• Or only record specific events (-e)•perf record -e branch-misses -p <pid>
Followed by: perf report •perf report [options]

perf report
/dev/zero
oflag=direct

perf top
System-wide 'top' view of busy functions

perf diff / schedCompare 2 perf recordings
grep for something interesting, maybe to see what numabalance is doing ?
RED HAT CONFIDENTIAL | Joe Mario#rhconvergence
66
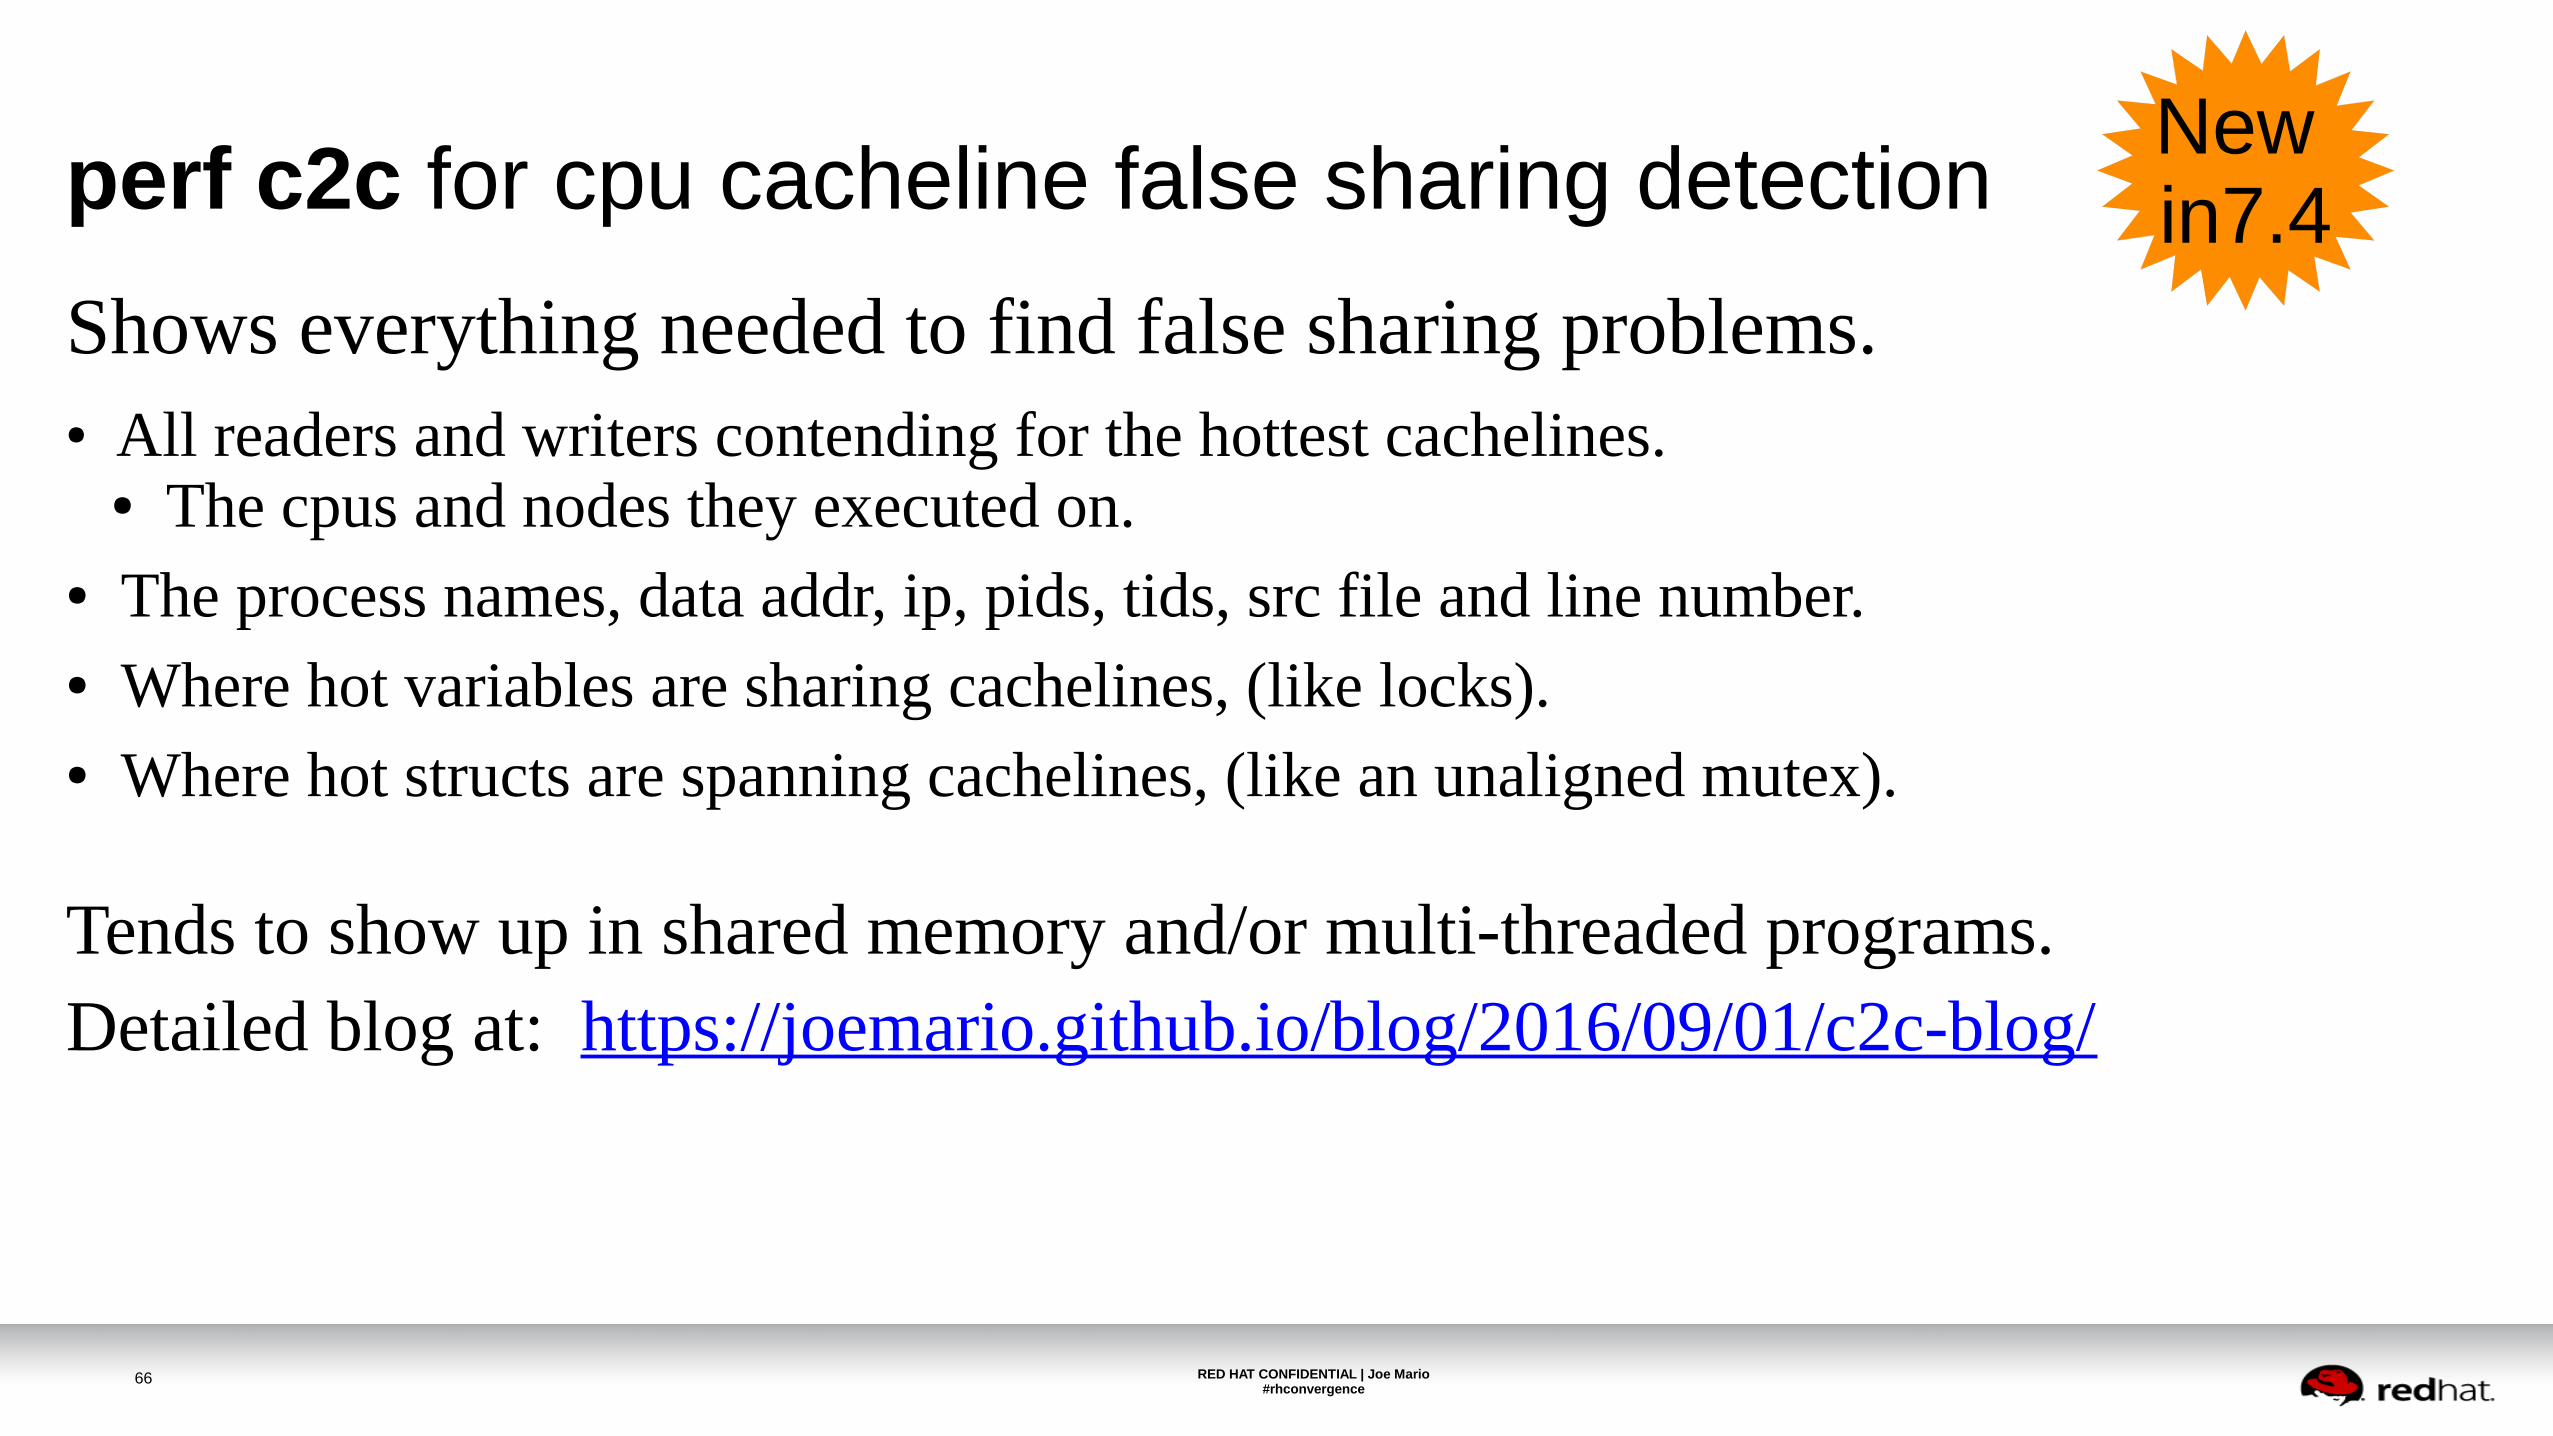
perf c2c for cpu cacheline false sharing detection
Shows everything needed to find false sharing problems.● All readers and writers contending for the hottest cachelines.
● The cpus and nodes they executed on.● The process names, data addr, ip, pids, tids, src file and line number.● Where hot variables are sharing cachelines, (like locks).● Where hot structs are spanning cachelines, (like an unaligned mutex). Tends to show up in shared memory and/or multi-threaded programs.Detailed blog at: https://joemario.github.io/blog/2016/09/01/c2c-blog/
New in7.4

Jiri Olsa, Joe Mario67
CPU Cacheline False Sharing – 101
CPU0CPU0
Memory
LLC (last level cache)
CPU0CPU1 CPU0CPU2 CPU0CPU3
CPU0 L1 CPU0L1 CPU0L1 CPU0L1CPU0 L2 CPU0L2 CPU0L2 CPU0L2
CPU0CPU4
Memory
LLC (last level cache)
CPU0CPU5 CPU0CPU6 CPU0CPU7
CPU0L1 CPU0L1 CPU0L1 CPU0L1CPU0L2 CPU0L2 CPU0L2 CPU0L2
writer
reader
Reader thread
Writer thread
64 Bytes of data in memory.
Two numa node system

Jiri Olsa, Joe Mario68
If the “writer” is truly hot, break it up.
CPU0CPU0
Memory
LLC (last level cache)
CPU0CPU1 CPU0CPU2 CPU0CPU3
CPU0 L1 CPU0L1 CPU0L1 CPU0L1CPU0 L2 CPU0L2 CPU0L2 CPU0L2
CPU0CPU4
Memory
LLC (last level cache)
CPU0CPU5 CPU0CPU6 CPU0CPU7
CPU0L1 CPU0L1 CPU0L1 CPU0L1CPU0L2 CPU0L2 CPU0L2 CPU0L2
writer
pad
pad
pad
pad
pad
pad
pad
Reader thread
Writer thread
reader
pad
pad
pad
pad
pad
pad
pad

64 byte cache line
Node 0
int a; offset 0 mutex offset 8 mutex offset 16 mutex offset 24 mutex offset 32 mutex offset 40 long b; offset 48 long seq_cnt; offset 56
CPU CPU CPU CPU CPU CPU CPU CPU ...
Node 1 CPU CPU CPU CPU CPU CPU CPU CPU ...
Node 2 CPU CPU CPU CPU CPU CPU CPU CPU ...
Node 3 CPU CPU CPU CPU CPU CPU CPU CPU ...
We often see this:

Summary - Red Hat Enterprise Linux – Part 1
•Red Hat Enterprise Linux – Containers are Linux
• RHEL x86 evolution, autoNUMA, Hugepages, IRQ pin, tuned profiles
• NonUniform Memory Access (NUMA), numactl, numad, autonuma
• Network Performance
• RHEL 7 Network tuning via tuned, try noHZ_full to reduce jitter• RHEL/KVM DPDK + OVS 2.6 multiQ, 0% packet loss in OSP10.
• Tuna - IRQ placement, alter device affinities, process priorities
• Perf – monitoring BW, cache-line tears, C-2-C analysis
•Q+A at “Meet The Experts” - Free as in Soda/Beer/Wine

Agenda: Performance Analysis Tuning Part II
• Part II - Containers are Linux, run/optimized and tuned just like Linux.
• What is NUMA, RHEL Architecture, Auto-NUMA-Balance
• Disk IO – IO elevators, sawpiness, dirty ratios, readahead, multi-Q
• Scheduler tunables – new features
• HugePages - Static, Transparent, variable sized 4K/2MB/1GB
• Cgroups cpuset, memory, network and IO
• Use to prevent IO from consuming 95% of memory• R+D GPUoffload, OpenHPC, multi-arch – Bill
• Containers / Other preso's
•“Performance + Scale Experts” - Room 205C 5:30-7 PM
• Free - Soda/Beer/Wine

Mapping tuned profiles to Red Hat's product portfolio
RHEL Desktop/Workstationbalanced
RHV Host, Guestvirtual-host/guest
Red Hat Storagerhs-high-throughput, virt
RHEL Atomicatomic-host, atomic-guest
RHEL Server/HPCthroughput-performance
RHVvirtual-host
RHOSP (compute node)virtual-host
OpenShiftopenshift-master, node
RHEL for Real Timerealtime
RHEL for Real Time KVM-RT
realtime-virtual-host/guest
RHEL + SAP
sap / sap-hana
RHOP - NFV (compute node)cpu-partitioning
New in7.4

NUMA Nodes and Zones
End of RAM
Normal Zone
Normal Zone
4GB DMA32 Zone
16MB DMA Zone
64-bit
Node 0
Node 1

Per Node / Zone split LRU Paging Dynamics
anonLRU
fileLRU
INACTIVEFREE
User Allocations
Reactivate
Page aging
swapout
flush
Reclaiming
User deletions
anonLRU
fileLRU
ACTIVE

Interaction between VM Tunables and NUMA● Dependent on NUMA: Reclaim Ratios
/proc/sys/vm/swappiness/proc/sys/vm/min_free_kbytes
/proc/sys/vm/zone_reclaim_mode
● Independent of NUMA: Reclaim Ratios/proc/sys/vm/vfs_cache_pressure
● Writeback Parameters/proc/sys/vm/dirty_background_ratio/proc/sys/vm/dirty_ratio
● Readahead parameters /sys/block/<bdev>/queue/read_ahead_kb

• Controls how aggressively the system reclaims anonymous memory versus pagecache memory:
● Anonymous memory – swapping and freeing● File pages – writing if dirty and freeing● System V shared memory – swapping and freeing
• Default is 60
• Decrease: more aggressive reclaiming of pagecache memory
• Increase: more aggressive swapping of anonymous memory
• Can effect Numa nodes differently.
• Tuning not as necessary on RHEL7 than RHEL6 and even less than RHEL5
swappiness

Memory reclaim Watermarks
All of RAM
Do nothing
Pages High – kswapd sleeps above High
kswapd reclaims memory
Pages Low – kswapd wakesup at Low
Wakeup kswapd and it reclaims memory
Pages Min – all memory allocators reclaim at Min user processes/kswapd reclaim memory0
Free memory list

Directly controls the page reclaim watermarks in KB
Distributed between the Numa nodes
Defaults are higher when THP is enabled
min_free_kbytes
# cat /proc/sys/vm/min_free_kbytes90100-----------------------------------------------------------Node 0 DMA min:80 low:100kB high:120kBNode 0 DMA32 min:15312kB low:19140kB high:22968kBNode 0 Normal min:29600kB low:37000kB high:44400kBNode 1 Normal min:45108kB low:56384kB high:67660kB----------------------------------------------------------- echo 180200 > /proc/sys/vm/min_free_kbytes----------------------------------------------------------2Node 0 DMA min:160kB low:200kB high:240kBNode 0 DMA32 min:30624kB low:38280kB high:45936kBNode 0 Normal min:59200kB low:74000kB high:88800kBNode 1 Normal min:90216kB low:112768kB high:135320kB-----------------------------------------------------------

RHEL Disk IO

I/O Tuning – Understanding I/O Elevators
• Deadline – new RHEL7 default for all profiles
•Two queues per device, one for read and one for writes
• I/Os dispatched based on time spent in queue
• CFQ – used for system disks off SATA/SAS controllers
•Per process queue
•Each process queue gets fixed time slice (based on process priority)
• NOOP – used for high-end SSDs (Fusion IO etc)
•FIFO
•Simple I/O Merging
•Lowest CPU Cost

Tuned: Profile throughput-performance (RHEL7 default)
throughput-performance
governor=performanceenergy_perf_bias=performancemin_perf_pct=100readahead=4096kernel.sched_min_granularity_ns = 10000000kernel.sched_wakeup_granularity_ns = 15000000vm.dirty_background_ratio = 10vm.swappiness=10

Iozone Performance effect of “tuned” EXT4/XFS/GFS
ext3 ext4 xfs gfs20
500
1000
1500
2000
2500
3000
3500
4000
4500
RHEL 7.1 3.10.0-253 File System In Cache Performance
Intel I/O (iozone - geoM 1m-4g, 4k-1m) not tuned
tuned
Th
rou
gh
pu
t in
MB
/Se
c
ext3 ext4 xfs gfs20
100
200
300
400
500
600
700
RHEL7 3.10.0-253 File System Out of Cache Performance
Intel I/O (iozone - geoM 1m-4g, 4k-1m) not tuned
tuned
Th
rou
gh
pu
t in
MB
/Se
c

SAS Application on Standalone Systems
RHEL 7 limits xfs most recommended
• Max file system size 500TB
• Max file size 100 TB
• Best performing
ext4 recommended
• Max file system size 50 TB
• Max file size 16 TB
ext3 not recommended
• Max file system size 16TB
• Max file size 2TBxfs-rhel6
xfs-rhel7ext3-rhel6
ext3-rhel7ext4-rhel6
ext4-rhel7gfs2-rhel6
gfs2-rhel70
2000
4000
6000
8000
10000
12000
14000
16000
18000
-100
-80
-60
-40
-20
0
20
6.18-4.05
4.94 9.59
SAS Mixed Analytics (RHEL6 vs RHEL7)perf 32 (2 socket) 16cpu x 48GB
TOTAL Time System Time
File system tested
Tim
e i
n s
ec
on
ds
(lo
we
r is
be
tte
r)

Tuning Memory – Flushing Caches•Drop unused Cache – to control pagecache dynamically
✔Frees most pagecache memory
✔File cache
✗If the DB uses cache, may notice slowdown
•NOTE: Use for benchmark environments.●Free pagecache
●# sync; echo 1 > /proc/sys/vm/drop_caches
●Free slabcache●# sync; echo 2 > /proc/sys/vm/drop_caches
●Free pagecache and slabcache●# sync; echo 3 > /proc/sys/vm/drop_caches

Per file system flush daemon
buffer
User space
Kernel
memory copy
pagecache
Read()/Write()
Flush daemon
File system
Pagecache page

Virtual Memory Manager (VM) Tunables
● Reclaim Ratios●/proc/sys/vm/swappiness●/proc/sys/vm/vfs_cache_pressure●/proc/sys/vm/min_free_kbytes
● Writeback Parameters●/proc/sys/vm/dirty_background_ratio●/proc/sys/vm/dirty_ratio
● Readahead parameters●/sys/block/<bdev>/queue/read_ahead_kb
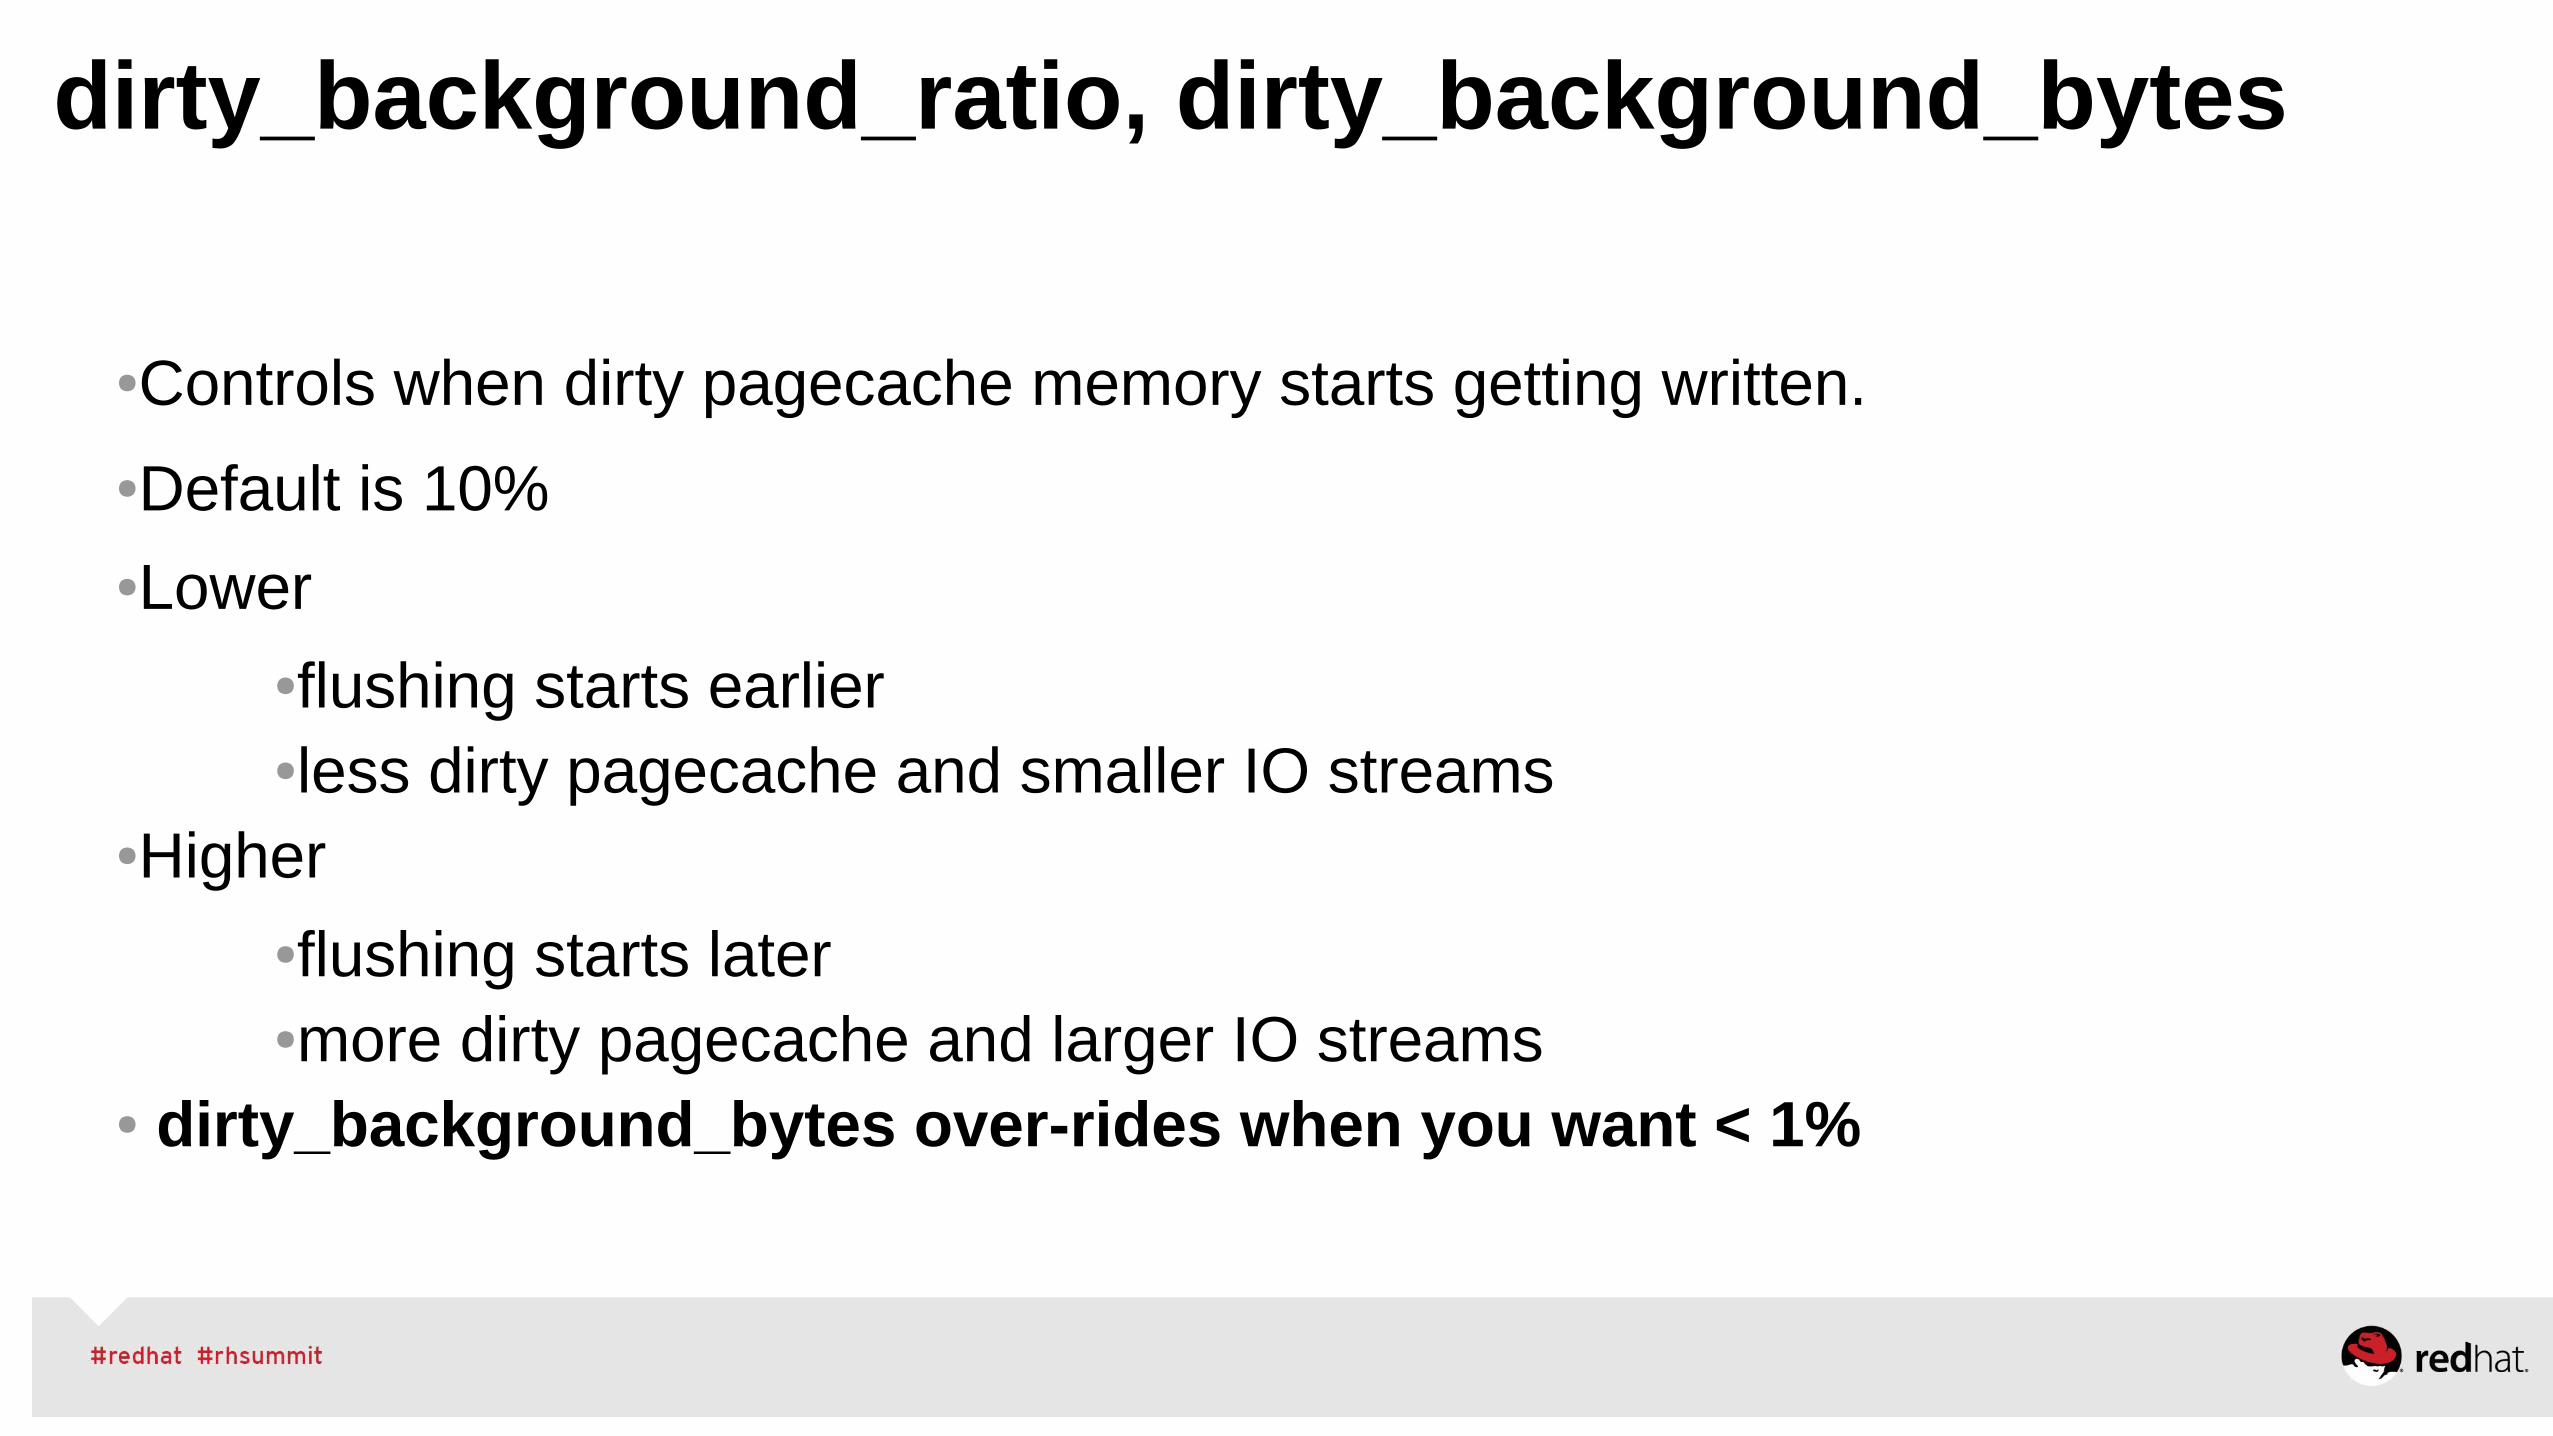
●Controls when dirty pagecache memory starts getting written.
●Default is 10%●Lower
●flushing starts earlier●less dirty pagecache and smaller IO streams
●Higher ●flushing starts later●more dirty pagecache and larger IO streams
● dirty_background_bytes over-rides when you want < 1%
dirty_background_ratio, dirty_background_bytes

dirty_ratio and dirty_background_ratio
100% of pagecache RAM dirty
flushd and write()'ng processes write dirty buffers
dirty_ratio(20% of RAM dirty) – processes start synchronous writes
flushd writes dirty buffers in background
dirty_background_ratio(10% of RAM dirty) – wakeup flushd
do_nothing
0% of pagecache RAM dirty

RHEL CFS Scheduler

RHEL Scheduler Tunables
Implements multiple red/black trees asrun queues for sockets and cores (asopposed to one run queue per processor or per system)
RHEL tunables● sched_min_granularity_ns● sched_wakeup_granularity_ns● sched_migration_cost● sched_child_runs_first● sched_latency_ns
Socket 1
Thread 0 Thread 1
Socket 2
Process
Process
Process
Process
Process
Process
Process
Process
Process
Process Process
Process
Scheduler Compute Queues
Socket 0
Core 0
Thread 0 Thread 1
Core 1
Thread 0 Thread 1

• RHEL6/7 Tuned-adm will increase quantum on par with RHEL5
–echo 10000000 > /proc/sys/kernel/sched_min_granularity_ns● Minimal preemption granularity for CPU bound tasks. See sched_latency_ns for details. The default value is 4000000 (ns).
–echo 15000000 > /proc/sys/kernel/sched_wakeup_granularity_ns● The wake-up preemption granularity.● Increasing this variable reduces wake-up preemption, reducing disturbance of compute bound tasks.
● Decreasing it improves wake-up latency and throughput for latency critical tasks, particularly when a short duty cycle load component must compete with CPU bound components. The default value is 5000000 (ns).
Finer Grained Scheduler Tuning

• Scheduler tries to keep all CPUs busy by moving tasks form overloaded CPUs to idle CPUs
• Detect using “perf stat”, look for excessive “migrations”
• /proc/sys/kernel/sched_migration_cost
–Amount of time after the last execution that a task is considered to be “cache hot” in migration decisions. A “hot” task is less likely to be migrated, so increasing this variable reduces task migrations. The default value is 500000 (ns).
– If the CPU idle time is higher than expected when there are runnable processes, try reducing this value. If tasks bounce between CPUs or nodes too often, try increasing it.
• Rule of thumb – increase by 2-10x to reduce load balancing (tuned does this)
• Use 10x on large systems when many CGROUPs are actively used (ex: RHEV/ KVM/RHOS)
Load Balancing

fork() behavior
sched_child_runs_first●Controls whether parent or child runs first●Default is 0: parent continues before children run.●Default is different than RHEL5
exit_10 exit_100 exit_1000 fork_10 fork_100 fork_10000.00
50.00
100.00
150.00
200.00
250.00
0.00%
20.00%
40.00%
60.00%
80.00%
100.00%
120.00%
140.00%
RHEL6 Effect of sched_migration cost on fork/exitIntel Westmere EP 24cpu/12core, 24 GB mem
usec/call default 500ususec/call tuned 4mspercent improvement
us
ec
/ca
ll
Pe
rce
nt

RHEL7.4 Core Kernel Features
● Deadline Scheduler● allows process to define when it must run.
● Persistent Memory● supports huge amounts of non-volitle RAM
●Qspinlock● prevents cacheline contention causes locking contention
●RWsemaphore locking● performance improvement to kernel r/w semaphores
●KASLR● kernel addr space randomization provide better security
New in7.4

RHEL VM HugePages

• Standard HugePages 2MB
– Reserve/free via ● /proc/sys/vm/nr_hugepages● /sys/devices/node/* /hugepages/*/nrhugepages
– Used via hugetlbfs
• GB Hugepages 1GB
– Reserved at boot time/no freeing
– RHEL7 allows runtime allocation & freeing
– Used via hugetlbfs
• Transparent HugePages 2MB
– On by default via boot args or /sys
– Used for anonymous memory
RHEL Hugepages/ VM Tuning
Physical Memory
Virtual AddressSpace
TLB
128 data128 instruction
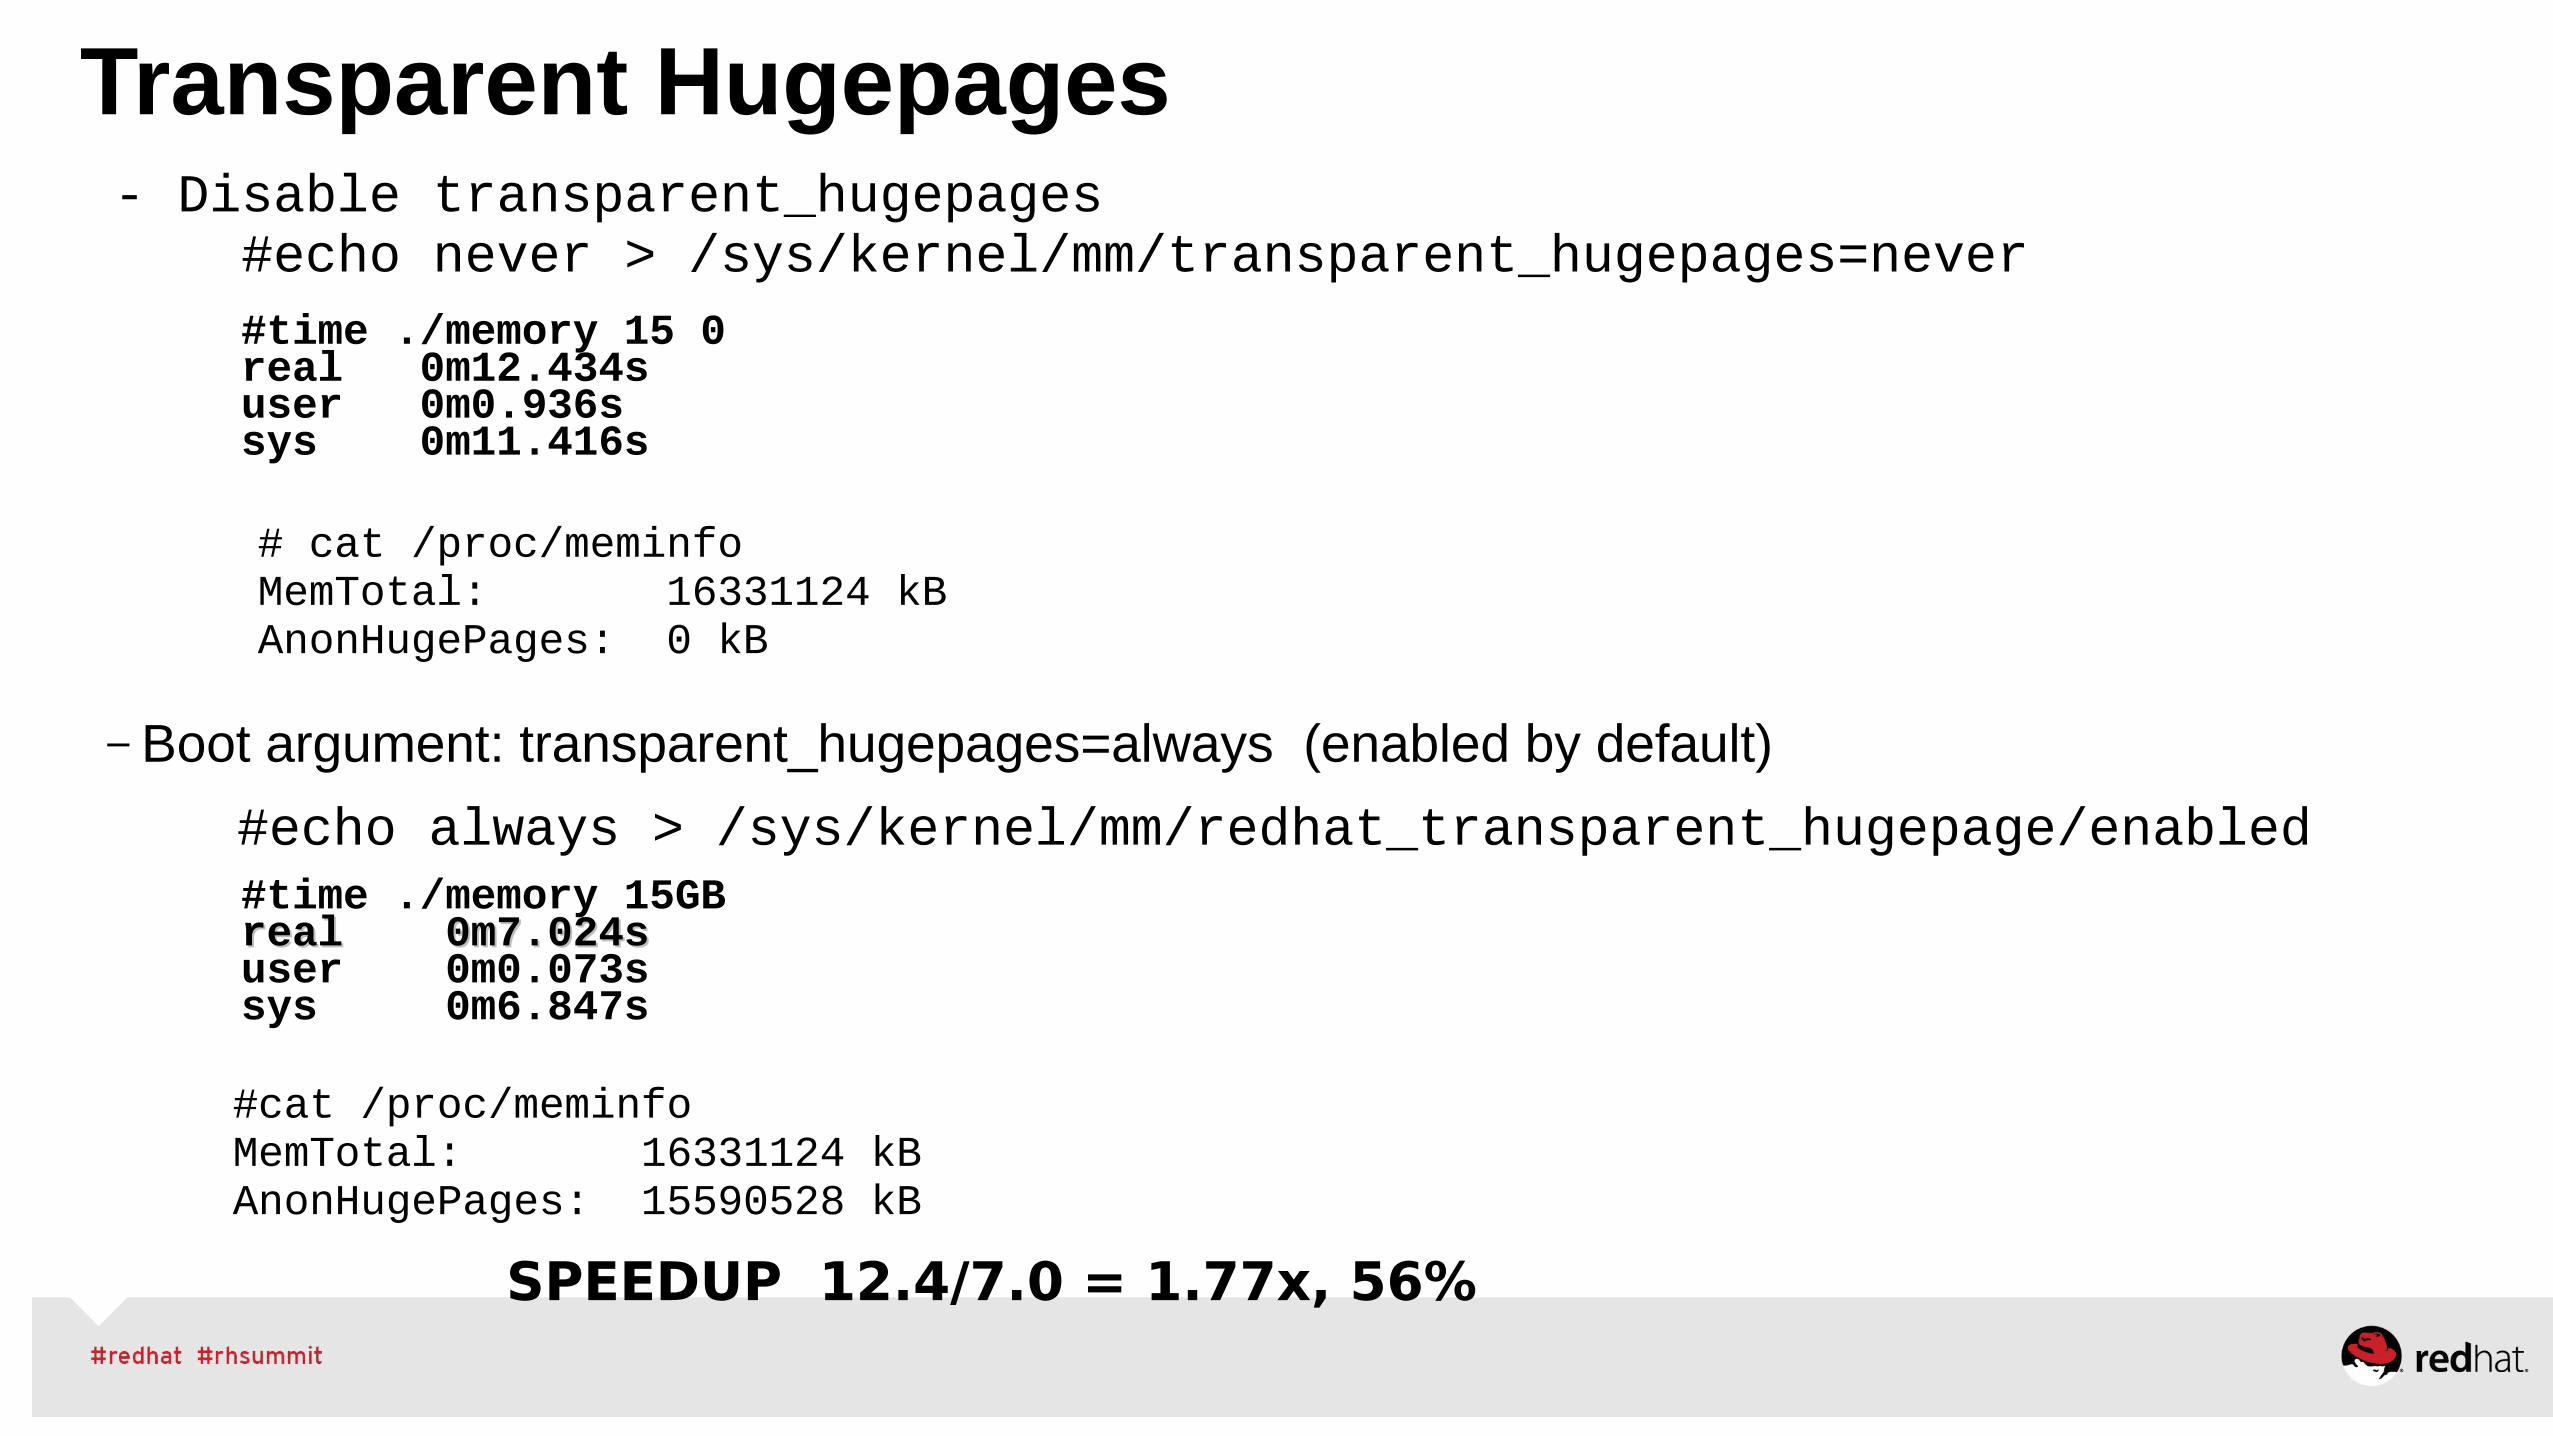
Transparent Hugepages- Disable transparent_hugepages #echo never > /sys/kernel/mm/transparent_hugepages=never #time ./memory 15 0
real 0m12.434suser 0m0.936ssys 0m11.416s
# cat /proc/meminfo MemTotal: 16331124 kBAnonHugePages: 0 kB
– Boot argument: transparent_hugepages=always (enabled by default)
#echo always > /sys/kernel/mm/redhat_transparent_hugepage/enabled#time ./memory 15GBreal 0m7.024sreal 0m7.024suser 0m0.073ssys 0m6.847s
#cat /proc/meminfo MemTotal: 16331124 kBAnonHugePages: 15590528 kB
SPEEDUP 12.4/7.0 = 1.77x, 56%

2MB standard Hugepages# echo 2000 > /proc/sys/vm/nr_hugepages# cat /proc/meminfo MemTotal: 16331124 kBMemFree: 11788608 kB
HugePages_Total: 2000HugePages_Free: 2000HugePages_Rsvd: 0HugePages_Surp: 0Hugepagesize: 2048 kB
# ./hugeshm 1000
# cat /proc/meminfo MemTotal: 16331124 kBMemFree: 11788608 kB
HugePages_Total: 2000HugePages_Free: 1000HugePages_Rsvd: 1000HugePages_Surp: 0Hugepagesize: 2048 kB

2MB Hugepages - specific node allocation# echo 0 > /proc/sys/vm/nr_hugepages# cat /proc/meminfo | grep HugePages_FreeHugePages_Free: 0
# echo 1000 > /proc/sys/vm/nr_hugepages # cat /proc/meminfo | grep HugePages_FreeHugePages_Free: 1000# cat /sys/devices/system/node/node*/hugepages/hugepages-2048kB/nr_hugepages 500500
# echo 0 > /proc/sys/vm/nr_hugepages # echo 1000 > /sys/devices/system/node/node0/hugepages/hugepages-2048kB/nr_hugepages # cat /proc/meminfo | grep HugePages_FreeHugePages_Free: 1000# cat /sys/devices/system/node/node*/hugepages/hugepages-2048kB/nr_hugepages 10000

Database Performance OLTP (Higher = Better)huge pages on Bare Metal
The effect of hugepages are more pronounced as system drive to saturaton
10U 40U 80U0
500000
1000000
1500000
2000000
2500000
Oracle OLTP tran/min
48G sga 48G sga - hugepage
Boot-time allocated 1GB Hugepages
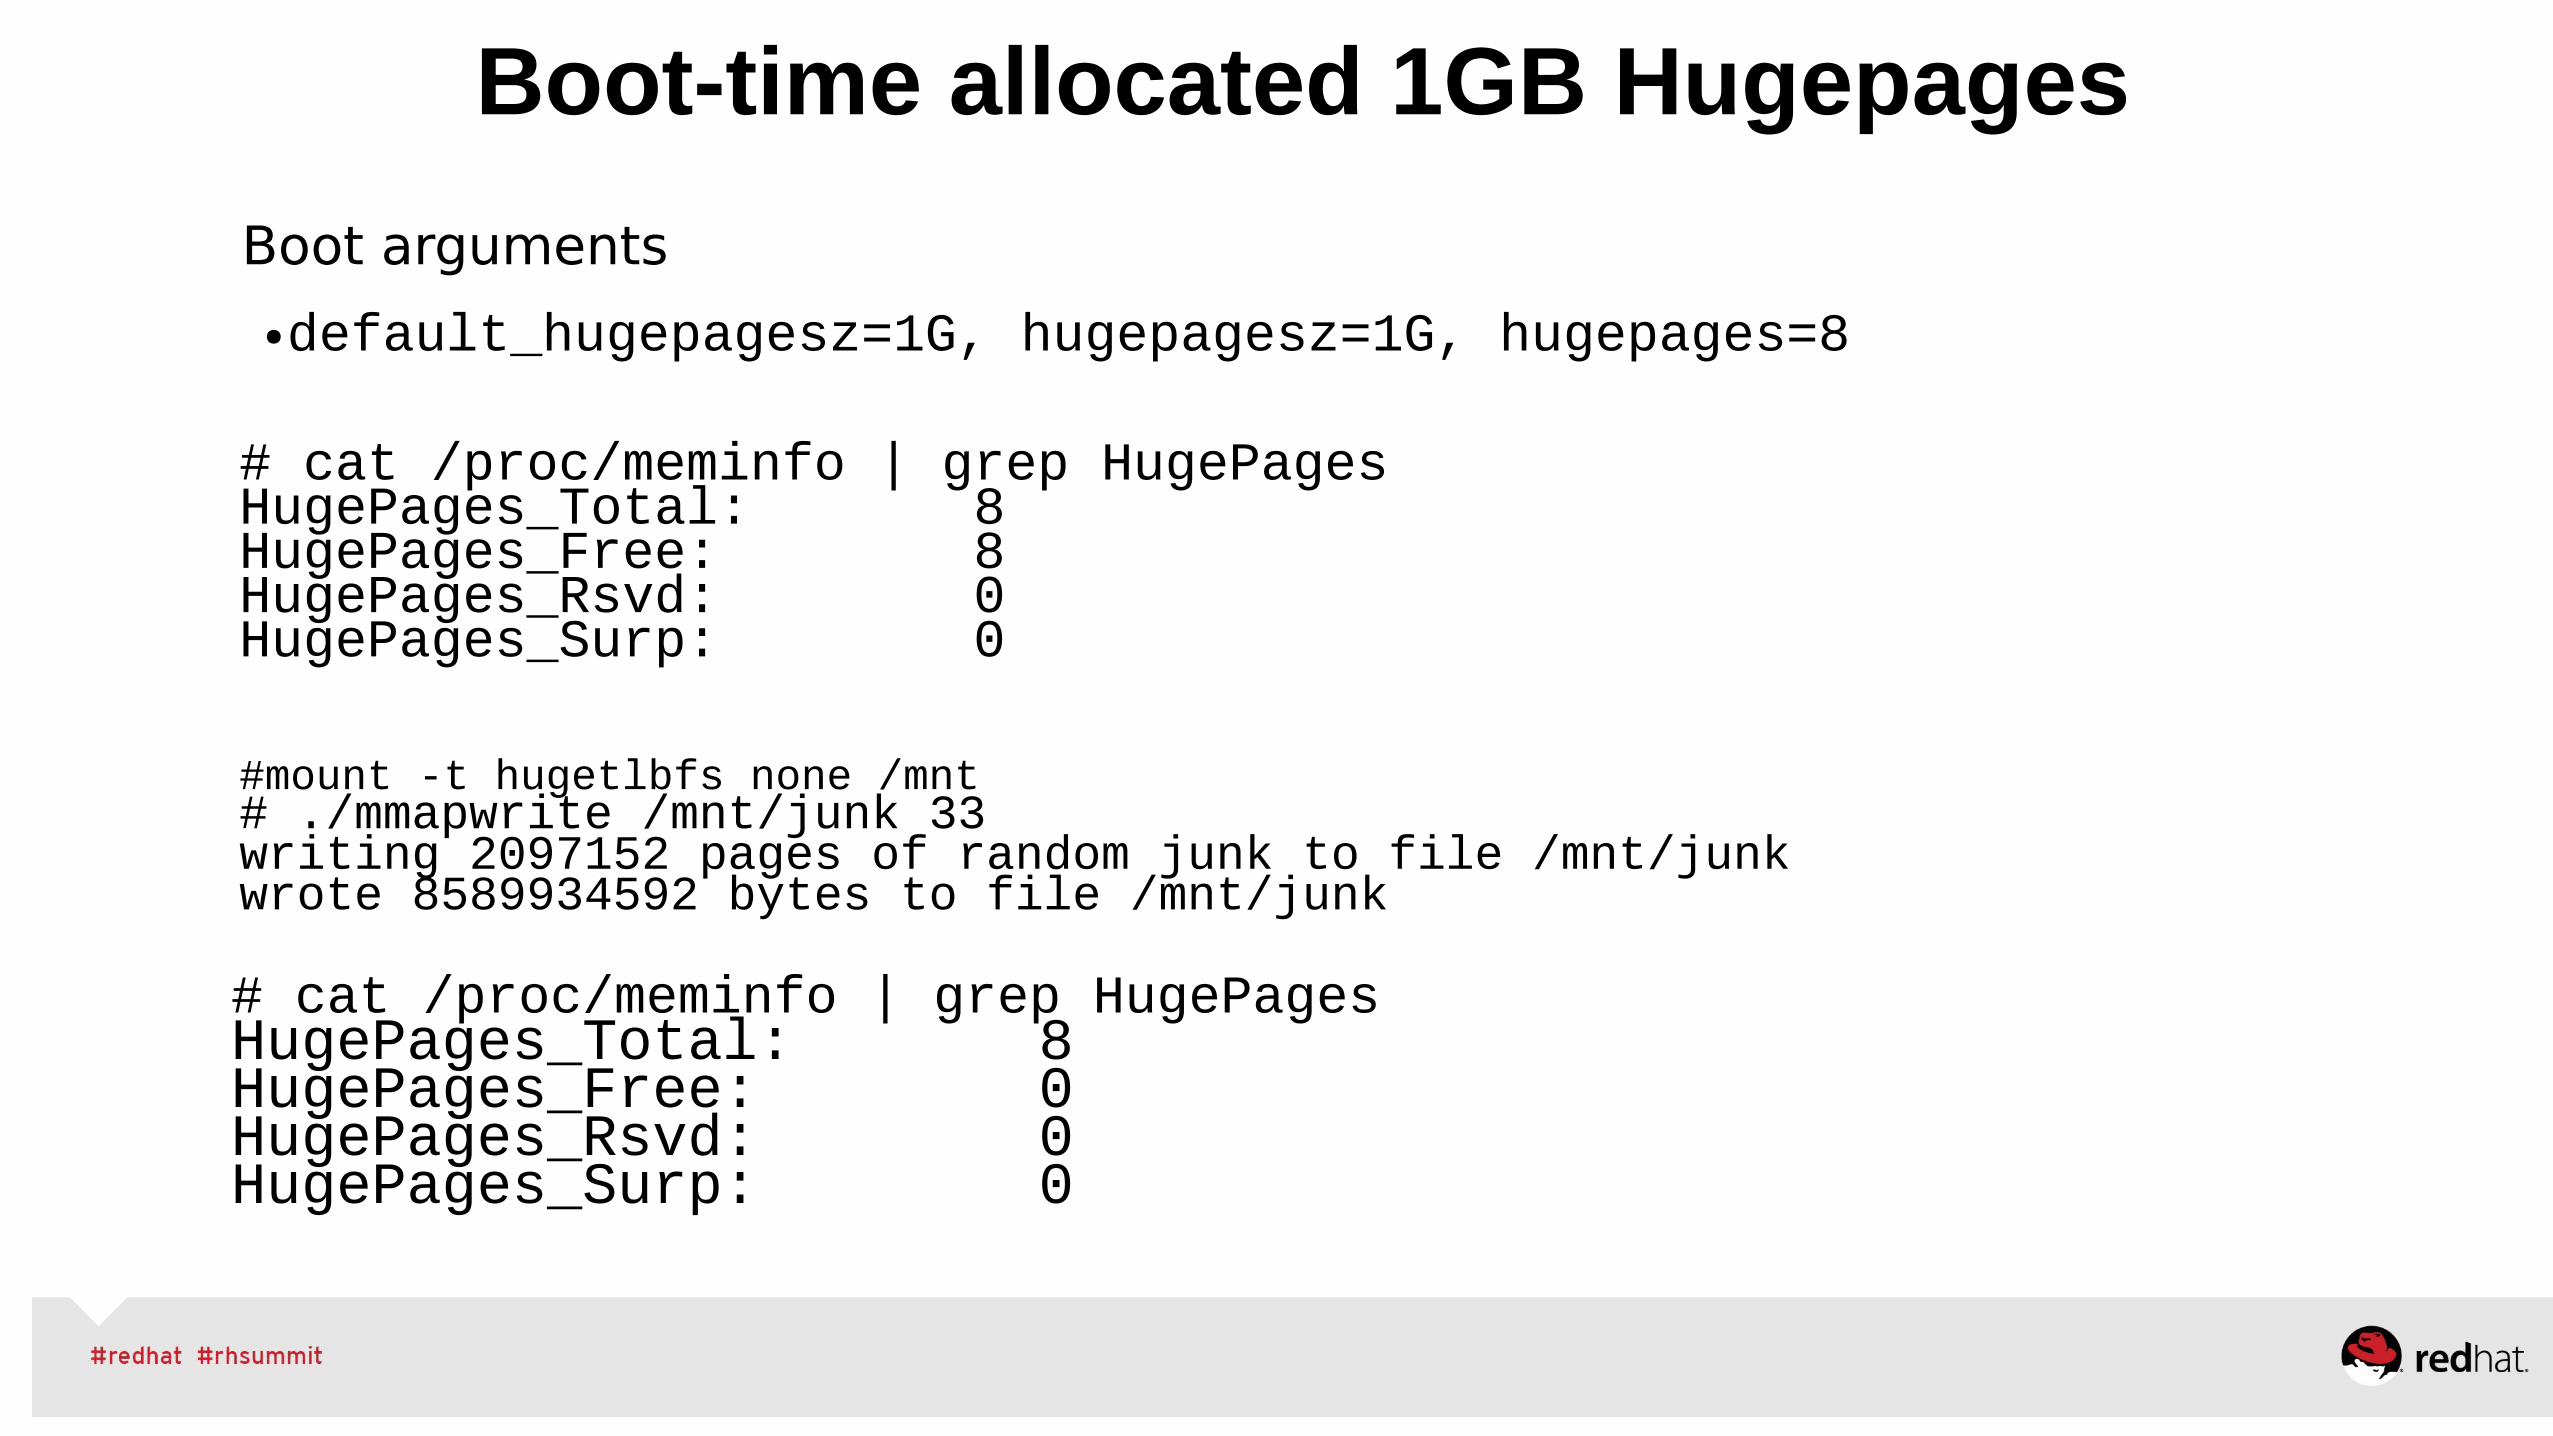
Boot arguments
●default_hugepagesz=1G, hugepagesz=1G, hugepages=8
# cat /proc/meminfo | grep HugePagesHugePages_Total: 8HugePages_Free: 8HugePages_Rsvd: 0HugePages_Surp: 0
#mount -t hugetlbfs none /mnt# ./mmapwrite /mnt/junk 33writing 2097152 pages of random junk to file /mnt/junkwrote 8589934592 bytes to file /mnt/junk
# cat /proc/meminfo | grep HugePagesHugePages_Total: 8HugePages_Free: 0HugePages_Rsvd: 0HugePages_Surp: 0

# cat /sys/devices/system/node/node*/hugepages/hugepages-1048576kB/nr_hugepages 00
# echo 8 > /sys/devices/system/node/node0/hugepages/hugepages-1048576kB/nr_hugepages# cat /proc/meminfo | grep HugePages_FreeHugePages_Free: 8# cat /sys/devices/system/node/node*/hugepages/hugepages-1048576kB/nr_hugepages 80
# echo 0 > /sys/devices/system/node/node0/hugepages/hugepages-1048576kB/nr_hugepages# cat /proc/meminfo | grep HugePages_FreeHugePages_Free: 0# cat /sys/devices/system/node/node*/hugepages/hugepages-1048576kB/nr_hugepages 00
Dynamic per-node allocation/deallocation of 1GB Hugepages
Red Hat Performance Engineering
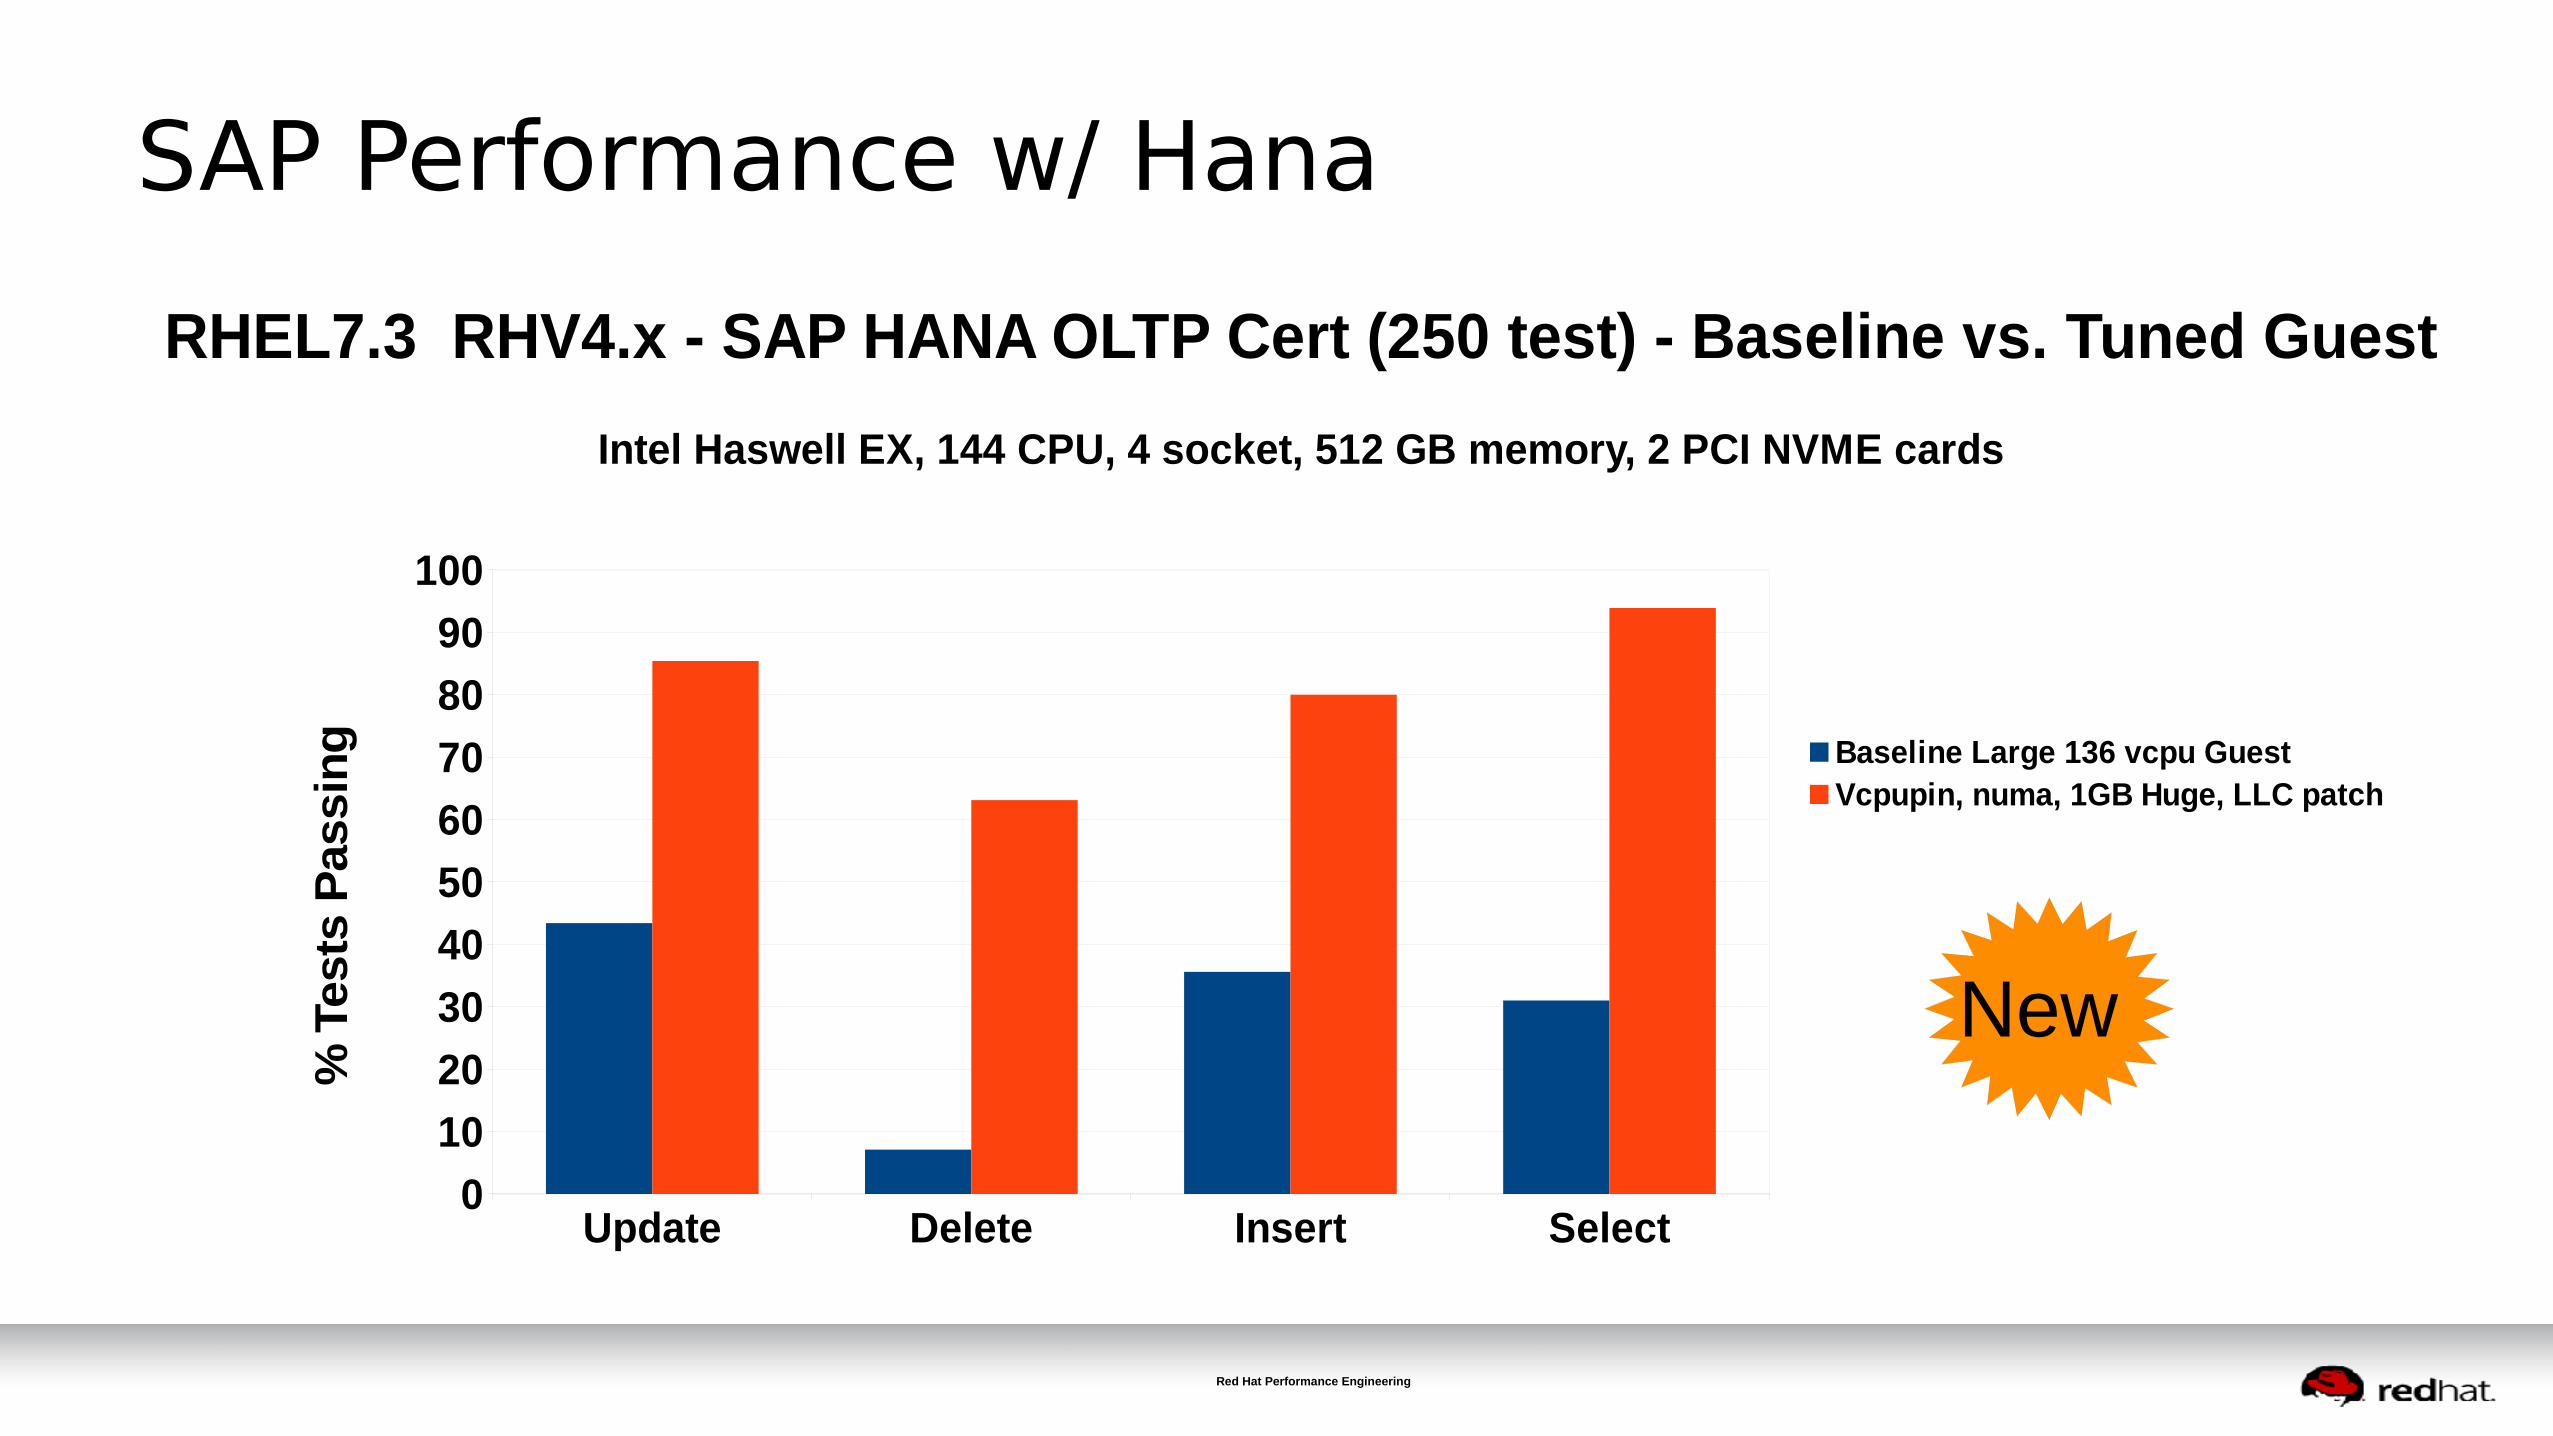
SAP Performance w/ Hana
Update Delete Insert Select0
10
20
30
40
50
60
70
80
90
100
RHEL7.3 RHV4.x - SAP HANA OLTP Cert (250 test) - Baseline vs. Tuned Guest
Intel Haswell EX, 144 CPU, 4 socket, 512 GB memory, 2 PCI NVME cards
Baseline Large 136 vcpu Guest Vcpupin, numa, 1GB Huge, LLC patch
% T
ests
Passin
g
New

RHEL Control Group - Cgroups

Cgroup default mount points
# cat /etc/cgconfig.conf
mount {cpuset= /cgroup/cpuset;cpu = /cgroup/cpu;cpuacct = /cgroup/cpuacct;memory = /cgroup/memory;devices = /cgroup/devices;freezer = /cgroup/freezer;net_cls = /cgroup/net_cls;blkio = /cgroup/blkio;
}
# ls -l /cgroupdrwxr-xr-x 2 root root 0 Jun 21 13:33 blkiodrwxr-xr-x 3 root root 0 Jun 21 13:33 cpudrwxr-xr-x 3 root root 0 Jun 21 13:33 cpuacctdrwxr-xr-x 3 root root 0 Jun 21 13:33 cpusetdrwxr-xr-x 3 root root 0 Jun 21 13:33 devicesdrwxr-xr-x 3 root root 0 Jun 21 13:33 freezerdrwxr-xr-x 3 root root 0 Jun 21 13:33 memorydrwxr-xr-x 2 root root 0 Jun 21 13:33 net_cls
RHEL6
RHEL7
/sys/fs/cgroup/
RHEL7#ls -l /sys/fs/cgroup/drwxr-xr-x. 2 root root 0 Mar 20 16:40 blkiodrwxr-xr-x. 2 root root 0 Mar 20 16:40 cpu,cpuacctdrwxr-xr-x. 2 root root 0 Mar 20 16:40 cpusetdrwxr-xr-x. 2 root root 0 Mar 20 16:40 devicesdrwxr-xr-x. 2 root root 0 Mar 20 16:40 freezerdrwxr-xr-x. 2 root root 0 Mar 20 16:40 hugetlbdrwxr-xr-x. 3 root root 0 Mar 20 16:40 memorydrwxr-xr-x. 2 root root 0 Mar 20 16:40 net_clsdrwxr-xr-x. 2 root root 0 Mar 20 16:40 perf_eventdrwxr-xr-x. 4 root root 0 Mar 20 16:40 systemd
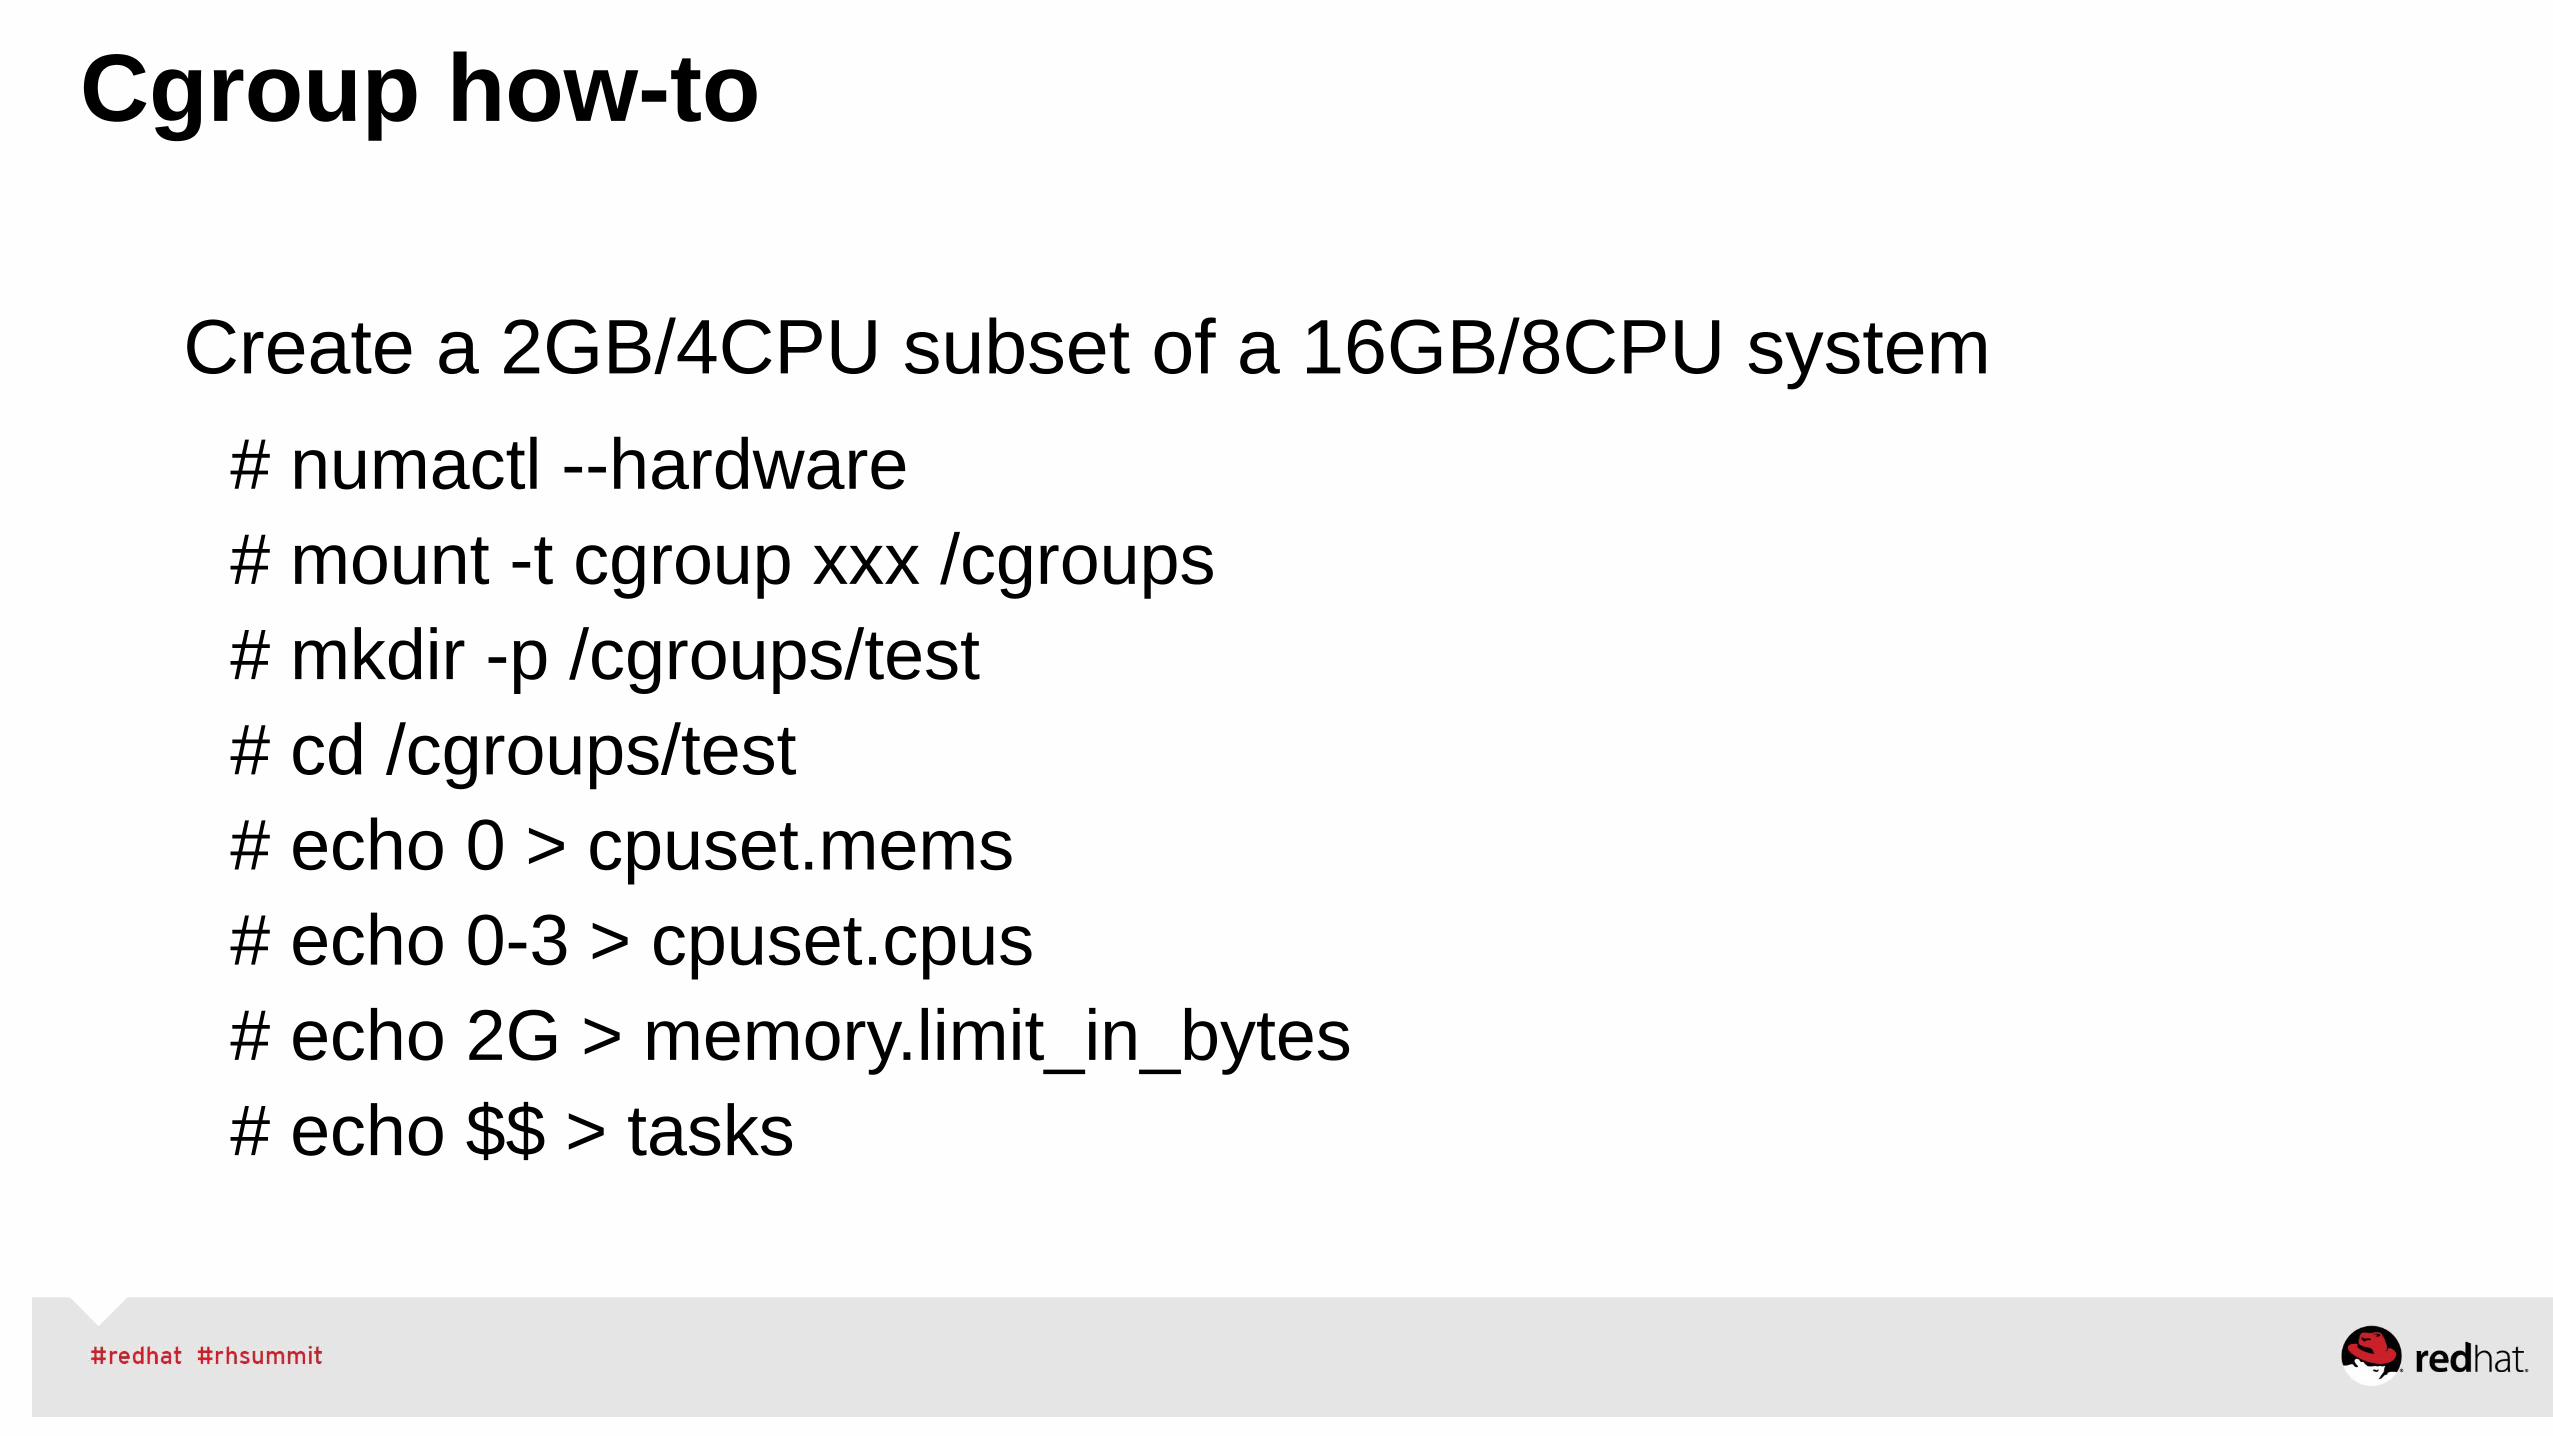
Create a 2GB/4CPU subset of a 16GB/8CPU system
# numactl --hardware# mount -t cgroup xxx /cgroups# mkdir -p /cgroups/test# cd /cgroups/test# echo 0 > cpuset.mems# echo 0-3 > cpuset.cpus# echo 2G > memory.limit_in_bytes# echo $$ > tasks
Cgroup how-to

# echo 0-3 > cpuset.cpus
# runmany 20MB 110procs &
# top -d 5
top - 12:24:13 up 1:36, 4 users, load average: 22.70, 5.32, 1.79
Tasks: 315 total, 93 running, 222 sleeping, 0 stopped, 0 zombie
Cpu0 : 100.0%us, 0.0%sy, 0.0%ni, 0.0%id, 0.0%wa, 0.0%hi, 0.0%si, 0.0%st
Cpu1 : 100.0%us, 0.0%sy, 0.0%ni, 0.0%id, 0.0%wa, 0.0%hi, 0.0%si, 0.0%st
Cpu2 : 100.0%us, 0.0%sy, 0.0%ni, 0.0%id, 0.0%wa, 0.0%hi, 0.0%si, 0.0%st
Cpu3 : 100.0%us, 0.0%sy, 0.0%ni, 0.0%id, 0.0%wa, 0.0%hi, 0.0%si, 0.0%st
Cpu4 : 0.4%us, 0.6%sy, 0.0%ni, 98.8%id, 0.0%wa, 0.0%hi, 0.2%si, 0.0%st
Cpu5 : 0.4%us, 0.0%sy, 0.0%ni, 99.2%id, 0.0%wa, 0.0%hi, 0.4%si, 0.0%st
Cpu6 : 0.0%us, 0.0%sy, 0.0%ni,100.0%id, 0.0%wa, 0.0%hi, 0.0%si, 0.0%st
Cpu7 : 0.0%us, 0.0%sy, 0.0%ni, 99.8%id, 0.0%wa, 0.0%hi, 0.2%si, 0.0%st
cgroups

Correct NUMA bindings Incorrect NUMA bindings
# echo 0 > cpuset.mems# echo 0-3 > cpuset.cpus# numastat node0 node1numa_hit 1648772 438778numa_miss 23459 2134520local_node 1648648 423162other_node 23583 2150136
# /common/lwoodman/code/memory 4Gfaulting took 1.616062s touching took 0.364937s
# numastat node0 node1numa_hit 2700423 439550numa_miss 23459 2134520local_node 2700299 423934other_node 23583 2150136
# echo 1 > cpuset.mems# echo 0-3 > cpuset.cpus# numastat node0 node1numa_hit 1623318 434106numa_miss 23459 1082458local_node 1623194 418490other_node 23583 1098074
# /common/lwoodman/code/memory 4Gfaulting took 1.976627s touching took 0.454322s
# numastat node0 node1numa_hit 1623341 434147numa_miss 23459 2133738local_node 1623217 418531other_node 23583 2149354

top - 09:51:58 up 13 days, 17:11, 11 users, load average: 7.14, 5.78, 3.09
PID USER PR NI VIRT RES SHR S %CPU %MEM TIME 20102 root 20 0 4160 360 284 R 100.0 0.0 0:17.45 useless 20103 root 20 0 4160 356 284 R 100.0 0.0 0:17.03 useless 20107 root 20 0 4160 356 284 R 100.0 0.0 0:15.57 useless 20104 root 20 0 4160 360 284 R 99.8 0.0 0:16.66 useless 20105 root 20 0 4160 360 284 R 99.8 0.0 0:16.31 useless 20108 root 20 0 4160 360 284 R 99.8 0.0 0:15.19 useless 20110 root 20 0 4160 360 284 R 99.4 0.0 0:14.74 useless 20106 root 20 0 4160 360 284 R 99.1 0.0 0:15.87 useless 20111 root 20 0 4160 356 284 R 1.0 0.0 0:00.08 useful
# echo 10 > cpu.shares
cpu.shares default cpu.shares throttled
top - 10:04:19 up 13 days, 17:24, 11 users, load average: 8.41, 8.31, 6.17
PID USER PR NI VIRT RES SHR S %CPU %MEM TIME 20104 root 20 0 4160 360 284 R 99.4 0.0 12:35.83 useless 20103 root 20 0 4160 356 284 R 91.4 0.0 12:34.78 useless 20105 root 20 0 4160 360 284 R 90.4 0.0 12:33.08 useless 20106 root 20 0 4160 360 284 R 88.4 0.0 12:32.81 useless 20102 root 20 0 4160 360 284 R 86.4 0.0 12:35.29 useless20107 root 20 0 4160 356 284 R 85.4 0.0 12:33.51 useless 20110 root 20 0 4160 360 284 R 84.8 0.0 12:31.87 useless 20108 root 20 0 4160 360 284 R 82.1 0.0 12:30.55 useless20410 root 20 0 4160 360 284 R 91.4 0.0 0:18.51 useful
# cat cpu.shares 1024
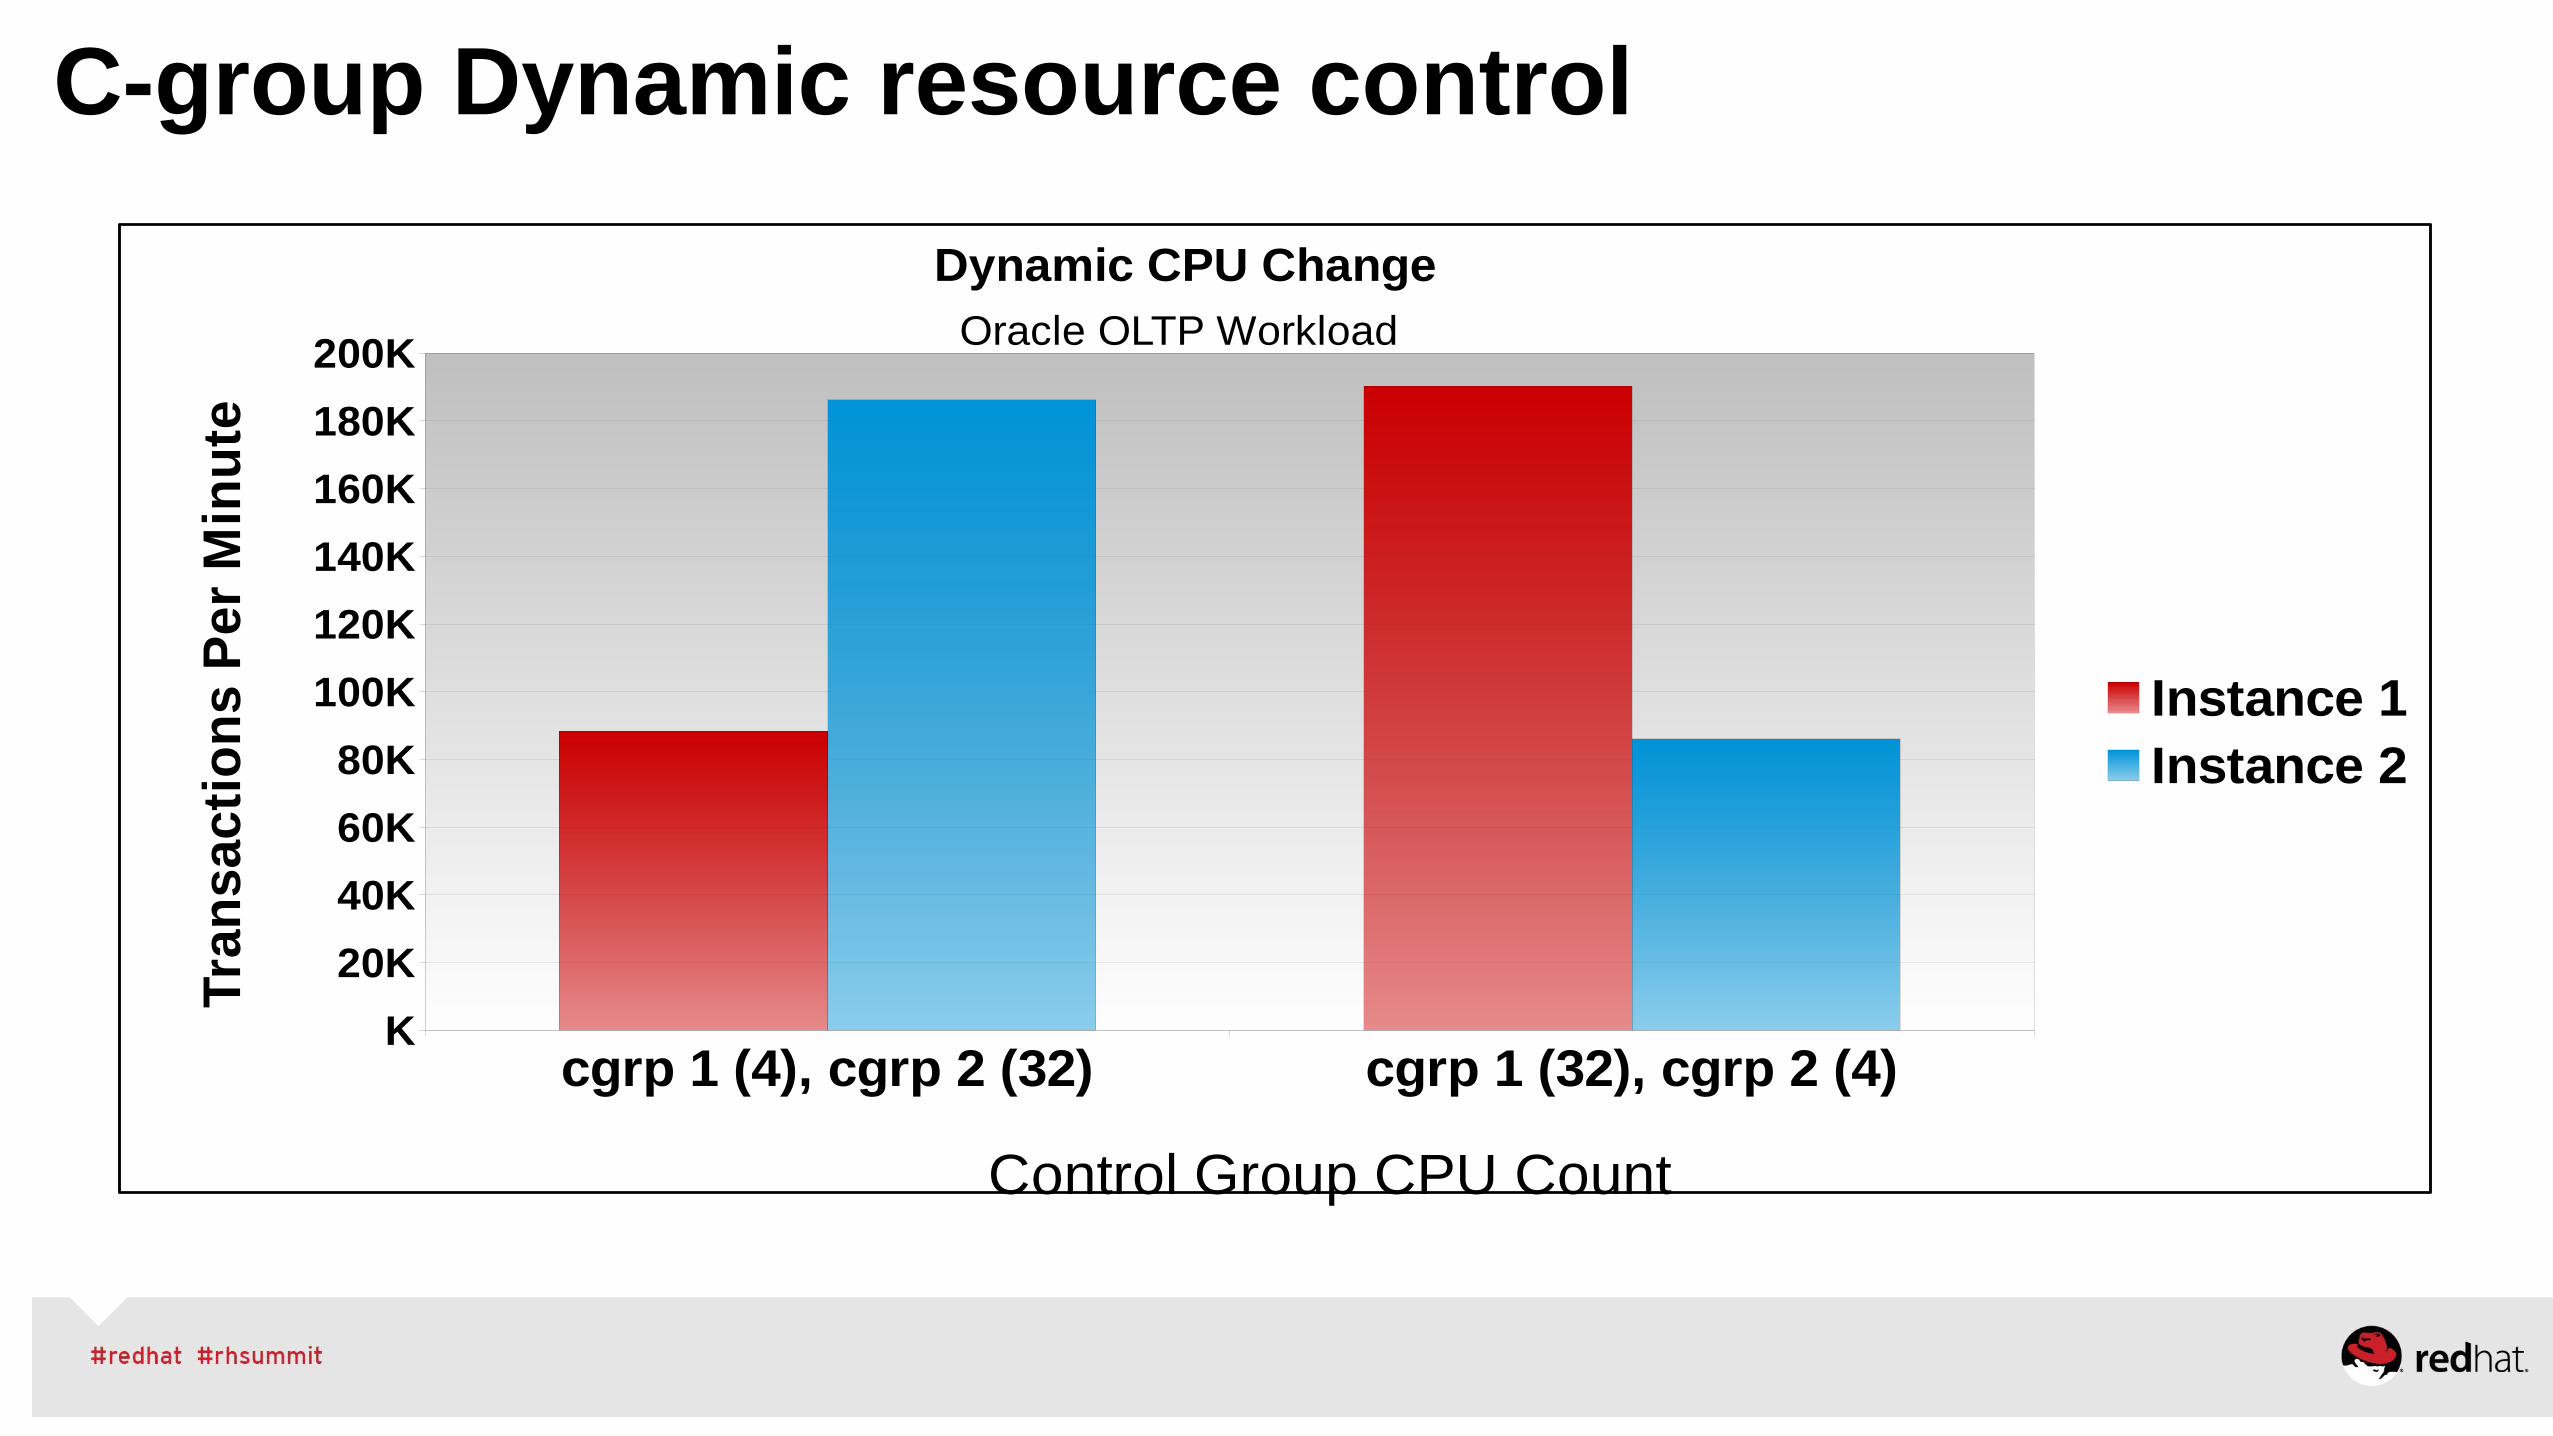
C-group Dynamic resource control
cgrp 1 (4), cgrp 2 (32) cgrp 1 (32), cgrp 2 (4)K
20K
40K
60K
80K
100K
120K
140K
160K
180K
200K
Dynamic CPU ChangeOracle OLTP Workload
Instance 1Instance 2
Control Group CPU Count
Tran
sact
ion
s P
er M
inu
te
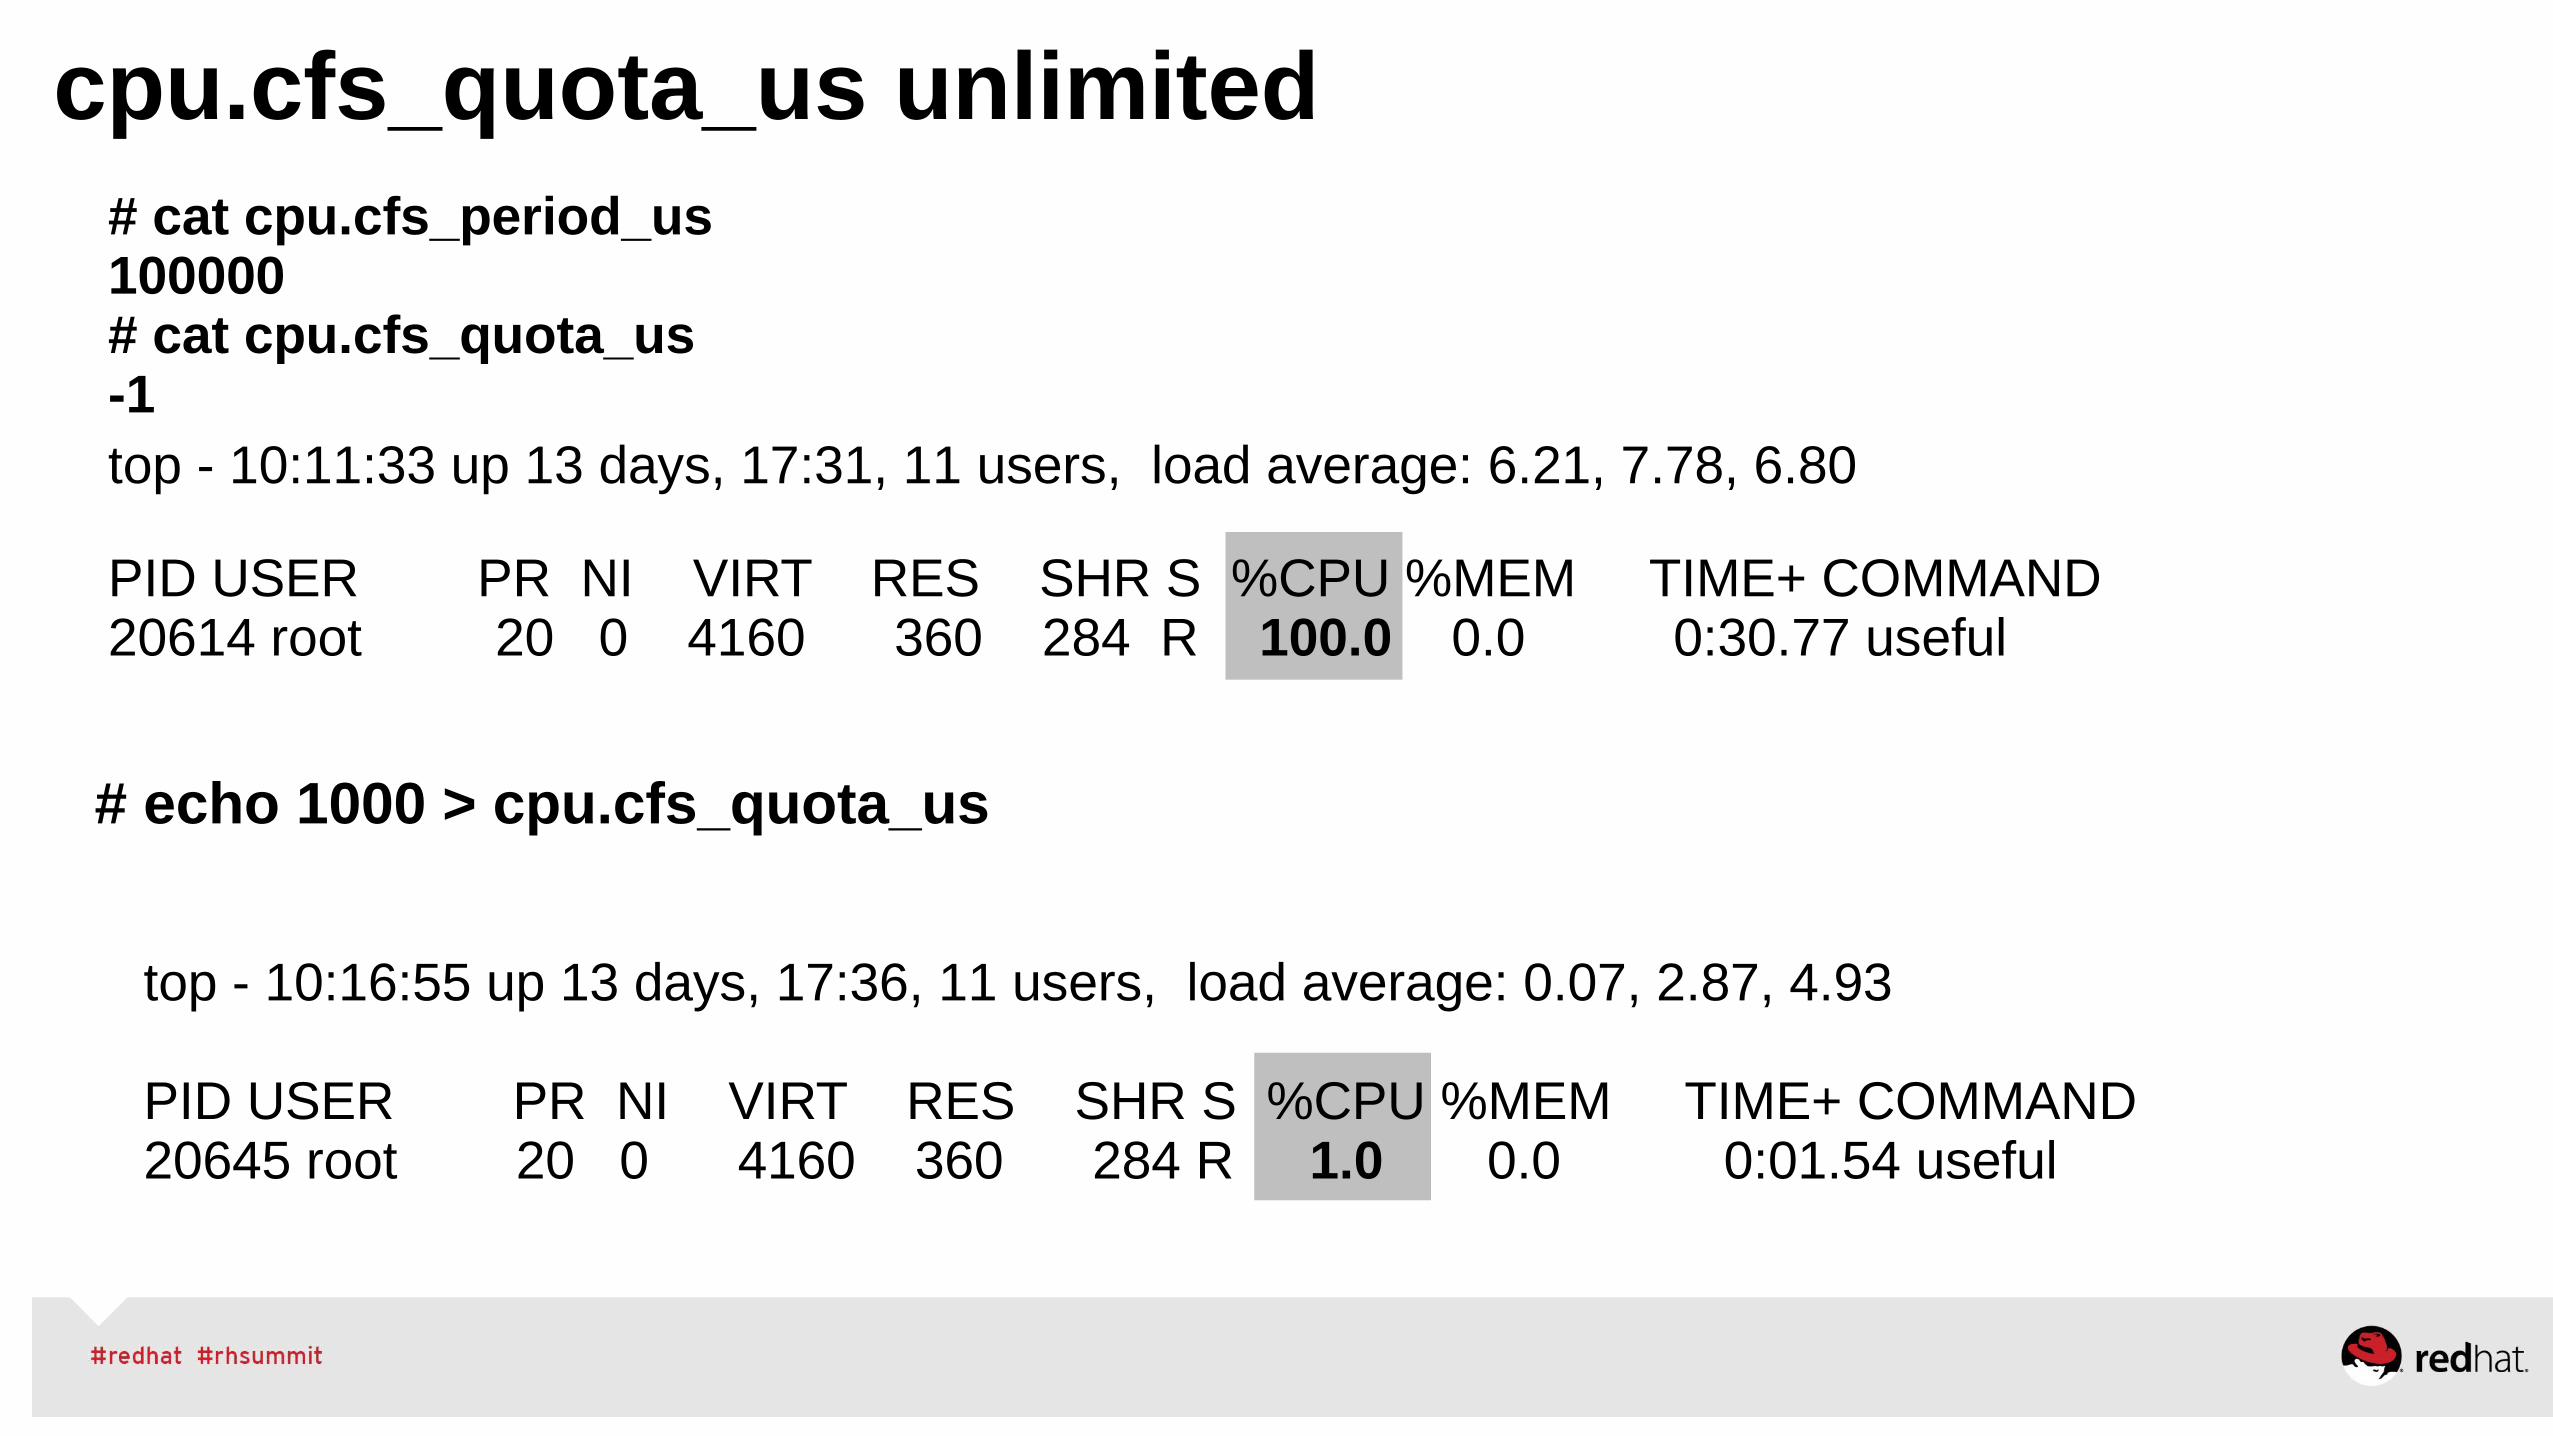
# cat cpu.cfs_period_us100000# cat cpu.cfs_quota_us -1
cpu.cfs_quota_us unlimited
top - 10:11:33 up 13 days, 17:31, 11 users, load average: 6.21, 7.78, 6.80
PID USER PR NI VIRT RES SHR S %CPU %MEM TIME+ COMMAND 20614 root 20 0 4160 360 284 R 100.0 0.0 0:30.77 useful
top - 10:16:55 up 13 days, 17:36, 11 users, load average: 0.07, 2.87, 4.93
PID USER PR NI VIRT RES SHR S %CPU %MEM TIME+ COMMAND 20645 root 20 0 4160 360 284 R 1.0 0.0 0:01.54 useful
# echo 1000 > cpu.cfs_quota_us

Cgroup OOMkills# mkdir -p /sys/fs/cgroup/memory/test # echo 1G > /sys/fs/cgroup/memory/test/memory.limit_in_bytes # echo 2G > /sys/fs/cgroup/memory/test/memory.memsw.limit_in_bytes # echo $$ > /sys/fs/cgroup/memory/test/tasks
# ./memory 16Gsize = 10485760000touching 2560000 pagesKilled# vmstat 1... 0 0 52224 1640116 0 3676924 0 0 0 0 202 487 0 0 100 0 0 1 0 52224 1640116 0 3676924 0 0 0 0 162 316 0 0 100 0 0 0 1 248532 587268 0 3676948 32 196312 32 196372 912 974 1 4 88 7 0 0 1 406228 586572 0 3677308 0 157696 0 157704 624 696 0 1 87 11 0 0 1 568532 585928 0 3676864 0 162304 0 162312 722 1039 0 2 87 11 0 0 1 729300 584744 0 3676840 0 160768 0 160776 719 1161 0 2 87 11 0 1 0 885972 585404 0 3677008 0 156844 0 156852 754 1225 0 2 88 10 0 0 1 1042644 587128 0 3676784 0 156500 0 156508 747 1146 0 2 86 12 0 0 1 1169708 587396 0 3676748 0 127064 4 127836 702 1429 0 2 88 10 0 0 0 86648 1607092 0 3677020 144 0 148 0 491 1151 0 1 97 1 0

Cgroup OOMkills (continued)# vmstat 1... 0 0 52224 1640116 0 3676924 0 0 0 0 202 487 0 0 100 0 0 1 0 52224 1640116 0 3676924 0 0 0 0 162 316 0 0 100 0 0 0 1 248532 587268 0 3676948 32 196312 32 196372 912 974 1 4 88 7 0 0 1 406228 586572 0 3677308 0 157696 0 157704 624 696 0 1 87 11 0 0 1 568532 585928 0 3676864 0 162304 0 162312 722 1039 0 2 87 11 0 0 1 729300 584744 0 3676840 0 160768 0 160776 719 1161 0 2 87 11 0 1 0 885972 585404 0 3677008 0 156844 0 156852 754 1225 0 2 88 10 0 0 1 1042644 587128 0 3676784 0 156500 0 156508 747 1146 0 2 86 12 0 0 1 1169708 587396 0 3676748 0 127064 4 127836 702 1429 0 2 88 10 0 0 0 86648 1607092 0 3677020 144 0 148 0 491 1151 0 1 97 1 0...
# dmesg...[506858.413341] Task in /test killed as a result of limit of /test[506858.413342] memory: usage 1048460kB, limit 1048576kB, failcnt 295377[506858.413343] memory+swap: usage 2097152kB, limit 2097152kB, failcnt 74[506858.413344] kmem: usage 0kB, limit 9007199254740991kB, failcnt 0[506858.413345] Memory cgroup stats for /test: cache:0KB rss:1048460KB rss_huge:10240KB mapped_file:0KB swap:1048692KB inactive_anon:524372KB active_anon:524084KB inactive_file:0KB active_file:0KB unevictable:0KB

Cgroup – Application Isolation
K
5 K
10 K
15 K
20 K
25 K
30 K
35 K
System Level Memory Swapping
Swap InSwap Out
Time Regular Throttled
Memory Resource Management
Oracle OLTP Workload
Instance 4Instance 3Instance 2Instance 1
Tra
ns
ac
tio
ns
Pe
r M
inu
teEven though the “RED” application does not have resources and starts swapping, The other applications are not affected.

Red Hat R+D HPC, GPU, Multi-Arch

HPC R&D: OpenHPC●A Linux Foundation project to collect and distribute a standardized set of HPC tools and libraries
●OpenHPC Mission: to provide a reference collection of open-source HPC software components and best practices, lowering barriers to deployment, advancement, and use of modern HPC methods and tools.
●Red Hat joined OpenHPC in 2016 ●Would like to hear from any of you interested in this topic.

Multiple-Architecture R&D:●Red Hat Enterprise Linux: multiple architectures, one experience.
●Driving standardized interfaces and consistent user experiences
●Open, flexible, familiar across common architectures●Would like to hear from any of you interested in this topic.

GPU / Accelerator R&D:●Various research efforts exploring offloading and acceleration technologies spanning bare metal, virtualization, and containers
●Looking for input to prioritize important use cases such as:●AI / ML (Tensorflow, Theano, Torch, etc.)●Image analysis●Scientific applications●Accelerated libraries●Software development tools for accelerated applications●Other applications

RHEL Atomic Containers

120
RED HAT ENTERPRISE LINUX ATOMIC HOST
MINIMAL, SECURE FOOTPRINT● Minimal host provides “just enough” to
support apps.
RAPID PROVISIONING● Apps can be provisioned and started in
milliseconds.
SIMPLIFIED MAINTENANCE● Atomic updates are quick, reliable, and
can be rolled back.
kernel systemd docker
CO
NTA
INE
RS
SELinux
1 Red Hat Enterprise Linux Atomic Host is not generally available. Visit http://www.redhat.com/about/news/press-archive/2014/4/linux-container-innovations for additional information.

Children
Children/Grandchildren
Parents
throughput-performance
virtual-host virtual-guest
Atomic Tuned Profile Inheritance
atomic-openshift-node-guest
05/04/17 RED HAT INC. CONFIDENTIAL, NDA Required 122
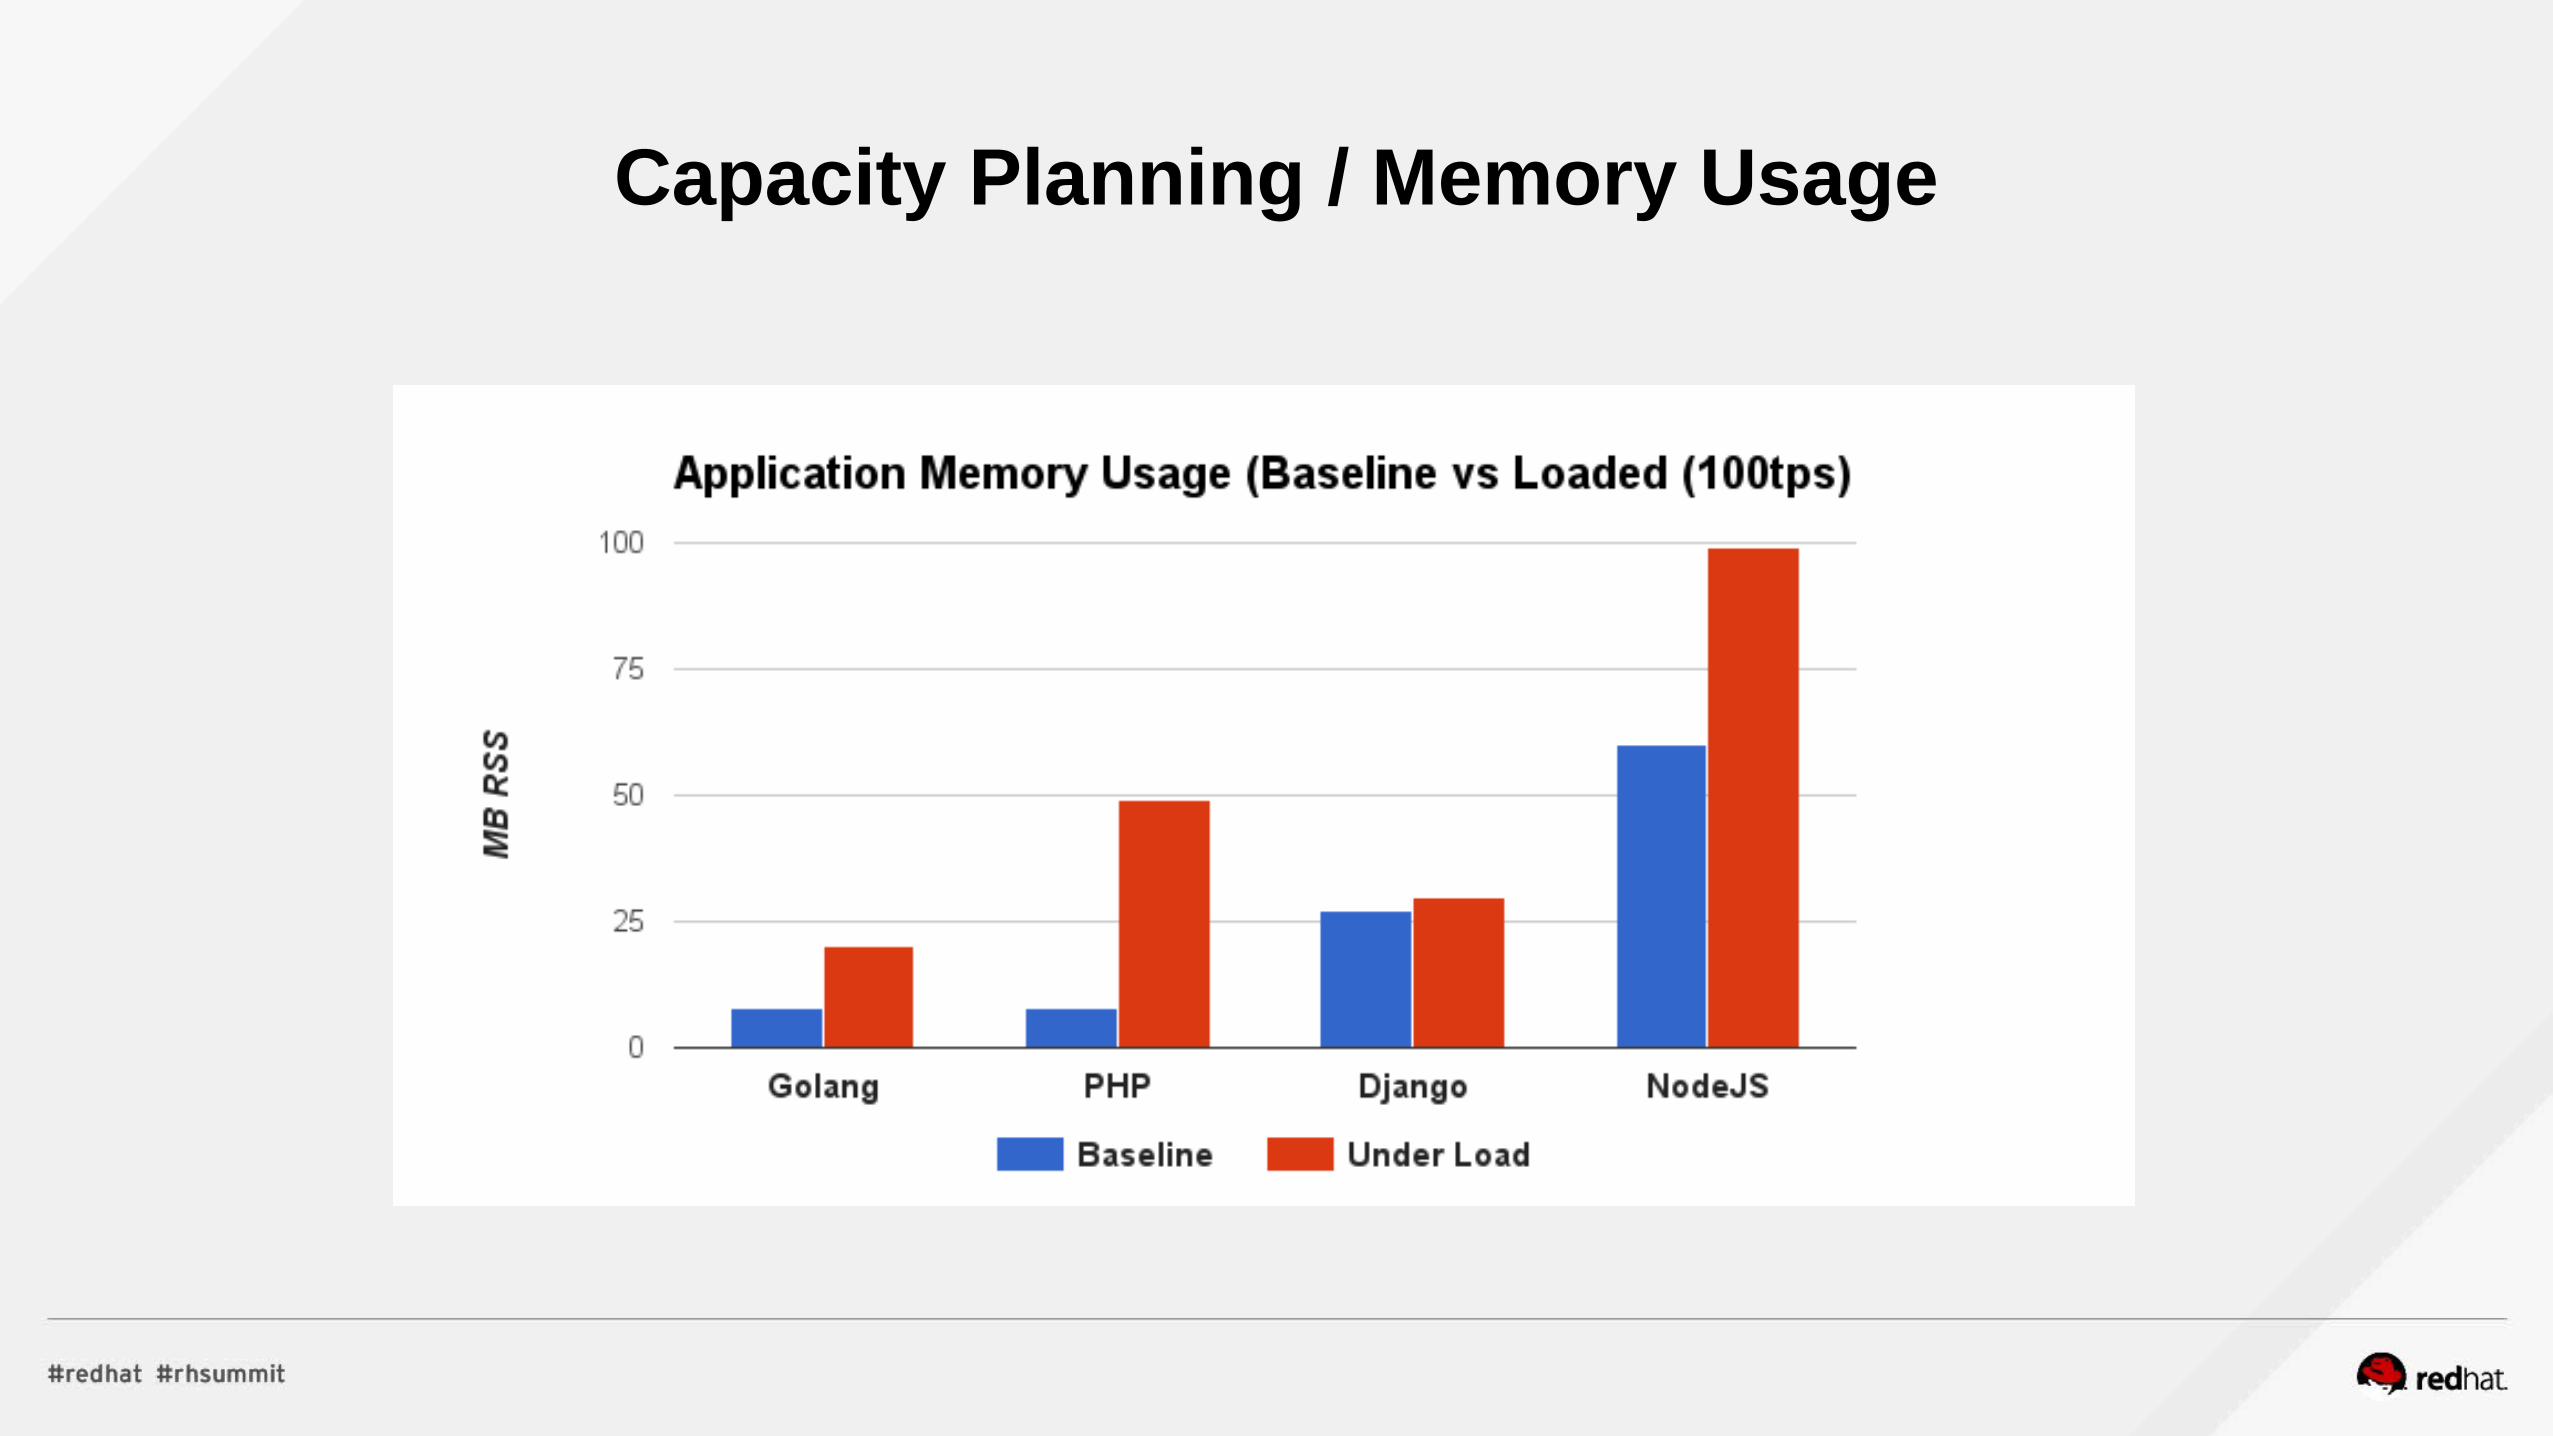
Capacity Planning / Memory Usage

05/04/17 RED HAT INC. CONFIDENTIAL, NDA Required 123
OSE 3.4 Cloud Native Storage w/ Gluster

Using Cgroups – Docker, Kubernetes
/sys/fs/cgroup/blkio/system.slice/docker-0d4aeda3.scope
/sys/fs/cgroup/cpu,cpuacct/system.slice/docker-0d4aeda3.scope
/sys/fs/cgroup/cpuset/system.slice/docker-0d4aeda3.scope
/sys/fs/cgroup/devices/system.slice/docker-0d4aeda3.scope
/sys/fs/cgroup/freezer/system.slice/docker-0d4aeda3.scope
/sys/fs/cgroup/hugetlb/system.slice/docker-0d4aeda3.scope
/sys/fs/cgroup/memory/system.slice/docker-0d4aeda3.scope
/sys/fs/cgroup/net_cls,net_prio/system.slice/docker-0d4aeda3.scope
/sys/fs/cgroup/perf_event/system.slice/docker-0d4aeda3.scope

Using Cgroups – cgconfig.conf
group app1 {
cpuset {
cpuset.cpus = "2,4,6,8,10";
cpuset.mems = 0;
group app2 {
cpuset {
cpuset.cpus = "1,3,5,7,9;
cpuset.mems = 1;

RHEL7 Performance Tuning Summary – Part II
•Q+A in “Meet The Experts” - Free as in Soda/Beer/Wine
• NonUniform Memory Access (NUMA) – kernel details / tuning • Scheduler tunables adjust quantum, forking, migration cost, new deadline scheduler in 7.x
• HugePages - static, THP, variable sized 4K/2MB/1GB • Cgroups cpuset, memory, network and IO
• use to prevent IO from consuming 95% of memory● Disk IO - IO elevators, sawpiness, dirty ratios, readahead, multi-Q● R+D GPUoffload, OpenHPC, multi-arch• Containers
•Containers are Linux, run/optimized and tuned just like Linux.

Performance Whitepapers
● Performance Tuning of Satellite 6.1 and Capsules https://access.redhat.com/articles/2356131
● OpenShift v3 Scaling, Performance and Capacity Planning https://access.redhat.com/articles/2191731
● Performance and Scaling your RHEL OSP 7 Cloud https://access.redhat.com/articles/2165131–Update guides to perf / virt to rhel7, add containers
● Red Hat Enterprise Linux Tuning Guide RHEL7 ● Red Hat Virtualization Tuning Guide ● Comprehensive Overview of Storage Scalability in Docker● RHEL Blog / Developer Blog

THANK YOU
plus.google.com/+RedHat
linkedin.com/company/red-hat
youtube.com/user/RedHatVideos
facebook.com/redhatinc
twitter.com/RedHatNews
