performance analysis - bank of baroda · © 2017 bank of baroda. ... recovery from pwo 24 104 221...
TRANSCRIPT

Performance AnalysisQ3, FY 2017
February 10, 2017
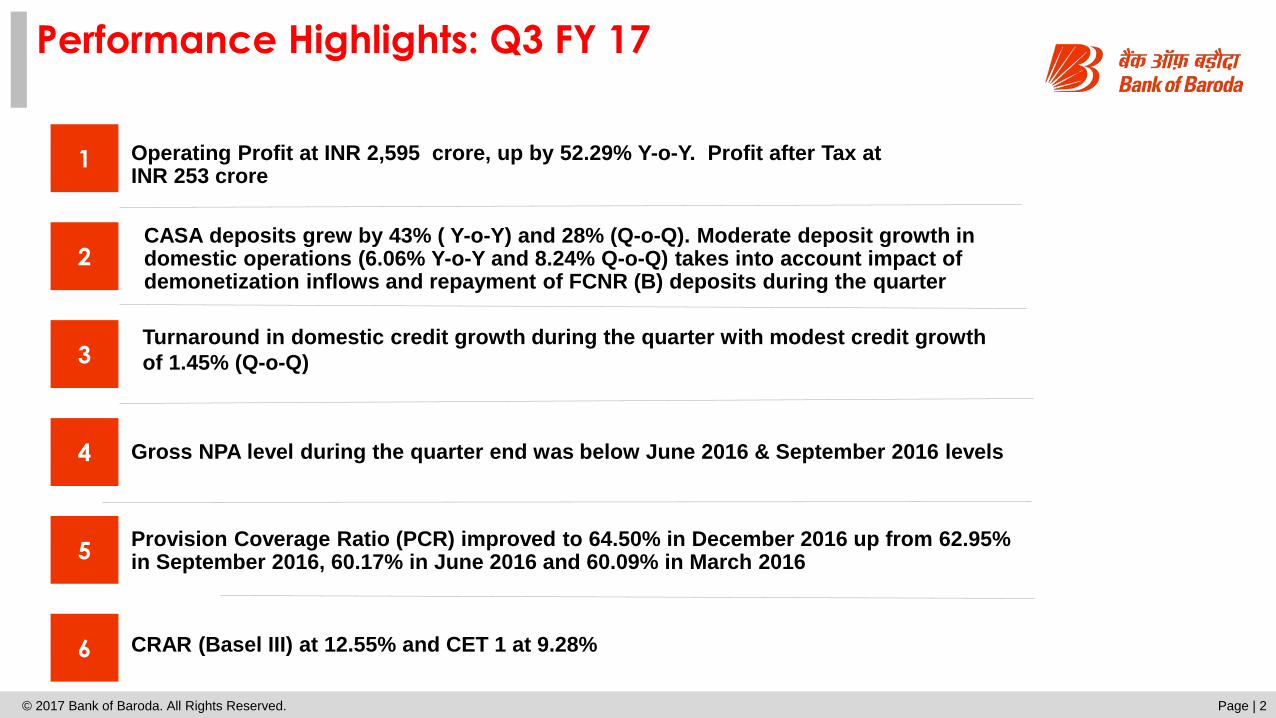
Performance Highlights: Q3 FY 17
© 2017 Bank of Baroda. All Rights Reserved. Page | 2
1
2
3
4
5
6
Operating Profit at INR 2,595 crore, up by 52.29% Y-o-Y. Profit after Tax at INR 253 crore
CASA deposits grew by 43% ( Y-o-Y) and 28% (Q-o-Q). Moderate deposit growth in domestic operations (6.06% Y-o-Y and 8.24% Q-o-Q) takes into account impact of demonetization inflows and repayment of FCNR (B) deposits during the quarter
Gross NPA level during the quarter end was below June 2016 & September 2016 levels
Provision Coverage Ratio (PCR) improved to 64.50% in December 2016 up from 62.95% in September 2016, 60.17% in June 2016 and 60.09% in March 2016
CRAR (Basel III) at 12.55% and CET 1 at 9.28%
Turnaround in domestic credit growth during the quarter with modest credit growth
of 1.45% (Q-o-Q)

Business Performance (1/2)
Particulars
(INR crore)Dec ’15 Mar ’16 Sep ’16 Dec ’16 YOY (%) QOQ (%)
Total Business9,73,959 9,57,808 9,21,681 9,39,819 (3.51) 1.97
Domestic 6,72,269 6,58,112 6,51,264 6,88,137 2.36 5.66
International 3,01,690 2,99,696 2,70,416 2,51,682 (16.58) (6.93)
Total Deposits 5,89,687 5,74,038 5,67,531 5,89,859 0.03 3.93
Domestic 4,13,082 3,94,844 4,04,770 4,38,104 6.06 8.24
International 1,76,605 1,79,194 1,62,761 1,51,755 (14.07) (6.76)
CASA Deposits 1,41,523 1,51,335 1,56,760 1,96,236 38.66 25.18
Domestic 1,23,796 1,32,539 1,38,553 1,77,259 43.19 27.94
International 17,727 18,796 18,207 18,977 7.05 4.23
Advances (Net) 3,84,272 3,83,770 3,54,150 3,49,960 (8.93) (1.18)
Domestic 2,59,187 2,63,268 2,46,494 2,50,033 (3.53) 1.44
International 1,25,085 1,20,502 1,07,655 99,927 (20.11) (7.18)
Terminal Figures
© 2017 Bank of Baroda. All Rights Reserved. Page | 3
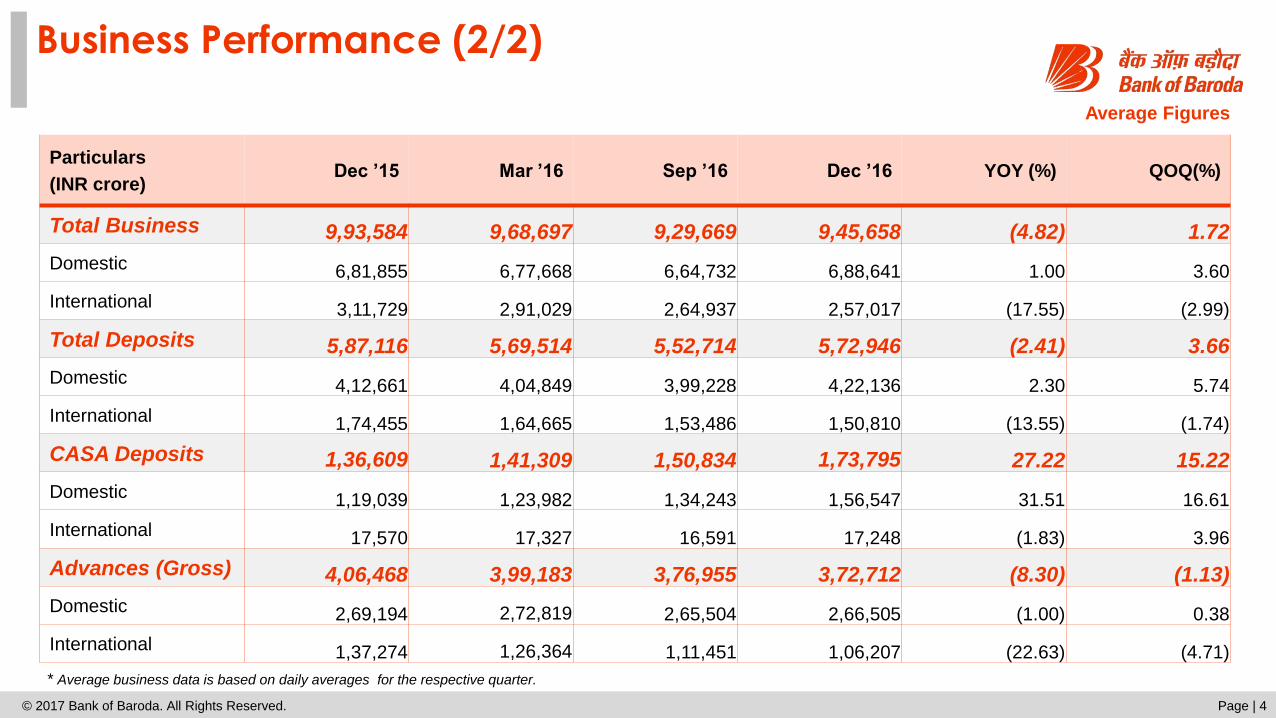
Business Performance (2/2)
Particulars
(INR crore)Dec ’15 Mar ’16 Sep ’16 Dec ’16 YOY (%) QOQ(%)
Total Business 9,93,584 9,68,697 9,29,669 9,45,658 (4.82) 1.72
Domestic 6,81,855 6,77,668 6,64,732 6,88,641 1.00 3.60
International 3,11,729 2,91,029 2,64,937 2,57,017 (17.55) (2.99)
Total Deposits 5,87,116 5,69,514 5,52,714 5,72,946 (2.41) 3.66
Domestic 4,12,661 4,04,849 3,99,228 4,22,136 2.30 5.74
International 1,74,455 1,64,665 1,53,486 1,50,810 (13.55) (1.74)
CASA Deposits 1,36,609 1,41,309 1,50,834 1,73,795 27.22 15.22
Domestic 1,19,039 1,23,982 1,34,243 1,56,547 31.51 16.61
International 17,570 17,327 16,591 17,248 (1.83) 3.96
Advances (Gross) 4,06,468 3,99,183 3,76,955 3,72,712 (8.30) (1.13)
Domestic 2,69,194 2,72,819 2,65,504 2,66,505 (1.00) 0.38
International 1,37,274 1,26,364 1,11,451 1,06,207 (22.63) (4.71)
Average Figures
© 2017 Bank of Baroda. All Rights Reserved. Page | 4
* Average business data is based on daily averages for the respective quarter.

CASA Deposits (1/2)
© 2017 Bank of Baroda. All Rights Reserved. Page | 5
Particulars
(INR crore)Dec ’15 Mar ’16 Sep ’16 Dec ’16 YOY (%) QOQ (%)
Total Saving Deposits1,10,060 1,16,705 1,23,990 1,55,821 41.58 25.67
Domestic1,06,509 1,13,253 1,20,267 1,51,505 42.25 25.97
International3,552 3,452 3,723 4,316 21.51 15.93
Total Current Deposits31,463 34,629 32,770 40,415 28.45 23.33
Domestic17,287 19,286 18,286 25,754 48.98 40.84
International14,175 15,343 14,484 14,661 3.43 1.22
Share of CASA to Domestic
Deposits (%) 29.97 33.57 34.23 40.46 - -
Share of CASA to Total Deposits
(%) 24.00 26.36 27.62 33.27 - -
Terminal Figures

CASA Deposits (2/2)
© 2017 Bank of Baroda. All Rights Reserved. Page | 6
Particulars
(INR crore)Dec ’15 Mar ’16 Sep ’16 Dec ’16 YOY (%) QOQ (%)
Total Saving Deposits 1,07,522 1,11,587 1,21,517 1,40,218 30.41 15.39
Domestic1,03,982 1,08,145 1,17,909 1,36,214 31.00 15.52
International3,540 3,443 3,608 4,004 13.11 10.98
Total Current Deposits 29,087 29,717 29,317 33,577 15.44 14.53
Domestic15,057 15,837 16,334 20,333 35.04 24.48
International14,030 13,883 12,983 13,244 (5.60) 2.01
Share of CASA to Domestic
Deposits (%) 28.85 30.62 33.63 37.08 - -
Share of CASA to Total Deposits
(%) 23.27 24.81 27.29 30.33 - -
Average Figures
* Average business data is based on daily averages for the respective quarter.

Income & Expenses
© 2017 Bank of Baroda. All Rights Reserved. Page | 7
Particulars
(INR crore)Q3 FY 16 Q4 FY 16 FY 16 Q2 FY 17 Q3 FY 17 YOY (%) QOQ(%)
Interest Income 10,614 11,014 44,061 10,485 10,406 (1.96) (0.75)
Other Income 1,113 1,775 4,999 1,562 1,775 59.48 13.64
Total Income 11,727 12,789 49,060 12,047 12,181 3.87 1.11
Interest Expenses 7,909 7,684 31,321 7,059 7,272 (8.05) 3.02
Net Interest Income 2,705 3,330 12,740 3,426 3,134 15.86 (8.52)
Operating Expenses 2,114 2,533 8,923 2,297 2,314 9.46 0.74
Operating Profit 1,704 2,572 8,816 2,690 2,595 52.29 (3.53)
Cost to Income Ratio (%) 55.37 49.61 50.30 46.05 47.14 - -
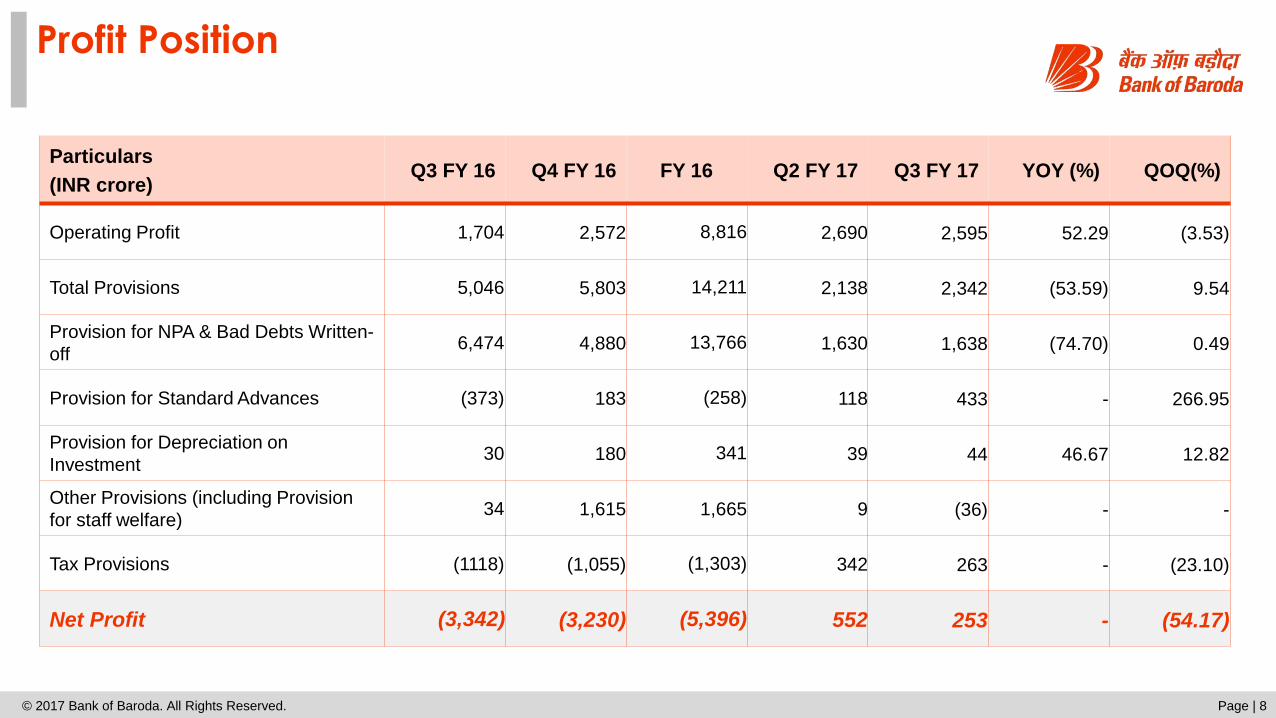
Profit Position
© 2017 Bank of Baroda. All Rights Reserved. Page | 8
Particulars
(INR crore)Q3 FY 16 Q4 FY 16 FY 16 Q2 FY 17 Q3 FY 17 YOY (%) QOQ(%)
Operating Profit 1,704 2,572 8,816 2,690 2,595 52.29 (3.53)
Total Provisions 5,046 5,803 14,211 2,138 2,342 (53.59) 9.54
Provision for NPA & Bad Debts Written-
off6,474 4,880 13,766 1,630 1,638 (74.70) 0.49
Provision for Standard Advances (373) 183 (258) 118 433 - 266.95
Provision for Depreciation on
Investment30 180 341 39 44 46.67 12.82
Other Provisions (including Provision
for staff welfare)34 1,615 1,665 9 (36) - -
Tax Provisions (1118) (1,055) (1,303) 342 263 - (23.10)
Net Profit (3,342) (3,230) (5,396) 552 253 - (54.17)

Non-Interest Income
© 2017 Bank of Baroda. All Rights Reserved. Page | 9
Particulars
(INR crore)Q3 FY 16 Q4 FY 16 FY 16 Q2 FY 17 Q3 FY 17 YOY (%) QOQ(%)
Commission, Exchange, Brokerage 339 454 1,502 372 370 9.14 (0.54)
Incidental Charges 91 116 382 148 129 41.76 (12.84)
Other Miscellaneous Income 128 110 463 155 133 3.91 (14.19)
FX Profits 241 481 1,252 273 255 5.81 (6.59)
Total Fee Income 799 1,162 3,599 948 887 11.01 (6.43)
Trading Gains – Profit from Sale of
Investments289 509 1,179 546 839 190.31 53.66
Recovery from PWO 24 104 221 68 49 104.17 (27.94)
Total Non-Interest Income 1,113 1,775 4,999 1,562 1,775 59.48 13.64

Non-Interest Income
© 2017 Bank of Baroda. All Rights Reserved. Page | 10
Total Non-interest Income has increased by 59.48% on YOY basis
Recovery from PWO2%
Incidental Charges
8%
Other Miscellaneous
Income12%
FX Profits22%
Trading Gains26%
Commission, Exchange, Brokerage
30%
Recovery from PWO3%
Incidental Charges
7%
Other Miscellaneous Income
8%
FX Profits14%
Trading Gains47%
Commission, Exchange, Brokerage
21%
Total Non
Interest Income
Q3 FY 16:
INR 1,113 Crore
Total Non
Interest Income
Q3 FY 17:
INR 1,775 Crore

Operating Expenses
© 2017 Bank of Baroda. All Rights Reserved. Page | 11
Particulars
(INR crore)Q3 FY 16 Q4FY16 FY 16 Q2 FY 17 Q3 FY 17 YOY (%) QOQ(%)
Employee Cost 1,155 1,434 4,978 1,169 1,139 (1.39) (2.57)
Other Operating Expenses 959 1,098 3,945 1,128 1,175 22.52 4.17
Of which:
Rent, Taxes and Lighting208 249 862 257 224 7.69 (12.84)
Printing and Stationery 18 25 82 19 20 11.11 5.26
Depreciation 139 140 501 121 126 (9.35) 4.13
Law charges 10 18 55 14 15 50.00 7.14
Postage, Telegrams, Telephone etc 39 42 154 42 31 (20.51) (26.19)
Repairs and Maintenance to Bank’s
Property116 164 540 154 178 53.45 15.58
Insurance 128 129 490 122 123 (3.91) 0.82
Other Expenditure 301 331 1,127 399 458 52.16 14.79
Operating Expenses 2,114 2,533 8,923 2,297 2,314 9.46 0.74

Performance Ratios
© 2017 Bank of Baroda. All Rights Reserved. Page | 12
9.5
7
9.0
2
9.3
6
9.2
1
9.0
8
2.0
7
2.3
1
2.4
4
2.6
1
2.6
0
7.0
4
6.9
0
7.2
3
7.2
6
7.2
3
Q3 FY 16 Q4 FY 16 Q1 FY 17 Q2 FY 17 Q3 FY 17
Yield on Advances (%)
Domestic International Global
2.1
1
2.7
0
2.8
0
2.8
5
2.4
9
0.8
7
0.9
2
0.9
8
0.9
8
0.9
8
1.7
2 2.1
5
2.2
3
2.2
9
2.0
6
Q3 FY 16 Q4 FY 16 Q1 FY 17 Q2 FY 17 Q3 FY 17
Net Interest Margin (%)
Domestic International Global
7.5
1
7.8
1
7.7
9
7.4
9
7.3
6
3.8
0
3.8
4
3.6
6
3.2
5
3.5
1
7.3
0
7.6
0
7.5
0
7.2
1
7.1
4
Q3 FY 16 Q4 FY 16 Q1 FY 17 Q2 FY 17 Q3 FY 17
Yield on Investment (%)
Domestic International Global
6.7
7
6.6
1
6.2
1
6.2
0
6.0
3
0.9
4
1.0
4
1.0
2
1.1
2
1.1
9
5.0
2
5.0
0
4.6
8
4.7
9
4.7
6
Q3 FY 16 Q4 FY 16 Q1 FY 17 Q2 FY 17 Q3 FY 17
Cost of Deposits (%)
Domestic International Global

Domestic Gross Credit – By Segment
© 2017 Bank of Baroda. All Rights Reserved. Page | 13
Retail Credit – By Segment (INR Crore)
24,332 26,548
4,5044,200
2,1672,062
20,725 18,510
Q3FY 16 Q3FY 17
Other Retail loans. Education Auto Home
51,72851,320
% share in Gross Domestic Credit in Q3 FY 17
% share in Gross Domestic Credit in Q3 FY 16
Agriculture16%
Retail19%
MSME20%
Large & Medium 24%
Misc. including Trade21%
Agriculture12%
Retail19%
MSME20%
Large & Medium 24%
Misc. including Trade25%
9.11% YOY growth in Home Loans
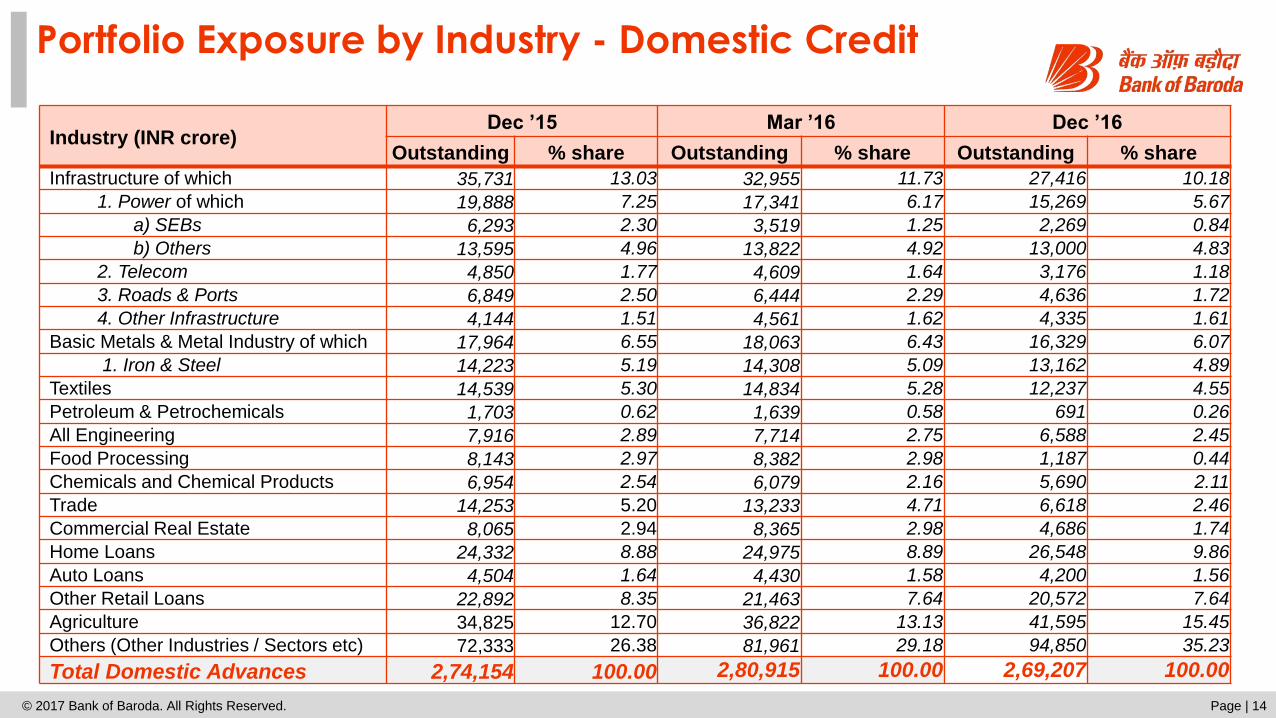
Portfolio Exposure by Industry - Domestic Credit
© 2017 Bank of Baroda. All Rights Reserved. Page | 14
Industry (INR crore)Dec ’15 Mar ’16 Dec ’16
Outstanding % share Outstanding % share Outstanding % share
Infrastructure of which 35,731 13.03 32,955 11.73 27,416 10.18
1. Power of which 19,888 7.25 17,341 6.17 15,269 5.67
a) SEBs 6,293 2.30 3,519 1.25 2,269 0.84
b) Others 13,595 4.96 13,822 4.92 13,000 4.83
2. Telecom 4,850 1.77 4,609 1.64 3,176 1.18
3. Roads & Ports 6,849 2.50 6,444 2.29 4,636 1.72
4. Other Infrastructure 4,144 1.51 4,561 1.62 4,335 1.61
Basic Metals & Metal Industry of which 17,964 6.55 18,063 6.43 16,329 6.07
1. Iron & Steel 14,223 5.19 14,308 5.09 13,162 4.89
Textiles 14,539 5.30 14,834 5.28 12,237 4.55
Petroleum & Petrochemicals 1,703 0.62 1,639 0.58 691 0.26
All Engineering 7,916 2.89 7,714 2.75 6,588 2.45
Food Processing 8,143 2.97 8,382 2.98 1,187 0.44
Chemicals and Chemical Products 6,954 2.54 6,079 2.16 5,690 2.11
Trade 14,253 5.20 13,233 4.71 6,618 2.46
Commercial Real Estate 8,065 2.94 8,365 2.98 4,686 1.74
Home Loans 24,332 8.88 24,975 8.89 26,548 9.86
Auto Loans 4,504 1.64 4,430 1.58 4,200 1.56
Other Retail Loans 22,892 8.35 21,463 7.64 20,572 7.64
Agriculture 34,825 12.70 36,822 13.13 41,595 15.45
Others (Other Industries / Sectors etc) 72,333 26.38 81,961 29.18 94,850 35.23
Total Domestic Advances 2,74,154 100.00 2,80,915 100.00 2,69,207 100.00
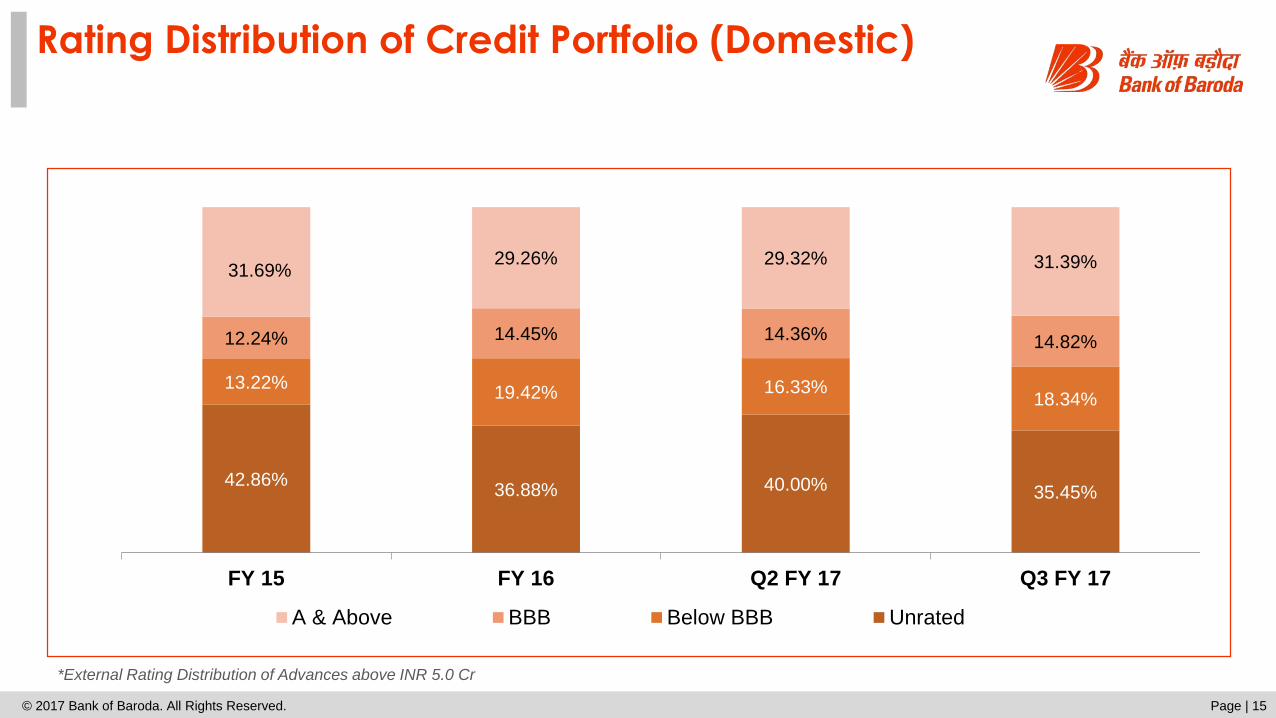
Rating Distribution of Credit Portfolio (Domestic)
© 2017 Bank of Baroda. All Rights Reserved. Page | 15
*External Rating Distribution of Advances above INR 5.0 Cr
42.86%36.88% 40.00% 35.45%
13.22%19.42% 16.33%
18.34%
12.24% 14.45% 14.36% 14.82%
31.69%29.26% 29.32% 31.39%
FY 15 FY 16 Q2 FY 17 Q3 FY 17
A & Above BBB Below BBB Unrated
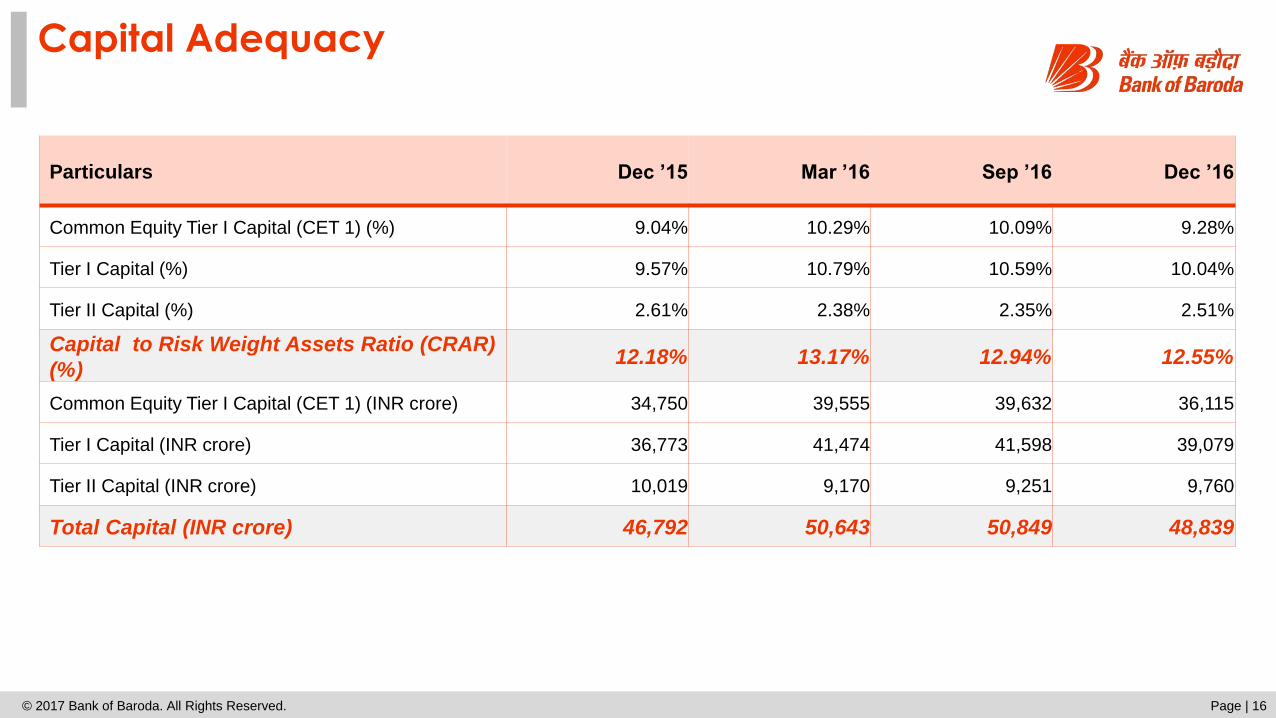
Capital Adequacy
© 2017 Bank of Baroda. All Rights Reserved. Page | 16
Particulars Dec ’15 Mar ’16 Sep ’16 Dec ’16
Common Equity Tier I Capital (CET 1) (%) 9.04% 10.29% 10.09% 9.28%
Tier I Capital (%) 9.57% 10.79% 10.59% 10.04%
Tier II Capital (%) 2.61% 2.38% 2.35% 2.51%
Capital to Risk Weight Assets Ratio (CRAR)
(%)12.18% 13.17% 12.94% 12.55%
Common Equity Tier I Capital (CET 1) (INR crore) 34,750 39,555 39,632 36,115
Tier I Capital (INR crore) 36,773 41,474 41,598 39,079
Tier II Capital (INR crore) 10,019 9,170 9,251 9,760
Total Capital (INR crore) 46,792 50,643 50,849 48,839

NPA Movement
© 2017 Bank of Baroda. All Rights Reserved. Page | 17
Particulars
(INR crore)Q3 FY 16 FY 16 Q2 FY 17 Q3 FY 17 9M,FY17
A. Opening Balance 23,710 16,261 42,991 42,949 40,521
B. Additions 15,785 27,828 2,861 4,135 10,847
Out of which, Fresh
Slippages
15,60326,863 2,252
3,0738,942
C. Reductions 561 3,569 2,903 4,442 8,725
Recovery 311 1,481 1,653 1,345 3,011
Upgradation 14 534 1,034 1,322 2,552
Write-Offs 236 1,554 216 1,775 3,162
Other Adjustments 0 1 0 0 0
Closing Balance 38,934 40,521 42,949 42,642 42,642
Recovery in PWO 24 221 68 48 154
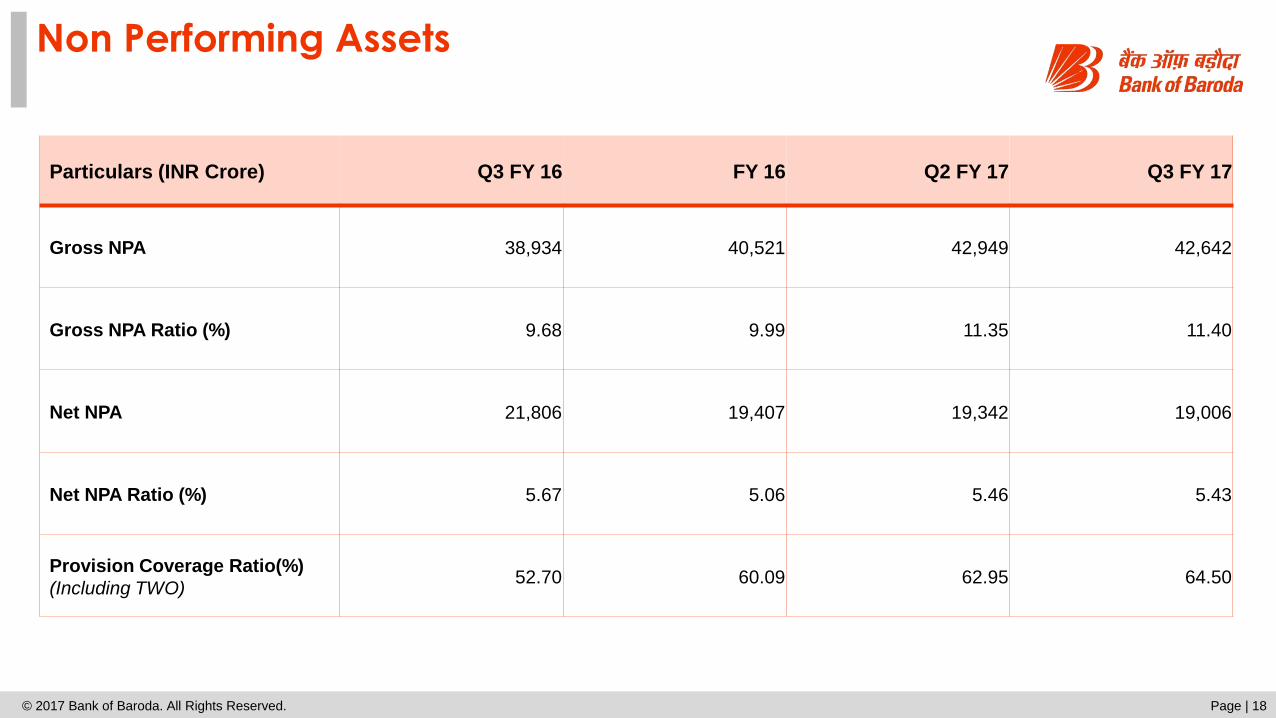
Non Performing Assets
© 2017 Bank of Baroda. All Rights Reserved. Page | 18
Particulars (INR Crore) Q3 FY 16 FY 16 Q2 FY 17 Q3 FY 17
Gross NPA 38,934 40,521 42,949 42,642
Gross NPA Ratio (%) 9.68 9.99 11.35 11.40
Net NPA 21,806 19,407 19,342 19,006
Net NPA Ratio (%) 5.67 5.06 5.46 5.43
Provision Coverage Ratio(%)
(Including TWO)52.70 60.09 62.95 64.50

Details of Restructured Assets
© 2017 Bank of Baroda. All Rights Reserved. Page | 19
Particulars
(INR crore)Q3 FY 16 Q4 FY 16 Q2 FY 17 Q3 FY 17
Standard NPA Total Standard NPA Total Standard NPA Total Standard NPA Total
Restructured Accounts
as on Opening Balance 22,930 7240 30,170 17,134 13,582 30,716 14,164 15,645 29,809 13,860 14,604 28,464
Fresh Restructuring +
Increase in Outstanding 657 960 1,617 1,278 316 1,594 2,845 291 3,136 879 631 1,510
Up gradation to Restructured
Standard category 15 (15) 0 413 (413) 0 76 (76) 0 696 (696) 0
Restructured Standard
Advances upgraded to
full Standard advances (53) 0 (53) (225) 0 (225) (2,485) 0 (2,485) (382) 0 (382)
Down gradations of
Restructured accounts (5,796) 5796 0 (2,060) 2,060 0 (136) 136 0 (462) 462 0
Depreciation Write-off +
Decrease in Outstanding +
Closures (618) (399) (1,017) (2,805) (276) (3,081) (604) (1,392) (1,996) (532) (41) (573)
Total Restructured Accounts
as Closing Balance 17,135 13,582 30,717 13,735 15,269 29,004 13,860 14,604 28,464 14,059 14,960 29,019

Details of Impaired Assets
© 2017 Bank of Baroda. All Rights Reserved. Page | 20
Particulars
(INR crore)Dec ’15 Mar ’16 Sep ’16 Dec ’16
Gross Advances 4,02,073 4,05,517 3,78,258 3,74,075
Gross NPAs 38,934 40,521 42,949 42,642
Net NPAs 21,806 19,406 19,342 19,006
Restructured Standard Assets 17,135 13,735 13,860 14,059
Total Gross NPAs + Restructured
Standard56,069 54,256 56,809 56,701
Total Net NPAs + Restructured Standard 38,941 33,142 33,202 33,065
Gross NPA + Restructured Standard to
Gross Advances (%)13.94 13.38 15.02 15.16
Net NPAs + Restructured Standard to
Gross Advances (%)9.69 8.17 8.78 8.84

Domestic Treasury Highlights: Q3 FY 17
© 2017 Bank of Baroda. All Rights Reserved. Page | 21
Treasury Non Interest Income stood at the level of INR 1,094 crore in Q3FY
17 and provided good support to Non-Interest Income generation.
As on December 31, 2016, the share of SLR Securities in Total Investment
was 92.26%.
The per cent of SLR Securities to NDTL at December 31, 2016 was at 33.97%.
As on December 31, 2016, the modified duration of AFS investments was 2.56 & that of HTM securities was
5.53.
Total size of the Bank’s Domestic Investment Book as on December 31, 2016 stood at INR 1,70,057 crore.
The Bank had 53.60% of SLR Securities in HTM and 27.14% in AFS at December 31, 2016.
In Q3 FY 17, amount of INR 20.11 croreis towards Depreciation on Investment.

International Presence spanning 107 offices across 24 countries
© 2017 Bank of Baroda. All Rights Reserved. Page | 22
59 Branches in 15 countries; 8 Subsidiaries having 47 Branches and 1 Representative Office
1 Joint Venture, 1 Associate with 32 branches
Americas
USA
Bahamas
Guyana
Trinidad & Tobago
Europe
UK
Brussels
Africa
Uganda
Kenya
Botswana
Tanzania
South Africa
Mauritius
Mauritius (OBU)
Seychelles
Ghana
Zambia
Middle East
UAE
DIFC
Oman
Bahrain
South East Asia
China
Hong Kong
Singapore
Malaysia
Far East
FijiAustralia
New Zealand Color Codes
• Wholesale business
• Full Banking Centres
• Offshore Banking Units
• Joint Venture
• Associate
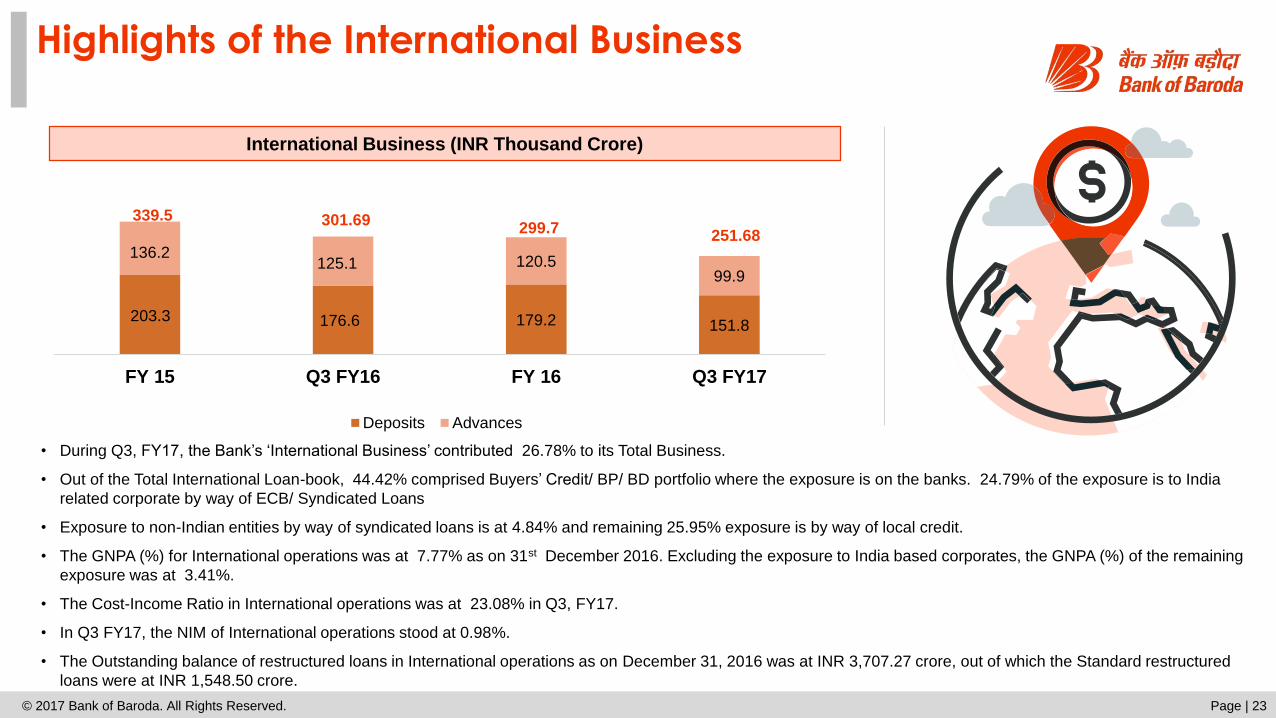
Highlights of the International Business
© 2017 Bank of Baroda. All Rights Reserved. Page | 23
• During Q3, FY17, the Bank’s ‘International Business’ contributed 26.78% to its Total Business.
• Out of the Total International Loan-book, 44.42% comprised Buyers’ Credit/ BP/ BD portfolio where the exposure is on the banks. 24.79% of the exposure is to India
related corporate by way of ECB/ Syndicated Loans
• Exposure to non-Indian entities by way of syndicated loans is at 4.84% and remaining 25.95% exposure is by way of local credit.
• The GNPA (%) for International operations was at 7.77% as on 31st December 2016. Excluding the exposure to India based corporates, the GNPA (%) of the remaining
exposure was at 3.41%.
• The Cost-Income Ratio in International operations was at 23.08% in Q3, FY17.
• In Q3 FY17, the NIM of International operations stood at 0.98%.
• The Outstanding balance of restructured loans in International operations as on December 31, 2016 was at INR 3,707.27 crore, out of which the Standard restructured
loans were at INR 1,548.50 crore.
203.3 176.6 179.2 151.8
136.2125.1 120.5
99.9
FY 15 Q3 FY16 FY 16 Q3 FY17
Deposits Advances
299.7251.68
International Business (INR Thousand Crore)
339.5 301.69

International Operations Asset Liability Management
© 2017 Bank of Baroda. All Rights Reserved. Page | 24
Deployment: December 2015
Resources: December 2016
Resources: December 2015
Deployment: December 2016
*Ramping up our capabilities in local advances to boost fee based income & improve spreads
Customer Deposit
50%InterBank Deposit
26%
Borrowings8%
Capital6%
Other Liabilities10%
Buyers Credit21% BP BD
2%
Syndication15%
Local Credit16%
Placement40%
Investment4%
Other Assets2%
Customer Deposit
47%
InterBank Deposit
30%
Borrowings9%
Capital5%
Other Liabilities9%
Buyers Credit27%
BP BD2%
Syndication14%
Local Credit16%
Placement36%
Investment4%
Other Assets1%
* Rundown in Local Credit in Dec’16 due to repayment of Loans against FCNR(B) deposits

Bank of Baroda: Our Key Strengths
© 2017 Bank of Baroda. All Rights Reserved. Page | 25
Established on July 20, 1908, Bank of Baroda is a 108 year old Bank with 59.24% stake held by
the Government of India.
Strong domestic presence through 5,382 branches & 10,404
ATMs and Cash Recyclers supported by self-service
channels
A well recognized brand in the Indian Banking Industry
Subsidiaries and JVs cover entire Financial Spectrum -
Insurance, Asset Management, Capital Markets, Securities
Services
Deep Financial Inclusion Coverage – 25.87 million accounts,
with a total deposits of INR 9,100 crore and average balance
of INR 3,527.
Customer base of ~69.25 million
Well distributed branch network with 34% coverage in Rural,
28% in Semi-urban, 21% Metro and 17% Urban
Usually a net lender in the market, maintaining adequate
liquidity in all business cycle phases
Global presence across 107 offices spanning 24countries
Capital Adequacy Ratio of 12.90% (consolidated) above the
regulatory requirements
Employee strength of 52,675

Shareholding Pattern as on December 31, 2016
© 2017 Bank of Baroda. All Rights Reserved. Page | 26
Government of India
59.24%
Mutual Funds8.71%
Insurance Companies
12.38%
FIIs & FPIs 11.65%
Indian Public5.06%
Corporate Bodies1.38%
Others1.58%
As on December 31, 2016
Share Capital: INR 460.83 crore
Net worth: INR 31,322 crore
Bank of Baroda is a part of the following Indices:
BSE 100, BSE 200, BSE 500 & Bankex
Nifty, BankNifty, Nifty 100, Nifty 200, Nifty 500
Bank of Baroda’s shares are also listed on BSE and NSE in
the ‘Future and Options’ segment
FII – Foreign Institutional Investors
FPI – Foreign Portfolio Investors

Pan India Presence
© 2017 Bank of Baroda. All Rights Reserved. Page | 27
Wide Domestic Branch Network
980 989 1008 1156
849 903 933 919
1,273 1,386 1,4251,495
1,7721,912 1,964 1,812
*FY 14 *FY 15 *FY 16 ** Q3 FY 17
Metro Urban Semi Urban Rural
4,8745,190 5,3825,330
ATM Network
*Total : 10,404 ATMs and Cash Recyclers
46 e-lobbies, with 24*7 facilities for cash withdrawal, cash deposit, cheque
deposit, passbook printing and internet banking, were set up during the
quarter, taking the total number of e-lobbies to 326.
*FY14,FY15 and FY16 data as per 2001 census.
** Q3 FY 17 data as per the 2011 census .

Digital Footprint
© 2017 Bank of Baroda. All Rights Reserved. Page | 28
45.0
56.2
49.7
55.0
43.8
50.3
Q3 FY 15 Q3 FY 16 Q3 FY 17
Fin ADC Txn % Over the Counter Txn %
~28 lakh new Debit cards were issued during Q3 FY 17 out of which 24.53% were issued in
existing accounts. Apart from Debit Cards, the Bank also offers Credit, Forex and Gift
Cards
Product Suite
Mobile Banking Transactions
(YOY growth)Internet Banking Transactions
(YOY growth)
POS/ E-Comm Transactions
(YOY growth)
114.50% 48.45%
199.54 %Unique Customers added during Nov ’16
ATM & CR: 20.91 lakh
POS & E-Comm: 16.86 lakh
315 326 326
493 495 498
0
100
200
300
400
500
600
Oct-16 Nov-16 Dec-16
No of E Lobby No of Express E Lobby

Page I 29
Digital Footprint
Page | 29
Mission Digital launched by the Bank
Education
• 74 Regions has been imparted training for use of ADC products
• Data provided to all business units have Customer insight and products promotion
Ground Team
•2000+ Digital Champions identified for promotions of ADC Products
Visibility
•92 Digital Villages identified
•Branding “Cash less ZindagiBindass Zindagi”
Mission Digital
•Less Cash Society
•Revolution in Digital Payment System
Marketing support extended through promotional campaigns
One of the First Banks to complete re-calibration of ATMs & making them Cash ready
Campaign “Swipe Karo Fly Karo” resulted in 47% increase in average ticket size and 244% increase in spend values
© 2017 Bank of Baroda. All Rights Reserved.

Page I 30Page I 30©2017 Bank of Baroda All Rights Reserved
New Digital Initiatives: Products & Services launched in this Quarter
Mobile Wallet – M Clip
• Transfer Money to any contact saved on Mobile or to Email
• Virtual card - can be used at any e-commerce site for transaction
• Application now available on Android and iOS phones.
• Make Bill Payment, book Bus Ticket
• Make mVisa Payment for QR Code based payment
• Grocery, Discount coupon and Restaurant coupons available for the benefit of customers
• Total Registration till Dec 2016: 95,320
Unified Payment interface
• One App for multiple bank accounts.
• Send and receive money instantly
• Safe and Secure -1 Click two-factor authentication
• Secrecy of account and card details by using Virtual ID and Aadhar Number
• Scan and Pay (QR based payments available)
• Instant mPin generation with Debit card and OTP
• Total Registration till Dec 2016: 40,189
• To Serve Mass Rural Population Bank of Baroda in Collaboration with NPCI has launched Mobile Banking Application for android users.
• Bank of Baroda become India’s First Bank to launch this type of application
• There is no need to of GPRS/Wi-Fi connectivity; this app works on USSD platform after installation.
• Multilingual App and available in 10 different language.
Baroda NUUP Mobile Banking App
Page I 31Page I 31
Details
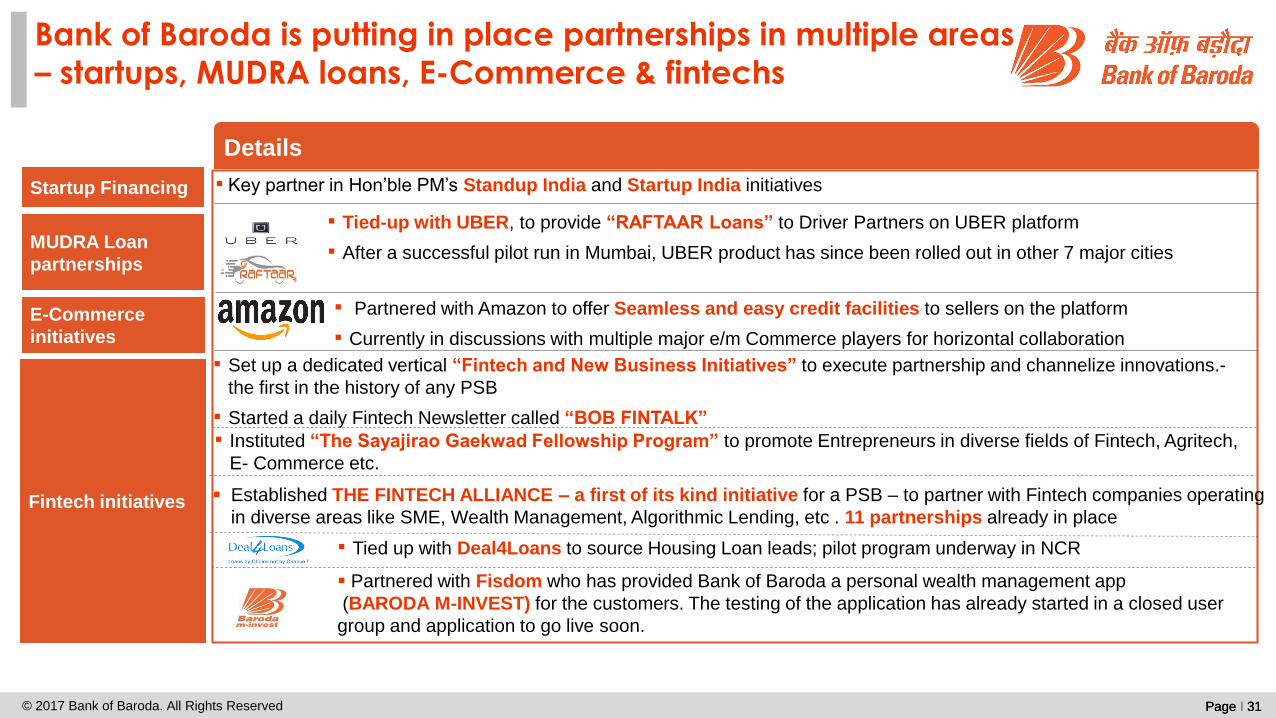
Bank of Baroda is putting in place partnerships in multiple areas
– startups, MUDRA loans, E-Commerce & fintechs
▪ Key partner in Hon’ble PM’s Standup India and Startup India initiativesStartup Financing
© 2017 Bank of Baroda. All Rights Reserved
▪ Tied-up with UBER, to provide “RAFTAAR Loans” to Driver Partners on UBER platform
▪ After a successful pilot run in Mumbai, UBER product has since been rolled out in other 7 major cities MUDRA Loan
partnerships
▪ Set up a dedicated vertical “Fintech and New Business Initiatives” to execute partnership and channelize innovations.-
the first in the history of any PSB
▪ Started a daily Fintech Newsletter called “BOB FINTALK”
Fintech initiatives
▪ Instituted “The Sayajirao Gaekwad Fellowship Program” to promote Entrepreneurs in diverse fields of Fintech, Agritech,
E- Commerce etc.
▪ Tied up with Deal4Loans to source Housing Loan leads; pilot program underway in NCR
Partnered with Fisdom who has provided Bank of Baroda a personal wealth management app
(BARODA M-INVEST) for the customers. The testing of the application has already started in a closed user
group and application to go live soon.
E-Commerce
initiatives
▪ Partnered with Amazon to offer Seamless and easy credit facilities to sellers on the platform
▪ Currently in discussions with multiple major e/m Commerce players for horizontal collaboration
Established THE FINTECH ALLIANCE – a first of its kind initiative for a PSB – to partner with Fintech companies operating
in diverse areas like SME, Wealth Management, Algorithmic Lending, etc . 11 partnerships already in place
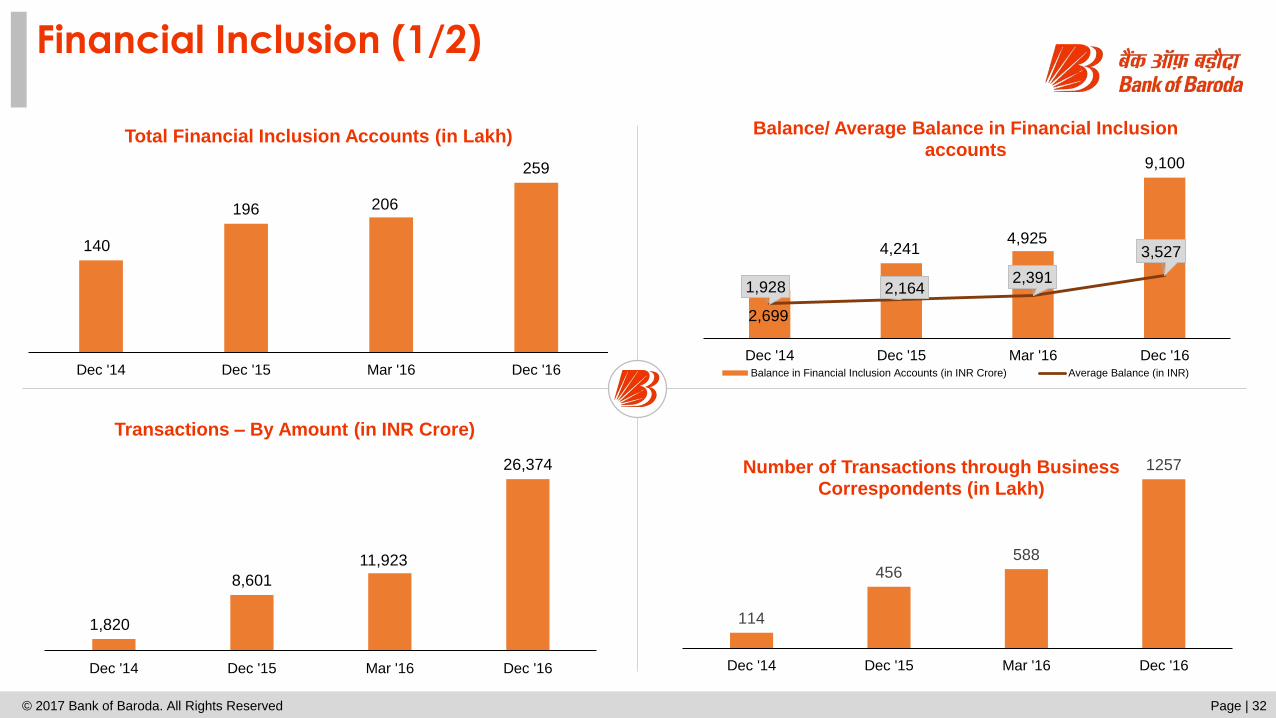
Financial Inclusion (1/2)
Page | 32
2,699
4,2414,925
9,100
1,928 2,1642,391
3,527
Dec '14 Dec '15 Mar '16 Dec '16
Balance/ Average Balance in Financial Inclusion accounts
Balance in Financial Inclusion Accounts (in INR Crore) Average Balance (in INR)
1,820
8,601
11,923
26,374
Dec '14 Dec '15 Mar '16 Dec '16
Transactions – By Amount (in INR Crore)
114
456588
1257
Dec '14 Dec '15 Mar '16 Dec '16
Number of Transactions through Business Correspondents (in Lakh)
140
196 206
259
Dec '14 Dec '15 Mar '16 Dec '16
Total Financial Inclusion Accounts (in Lakh)
© 2017 Bank of Baroda. All Rights Reserved

Financial Inclusion (2/2)
Page | 33
In Q3 FY 17, Bank has conducted 540 Financial Literacy Programs across 49 Financial Literacy Centers (FLCs) spread across the
country. 17,695 youths have been trained and 7215 youth settled through these programs in FY 16.
Social Security Schemes (Enrolment up to December 31, 2016 in Lakh)
Pradhan Mantri Suraksha Bima Yojana 43.29
Pradhan Mantri Jeevan Jyoti Bima Yojana 15.24
Atal Pension Yojana 2.20
47%
40%
28%22%
17%
23%
FY 15 Q1 FY 16 H1 FY 16 Q3 FY 16 FY 16 Q3 FY 17
Zero Balance Accounts (%)
© 2017 Bank of Baroda. All Rights Reserved

Project Navoday – Our comprehensive transformation journey continues in execution mode
Collections
& Recovery
Digitization
&
Technology
Analytics
Marketing
& Brand
Building
People &
Organization
Governance
Compliance
& Controls
Risk
Management
Segmented
Business Strategy
Page | 34© 2017 Bank of Baroda. All Rights Reserved

Page | 35
CONSOLIDATED FINANCIALS | Q3 FY 2017
© 2017 Bank of Baroda. All Rights Reserved

Subsidiaries, Joint Ventures and Associates
Page | 36
Domestic Subsidiaries, Joint Ventures
and Associates
Proportion of
Ownership
Subsidiaries
BOBCARDS Limited 100.00%
BOB Capital Markets Limited 100.00%
Associate Bank
Nainital Bank Limited 98.57%
Joint Ventures
India First Life Insurance Company Limited 44.00%
India Infradebt Limited 30.00%
Associates
Baroda Pioneer Asset Management Company Ltd 49.00%
Baroda Pioneer Trustee Co. Pvt. Limited 49.00%
Regional Rural Banks
Baroda Uttar Pradesh Gramin Bank 35.00%
Baroda Rajasthan Gramin Bank 35.00%
Baroda Gujarat Gramin Bank 35.00%
International Subsidiaries, Joint
Ventures and Associates
Proportion of
Ownership
Subsidiaries
Bank of Baroda (Botswana) Limited 100.00%
Bank of Baroda (Kenya) Limited 86.70%
Bank of Baroda (Uganda) Limited 80.00%
Bank of Baroda (Guyana) Inc 100.00%
Bank of Baroda (New Zealand) Limited 100.00%
Bank of Baroda (Tanzania) Limited 100.00%
Bank of Baroda (Trinidad & Tobago) Limited 100.00%
Bank of Baroda (Ghana) Limited 100.00%
Joint Venture
India International Bank (Malaysia), Berhad 40.00%
Associate
Indo-Zambia Bank Limited 20.00%
Overseas Non-Banking Subsidiary
BOB (UK) Limited 100.00%
© 2017 Bank of Baroda. All Rights Reserved

Balance Sheet – Consolidated
Page | 37
Particulars
(INR crore)Dec ’15 Mar ’16 Sep ’16 Dec ’16
CAPITAL & LIABILITIES
Capital 462 462 462 462
Reserves & Surplus 41,671 42,041 42,926 43,248
Minority Interest 171 194 221 227
Deposits 6,01,598 5,86,690 5,81,414 6,04,586
Borrowings 33,232 33,845 33,352 32,567
Other Liabilities & Provisions 28,536 27,947 25,752 29,221
T O T A L 7,05,670 6,91,179 6,84,127 7,10,311
ASSETS
Cash and Balances with RBI 23,510 22,811 21,893 29,975
Balances with Banks 1,08,253 1,14,188 1,22,427 1,00,024
Investments 1,54,329 1,28,894 1,45,914 1,89,042
Loans & Advances 3,91,629 3,91,486 3,62,064 3,58,129
Fixed Assets 3,125 6,359 6,125 6,107
Other Assets 24,824 27,441 25,705 27,034
T O T A L 7,05,670 6,91,179 6,84,127 7,10,311
© 2017 Bank of Baroda. All Rights Reserved

Profit & Loss - Consolidated
Page | 38
Particulars
(INR crore)Q3 FY 16 Q4 FY 16 Q2 FY 17 Q3 FY 17 YOY (%) QOQ (%)
Net Interest Income 2,970 3,574 3,791 3,424 15.29 (9.68)
Non Interest Income 1,427 2,112 1,932 2,039 42.89 5.54
Fee Income 365 480 397 403 10.41 1.51
Premium Income 269 336 269 195 (27.50) (27.51)
Other Income 793 1,296 1,267 1,441 81.72 13.73
Total Income 4,397 5,686 5,723 5,463 24.24 (4.54)
Operating Expenses 2,416 2,857 2,631 2,542 5.215 (3.38)
Operating Profit 1,981 2,829 3,092 2,921 47.45 (5.53)
Provisions 6,066 7,030 2,056 2,249 (62.90) 9.39
Profit before Tax (4,085) (4,201) 1,036 672 - (35.14)
Tax (824) (1,028) 395 316 - (20.00)
Minority Interest 8 10 10 11 37.50 10.00
Share of Earning in Associates (19) 12 20 17 - (15.00)
Profit after Tax (3,288) (3,171) 651 362 - (44.39)
© 2017 Bank of Baroda. All Rights Reserved

Capital Adequacy - Consolidated
Page | 39
Key ratios (Consolidated) Dec ’15 Mar ’16 Sep ’16 Dec ’16
Return on average Net worth (%) (8.23) (8.25) 1.93 1.07
Weighted average EPS (INR) (14.27) (13.74) 5.19 1.57
Book value (INR) 163.95 143.07 146.73 147.50
Capital Adequacy Ratio (%)- Basel-III 12.66 13.63 13.38 12.90
Total Capital (INR crore) 49,957 53,960 54,139 51,608
Tier I (INR crore) 39,731 44,681 44,780 41,809
Tier II (INR crore) 10,226 9,279 9,359 9,799
© 2017 Bank of Baroda. All Rights Reserved
Safe Harbor
Page | 40
This presentation has been prepared by Bank of Baroda (the
“Bank”) solely for information purposes, without regard to any
specific objectives, financial situations or informational needs of
any particular person.
Except for the historical information contained herein, statements
in this release which contain words or phrases such as “will”,
“aim”, “will likely result”, “would”, “believe”, “may”, “expect”, “will
continue”, “anticipate”, “estimate”, “intend”, “plan”, “contemplate”,
“seek to”, “future”, “objective”, “goal”, “strategy”, “philosophy”,
“project”, “should”, “will pursue” and similar expressions or
variations of such expressions may constitute "forward-looking
statements". These forward-looking statements involve a number
of risks, uncertainties and other factors that could cause actual
results to differ materially from those suggested by the forward-
looking statements. These risks and uncertainties include, but are
not limited to our ability to successfully implement our strategy,
future levels of non-performing loans, our growth and expansion,
the adequacy of our allowance for credit losses, our provisioning
policies, technological changes, investment income, cash flow
projections, our exposure to market risks as well as other risks.
Bank of Baroda undertakes no obligation to update the forward-
looking statements to reflect events or circumstances after the
date thereof.
Note: All financial numbers in the presentation are from Audited
Financials or Limited Reviewed financials or based on
Management estimates.
© 2017 Bank of Baroda. All Rights Reserved

Thank You