performance analysis of non-banking financial institutions
TRANSCRIPT
International Journal of Research in Economics and Social Sciences (IJRESS)
Available online at : http://euroasiapub.org Vol. 6 Issue 11, November - 2016, pp 1~14 ISSN(o): 2249-7382 | Impact Factor: 6.225 , | Thomson Reuters ID: L-5236-2015
International Journal of Research in Economics & Social Sciences
Email:- [email protected], http://www.euroasiapub.org
(An open access scholarly, peer-reviewed, interdisciplinary, monthly, and fully refereed journal.)
1
Performance Analysis of Non-Banking Financial Institutions
Dr. Rosy Kalra
Assistant Professor
Amity Business School,
Amity University (UP)
Noida.
Abstract
Introduction
In our Economy, there are two major Financial Institutions. One is Banking and other is
Non-Banking.
A Non-Banking Financial Company (NBFC) is a company enlisted under the Companies Act, 1956.
An NBFC indulges in the nosiness of loans and advances, acquisition of shares/ stocks/ bonds/
debentures/ securities which are issued by Government or local authority or other attractive
securities of similar nature, leasing, hire-purchase, insurance business, chit business but does it
does not include any institution whose main business is that of agriculture, industrial activity,
buying and selling of any other goods (goods other than securities) or providing any service or
sale/purchase/construction of immovable property.
NBFIs have gained popularity in the recent times. They work to offer upgraded value equity and
risk based items and give finance to numerous divisions in the economy. NBFCs are developing as
a distinct option for conventional banking. Furthermore, NBFCS are likewise rising as essential
part of Indian Financial System and they have admirable commitments to the Government's
motivation to money related Inclusion. They have been successful to an extent by offering credit to
retail customers in regions where people don’t have bank accounts. Many such borrowers take
credit from NBFCs and over the years use their performance record with NBFCs and experience to
wind up bankable borrowers. They are today going through an extremely pivotal stage where
Reserve Bank of India has provided a reviewed regulatory structure with a goal to synchronize it
with banks and Financial Institutions and address regulatory gaps and arbitrage. Therefore it gets
to be vital to study the performance analysis of NBFCs and analyse it.
Keywords: NBFCs, Banking, Credit, Microfinance, Performance Analysis

International Journal of Research in Economics and Social Sciences (IJRESS) Vol. 6 Issue 11, November - 2016 ISSN(o): 2249-7382 | Impact Factor: 6.225
International Journal of Research in Economics & Social Sciences
Email:- [email protected], http://www.euroasiapub.org
(An open access scholarly, , peer-reviewed, interdisciplinary, monthly, and fully refereed journal)
2
Evolution of the regulatory framework for NBFCs:
While NBFIs help to boost the economy, they additionally bring dangers too. The best way to
control these dangers is through legitimate regulation. Risks will vary depending on the
economic functions performed by NBFIs. The challenge for regulation is striking the right
harmony between the risks and advantages. From one perspective, too less or no regulation can
lead to crisis and seriously affect the vulnerable and the economy. Then again, excessively strict
or inappropriate regulation can impede advancement and improvement. The call for
"deregulation" in created economies mirrors this. Getting the right adjust is a never-ending
challenge for budgetary controllers and bosses in the developing nations, as well as in developed
and progressive economies. The regulatory framework for NBFCs has thus evolved over the
years.
In 1964, Numerous expert groups like the Narasimham Committee and the Working Group on
Financial Companies evaluated and gave suggestions as on their role in the financial sector, the
growth potential, and regulatory changes which can be applied to reduce the gaps. A large
number of the proposals of these boards were bit by bit interlaced to form regulations for the
NBFC part. With NBFCs emerging as a vital segment closely linked with other entities in the
financial sector tied with the disappointments of several large NBFCs, a more wide-ranging and
improved framework was put into place by the RBI by way of the introduction of prudential
norms in 1996. In 2007, the RBI defined deposit accepting and non-deposit accepting NBFCs and
separate prudential norms were issued. Currently there are directions with regard to exposure
norms, provisioning, capital adequacy requirements for deposit accepting NBFCs and
non-deposit accepting NBFCs, different set of regulations for several categories of NBFCs and
more. In 2014 the norms were further tightened. The new norms are being implemented in a
step by step manner, are now made valid for NBFCs that manage funds worth Rs 500 crore and
for those that accept public deposits. A lighter regulatory structure has been placed on NBFCs
other than for those with large asset sizes and deposit accepting. For NBFCs with large asset
sizes, and for all deposit-accepting NBFCs, regulations have been synchronized across NBFCs
with the intent to create a level-playing field that does not unjustifiably favour any institution.
The NBFC area in India has underwent a huge change in the course of latest years and has come
to be perceived as a systemically vital part of the finance system. NBFCs are currently firmly
interconnected with entities in the monetary sector and may be wide open to risk which could
affect the NBFC segment and in addition other different members in the financial sector.
The NBFC section has seen alliance over the later past as demonstrated by the aggregate number
of registered NBFCs with the RBI seeing a consistent year on year fall against the overall
development in their assets over the same period.
Growth and Profitability:
The NBFCs division has demonstrated a consistent year-by-year development in net benefits in
the course of recent couple of years. The impacts of the market recovery are evident particularly
in the year 2014. With the Government and RBI's expanded spotlight on financial inclusion, one
could expect a proceeded growth run in the coming years. NBFCs have progressively increased in
size and market share, signifying the success of the business models followed by them and the
International Journal of Research in Economics and Social Sciences (IJRESS) Vol. 6 Issue 11, November - 2016 ISSN(o): 2249-7382 | Impact Factor: 6.225
International Journal of Research in Economics & Social Sciences
Email:- [email protected], http://www.euroasiapub.org
(An open access scholarly, , peer-reviewed, interdisciplinary, monthly, and fully refereed journal)
3
opportunities available in their targeted markets. The total share of NBFCs has gradually risen
from 10.7% in 2009 to 14.3% of banking assets in 2014, thus gaining complete significance. If we
see the assets side, the share of NBFCs’ assets as a fraction of Gross Domestic Product (GDP) at
current market prices has increased progressively from 8.4% in 2006 to 12.5% in 2013.
Research Methodology: The study uses yearly data of 20 Non-Banking Financial Companies for the
period of 2006 to 2015.
These Companies are classified as asset based companies and core investment
companies.
Secondary data is collected from their annual reports and websites.
Research Objectives: To analyze the performance of selected Non-Banking Financial Companies.
To study the financial structure of Non-Banking Financial Companies in India
To analyze the profitability of selected Non-Banking Financial Companies
Tools Used:
Graphical Representations through Microsoft Excel
Correlation and Regression through SPSS
Ratios through Microsoft Excel
Data Analysis
In order to compute the performance of the Non-Banking Financing Institutions graphical
analysis is used to ascertain the growth over time in different financial aspects. Table 1 provides
a comparative financial position of different years as indicators of growth over mentioned period
of time. From the table it is evident that financial aspects of the non-bank financial institution
have become better off with the passage of time.

International Journal of Research in Economics and Social Sciences (IJRESS) Vol. 6 Issue 11, November - 2016 ISSN(o): 2249-7382 | Impact Factor: 6.225
International Journal of Research in Economics & Social Sciences
Email:- [email protected], http://www.euroasiapub.org
(An open access scholarly, , peer-reviewed, interdisciplinary, monthly, and fully refereed journal)
4
Table 1:
Year Deposits Loans & Advances Assets Investments Total income Total Expenditure
Core Investment NBFCs
2006 0 366.31 1455.73 989.19 424.48 304.2
2007 0 330.63 3010.19 2124.53 645.8 494.07
2008 0 1414.29 7606.6 5820.01 828.92 593.3
2009 0 942.19 9681.98 6646.88 990.98 714.34
2010 0 2364.62 12165.19 9466.07 1318.62 993.21
2011 137.41 2597.83 13990.41 10728.14 2290.7 1854.59
2012 1695.12 3366.54 14459.49 11267.63 2389.74 2690.38
2013 161.43 5202.83 15975.23 12475.67 2462.06 2546.23
2014 341.42 5354.13 17284.23 15307.88 2896.27 2008.39
2015 14.08 6412.96 18739.23 15128.24 2341.67 1783.78
Asset Financing NBFCs
2006 0 11150.37 16200.8 1571.27 15255.99 12317.01
2007 0 14579.37 22430.64 1524.5 21178.55 17107.82
2008 0 18941.66 24929.2 3000.45 25943.95 19238.29
2009 0 21385.44 29156.42 3268.72 26005.13 20430.29
2010 0 31860.65 41608.03 3740.71 33352.62 25588.22
2011 4134.02 54971.87 56735.52 5960.77 44259.81 33363.03
2012 3241.52 81891.86 78660.52 5961.76 58583.16 44051.64
2013 1724.47 98780.88 91226.53 7472.86 67063.96 50483.31
2014 1790.77 96969.56 93459.11 8054.19 67564.06 50358.89
2015 1233.24 109532.8 101988.4 7934.49 65405.2 48250.45
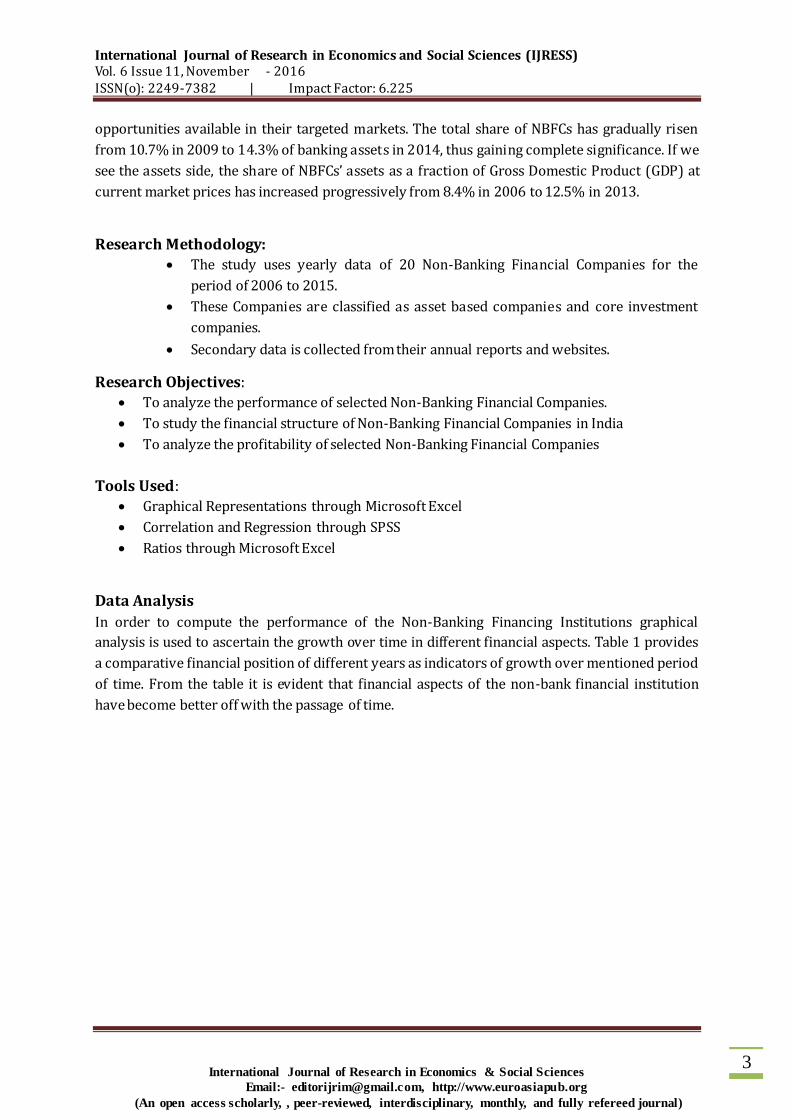
From Figure 3 it can be seen that the gap between deposits and loans and advances is widening
which shows that Core Investment NBFCs have become efficient in mobilising their deposits
to investments. Also their Loans and Advances have increased by 1650% in ten years which
shows that the widening their operations and have extended loans and advances to a large
number of population.
International Journal of Research in Economics and Social Sciences (IJRESS) Vol. 6 Issue 11, November - 2016 ISSN(o): 2249-7382 | Impact Factor: 6.225
International Journal of Research in Economics & Social Sciences
Email:- [email protected], http://www.euroasiapub.org
(An open access scholarly, , peer-reviewed, interdisciplinary, monthly, and fully refereed journal)
5
Figure 3:
Again in Figure 4 it can be seen that the gap between Deposits and Advances is increasing
manifolds. It can be clearly seen that the deposits are very less as compared to the advances and
that too is decreasing over the years due to which the gap is further widening as the deposits are
reducing and the advances are increasing. There has been an increase in loans by 882.23% over
the period of ten years.
Figure 4:
Figure 5 depicts the potentiality of the sector over time. The gap between the total income and
the total expenditure shows the operational efficiency. This shows that the over the years the
operational efficiency has increased except for two years which are 2012 and 2013. This is due
the fact that Religare incurred losses in both the years due to which the total income of NBFCs
has been affected in these years.
2006 2007 2008 2009 2010 2011 2012 2013 2014 2015
Deposits 0 0 0 0 0 137.41 1695.12 161.43 341.42 14.08
Loans and Advances 366.31 330.63 1414.29 942.19 2364.62 2597.83 3366.54 5202.83 5354.13 6412.96
0
1000
2000
3000
4000
5000
6000
7000
Am
ou
nt
Growth overtime in Deposits and Advances
2006 2007 2008 2009 2010 2011 2012 2013 2014 2015
Deposits 0 0 0 0 0 4134.02 3241.52 1724.47 1790.77 1233.24
Loans & Advances 11150.4 14579.4 18941.7 21385.4 31860.7 54971.9 81891.9 98780.9 96969.6 109533
0
20000
40000
60000
80000
100000
120000
Am
ou
nt
Growth overtime in Deposits and Advances

International Journal of Research in Economics and Social Sciences (IJRESS) Vol. 6 Issue 11, November - 2016 ISSN(o): 2249-7382 | Impact Factor: 6.225
International Journal of Research in Economics & Social Sciences
Email:- [email protected], http://www.euroasiapub.org
(An open access scholarly, , peer-reviewed, interdisciplinary, monthly, and fully refereed journal)
6
Figure 5:
Similarly Figure 6 also depicts the potential efficiency of the sector over time. The gap between
the total income and the total expenditure shows the operational efficiency. This shows that the
over the years the operational efficiency has increased over the span of ten years. It means that
over the years NBFCs have become much more efficient in investing in the profitable sectors and
collecting deposits in the least cost manner.
Figure6:
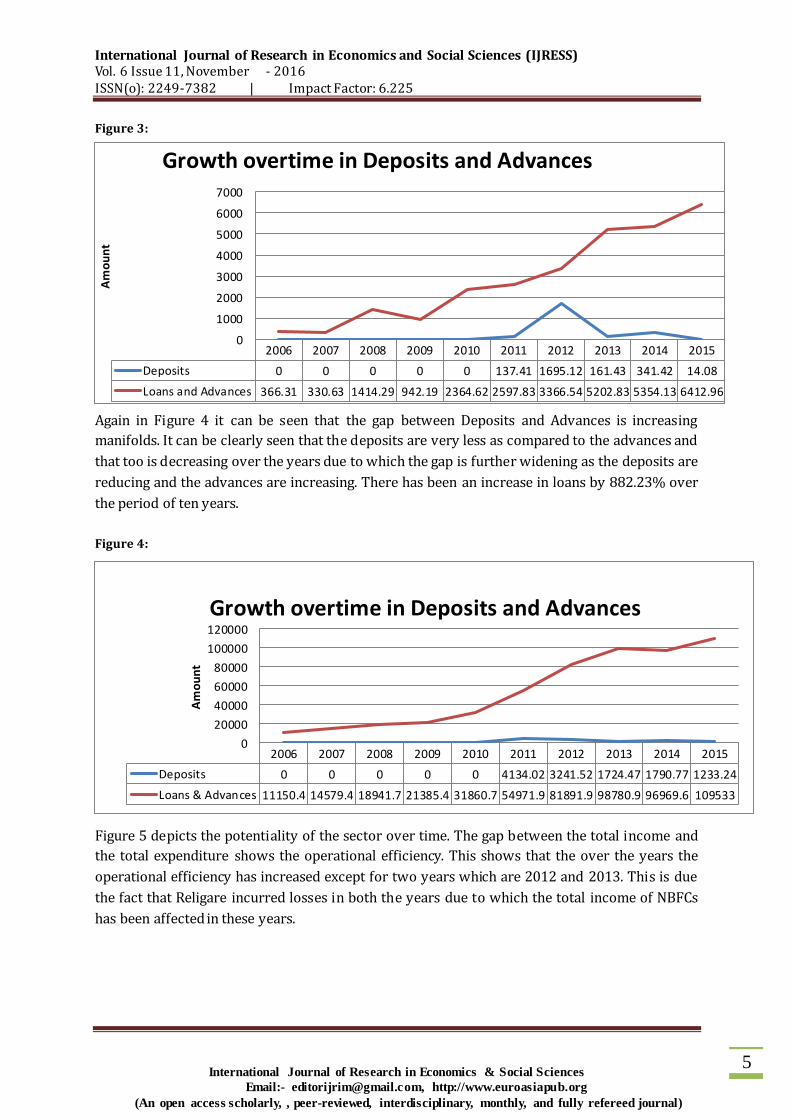
It can be seen from Figure 7 that growth of assets follows a growing trend. The total value for
assets increased from 1455.73 Crores to 18,739.23 Crores. This means that NBFCs are
contributing to national wealth along with their personal development.
2006 2007 2008 2009 2010 2011 2012 2013 2014 2015
Total income 424.48 645.8 828.92 990.98 1318.62 2290.7 2389.74 2462.06 2896.27 2341.67
Total Expenditure 304.2 494.07 593.3 714.34 993.21 1854.59 2690.38 2546.23 2008.39 1783.78
0
500
1000
1500
2000
2500
3000
3500
Am
ou
nt
Growth of Total income and Expenditure
1 2 3 4 5 6 7 8 9 10
Series1 15255.9921178.5525943.9526005.1333352.6244259.8158583.1667063.9667564.06 65405.2
Series2 12317.0117107.8219238.2920430.2925588.2233363.0344051.6450483.3150358.8948250.45
0
10000
20000
30000
40000
50000
60000
70000
80000
Am
ou
nt
Growth of Total Income and Expenditure
International Journal of Research in Economics and Social Sciences (IJRESS) Vol. 6 Issue 11, November - 2016 ISSN(o): 2249-7382 | Impact Factor: 6.225
International Journal of Research in Economics & Social Sciences
Email:- [email protected], http://www.euroasiapub.org
(An open access scholarly, , peer-reviewed, interdisciplinary, monthly, and fully refereed journal)
7
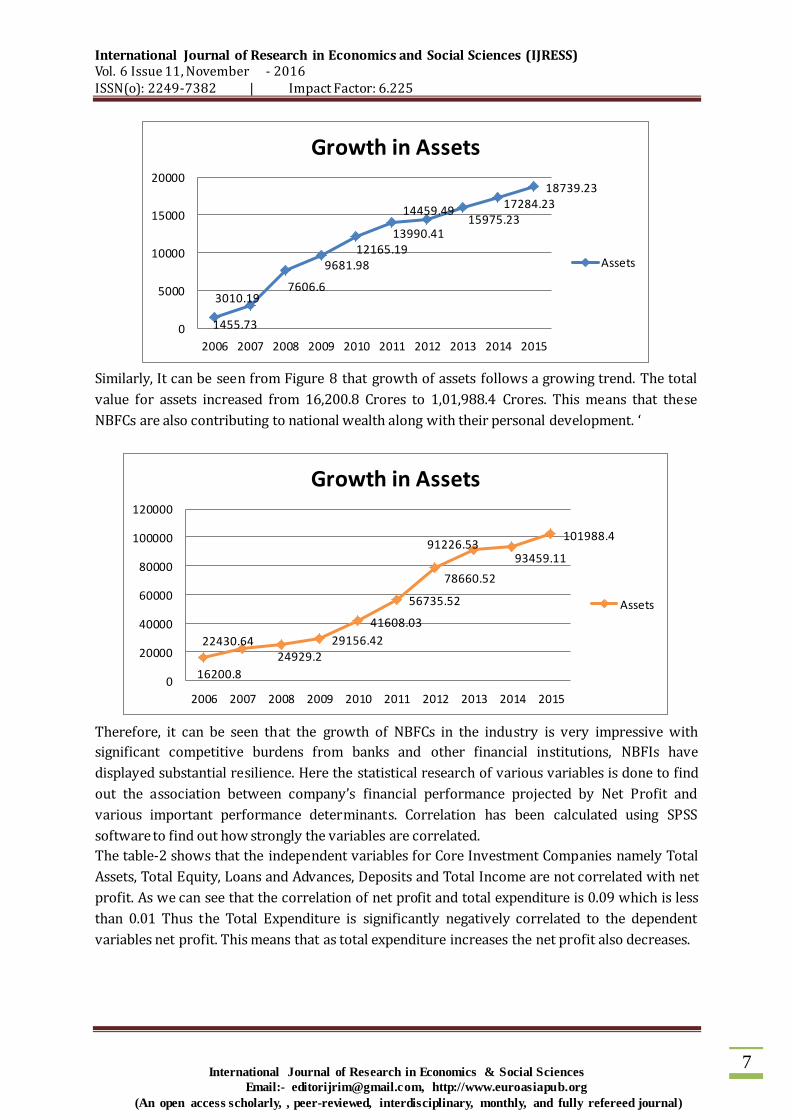
Similarly, It can be seen from Figure 8 that growth of assets follows a growing trend. The total
value for assets increased from 16,200.8 Crores to 1,01,988.4 Crores. This means that these
NBFCs are also contributing to national wealth along with their personal development. ‘
Therefore, it can be seen that the growth of NBFCs in the industry is very impressive with
significant competitive burdens from banks and other financial institutions, NBFIs have
displayed substantial resilience. Here the statistical research of various variables is done to find
out the association between company’s financial performance projected by Net Profit and
various important performance determinants. Correlation has been calculated using SPSS
software to find out how strongly the variables are correlated.
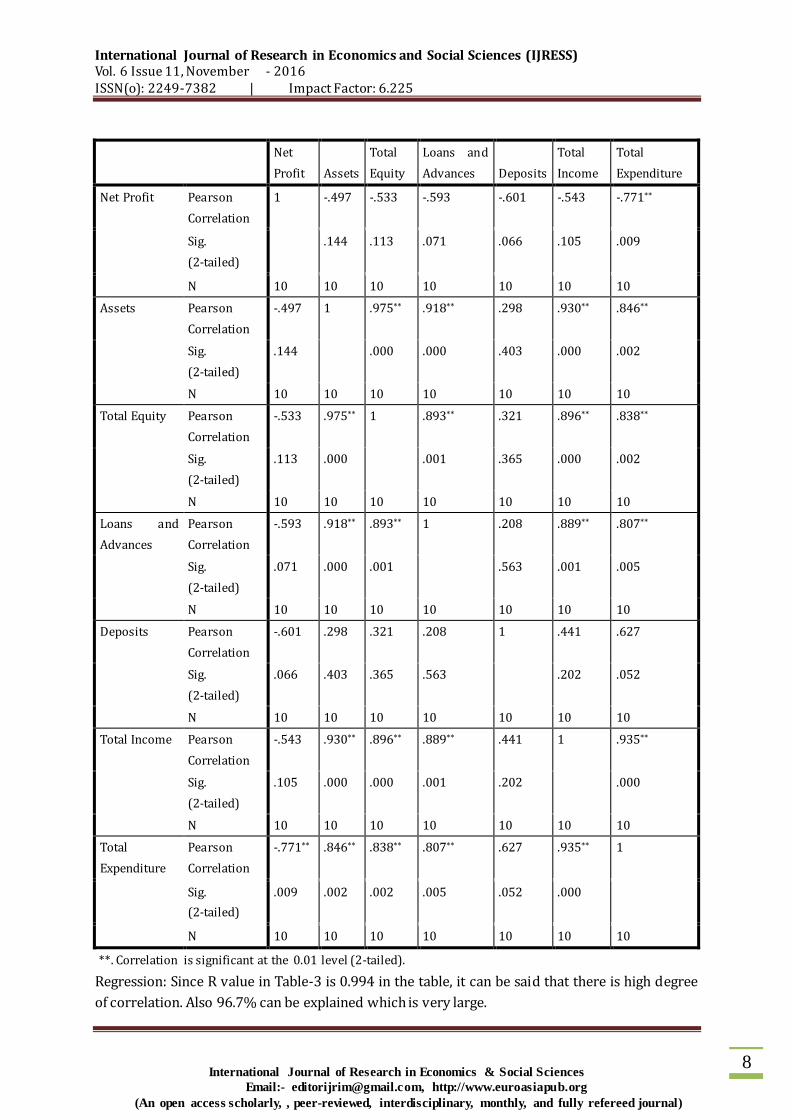
The table-2 shows that the independent variables for Core Investment Companies namely Total
Assets, Total Equity, Loans and Advances, Deposits and Total Income are not correlated with net
profit. As we can see that the correlation of net profit and total expenditure is 0.09 which is less
than 0.01 Thus the Total Expenditure is significantly negatively correlated to the dependent
variables net profit. This means that as total expenditure increases the net profit also decreases.
1455.73
3010.19 7606.6
9681.98 12165.19
13990.41
14459.49 15975.23
17284.23 18739.23
0
5000
10000
15000
20000
2006 2007 2008 2009 2010 2011 2012 2013 2014 2015
Growth in Assets
Assets
16200.8
22430.64 24929.2
29156.42
41608.03
56735.52
78660.52
91226.53 93459.11
101988.4
0
20000
40000
60000
80000
100000
120000
2006 2007 2008 2009 2010 2011 2012 2013 2014 2015
Growth in Assets
Assets
International Journal of Research in Economics and Social Sciences (IJRESS) Vol. 6 Issue 11, November - 2016 ISSN(o): 2249-7382 | Impact Factor: 6.225
International Journal of Research in Economics & Social Sciences
Email:- [email protected], http://www.euroasiapub.org
(An open access scholarly, , peer-reviewed, interdisciplinary, monthly, and fully refereed journal)
8
Net
Profit Assets
Total
Equity
Loans and
Advances Deposits
Total
Income
Total
Expenditure
Net Profit Pearson
Correlation
1 -.497 -.533 -.593 -.601 -.543 -.771**
Sig.
(2-tailed)
.144 .113 .071 .066 .105 .009
N 10 10 10 10 10 10 10
Assets Pearson
Correlation
-.497 1 .975** .918** .298 .930** .846**
Sig.
(2-tailed)
.144
.000 .000 .403 .000 .002
N 10 10 10 10 10 10 10
Total Equity Pearson
Correlation
-.533 .975** 1 .893** .321 .896** .838**
Sig.
(2-tailed)
.113 .000
.001 .365 .000 .002
N 10 10 10 10 10 10 10
Loans and
Advances
Pearson
Correlation
-.593 .918** .893** 1 .208 .889** .807**
Sig.
(2-tailed)
.071 .000 .001
.563 .001 .005
N 10 10 10 10 10 10 10
Deposits Pearson
Correlation
-.601 .298 .321 .208 1 .441 .627
Sig.
(2-tailed)
.066 .403 .365 .563
.202 .052
N 10 10 10 10 10 10 10
Total Income Pearson
Correlation
-.543 .930** .896** .889** .441 1 .935**
Sig.
(2-tailed)
.105 .000 .000 .001 .202
.000
N 10 10 10 10 10 10 10
Total
Expenditure
Pearson
Correlation
-.771** .846** .838** .807** .627 .935** 1
Sig.
(2-tailed)
.009 .002 .002 .005 .052 .000
N 10 10 10 10 10 10 10
**. Correlation is significant at the 0.01 level (2-tailed).
Regression: Since R value in Table-3 is 0.994 in the table, it can be said that there is high degree
of correlation. Also 96.7% can be explained which is very large.
International Journal of Research in Economics and Social Sciences (IJRESS) Vol. 6 Issue 11, November - 2016 ISSN(o): 2249-7382 | Impact Factor: 6.225
International Journal of Research in Economics & Social Sciences
Email:- [email protected], http://www.euroasiapub.org
(An open access scholarly, , peer-reviewed, interdisciplinary, monthly, and fully refereed journal)
9
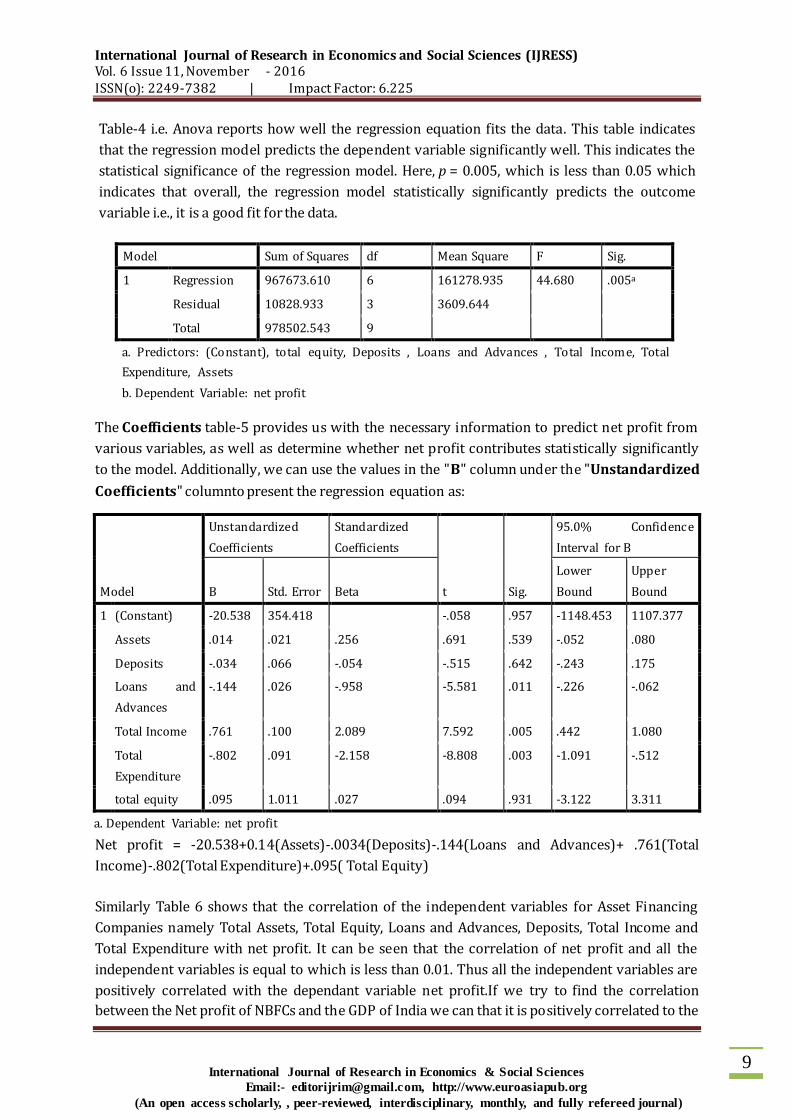
Table-4 i.e. Anova reports how well the regression equation fits the data. This table indicates
that the regression model predicts the dependent variable significantly well. This indicates the
statistical significance of the regression model. Here, p = 0.005, which is less than 0.05 which
indicates that overall, the regression model statistically significantly predicts the outcome
variable i.e., it is a good fit for the data.
The Coefficients table-5 provides us with the necessary information to predict net profit from
various variables, as well as determine whether net profit contributes statistically significantly
to the model. Additionally, we can use the values in the "B" column under the "Unstandardized
Coefficients" columnto present the regression equation as:
Model
Unstandardized
Coefficients
Standardized
Coefficients
t Sig.
95.0% Confidence
Interval for B
B Std. Error Beta
Lower
Bound
Upper
Bound
1 (Constant) -20.538 354.418 -.058 .957 -1148.453 1107.377
Assets .014 .021 .256 .691 .539 -.052 .080
Deposits -.034 .066 -.054 -.515 .642 -.243 .175
Loans and
Advances
-.144 .026 -.958 -5.581 .011 -.226 -.062
Total Income .761 .100 2.089 7.592 .005 .442 1.080
Total
Expenditure
-.802 .091 -2.158 -8.808 .003 -1.091 -.512
total equity .095 1.011 .027 .094 .931 -3.122 3.311
a. Dependent Variable: net profit
Net profit = -20.538+0.14(Assets)-.0034(Deposits)-.144(Loans and Advances)+ .761(Total
Income)-.802(Total Expenditure)+.095( Total Equity)
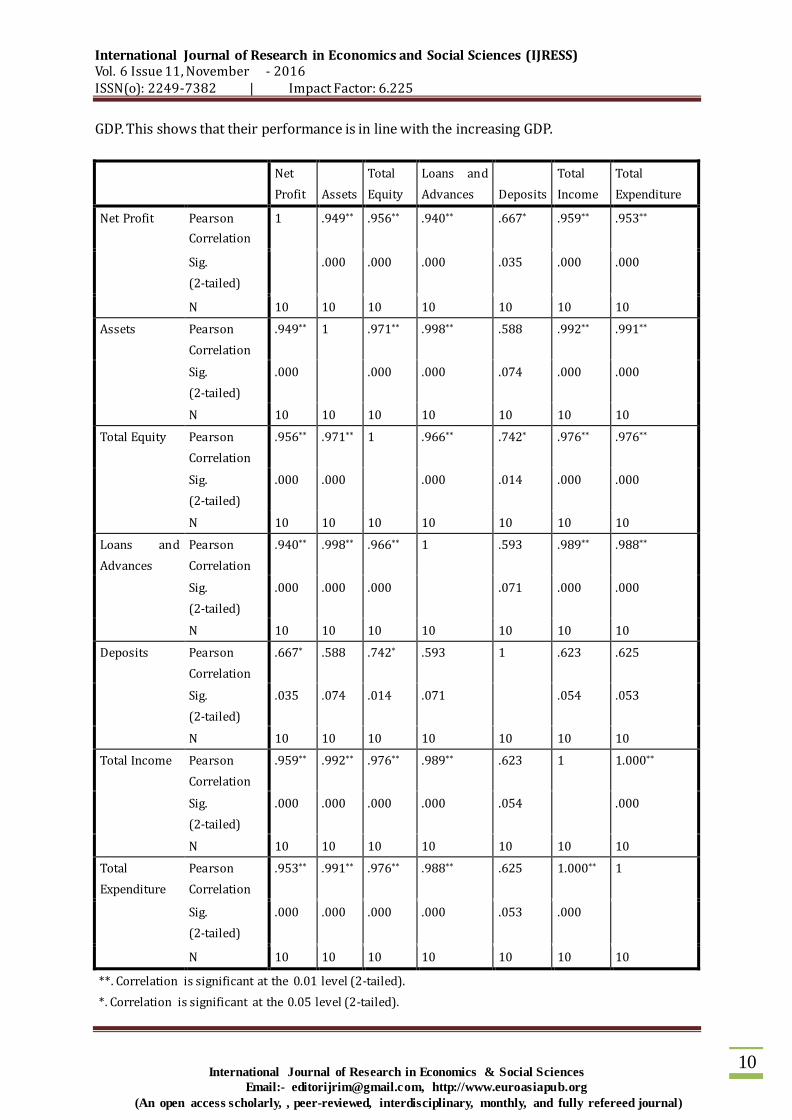
Similarly Table 6 shows that the correlation of the independent variables for Asset Financing
Companies namely Total Assets, Total Equity, Loans and Advances, Deposits, Total Income and
Total Expenditure with net profit. It can be seen that the correlation of net profit and all the
independent variables is equal to which is less than 0.01. Thus all the independent variables are
positively correlated with the dependant variable net profit.If we try to find the correlation
between the Net profit of NBFCs and the GDP of India we can that it is positively correlated to the
Model Sum of Squares df Mean Square F Sig.
1 Regression 967673.610 6 161278.935 44.680 .005a
Residual 10828.933 3 3609.644
Total 978502.543 9
a. Predictors: (Constant), total equity, Deposits , Loans and Advances , Total Income, Total
Expenditure, Assets
b. Dependent Variable: net profit
International Journal of Research in Economics and Social Sciences (IJRESS) Vol. 6 Issue 11, November - 2016 ISSN(o): 2249-7382 | Impact Factor: 6.225
International Journal of Research in Economics & Social Sciences
Email:- [email protected], http://www.euroasiapub.org
(An open access scholarly, , peer-reviewed, interdisciplinary, monthly, and fully refereed journal)
10
GDP. This shows that their performance is in line with the increasing GDP.
Net
Profit Assets
Total
Equity
Loans and
Advances Deposits
Total
Income
Total
Expenditure
Net Profit Pearson
Correlation
1 .949** .956** .940** .667* .959** .953**
Sig.
(2-tailed)
.000 .000 .000 .035 .000 .000
N 10 10 10 10 10 10 10
Assets Pearson
Correlation
.949** 1 .971** .998** .588 .992** .991**
Sig.
(2-tailed)
.000
.000 .000 .074 .000 .000
N 10 10 10 10 10 10 10
Total Equity Pearson
Correlation
.956** .971** 1 .966** .742* .976** .976**
Sig.
(2-tailed)
.000 .000
.000 .014 .000 .000
N 10 10 10 10 10 10 10
Loans and
Advances
Pearson
Correlation
.940** .998** .966** 1 .593 .989** .988**
Sig.
(2-tailed)
.000 .000 .000
.071 .000 .000
N 10 10 10 10 10 10 10
Deposits Pearson
Correlation
.667* .588 .742* .593 1 .623 .625
Sig.
(2-tailed)
.035 .074 .014 .071
.054 .053
N 10 10 10 10 10 10 10
Total Income Pearson
Correlation
.959** .992** .976** .989** .623 1 1.000**
Sig.
(2-tailed)
.000 .000 .000 .000 .054
.000
N 10 10 10 10 10 10 10
Total
Expenditure
Pearson
Correlation
.953** .991** .976** .988** .625 1.000** 1
Sig.
(2-tailed)
.000 .000 .000 .000 .053 .000
N 10 10 10 10 10 10 10
**. Correlation is significant at the 0.01 level (2-tailed).
*. Correlation is significant at the 0.05 level (2-tailed).
International Journal of Research in Economics and Social Sciences (IJRESS) Vol. 6 Issue 11, November - 2016 ISSN(o): 2249-7382 | Impact Factor: 6.225
International Journal of Research in Economics & Social Sciences
Email:- [email protected], http://www.euroasiapub.org
(An open access scholarly, , peer-reviewed, interdisciplinary, monthly, and fully refereed journal)
11
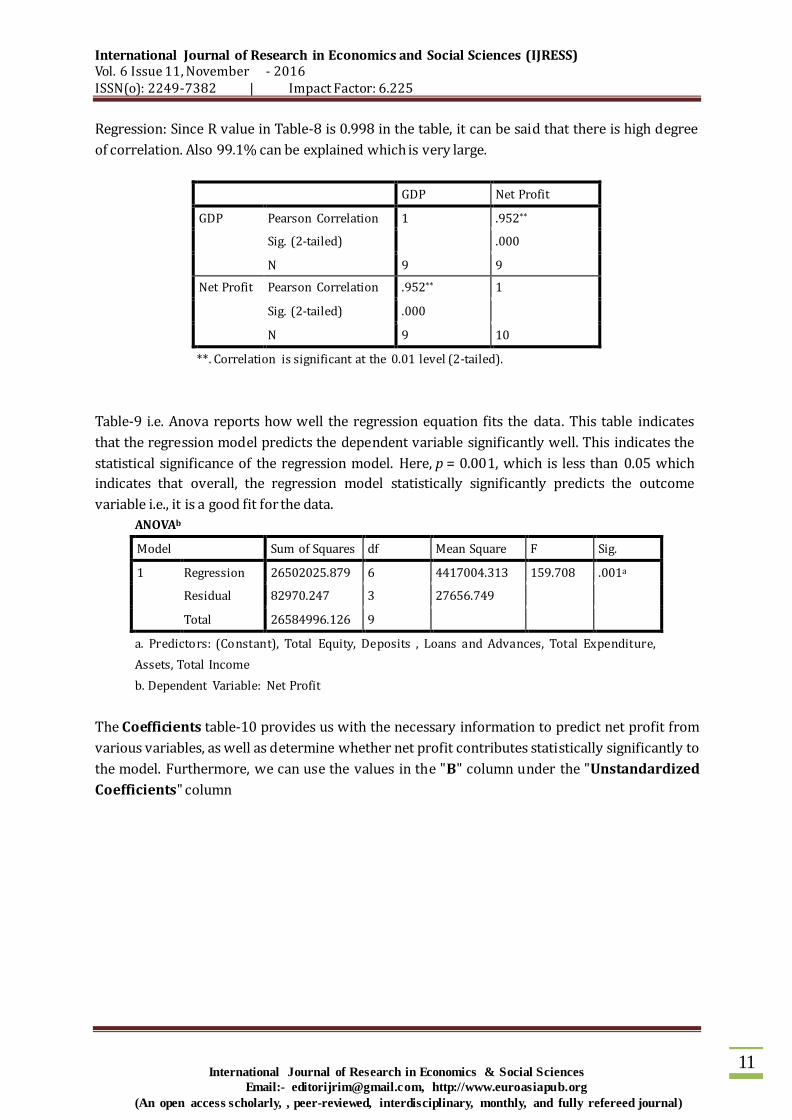
Regression: Since R value in Table-8 is 0.998 in the table, it can be said that there is high degree
of correlation. Also 99.1% can be explained which is very large.
GDP Net Profit
GDP Pearson Correlation 1 .952**
Sig. (2-tailed) .000
N 9 9
Net Profit Pearson Correlation .952** 1
Sig. (2-tailed) .000
N 9 10
**. Correlation is significant at the 0.01 level (2-tailed).
Table-9 i.e. Anova reports how well the regression equation fits the data. This table indicates
that the regression model predicts the dependent variable significantly well. This indicates the
statistical significance of the regression model. Here, p = 0.001, which is less than 0.05 which
indicates that overall, the regression model statistically significantly predicts the outcome
variable i.e., it is a good fit for the data.
ANOVAb
Model Sum of Squares df Mean Square F Sig.
1 Regression 26502025.879 6 4417004.313 159.708 .001a
Residual 82970.247 3 27656.749
Total 26584996.126 9
a. Predictors: (Constant), Total Equity, Deposits , Loans and Advances, Total Expenditure,
Assets, Total Income
b. Dependent Variable: Net Profit
The Coefficients table-10 provides us with the necessary information to predict net profit from
various variables, as well as determine whether net profit contributes statistically significantly to
the model. Furthermore, we can use the values in the "B" column under the "Unstandardized
Coefficients" column
International Journal of Research in Economics and Social Sciences (IJRESS) Vol. 6 Issue 11, November - 2016 ISSN(o): 2249-7382 | Impact Factor: 6.225
International Journal of Research in Economics & Social Sciences
Email:- [email protected], http://www.euroasiapub.org
(An open access scholarly, , peer-reviewed, interdisciplinary, monthly, and fully refereed journal)
12
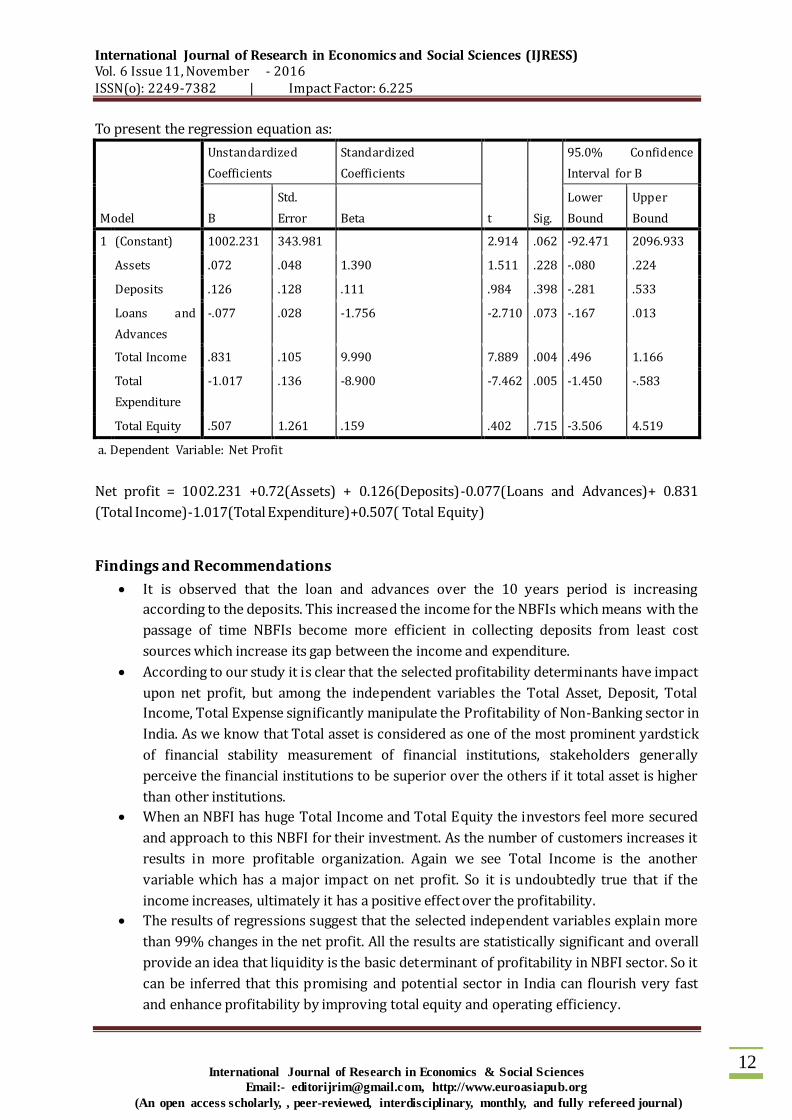
To present the regression equation as:
Model
Unstandardized
Coefficients
Standardized
Coefficients
t Sig.
95.0% Confidence
Interval for B
B
Std.
Error Beta
Lower
Bound
Upper
Bound
1 (Constant) 1002.231 343.981 2.914 .062 -92.471 2096.933
Assets .072 .048 1.390 1.511 .228 -.080 .224
Deposits .126 .128 .111 .984 .398 -.281 .533
Loans and
Advances
-.077 .028 -1.756 -2.710 .073 -.167 .013
Total Income .831 .105 9.990 7.889 .004 .496 1.166
Total
Expenditure
-1.017 .136 -8.900 -7.462 .005 -1.450 -.583
Total Equity .507 1.261 .159 .402 .715 -3.506 4.519
a. Dependent Variable: Net Profit
Net profit = 1002.231 +0.72(Assets) + 0.126(Deposits)-0.077(Loans and Advances)+ 0.831
(Total Income)-1.017(Total Expenditure)+0.507( Total Equity)
Findings and Recommendations
It is observed that the loan and advances over the 10 years period is increasing
according to the deposits. This increased the income for the NBFIs which means with the
passage of time NBFIs become more efficient in collecting deposits from least cost
sources which increase its gap between the income and expenditure.
According to our study it is clear that the selected profitability determinants have impact
upon net profit, but among the independent variables the Total Asset, Deposit, Total
Income, Total Expense significantly manipulate the Profitability of Non-Banking sector in
India. As we know that Total asset is considered as one of the most prominent yardstick
of financial stability measurement of financial institutions, stakeholders generally
perceive the financial institutions to be superior over the others if it total asset is higher
than other institutions.
When an NBFI has huge Total Income and Total Equity the investors feel more secured
and approach to this NBFI for their investment. As the number of customers increases it
results in more profitable organization. Again we see Total Income is the another
variable which has a major impact on net profit. So it is undoubtedly true that if the
income increases, ultimately it has a positive effect over the profitability.
The results of regressions suggest that the selected independent variables explain more
than 99% changes in the net profit. All the results are statistically significant and overall
provide an idea that liquidity is the basic determinant of profitability in NBFI sector. So it
can be inferred that this promising and potential sector in India can flourish very fast
and enhance profitability by improving total equity and operating efficiency.

International Journal of Research in Economics and Social Sciences (IJRESS) Vol. 6 Issue 11, November - 2016 ISSN(o): 2249-7382 | Impact Factor: 6.225
International Journal of Research in Economics & Social Sciences
Email:- [email protected], http://www.euroasiapub.org
(An open access scholarly, , peer-reviewed, interdisciplinary, monthly, and fully refereed journal)
13
Recommendations:
Thus it is recommended that the companies should focus on increasing profitability by
maintaining total equity and operational efficiency.
Also, It is important to view NBFIs as a catalyst for economic growth and to provide
necessary support for their development. A long term approach by all concerned for the
development of NBFIs is necessary. Given appropriate support, NBFIs will be able to play
a more significant role in the economic development of the country.
Conclusion
The study gives a simple picture and leaves room for further study in different areas of NBFI
functions such as products of productivity analysis.
The activities of non-banking financial companies (NBFCs) in India have undergone qualitative
changes over the years through functional specialization. The role of NBFCs as effective financial
intermediaries has been well recognized as they have inherent ability to take quicker decisions,
assume greater risks, and customize their services and charges more according to the needs of
the clients.
The study tells that Performance of NBFCs is improving. Importantly, the results indicate that
NBFIs are the dominant market players of the financial sectors through which the financial
resources are effectively channelized for savers to the users in the economy.
Limitations of the Study
Data Availability: Data for very less companies is available for NBFCs therefore only 20
companies have been selected for the study
The results are affected by extremes because very less number of companies have been
chosen due to non-availability of data.
This analysis cannot be generalized for a vast number of NBFCs institutions in India
References
Xiaoqiang Cheng & Hans Degryse(2010) “Non-Banking Financial Companies” in Journal
of Financial Services Research ,Volume 37, Issue 2-3
Mohd Aminul Islam (Corresponding Author) & Jamil Bin Osman(2011), “Analysis of
Financial Performance of Non-Banking Financial Companies in India” in International
Journal of Business and Social Science,Vol. 2 No. 14
Suresh Vadde (2011) “Non-Banking Financial Companies (NBFCs): A Review”,
Researchers World- Journal of Arts Science & Commerce, Vol.– II, Issue –1
Prof. Zora Bi & Dr. Shyam Lal Dev Pandey(2011), “Determinants of profitability of Non
Bank Financial Institutions’ in a developing country: Evidence from Bangladesh”
Australian Journal of Business and Management Research Vol.1 No.6 [110-120]
Dr.L. Satheeskumar & A. Perumal (2013), “Non-Banking Financial Companies” in Asia
pacific Journal of Research,August 2013, Volume: II, Issue: VIII
International Journal of Research in Economics and Social Sciences (IJRESS) Vol. 6 Issue 11, November - 2016 ISSN(o): 2249-7382 | Impact Factor: 6.225
International Journal of Research in Economics & Social Sciences
Email:- [email protected], http://www.euroasiapub.org
(An open access scholarly, , peer-reviewed, interdisciplinary, monthly, and fully refereed journal)
14
Arunkumar B (2014), “Determinants of profitability of Non-Bank Financial Institutions’
in a developing country: Evidence from Bangladesh” in International Journal of
Management Sciences and Business Research, Volume 2, Issue 4- ISSN (2226-8235)