performance analysis of optical cdma in transmission systems.pdf · performance analysis of optical...
TRANSCRIPT

PERFORMANCE ANALYSIS OF OPTICAL CDMA
IN TRANSMISSION SYSTEMS
A Thesis
Submitted to the Department of Computer Science and Engineering
Of
BRAC University
By
Debobroto Biswas - 05210003
Sa ad Yosuf Galib - 05210011
Noor Hossain Mamun - 05210017
In Partial Fulfillment of the
Requirements for the Degree
of
Bachelor of Science in Electronics and Communication Engineering
August 2009

ii
DECLARATION
I hereby declare that this thesis is based on the results found by myself. Materials of work found by other researcher are mentioned by reference. This theis, neither in whole nor in part, has been previously submitted for any degree.
/. ~:J..---7 ~Of Supervisor
Signature of Author

ACKNOWLEDGMENTS
Special thanks to Professor Satya Prasad Majumder who taught us
how to process raw data meaningfully and think about a topic step by step
when we were fortunate enough to get him as our supervisor and also for
taking time out of busy schedules to consider this work.
Thanks to Asif, Sujoy and our respected teacher for supporting us in
this work.
We would also like to thanks to our family and friends for their support
as this thesis could not be completed without their support and
encouragement. We are very much thankful to them.
3

Abstract
Performance of an optical code division multiple access (OCDMA) system are
evaluated to determine the impact of multi access interference for a given
number of users. Analog clock include the effect of fiber non linearity such as
cross phase modulation and the cross talk due to XPM. The expression for
the signal MAl and cross talk are derived for a single mode fiber transmission
link operating at gigabit per second . Performance results are evaluated 1
Gbps & 10 Gbps with different codes like M-system, gold sequence and pn
sequence to compare their relative performance. The optimum system design
parameters are determined at a specific BER (bit error rate) .
4
I •
Contents
1 Introduction
6
1.0 introduction
7
1.1 Different type of communication system
10
1.1.0 Radio frequency
11
1.1.1. Very high frequency
13
1 .1 .2 Micro wave
15
1 .1 .2.1. Frequency
16
1.1 .2.2. Uses
17
1.1.2.20. Communication
17
1.1 .2.2b. Remote sensing
18
1.1 .2.2c. Navigation
19
1.1.2.2d. Power
19

1.1.3. Optical communication
21
1.2. Basic for Optical CDMA
23
1.3. Optical Fiber
28
1.3.1 Classification of optical fiber
30
1 .3.2. Based on propagation mode
30
1.3.20. Single mode fiber (SMF)
31
1.1 .3.2b. Multi mode fiber
32
1.3.3. Based on refractive index
33
1.3.30 . Step index fiber
33
1.3.3b. Graded index fiber
34
1.4 Multiplexing techniques of Optical communication
35

1.4.1. Optical frequency division multiplexing
35
1.4.2. Optical wavelength division multiplexing (WOM)
36
1.4.3. Optical code division multiple accesses (OCOMA)
37
OBJECTIVE
39
2 Performance Analysis of Optical COMA System
40
2.0. Analysis of Optical COMA system
41
2.1. Equation derivation for SNR
41
2.2. Equation derivation for BER
44
3 Results and Graphical Analysis
46
3.0. Result and graphical analysis
47
4 Conclusion and Future Work
55

4.0. Conclusion and Future Work
56
Literature Survey
57

CHAPTER-1
Introduction
6

1.0. Introduction:
Communication may be broadly defined as the transfer of information from
one point to another. When the information is to be conveyed over any
distance a communications system is usually required. Within a
communication system the information transfer is frequently achieved by the
superimposing or modulating the information on to an electromagnetic wave
which acts as a carrier for the information signal. This modulated carrier is
then transmitted to the required destination where it is received and the
original information signal is obtained by demodulation. Sophisticated
techniques have been developed for this process using electromagnetic
carrier waves operating at ratio frequencies as well as microwave and
millimeter wave frequencies. However, communication may be also be
achieved using an electromagnetic carrier which is selected from the optical
range frequencies.
Modern world is standing on the progress of communication system. Nowa
day we can't think a day without communication system. We are totally
depending on this system. Our concern is communication system based on
electrical signal. Electrical communication is reliable and economical;
communication technology is alleviating the energy crisis by trading
information processing for more rational use of energy resources.
There are various types of electrical communication system. They are
microwave communication, radio frequency communication, very high
frequency communication, optical fiber communication.
7
Figure.1.0. Shows the components of a communication system are as follows:
The source originates a message (such as human voice) it must be converted
by an input transducer into an electrical waveform referred to as the message
signal.
The transmitter modified the base band signal for efficient transmission.
The channel is a medium such as wire, coaxial cable, a waveguide an Optical
fiber or a radio link-through which the transmitter output is same.
The receiver reprocesses the Signal received from the channel by undoing the
signal modification made at the transmitter and the channel.
The receiver output is fed to the output transducer which converts the
electrical signal to its original form .
8

lIP signal
Input transducer
Receiver
Input signal
Rec. signal
Transm itter
Output transducer
Trans. signal
Channel
Distortionl Noise
O/P Signal
Fig: 1.0. Basic Block Diagram of communication system
The destination is the unique to which the message is communicated.
A channel acts partly as filter to attenuate the signal and distort this waveform.
The signal attenuation increases with length of the channel , varying from a
few percent for short distance to orders of magnitude for interplanetary
communication. The waveform is distorted because of different amounts of
attenuation and phase shift suffered by different frequency component of the
signal. For example a square pulse is rounded or spread out during the
9

transmission. This type of distortion, called linear distortion , can be partly
corrected by
the receiver by an equalizer. The channel may also cause nonlinear distortion
through attenuation that varies with the signal amplitude.
The signal may also damage by noise which are random and unpredictable
signals from causes external and internal. External noise includes interference
from signals transmitted on nearby channels, human made noise generated
by electrical equipment.
With proper care this noise can be minimized or even eliminated. Internal
noise results from the thermal motions from electrons in conductors. Proper
care can reduce the effect of internal noise but can be never eliminated.
The signal-to-noise ratio (SNR) is defined as the ratio of the signal power to
noise power. Channel distorts the signal, and noise accumulates along the
parts. Worse yet, the signal strength decreases while the noise level
increases with distance from the transmitter. Thus the SNR is continuously
decreasing along the length of the channel.
1.1. Different Types of communication system
1. Radio frequency communication (RF)
2. Very high frequency(VHF)
3. Micro wave communication(MW)
4. Optical communication
10
1.1.0 Radio frequency:
Radio frequency (RF) is a frequency or rate of oscillation within the range of
about 3 Hz to 300 GHz. This range corresponds to frequency of alternating
current electrical signals used to produce and detect radio waves. Since most
of this range is beyond the vibration rate that most mechanical systems can
respond to, RF usually refers to oscillations in electrical circuits.
A range of Radio frequencies that defines allowable or usable channels for
specific radio transmission technologies. Radio Spectrum is typically
Government regulated in most developed countries and in some cases sold or
licensed to operators of private radio transmission systems. (E.g. Cellular
telephone operators or Broadcast Television Stations). The range of allocated
frequencies is often referred to by the provisioned use. (e.g. Cellular
Telephone Spectrum or Broadcast Television Spectrum)
Radio spectrum is below or lowers in frequency than Infrared spectrum or
visible frequencies, also known as light.
II

AN TENNA r----- --, I I I I I I I I
,/ .-< , ,·JL-;~=±:::=::;il a' " "9~',,'
<>I"~', LOCAL " /1 OSCILLATOR
v i L _______ J
CONVERTER
2ND DETECTOR
or 1ST AF
AMmFIER
AUTOlilATlC GAIN
CONTROL
BL OCK DIAGRAM OF A SUPERHETERODYNE RECEIVER
SPEAKER
Fig: 1.1 Block diagram of radio frequency
Modulating signal
Radio frequency signal
Fig .1.2. Waveform a modulating signal and the converted FM signal
12
1.1.1. Very high frequency:
VHF (Very high frequency) is the radio frequency range from 30 MHz to 300
MHz. Frequencies immediately below VHF are denoted High frequency (HF),
and the next higher frequencies are known as Ultra high frequency (UHF).
The wavelengths corresponding to these limit frequencies are 10 meters and
1 meter. The frequency allocation is done by ITU. Common uses for VHF are
FM radio broadcast, television broadcast, land mobile stations (emergency,
business, and military), Amateur Radio, marine communications, air traffic
control communications and air navigation systems (e.g. VOR, DME & ILS).
In the VHF band, electromagnetic fields are affected by the earth's ionosphere
and troposphere. Ionosphere propagation occurs regularly in the lower part of
the VHF spectrum, mostly at frequencies below 70 MHz. In this mode, the
communication range can sometimes extend over the entire surface of the
earth. The troposphere can cause bending, ducting, and scattering, extending
the range of communication significantly beyond the visual horizon. Auroral,
meteor-scatter, and EME (earth-moon-earth, also called moon bounce)
propagation take place on occasion, but these modes do not offer reliable
communication and are of interest primarily to amateur radio operators.
The VHF band is popular for mobile two-way radio communication. A great
deal of satellite communication and broadcasting is done at VHF. Wideband
modulation is used by some services; the most common example is fast-scan
television broadcasting . Channels and sub bands within the VHF portion of
the radio spectrum are allocated by the International Telecommunication
Union (ITU).
13

I"\IEJIT~G INf'UT
~N.INVERTING
INPUT
+\lcc
OUTPUT AW'lJrlER
l-_-+--:;:!-/
Fig: 1.3. Block diagram of VHF
OUTPUT
14

/" .- - --
I
r
--l I
Basic layout for HF to VHf/UHF and VHF/UHF to HF commun/cation
v \ I
\ I I I Co.."iao I-f~rran~(!iver JO~l HF & 9~50Mobi1~ Anti!lloo Crcsspatcll L ____ ____ _
IN VEHICLE
~etr.C!c HP !."'o(Js.cel"-.rer (SQs(' or Vl'hkJc
V" 'F/ Ui<, radio
___ ..J
I /
R~mo!i!
VHF/U"F radio
Fig: 1.4. Block diagram of a basic layout for HF to VF/UHF and VHF/UHF to
HF communication .
1.1.2.0 Micro wave:
Microwaves are electromagnetic waves with wavelengths ranging from 1 m
down to 1 mm, or equivalently, with frequencies between 0.3 GHz and
300 GHz.
Apparatus and techniques may be described qualitatively as "microwave"
when the wavelengths of signals are roughly the same as the dimensions of
the equipment, so that lumped-element circuit theory is inaccurate. As a
consequence, practical microwave technique tends to move away from the
discrete resistors, capacitors, and inductors used with lower frequency radio
waves. Instead, distributed circuit elements and transmission-line theory are
more useful methods for design and analysis. Open-wire and coaxial
15
transmission lines give way to waveguides, and lumped-element tuned
circuits are replaced by cavity resonators or resonant lines. Effects of
reflection , polarization, scattering, diffraction and atmospheric absorption
usually associated with visible light are of practical significance in the study of
microwave propagation. The same equations of electromagnetic theory apply
at all frequencies .
While the name may suggest a micrometer wavelength, it is better understood
as indicating wavelengths very much smaller than those used in radio
broadcasting. The boundaries between far infrared light, terahertz radiation,
microwaves, and ultra-high-frequency radio waves are fairly arbitrary and are
used variously between different fields of study. The term microwave
generally refers to "alternating current signals with frequencies between 0.3
GHz (3x 10B Hz) and 300 GHz (3x 10¹¹ Hz).,,[11 Both lEG standard 60050 and
IEEE standard 100 define "microwave" frequencies starting at 1 GHz (30 cm
wavelength).
Electromagnetic waves longer (lower frequency) than microwaves are called
"radio waves". Electromagnetic radiation with shorter wavelengths may be
called "millimeter waves", terahertz radiation or even T-rays. Definitions differ
for millimeter wave band, which the IEEE defines as 110 GHz to 300 GHz.
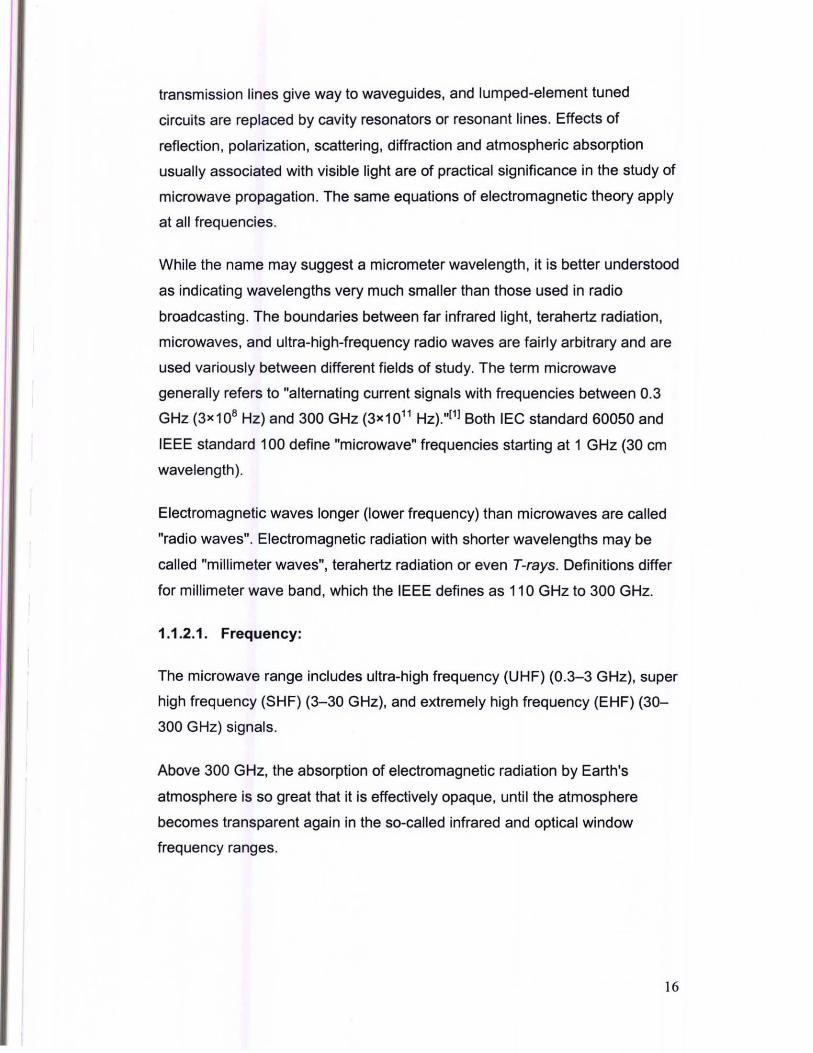
1.1.2.1. Frequency:
The microwave range includes ultra-high frequency (UHF) (0.3-3 GHz), super
high frequency (SHF) (3-30 GHz), and extremely high frequency (EHF) (30-
300 GHz) signals.
Above 300 GHz, the absorption of electromagnetic radiation by Earth's
atmosphere is so great that it is effectively opaque, until the atmosphere
becomes transparent again in the so-called infrared and optical window
frequency ranges.
16

1.1.2.2. Uses:
1.1.2.2a. Communication
• Before the advent of fiber optic transmission, most long distance
telephone calis were carried via microwave point-to-point links through sites
like the AT&T Long Lines. Starting in the early 1950s, frequency division
multiplex was used to send up to 5,400 telephone channels on each
microwave radio channel , with as many as ten radio channels combined into
one antenna for the hop to the next site, up to 70 km away.
• Wireless LAN protocols, such as Bluetooth and the IEEE 802.11
specifications, also use microwaves in the 2.4 GHz ISM band, although
802.11 a uses ISM band and U-NII frequencies in the 5 GHz range. Licensed
long-range (up to about 25 km) Wireless Internet Access services have been
used for almost a decade in many countries in the 3.5-4.0 GHz range. The
FCC recently carved out spectrum for carriers that wish to offer services in
this range in the U.S.-with emphasis on 3.65 GHz. Dozens of service
providers across the country are securing or have already received licenses
from the FCC to operate in this band. The WIMAX service offerings that can
be carried on the 3.65 GHz band wili give business customers another option
for connectivity.
• Metropolitan Area Networks: MAN protocols, such as WiMAX
(Worldwide Interoperability for Microwave Access) based in the IEEE 802.16
specification . The IEEE 802.16 specification was designed to operate
between 2 to 11 GHz. The commercial implementations are in the 2.3 GHz,
2.5 GHz, 3.5 GHz and 5.8 GHz ranges.
• Wide Area Mobile Broadband Wireless Access: MBWA protocols
based on standards specifications such as IEEE 802.20 or ATIS/ANSI HC
SDMA (e.g. burst) are designed to operate between 1.6 and 2.3 GHz to give
mobility and in-building penetration characteristics similar to mobile phones
but with vastly greater spectral efficiency.
17
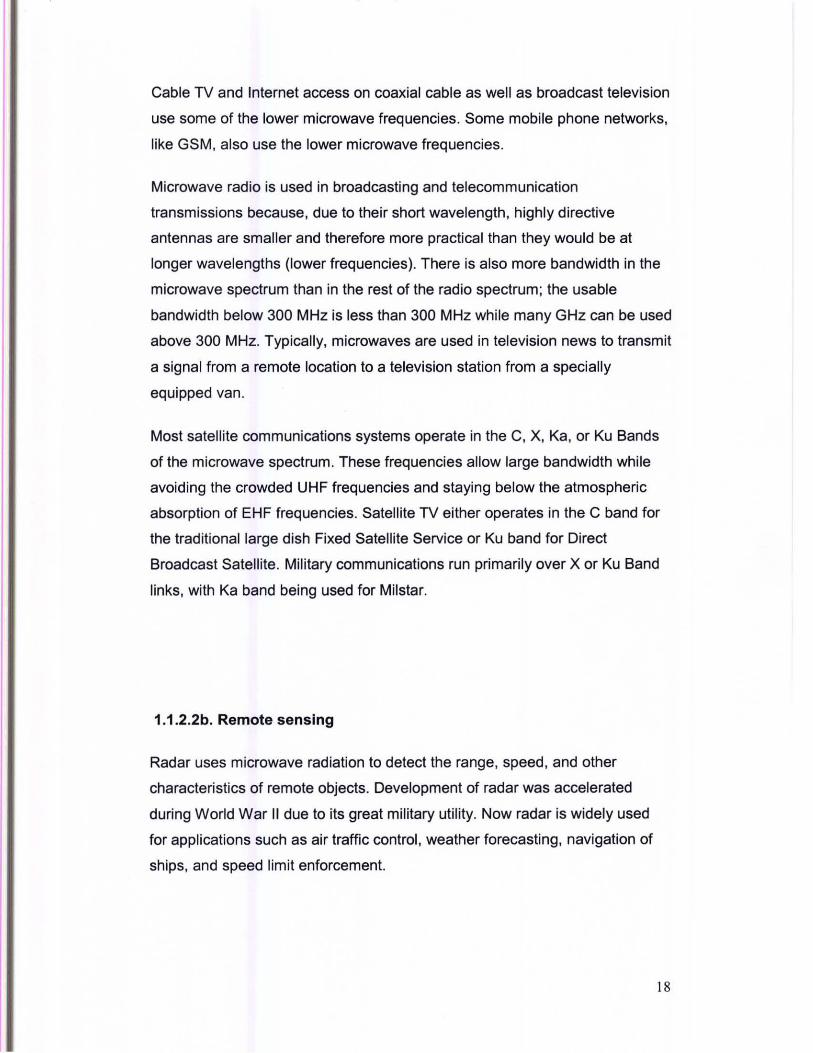
Cable TV and Internet access on coaxial cable as well as broadcast television
use some of the lower microwave frequencies. Some mobile phone networks,
like GSM, also use the lower microwave frequencies.
Microwave radio is used in broadcasting and telecommunication
transmissions because, due to their short wavelength, highly directive
antennas are smaller and therefore more practical than they would be at
longer wavelengths (lower frequencies). There is also more bandwidth in the
microwave spectrum than in the rest of the radio spectrum; the usable
bandwidth below 300 MHz is less than 300 MHz while many GHz can be used
above 300 MHz. Typically, microwaves are used in television news to transmit
a signal from a remote location to a television station from a specially
equipped van.
Most satellite communications systems operate in the C, X, Ka, or Ku Bands
of the microwave spectrum. These frequencies allow large bandwidth while
avoiding the crowded UHF frequencies and staying below the atmospheric
absorption of EHF frequencies. Satellite TV either operates in the C band for
the traditional large dish Fixed Satellite Service or Ku band for Direct
Broadcast Satellite. Military communications run primarily over X or Ku Band
links, with Ka band being used for Milstar.
1.1 .2.2b. Remote sensing
Radar uses microwave radiation to detect the range, speed , and other
characteristics of remote objects. Development of radar was accelerated
during World War II due to its great military utility. Now radar is widely used
for applications such as air traffic control, weather forecasting, navigation of
ships, and speed limit enforcement.
18
A Gunn diode oscillator and waveguide are used as a motion detector for
automatic door openers (although these are being replaced by ultrasonic
devices).
Most radio astronomy uses microwave.
1.1.2.2c. Navigation
Global Navigation Satellite Systems (GNSS) including the Chinese Beidou,
the American Global Positioning System (GPS) and the Russian GLONASS
broadcast navigational signals in various bands between about 1.2 GHz and
1.6 GHz.
1.1.2.2d. Power
A microwave oven passes (non-ionizing) microwave radiation (at a frequency
near 2.45 GHz) through food, causing dielectric heating by absorption of
energy in the water, fats and sugar contained in the food. Microwave ovens
became common kitchen appliances in Western countries in the late 1970s,
following development of inexpensive cavity magnetrons.
Microwave heating is used in industrial processes for drying and curing
products.
Many semiconductor processing techniques use microwaves to generate
plasma for such purposes as reactive ion etching and plasma-enhanced
chemical vapor deposition (PECVD).
Microwaves can be used to transmit power over long distances, and post
World War II research was done to examine possibilities. NASA worked in the
1970s and early 1980s to research the possibilities of using Solar power
19

satellite (SPS) systems with large solar arrays that would beam power down
to the Earth's surface via microwaves.
Less-than-Iethal weaponry exists that uses millimeter waves to heat a thin
layer of human skin to an intolerable temperature so as to make the targeted
person move away. A two-second burst of the 95 GHz focused beam heats
the skin to a temperature of 130 ' F (54 ' C) at a depth of 1/64th of an inch
(0.4 mm). The United States Air Force and Marines are currently using this
type of Active Denial System.[2)
!Mudl dnwr ngno/
IJimd Pass Pllur
Miw
Dale AcQl.1.!11IOfi & ProciSS Unit
Band Paz ;.)1t~r
1+- --; inregrcrof
Fig: 1.5. Block diagram of microwave communication system
iXrf, r
20
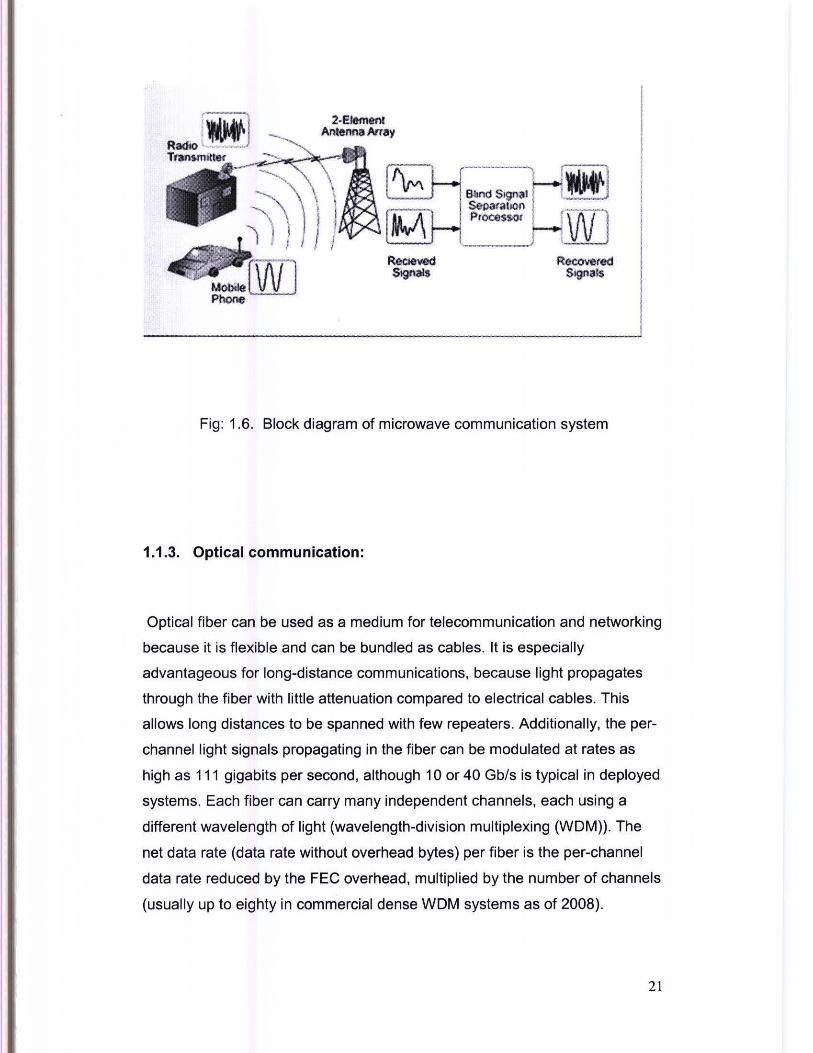
2·Element Antenna Array
RccMlved Sign31$
Shnd S'9031 Sepa(3tlon Processor
Recovered Sognals
Fig: 1.6. Block diagram of microwave communication system
1.1.3. Optical communication:
Optical fiber can be used as a medium for telecommunication and networking
because it is flexible and can be bundled as cables. It is especially
advantageous for long-distance communications, because light propagates
through the fiber with little attenuation compared to electrical cables. This
allows long distances to be spanned with few repeaters. Additionally, the per
channel light signals propagating in the fiber can be modulated at rates as
high as 111 gigabits per second, although 10 or 40 Gb/s is typical in deployed
systems. Each fiber can carry many independent channels, each using a
different wavelength of light (wavelength-division multiplexing (WDM)). The
net data rate (data rate without overhead bytes) per fiber is the per-channel
data rate reduced by the FEe overhead, multiplied by the number of channels
(usually up to eighty in commercial dense WDM systems as of 2008).
2 1

Over short distances, such as networking within a building, fiber saves space
in cable ducts because a single fiber can carry much more data than a single
electrical cable. Fiber is also immune to electrical interference; there is no
cross-talk between signals in different cables and no pickup of environmental
noise. Non-armored fiber cables do not conduct electricity, which makes fiber
a good solution for protecting communications equipment located in high
voltage environments such as power generation facilities, or metal
communication structures prone to lightning strikes. They can also be used in
environments where explosive fumes are present, without danger of ignition.
Wiretapping is more difficult compared to electrical connections, and there are
concentric dual core fibers that are said to be tap-proof.
Although fibers can be made out of transparent plastic, glass, or a
combination of the two, the fibers used in long-distance telecommunications
applications are always glass, because of the lower optical attenuation. Both
multi-mode and single-mode fibers are used in communications, with multi
mode fiber used mostly for short distances, up to 550 m (600 yards), and
single-mode fiber used for longer distance links. Because of the tighter
tolerances required to couple light into and between single-mode fibers (core
diameter about 10 micrometers), single-mode transmitters, receivers,
amplifiers and other components are generally more expensive than multi
mode components.
22

I L .... S ~)R ~1-1~t'l~o~o~u~L~ ... ~T~o~I1~1I--~.---n---.! OpTI C .... L "' M p . ~
;/' : : ..... -...... - .... -.•... ~ ... -.-....•.•....• j I I I I I I I
L(>---1 ........ ,
I IIOI' TIC A 4
I F ILTER-r---~--- -- -_.
PREAMPLI FIER ,..--------'-_.
THERM .... L N O I~E i I;; d
n,
Fig: 1,7. Block diagram of an optical communication system
1.2. Basic for Optical CDMA:
Code division multiple access (CDMA) scheme has been an increasing
interest for fiber optic network because it allows multiple users to access the
network asynchronously and simultaneously, Optical code-division multiple
access (CDMA) is expected for further ultra-high speed and real-time
computer communications where there is strong demand for the systems to
support several kinds of data with different traffic requirements.
23
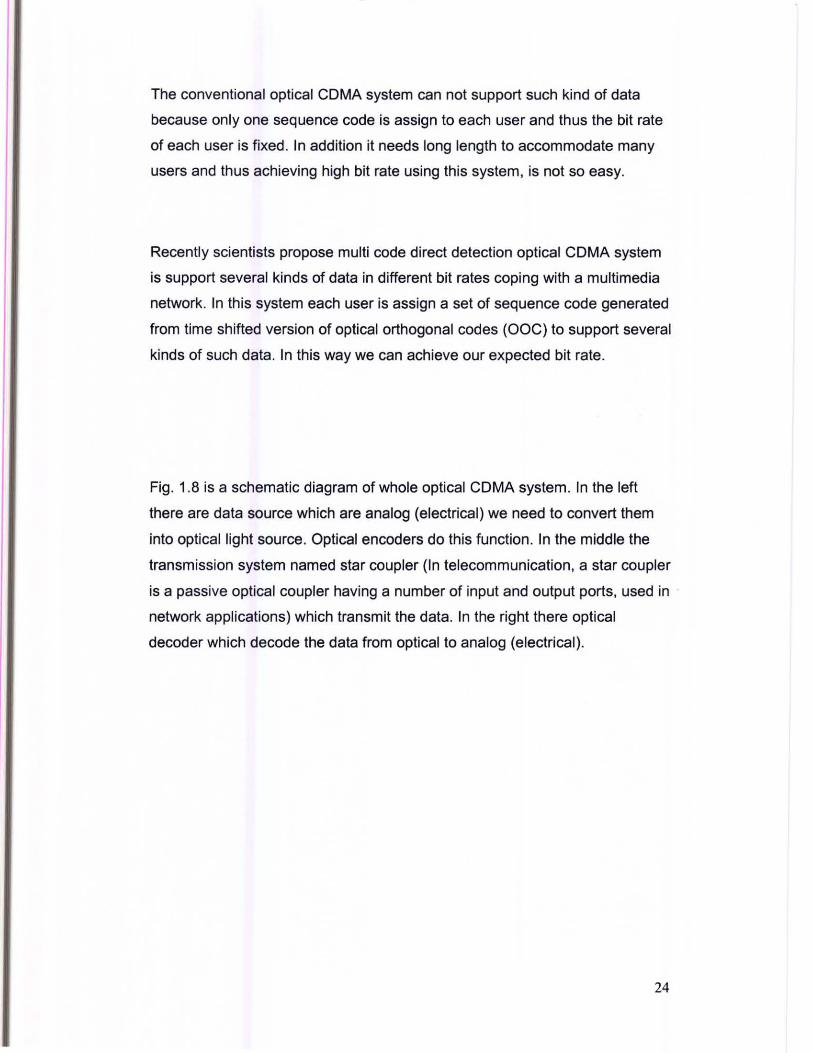
The conventional optical COMA system can not support such kind of data
because only one sequence code is assign to each user and thus the bit rate
of each user is fixed. In addition it needs long length to accommodate many
users and thus achieving high bit rate using this system, is not so easy.
Recently scientists propose multi code direct detection optical COMA system
is support several kinds of data in different bit rates coping with a multimedia
network. In this system each user is assign a set of sequence code generated
from time shifted version of optical orthogonal codes (OOC) to support several
kinds of such data. In this way we can achieve our expected bit rate.
Fig. 1.8 is a schematic diagram of whole optical COMA system. In the left
there are data source which are analog (electrical) we need to convert them
into optical light source. Optical encoders do this function. In the middle the
transmission system named star coupler (In telecommunication, a star coupler
is a passive optical coupler having a number of input and output ports, used in .
network applications) which transmit the data. In the right there optical
decoder which decode the data from optical to analog (electrical).
24

DO,. IIIl\lIIC£ ..
"",. """""" .M
I I
I~'~------------~~~~--------------'~I
+ 0PnI:Al OI'TICAI. + COMA
"- /"" a:MA
ENOOOEA O£COOOI
I .....
I OPTICAl 8fAA OOUl'lrrr,.
+ """"'" V "'- O"lICAl + a- COMA DiC()(1£A D<COOC"
~I·-------------~----------~'I I
DATA
""XM"" "
""fA .. CO\IL...,
.~
Fig . 1. A M:htm4lic "i",ram of an opnc.l code division rnuhiplC: ·kCCl~ omnwntc.ll1iofl~ S)'Mtm with .. ~1I ,OptJl·.t tncodcl .. ."d tk\.'Udc:r.
Fig: 1.8. Schematic diagram of optical COMA system
Fig 1.9 shows that ata are coming into the data conversation unit which
converted the data in electrical form. This converted data is driving the laser
driver. This laser light is passing through the optical fiber. Temperature
controller controls the temperature of optical fiber.
25

a"jl~mOr<l IOf
Data r---------------------------~--------------------------1 C~ 1 :>1 ~~'Yetsion I~' 'I Lalior cn ... er I ! ., :~ unO r-----v- J , , ,
, ~ , , 1 1 , 1
T:q~" 1 LMor _r._ ~ Wo. """ I~ i c±:=!l> CIIcu;1 I'--y'" ,,,,,.MaOon con U, 1 r U !
Ten~:;~~ ~ I k ~ -~JI : l~:2 ----------------::-~-=- . ---it~~~~::.-~~--t~~~,~~:.-J ~oes
it rm and 3bJm and tr'Cl"If.ot rnoNtor rronitct
Fig 1.9. Block Diagram of an Optical Transmitter
Fig 1.10. Shows that signals are received in PD block, preamplifier amplify
signal because it may be weaken during transmission time. Then it goes
through filter it elements some noise, Finally we get the output from decision
circuit .
26

Input'power
r-----~-~~~~--------------------~~--------------------~1 ~ = [1] Signal ' ~ r;;l.-LSigI1aI '--L,J 'I detect I I>LJ"""""" lost
I PO : Coupling I ~ . , ~ I
oplics : ~~~~~.:~________ ' ______________ , :
I I I I I I opta I Doli!
: [ Freamp 1c:!>~~~t:>1 Decis~ I~r;;l~ : I ~~ urM t:;::>CJl :> i I ~ c~ ." I Cloer. I L____ __________ --------_ __J ! I " I
I I I ~ ; I,. re::'Y :.
i , I L __ _ ________________ . __________________ ______ .... __ • ______ .... __ , , ... .1
Fig: 1.10. Block Diagram of an optical receiver
27

1.3.0. Optical Fiber:
An optical fiber (or fiber) is a glass or plastic fiber that carries light along
its length . Fiber optics is the overlap of applied science and engineering
concerned with the design and application of optical fibers. Optical fibers are
widely used in fiber-optic communications, which permits transmission over
longer distances and at higher bandwidths (data rates) than other forms of
communications. Fibers are used instead of metal wires because signals
travel along them with less loss, and they are also immune to electromagnetic
interference. Fibers are also used for illumination, and are wrapped in bundles
so they can be used to carry images, thus allowing viewing in tight spaces.
Specially designed fibers are used for a variety of other applications, including
sensors and fiber lasers.
Light is kept in the core of the optical fiber by total internal reflection . This
causes the fiber to act as a waveguide. Fibers which support many
propagation paths or transverse modes are called multi-mode fibers (MMF),
while those which can only support a single mode are called single-mode
fibers (SMF). Multi-mode fibers generally have a larger core diameter, and are
used for short-distance communication links and for applications where high
power must be transmitted. Single-mode fibers are used for most
communication links longer than 550 meters (1 ,800 tt) .
Joining lengths of optical fiber is more complex than joining electrical wire or
cable. The ends of the fibers must be carefully cleaved, and then spliced
together either mechanically or by fusing them together with an electric arc.
Special connectors are used to make removable connections.
28

.9" diameter
High-den9~ potyethylene jacket
Metal armor -- Rip eord
'-........ Inner sheath Dielectric strength member Wat.r~locklng tape
Eac h of the 12 ribbons haa 24 fibers
Jackel ·100 ~tm
Buffer 250 ~Ull
Fig: 1.11. An optical fiber
Fig: 1.12. Layer of an optical fiber
29
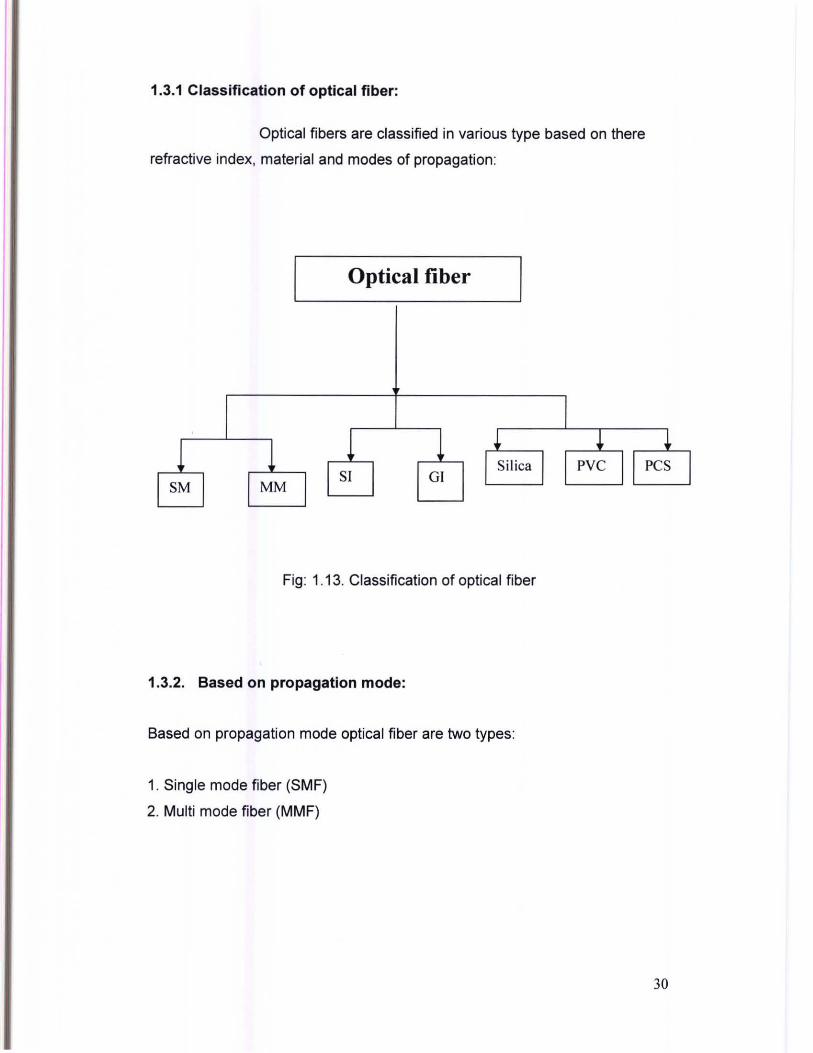
1.3.1 Classification of optical fiber:
Optical fibers are classified in various type based on there
refractive index, material and modes of propagation:
Optical fiber
GI
Fig: 1.13. Classification of optical fiber
1.3.2. Based on propagation mode:
Based on propagation mode optical fiber are two types:
1. Single mode fiber (SMF)
2. Multi mode fiber (MMF)
30

1.3.2a. Single mode fiber (SMF):
Fiber with a core diameter less than about ten times the wavelength of the
propagating light cannot be modeled using geometric optics. Instead, it must
be analyzed as an electromagnetic structure, by solution of Maxwell's
equations as reduced to the electromagnetic wave equation. The
electromagnetic analysis may also be required to understand behaviors such
as speckle that occur when coherent light propagates in multi-mode fiber. As
an optical waveguide, the fiber supports one or more confined transverse
modes by which light can propagate along the fiber. Fiber supporting only one
mode is called single-mode or mono-mode fiber. The behavior of larger-core
multi-mode fiber can also be modeled using the wave equation, which shows
that such fiber supports more than one mode of propagation (hence the
name). The results of such modeling of multi-mode fiber approximately agree
with the predictions of geometric optics, if the fiber core is large enough to
support more than a few modes. SMF is faster than MMF. The speed is up to
10 Gbps.
Fig: 1.14 Single mode fiber
31

1.3.3.2b. Multi mode fiber:
Fiber with large core diameter (greater than 10 micrometers) may be analyzed
by geometric optics. Such fiber is called multi-mode fiber. from the
electromagnetic analysis (see below). In a step-index multi-mode fiber, rays of
light are guided along the fiber core by total internal reflection. Rays that meet
the core-cladding boundary at a high angle (measured relative to a line
normal to the boundary), greater than the critical angle for this boundary, are
completely reflected. The critical angle (minimum angle for total internal
reflection) is determined by the difference in index of refraction between the
core and cladding materials. Rays that meet the boundary at a low angle are
refracted from the core into the cladding, and do not convey light and hence
information along the fiber. The critical angle determines the acceptance
angle of the fiber, often reported as a numerical aperture. A high numerical
aperture allows light to propagate down the fiber in rays both close to the axis
and at various angles, allowing efficient coupling of light into the fiber.
However, this high numerical aperture increases the amount of dispersion as
rays at different angles have different path lengths and therefore take different
times to traverse the fiber. A low numerical aperture may therefore be
desirable .
Fig: 1.15. Multi mode fiber
32

1.3.3. Based on refractive index:
Based on refractive index optical fiber are two types:
1. Step index fiber
2. Graded index fiber
1.3.3a. Step index fiber:
In this fiber refractive index profile is step function. So it is called step index
fiber. Since index is constant so light reflects in straight line.
Fig: 1.16 Step index fibers
33

1.3.3b. Graded Index fiber:
In graded-index fiber, the index of refraction in the core decreases
continuously between the axis and the cladding . This causes light rays to
bend smoothly as they approach the cladding, rather than reflecting abruptly
from the core-cladding boundary. The resulting curved paths reduce multi
path dispersion because high angle rays pass more through the lower-index
periphery of the core, rather than the high-index center. The index profile is
chosen to minimize the difference in axial propagation speeds of the various
rays in the fiber. This ideal index profile is very close to a parabolic
relationship between the index and the distance from the axis.
Fig: 1.17. Graded index fiber
34

1.4.0. Multiplexing techniques of Optical communication:
There are different types of multiplexing techniques used in optical
communication system:
a. Optical frequency division multiplexing (OFDM)
b. Optical wavelength division multiplexing(WDM)
c. Optical code division multiple access(OCDMA)
1.4.1. Optical frequency division multiplexing:
A number of base band channels may be combined by frequency division
multiplexing (FDM). In FDM the optical channel bandwidth is divided into a
number of non over lapping frequency bands and each signal is assigned one
of those bands of frequency.
The individual signals can be extracted from the combined FDM signal by
appropriate electrical filtering at the receiver terminal. This system is suitable
for cable TV distribution network and digital subscriber loop (ADSL, VDSL).
35

1.4.2. Optical wavelength division multiplexing (WDM):
Wavelength division multiplexing (WDM) involves the transmission of a
number of different peak wavelength optical signals in parallel on a single
optical fiber.
In fiber-optic communications, wavelength-division multiplexing (WDM) is a
technology which multiplexes multiple optical carrier signals on a single
optical fiber by using different wavelengths (colors) of laser light to carry
different signals. This allows for a multiplication in capacity, in addition to
enabling bidirectional communications over one strand of fiber. This is a form
of frequency division multiplexing (FDM) but is commonly called wavelength
division multiplexing.
A WDM system uses a multiplexer at the transmitter to join the signals
together and a demultiplexer at the receiver to split them apart. With the right
type of fiber it is possible to have a device that does both simultaneously, and
can function as an optical add-drop multiplexer. The optical filtering devices
used have traditionally been etalons, stable solid-state single-frequency
Fabry-Perot interferometers in the form of thin-film-coated optical glass. WDM
systems are popular with telecommunications companies because they allow
them to expand the capacity of the network without laying more fiber. By using
WDM and optical amplifiers, they can accommodate several generations of
technology development in their optical infrastructure without having to
overhaul the backbone network. Capacity of a given link can be expanded by
simply upgrading the multiplexers and demultiplexers at each end.
This is often done by using optical-to-electrical-to-optical (O/E/O) translation
at the very edge of the transport network, thus permitting interoperation with
existing equipment with optical interfaces.
Most WDM systems operate on single mode fiber optical cables, which have a
core diameter of 9 IJm. Certain forms of WDM can also be used in multi-mode
fiber cables (also known as premises cables) which have core diameters of 50
or 62.5 IJm.
36

Early WOM systems were expensive and complicated to run . However, recent
standardization and better understanding of the dynamics of WOM systems
have made WOM less expensive to deploy.
Optical receivers, in contrast to laser sources, tend to be wideband devices.
Therefore the demultiplexer must provide the wavelength selectivity of the
receiver in the WOM system.
T:n.:nsmitRrs
(
Fig: 1.18. Block diagram of WOM
1.4.3. Optical code division multiple accesses (OCOMA):
A desirable feature for future optical networks would be the ability to process
information directly in the optical domain
for purposes of multiplexing, demultiplexing, filtering, amplification, and
correlation. Optical signal processing would
be advantageous since it can potentially be much faster than electrical signal
processing and the need for photon electron-photon conversion would be
obviated. Code division multiple access (COMA) is a multiple access protocol
which is efficient with low traffic and has zero access delay. Especially, direct
detection optical COMA systems have been investigated widely to apply for
high speed LAN, because they allow multiple users to access network
37

simultaneously. In the case of data transfer where traffic tends to be bursty
rather than continuous, COMA can be used for contention-free, zero delay
access. Optical COMA has many advantages such as no need for the strict
timing
Synchronization, no need for the centralized network control, and self-routing
by code sequence. In optical COMA, multiple user interference called multiple
access interference (MAl) is dominant compared to photo detector shot noise,
dark current and thermal noise. Thus, the elimination or suppression of MAl is
the key issue in optical COMA. Here, we summarize our recent results in
optical COMA, such as effective MAl suppression schemes and the
embedded modulation schemes with error correcting codes.
38

OBJECTIVE
• To study OCDMA with different codes (orthogonal and nearly orthogonal).
• To determine the optimum system parameters for design of an optical CDMA system.
• To carry out the bit error rate including the effect of MAL
• To evaluate performance result in terms of SNR, SIR, BER consider different codes and different number of users and code length.
39

CHAPTER 2
Performance Analysis of Optical COMA System
40

2.0. Analysis of Optical COMA system:
Throughout our thesis project we analysis the performance of Optical CDMA
system. We analyze the performance in terms of SNR (signal-to-noise ratio)
and BER (bit error rate). The equation we used for our analysis are derived
below.
2.1. Equation derivation for SNR:
The balanced-detector output is derived as follows
N K
I = ~ L c(nTc) L (SiO + d, ( t )C,(t - nTJS,l) + n(t) .. .. ........... .. . (A )
n::: 1 ( ::::1
The modified differential output current equation considering the first user
(#1) as the intended user as
41

The first element in equation (1) is a dc current that needs estimation and
removal in the balanced-detector. The second element assumes the
interference (i .e. , MAl) caused by other transmitters and the last one is the
noise. Thus the system SNR can be expressed as
Now according to the DMPC properties we have,
N
I c(nTC)cl (r - nTc) = P + 2 .. . .. ....... ... . (3) t l = :l
By defining the variable X li as the DMPC Auto-Correlation value
IV
X" = I c/(nTc)c;(t - n TJ ............ ..................... ..... . .. . (8 ) 11=1
Its probability density function (pdf) can be obtained from the independent
values of random variable Xli. The in-phase cross correlation value is either
zero or one depending on whether the codes are the same group or from the
different groups. Obviously, the zero value does not cause the interference
due to perfectly orthogonal sequences, while the one value causes the
interference which is only among intended user and (p2-P) users from the
different groups (i.e., p2 whole sequences and P sequences from the same
group of intended user which are orthogonal). As the cross correlation values
42

are uniformly distributed among interfering users, thus, the pdf of w realization
of Xli, is
I P(w= i) = _ ...... ... .. ...... ... . . (4)
P- - P
Where P(w=i) is the probability that w assumes the value i(the number of
actively involved users in the transmission). Therefore, by substituting (3
land (4) into (2), the system SNR can be further simplified as
1 SNR(K) :: 2 ..... ... . . .. . .... (5)
( (K + 2)(K - 1) ) 16a,~
2(P2 - P)(P + 2) + I]P di SiC? + 2)2
Where,
K=Number of Users
P=Code Length Parameter
, T IV ' , , a,~ = ora ; olse:: Gt-h + a;h
91 = Load Resistence
Sl = Rd Pr = signal current
Note that,
Where Eb is the energy of bit, No is the noise PSD, denotes the single-user
SNR.
43

Expression (5) is one of the main results of our thesis analysis as it represents
the SNR of polarization-modulated aCOMA system.
2.2. Equation derivation for BER
We know bit error rate is the function of SNR. So BER=f(SNR).
Here,
a,~ = Total Noise = alh + a;h ... ...... .. .. .. ... ... (6)
, 4KT a,-h = Therma l Noise = R B ... ........ . .... .. (6. a )
L
a;h = Shot Noise = 2eB lp ..................... .. (6.b)
K=Boltzmann constant
T=Temperature
B=Bandwidth=Bit Rate
RL = Load Resistance
e=charge of a electron
I" = Output Power
Pr=Received power
Is=Mean signal current
The probability equation of bit error rate is as bellow
44
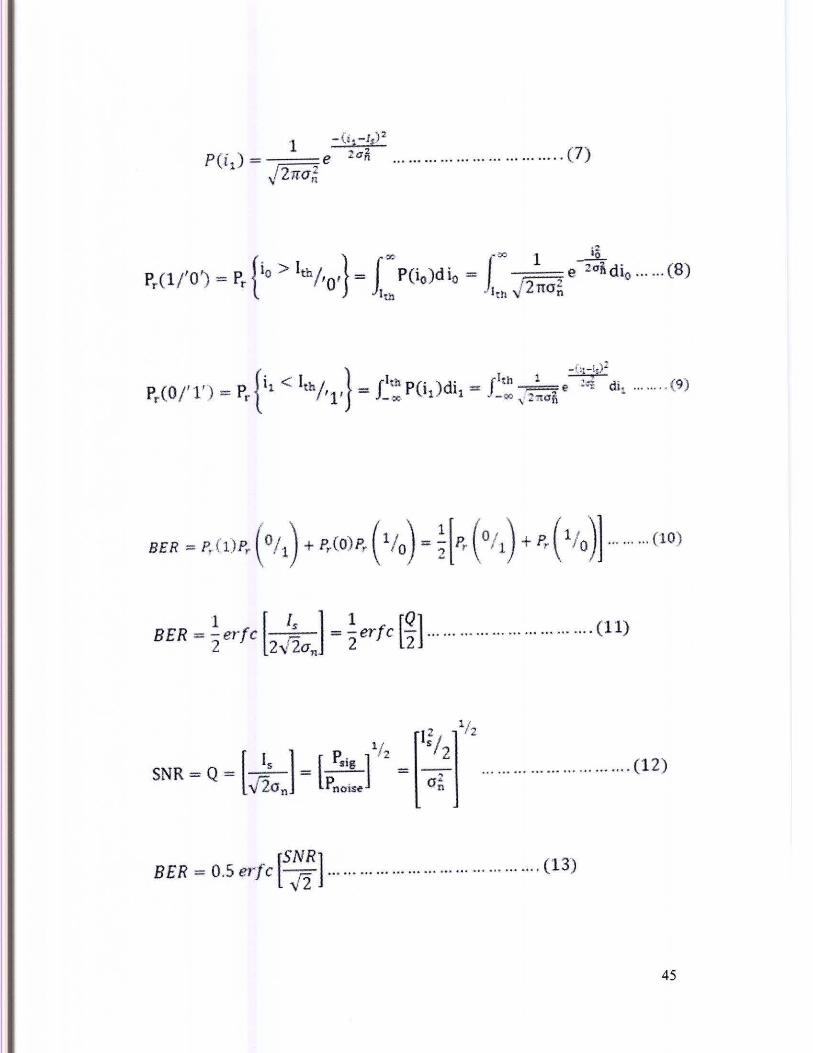
1 - ( i , -Is) 2
PUl) = J27f(J,~ e 2qfi ................................ (7)
BER = ~erfc LizaJ = ~erfc [;] .. . ........................ .... (11)
BER = 0.5 erfc [5.;;] ........ , ............................... (13)
45

CHAPTER 3
Result and Graphical Analysis
46

3.0. Result and graphical analysis:
Using MATLAB, we evaluate the SNR and BER performance result of an
Optical COMA system with different system parameters.
Fig 3.1 shows the plot of SNR (dB) vs. Number of Users. In the figure we plot
the number of user to the X-axis and the signal to noise ratio (SNR) to the Y
axis.
We see that the curve is downward slopping which means there is an inverse
relation between SNR and the number of users. Initially we take the number
of users ranges from 0-50. When less number of users communicates then
SNR are higher. If we increase the number of user continuously then SNR is
decreased. It occurs because of the decreasing of the signal power and
increasing the noise power.
47

.,
"
" " ., ..
Fig: 3.1. Plot of SNR (dB) vs. Number of Users.
Fig 3.2. Shows the plot of bit error rate vs. number of users. We see in the
graph the X axis mean the number of user and the Y axis mean bit error rate
(BER). The curve is upward slopping that mean there is a positive relationship
between numbers of user vs. bit error rate (BER). At the beginning when the
number of user increased then bit error rate response highly but after a
certain time when the number of user increased then BER changes slightly.
48

lO'·,:!.. ---;"~-~lO'-----'!'~---lO;,---,,,>---~.----+.,,.----; 1'«ImI>tr~ .... y.
Fig: 3.2. Plot of Bit Error Rate vs. Number of User
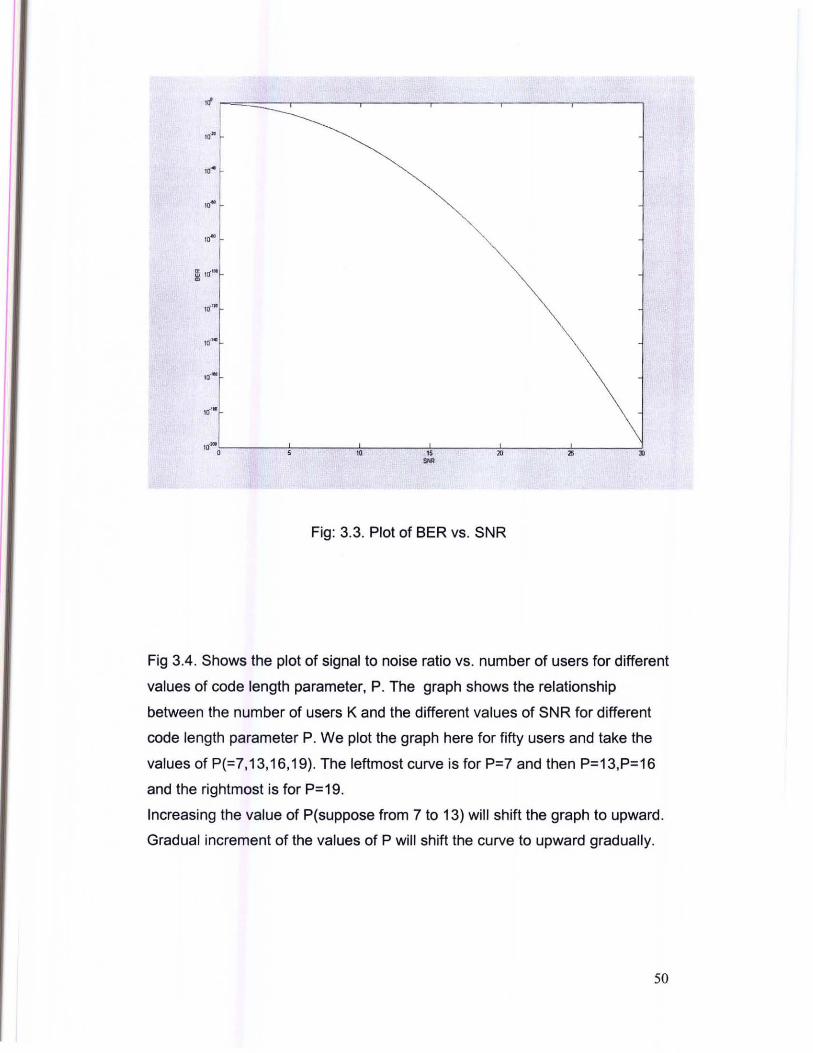
Fig 3.3. Shows the plot of bit error rate vs. signal to noise ratio. We plotted
SNR to the X-axis and BER to the Y-axis. From the graph we see that this
graph is downward slopping. There is a negative relationship between SNR
and BER. Low SNR gives the high BER and high SNR gives low BER. We
observe here for thirty users.
49
,~
10"·
".
".
".
~ 1("'"
1()'"'.
ui'·
10·"
10·'"
,,-0 " " ...
Fig: 3.3. Plot of BER vs. SNR
Fig 3.4. Shows the plot of signal to noise ratio vs. number of users for different
values of code length parameter, P. The graph shows the relationship
between the number of users K and the different values of SNR for different
code length parameter P. We plot the graph here for fifty users and take the
values of P(=7,13,16,19). The leftmost curve is for P=7 and then P=13,P=16
and the rightmost is for P=19.
Increasing the value of P(suppose from 7 to 13) will shift the graph to upward.
Gradual increment of the values of P will shift the curve to upward gradually.
50

, .. r----r---.---,-----.----.----,--~-_.-___,-_____,
.,
'- ---'- --
'''', " .. " " .. ~ " -"" __ .JC
Fig: 3.4. Plot of SNR (dB) vs. Number of Users for different values of P (code
length parameter).
Fig .3.5. Shows the relationship between the different values of BER and the
number of users for different code length parameter P. From this graph we
see when the number of user is increased gradually bit error rate also
increased gradually due to growing interference. Here we consider another
parameter which is code length parameter P. For different values of P we
observe that the curve shift to rightward . So as the values of P are increased
the values of bit error rate are decreased. Which means the relation between
P and SNR is positive and the relation between P and BER is inverse.
5 1

1 , -L-,- --~ 10 1~ 2Il 25 :lO " ..
_bof otU. ••
Fig: 3.5 . Plot of Bit Error Rate vs. Number of User for different values of P.
Fig 3.6.Shows the relationship between the code length parameters P and the
number of users K. We have plotted code length parameter to X-axis and
number of user to the Y-axis. This graph shows a positive relationship
52
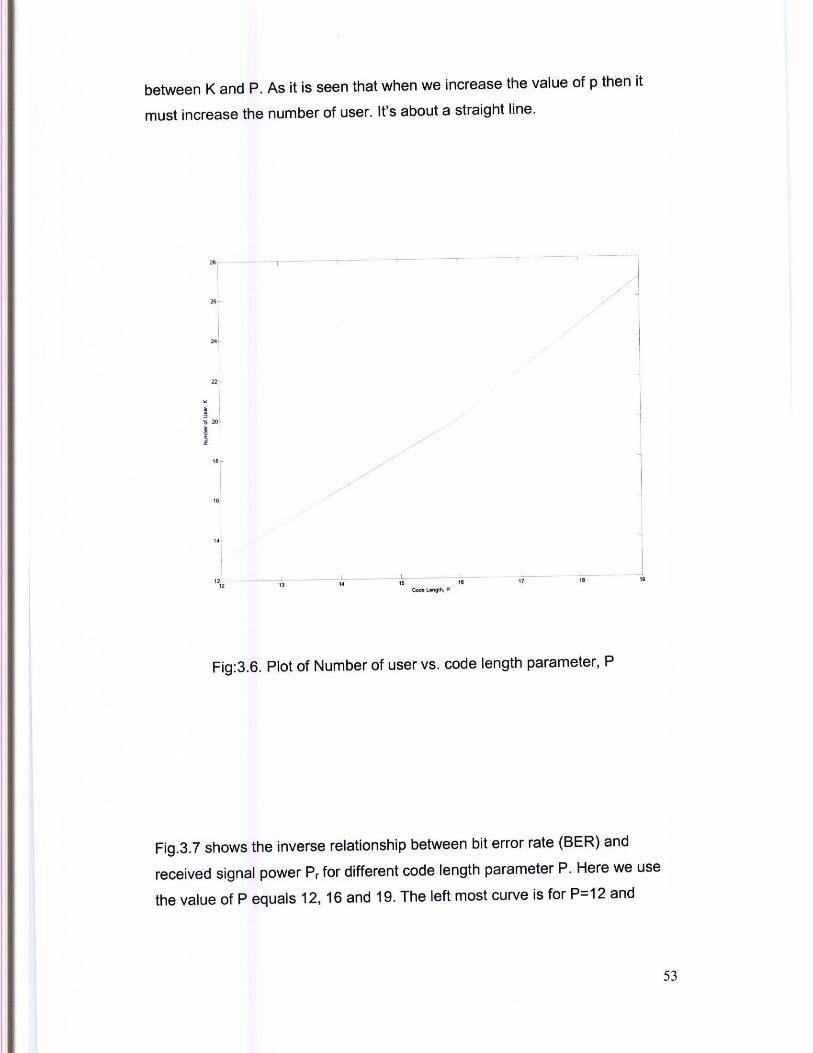
between K and P. As it is seen that when we increase the value of p then it
must increase the number of user. It's about a straight line.
" I
~ I
~f
I
'"
. ~ ;
1 I
"
"
" " ~ --"--- ----'--- -1] ,. 15 ,e
ec. LOO'I9'h. P
, "
Fig:3 .6. Plot of Number of user vs. code length parameter, P
~ J
Fig.3.7 shows the inverse relationship between bit error rate (BER) and
received signal power Pr for different code length parameter P. Here we use
the value of P equals 12, 16 and 19. The left most curve is for P=12 and
53
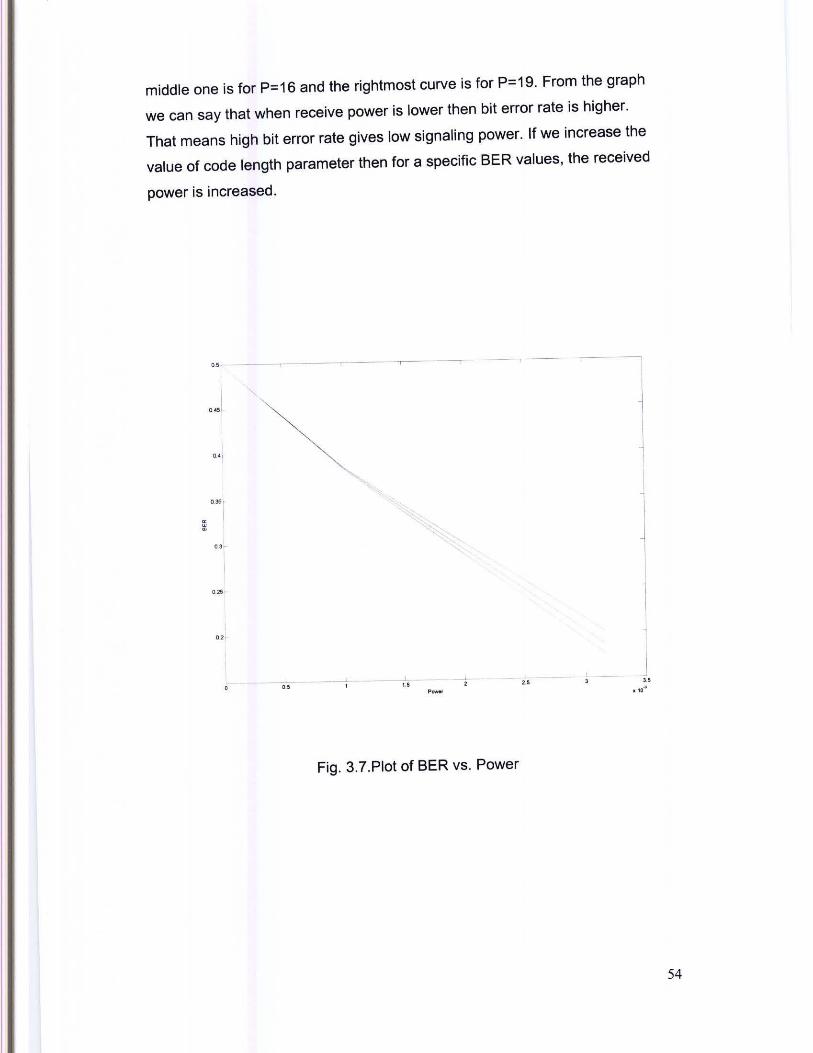
middle one is for P=16 and the rightmost curve is for P=19. From the graph
we can say that when receive power is lower then bit error rate is higher.
That means high bit error rate gives low signaling power. If we increase the
value of code length parameter then for a specific BER values, the received
power is increased.
" I
;; 1
~ ~~ __ ...L 0.5 1 1.5
Fig. 3.7.Plot of BER vs. Power
,~. -
I 1
I j " .10"
54

Chapter 4 Conclusion and Future Work
4.0. Conclusion and Future Work:
55

Throughout the thesis project our goal was to analyze the performance of
Optical COMA in transmission system. We analyze the performance in terms
of SNR (signal-to-noise ratio) and BER (bit error rate). We have also tried to
find out the effect of Multiple Access Interference (MAl). We use several kinds
of data (such as code length parameter, number of user) with different bit
rates. In our analysis we used gold sequence to evaluate the performance.
Our results show that the Optical COMA system can support several kinds of
data with different bit rates in optical fiber network. Moreover we show that
Optical COMA system have better performance than conventional COMA
system.
In future we will analyze the performance of Optical COMA system with
different code sequence such as M-sequence, pn-sequence and we will try to
compare among them.
56
digital transmission based on polarization shift keying modulation,"
IEEE J. Sel. Areas Commun., vol. 13, no. 3, pp. 531-542, Apr.
1995.
2.S. Benedetto and P. Poggiolini, "Theory of polarization shift keying
modulation ," IEEE Trans. Commun., vol. 40, no. 4, pp. 708-721 , Apr.
1992.
3. L. J. Cimini, I. M. I. Habbab, R. K. John, and A. A. M. Saleh, "Preservation
of polarization orthogonality through a linear optical system,"
Electron. Lett., vol. 23, no. 25, pp. 1665-166, Dec. 1987.
4. N. Tarhuni , T. O. Korhonen, and M. Elmusrati, "State of polarization
encoding for optical code division multiple access networks," J. Electromagn.
Waves Appl. (JEMWA) , vol. 21, no. 10, pp. 1313-1321,2007.
5. K. Iversen, J. Mueckenheim, and O. Junghanns, "Performance evaluation
of optical COMA using PoISK-OO to improve bipolar capacity,"
SPIE Proc., vol. 2450, pp. 319-329,1 995.
6. J. Huang, C. Yen, C. Tsai, and F. Jiang, "Multilevel optical COMA network
coding with embedded orthogonal polarizations to reduce phase
noises," Proc. ICICS, pp. 1191-1196, 2005, paper F2E.2.
7. S. Betti, G. O. Marchis, and E. Iannone, "Polarization modulated direct
detection optical transmission systems," J. Lightw. Technol. , vol. 10,
no. 12, pp. 1985-1997, Dec. 1992.
8. M. M. Karbassian and H. Ghafouri-Shiraz, "Fresh prime codes evaluation
for synchronous PPM and OPPM signaling for optical COMA networks,"
J. Lightw. Technol., vol. 25, no. 6, pp. 1422- 1430, Jun. 2007.
9. M. M. Karbassian and H. Ghafouri-Shiraz, "Capacity enhancement
in synchronous optical overlapping PPM-COMA netwrok by a novel
spreading code," in Proc. G/obeCom'07, Nov. 2007, pp. 2407-2411.
10. M. M. Karbassian and H. Ghafouri-Shiraz, "Performance analysis of
heterodyne detected coherent optical COMA using a novel prime code
family," J. Lightw. Technol. , vol. 25, no. 10, pp . 3028-3034, Oct. 2007.
57

~IIIII C; \,,;VUV . .... ..... JI ... •
12. M. M. Karbassian and H. Ghafouri-Shiraz, "Study of phase modulations
with dual-balanced detection in coherent homodyne optical
COMA network," J. Lightw. Technol., vol. 26, no. 16, pp. 2840-2847,
Aug. 15, 2008.
13. M. M. Karbassian and H. Ghafouri-Shiraz, "Novel channel interference
reduction in optical synchronous FSK-CDMA networks using a datafree
reference," J. Lightw. Technol., vol. 26, no. 8, pp. 977-985, Apr.
2008.
14 M. M. Karbassian and H. Ghafouri-Shiraz, "Frequency-shift keying
optical code-division multiple-access system with novel interference
cancellation," Microw. Opt. Technol. Lett., vol. 50, no. 4, pp. 883-885,
Apr. 2008.
http://content.answers.com/main/contentlimg/COE/CLAODING.GIF
http://www.made-in-china.com/image/2fOjOOAvlaLszGhPgcM/Optical-Fiber
Connector-ST-PC-2-0-.jpg
http://www.fiber-optics.info/images/fiber-history-01 .jpg
http://upload . wi ki m ed ia. org/wiki ped i a/su/2/2e/F reg uen cy
division multiplexing .jpg
http://en.wikipedia.org/wiki/Optical fiber#History
58

http://en .wikipedia .org/wiki/File:DanieIColiadon%27s Lightfountain or Lightpi
pe,LaNature(magazine),1884.JPG
http://en .wikipedia .org/w/index.php?title=Special%3ASearch&search=Optical+
fiber+communications&fulitext=Search
59