performance assessment for pump-and-treat closure … · performance assessment for pump-and-treat...
TRANSCRIPT

PNNL-24696 RPT-DVZ-AFRI-029
Performance Assessment for Pump-and-Treat Closure or Transition
September 2015
M.J. Truex
C.D. Johnson
D.J. Becker
M.H. Lee
M.J. Nimmons


PNNL-24696 RPT-DVZ-AFRI-029
Performance Assessment for Pump-and-Treat Closure or Transition
M.J. Truex 1
C.D. Johnson 1
D.J. Becker 2
M.H. Lee 1
M.J. Nimmons 1
September 2015
1 Pacific Northwest National Laboratory
2 U.S. Army Corps of Engineers Environmental and
Munitions Center of Expertise
Prepared for
the U.S. Department of Energy
under Contract DE-AC05-76RL01830
Pacific Northwest National Laboratory
Richland, Washington 99352


iii
Abstract
A structured performance assessment approach is useful to evaluate pump-and-treat (P&T)
groundwater remediation, which has been applied at numerous sites. Consistent with the U.S.
Environmental Protection Agency’s Groundwater Road Map, performance assessment during
remedy implementation may be needed, and should consider remedy optimization, transition to
alternative remedies, or remedy closure. In addition, a recent National Research Council study
examined groundwater remediation at complex contaminated sites and concluded that it may be
beneficial to evaluate remedy performance and the potential need for transition to alternative
approaches at these sites. The intent of this document is to provide a structured approach for
assessing P&T performance to support a decision to optimize, transition, or close a P&T remedy.
The process presented in this document for gathering information and performing evaluations to
support P&T remedy decisions includes use of decision elements to distinguish between
potential outcomes of a remedy decision. Case studies are used to augment descriptions of
decision elements and to illustrate each type of outcome identified in the performance
assessment approach. The document provides references to resources for tools and other
guidance relevant to conducting the P&T assessment.


v
Summary
A structured performance assessment approach is useful to evaluate pump-and-treat (P&T)
groundwater remediation, which has been applied at numerous sites. Consistent with the U.S.
Environmental Protection Agency’s Groundwater Road Map, performance assessment during
remedy implementation may be needed, and should consider remedy optimization, transition to
alternative remedies, or remedy closure. In addition, a recent National Research Council study
examined groundwater remediation at complex contaminated sites and concluded that it may be
beneficial to evaluate remedy performance and the potential need for transition to alternative
approaches at these sites. The intent of this document is to provide a structured approach for
assessing P&T performance to support a decision to optimize, transition, or close a P&T remedy.
The performance assessment approach described in this document is organized to use a set of
decision elements to help decision makers distinguish between several categories of decision
outcomes associated with transition, optimization, or closure of P&T systems. The decision
elements selected for use in the P&T performance assessment include information about:
Contaminant concentrations and trends;
Contaminant mass discharge from source areas or at selected plume locations;
The attenuation capacity of the aquifer;
Estimated future plume behavior and time to reach remedial action objectives (RAOs) for
the site; and
P&T system design, operational, and cost information.
The categories of decision outcomes for this P&T assessment are:
Initiate P&T remedy closure;
Continue with existing or optimized P&T;
Transition to Monitored Natural Attenuation (MNA);
Supplement P&T with other treatment technologies; or
Transition to a new remedy approach.
The performance assessment approach includes revisiting the conceptual site model (CSM),
where it is important to consider the current nature of the source and plume as well as the aspects
controlling contaminant transport and remedy performance. However, to effectively support the
P&T performance assessment and associated remedy decisions, efforts for updating the CSM are
focused on describing the site and current conditions in terms of the decision elements defined in
this document.
The decision elements from the updated CSM are applied in a decision logic framework to
facilitate determining the outcome that is best supported by the performance assessment. Figure
ES-1 shows the primary elements of the decision logic, highlighting the process to distinguish

vi
between different categories of decision outcomes. Case studies are provided in this document
as examples for each of the decision outcomes. In addition, this document provides references to
resources for tools and other guidance relevant to conducting the P&T assessment.
Figure ES-1. Primary elements of the decision logic used for the P&T assessment. The full
decision logic includes additional elements of the decision process, which are omitted
here for brevity.

vii
Acknowledgments
This document was prepared by the Deep Vadose Zone - Applied Field Research Initiative at
Pacific Northwest National Laboratory. Funding for this work was provided by the U.S.
Department of Energy (DOE) Richland Operations Office. The Pacific Northwest National
Laboratory is operated by Battelle Memorial Institute for the DOE under Contract DE-AC05-
76RL01830.
The following people provided case study information.
Dave Becker, U.S. Army Corps of Engineers Environmental and Munitions Center of
Expertise
Ken Broberg, Stoller Newport News Nuclear (SN3)
Hope Lee, Pacific Northwest National Laboratory
Kira Lynch, EPA Region 10
Tamzen Macbeth, CDM Smith
We also thank the following reviewers of this document.
Kira Lynch, EPA, Region 10
Mark Rothas, Mike Bailey, Chuck Coyle, and John Hartley, U.S. Army Corps of
Engineers, Environmental and Munitions Center of Expertise
Mike Singletary, U.S. Navy, NAVFAC Southeast
Nancy Ruiz, U.S. Navy, Environmental Resources and Assessment Division Naval
Facilities Engineering and Expeditionary Warfare Center
Gunarti Coghlan, U.S. Navy, NAVFAC Headquarters
Skip Chamberlain, Department of Energy, Office of Environmental Management
Ken Broberg, Stoller Newport News Nuclear (SN3)
Tamzen Macbeth, CDM Smith
Mart Oostrom, Pacific Northwest National Laboratory
We also thank Bill Myers of Joint Base Lewis McChord for the use of information from site
reports to provide examples for elements of the P&T performance assessment process.


ix
Acronyms and Abbreviations
AC Attenuation capacity
AFB Air Force base
AMSL Above mean sea level
ARAR Applicable or relevant and appropriate requirements
BB Base Boundary (plume); pertains to Case Study 1
bgs Below ground surface
CBA Central Base Area (plume); pertains to Case Study 1
CEC Cation exchange capacity
CERCLA Comprehensive Environmental Response, Compensation, and Liability Act
CFR U.S. Code of Federal Regulations
CMD Contaminant mass discharge
COC Contaminant of concern
CSM Conceptual site model
DCE Dichloroethene (which may be the 1,1-DCE, cis-1,2-DCE, or the trans1,2,-
DCE isomer)
DCP 1,2-dichloropropane
DNA Deoxyribonucleic acid
DNAPL Dense non-aqueous phase liquid
DOE U.S. Department of Energy
Eh Oxidation/reduction potential
EMD Environmental molecular diagnostics
EPA U.S. Environmental Protection Agency
ESD Explanation of significant differences
FEPs Features, events, and processes
GMA Great Miami Aquifer; pertains to Case Study 3
INL Idaho National Laboratory
ISCO In situ chemical oxidation
ISTR In situ thermal remediation
ITRC Interstate Technology & Regulatory Council
MCL Maximum contaminant level
MNA Monitored natural attenuation
MSL Mean sea level (i.e., elevation relative to mean sea level)
NAPL Non-aqueous phase liquid

x
NPL National Priorities List
NRC National Research Council
ORP Oxidation/reduction potential
OU Operable unit
P&T Pump-and-treat
PCA 1,1,2,2-tetrachloroethane
PCE Tetrachloroethene
PNNL Pacific Northwest National Laboratory
POTW Publicly owned treatment works
RAO Remedial action objectives
RCRA Resource Conservation and Recovery Act
RD/RA Remedial design/remedial action
RDX Research Department explosive (cyclotrimethylenetrinitramine)
RI/FS Remedial investigation/feasibility study
ROD Record of decision
SLA Sea Level Aquifer
SVE Soil vapor extraction
TAN Test Area North (at INL)
TCE Trichloroethene
TI Technical impracticability (waiver)
TNT Trinitrotoluene
UCL Upper confidence limit
USACE U.S. Army Corps of Engineers
USCS Unified soil classification system
USGS U.S. Geological Survey
UV Ultraviolet
VC Vinyl chloride
WDOE Washington State Department of Ecology
xi
Contents
Abstract .................................................................................................................................... iii
Summary .................................................................................................................................. v
Acknowledgments.................................................................................................................... vii
Acronyms and Abbreviations .................................................................................................. ix
1.0 Introduction ...................................................................................................................... 1
1.1 Concepts Relevant to a Pump-and-Treat Scenario ................................................... 1
1.2 Definition of Terms .................................................................................................. 4
1.2.1 Contamination, Source Areas, Plumes ........................................................... 4
1.2.2 Extraction Wells ............................................................................................. 5
1.2.3 Monitoring, Receptors, and Goals .................................................................. 6
1.3 Assumptions and Issues ............................................................................................ 7
2.0 P&T Categories ................................................................................................................ 9
2.1 Source Control .......................................................................................................... 9
2.2 Plume Containment .................................................................................................. 13
2.3 Plume Reduction ...................................................................................................... 17
3.0 Regulatory Setting ............................................................................................................ 21
4.0 Performance Assessment Decision Logic ........................................................................ 23
5.0 Conceptual Site Model Update and Approaches for Obtaining Decision Element
Information ....................................................................................................................... 29
5.1 Fundamental Site Information .................................................................................. 29
5.1.1 Site Overview and Context of the Plume and Remedy Configuration ........... 29
5.1.2 Describe the Subsurface Hydrogeology ......................................................... 30
5.1.3 Describe the Hydraulic Head Distribution with and without P&T
Operating ........................................................................................................ 33
5.1.4 Describe the Source, Plume, and Known Controlling Features, Events,
and Processes .................................................................................................. 35
5.2 Decision Element Information.................................................................................. 38
5.2.1 Contaminant Concentrations and Trends ....................................................... 39
5.2.2 Contaminant Mass Discharge ......................................................................... 41
5.2.3 Natural Attenuation Capacity ......................................................................... 46
5.2.4 Estimates of Plume Behavior and Time to Reach RAOs ............................... 48
5.2.5 P&T Design and Operational Information ..................................................... 49
xii
6.0 P&T Remedy Assessment ................................................................................................ 53
6.1 Assessment With Respect to RAOs and Plume Changes ......................................... 56
6.2 Assessment for Declining Plumes ............................................................................ 56
6.2.1 Assessment of MNA....................................................................................... 57
6.2.2 Assessment of Continued P&T ...................................................................... 61
6.3 Persistent Plume/Source Assessment ....................................................................... 62
6.4 Alternative Remedy Selection .................................................................................. 65
7.0 References ........................................................................................................................ 67
Appendix A: Case Studies ...................................................................................................... A.1

xiii
Figures
1 Diagram depicting the general pump-and-treat scenario where a source zone results
in a dissolved phase plume, extraction wells are used to intercept the contaminant
plume, and contaminated water is treated in an aboveground treatment system prior
to final disposition ............................................................................................................ 2
2 Conceptual application of P&T for source control, showing the intended outcome of
cutting off the source from the main dissolved phase plume ........................................... 10
3 Change in TCE concentrations over time at plume monitoring wells located 1100
feet downgradient and 2700 feet downgradient from a Source Control P&T system ...... 11
4 Predicted contaminant mass discharge across a flux plane located about 7500 ft
downgradient from a Source Control P&T system, with the plane oriented
perpendicular to the direction of groundwater flow and spanning the width/depth of
the plume .......................................................................................................................... 12
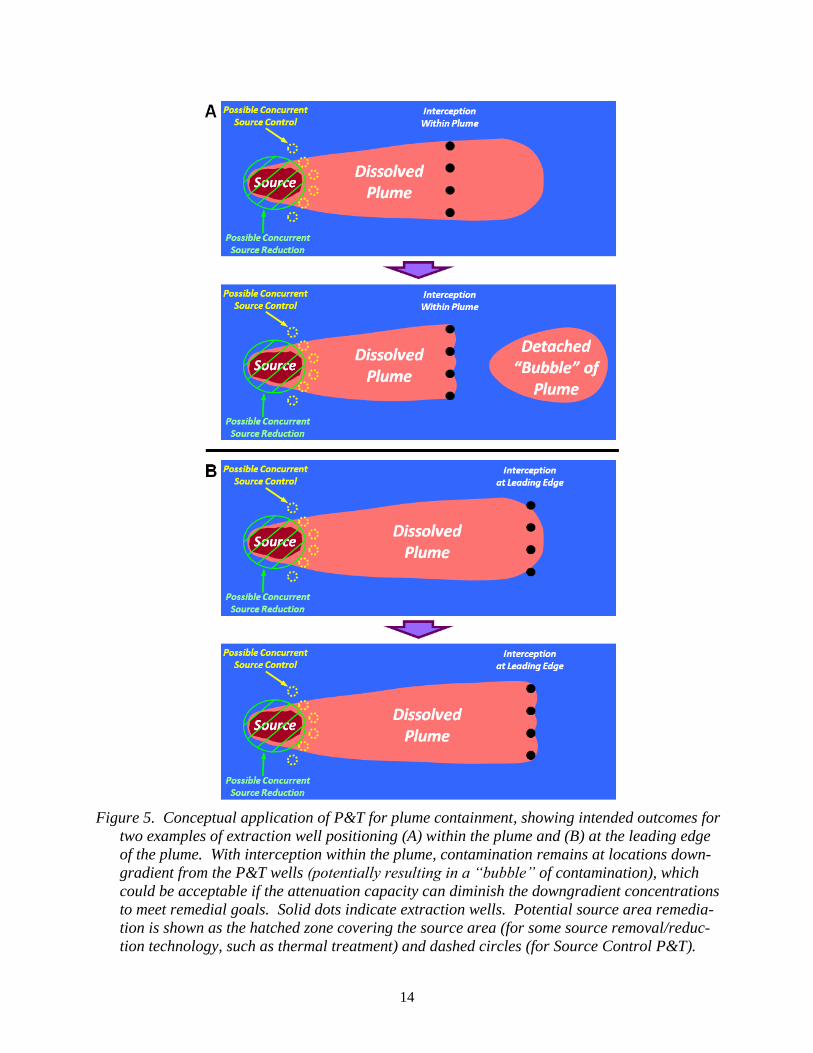
5 Conceptual application of P&T for plume containment, showing intended outcomes
for two examples of extraction well positioning within the plume and at the leading
edge of the plume ............................................................................................................. 14
6 Lateral locations of flux planes for the estimated mass discharge analysis shown in
Figure 7 ............................................................................................................................. 15
7 Contaminant mass discharge across the flux planes depicted in Figure 6 for history
matching and predictive portions of a numerical model simulation for a plume-
containment P&T system ................................................................................................. 16
8 Conceptual application of P&T for plume reduction, showing progress towards the
intended outcome of dissolved phase plume volumetric treatment.................................. 17
9 Conceptual depiction of the source flux zone being controlled by P&T and a
downgradient attenuation zone, whose extent must be determined by the site
decision makers ................................................................................................................ 24
10 Decision logic flow chart.................................................................................................. 27
11 Example depiction of a site plume and remedy overview from Joint Base Lewis
McChord ........................................................................................................................... 30
12 Conceptual geologic cross section approximately along the centerline of the plume in
the Vashon Aquifer........................................................................................................... 31
13 Annotated numerical model cross section along the nominal axis of the contaminant
plume in the Vashon Aquifer located above the Qpon Aquitard ..................................... 32
14 Localized cross section of the nominal hydrogeology along the Vashon Aquifer
plume centerline near the I-5 P&T system and the window to the lower Sea Level
Aquifer .............................................................................................................................. 33
15 General flow path of contamination in the Sea Level Aquifer from the window
toward Puget Sound .......................................................................................................... 34

xiv
16 Representative 2004 hydraulic head data for wells projected onto the cross section
along the Vashon plume centerline near the I-5 P&T system and the window to the
lower Sea Level Aquifer ................................................................................................... 35
17 Example initial site depiction identifying the major elements of the site that will need
to be evaluated as part of contaminant fate/transport assessment and remediation
design, considering contaminant fluxes and conditions that will affect contaminant
fate and transport, and identifying reactive facies that participate in sorption or
solubility control reactions with contaminants ................................................................. 36
18 A variety of attenuation mechanisms may be important to contaminant transport .......... 37
19 Example of the Joint Base Lewis McChord plume system with interpretation of flow
paths, TCE contaminant concentrations, and CMD for conditions prior to P&T
operations ......................................................................................................................... 38
20 Interpolation of TCE concentration data in the Vashon Aquifer at Joint Base Lewis
McChord for 2007 and 2012 ............................................................................................ 40
21 Representation of a plume captured at a pumping well ................................................... 41
22 Concentrations at individual P&T wells over time and grouped by individual well for
each year ........................................................................................................................... 42
23 Example of a mass flux transect ....................................................................................... 44
24 Given a transect of wells, the actual contaminant distribution can be assessed with
passive flux measurements to provide an interpreted contaminant flux distribution ....... 44
25 Elements of an integrated pump test in which concentration data from a transect of
wells perpendicular to the plume flow direction is analyzed to determine
contaminant mass flux and average concentration at the transect .................................... 45
26 Conceptual examples of attenuation rate calculations for point rates, bulk rates, or
biodegradation rates.......................................................................................................... 47
27 Example geologic cross section and contaminant data for a P&T well system
segment at Joint Base Lewis McChord ............................................................................ 50
28 Example of modeling results for a P&T system at defined pumping rates, showing
calculated hydraulic head contours and the extent of a one-year capture zone, as
determined from backwards particle tracking at different layers/elevations.................... 51
29 Decision logic, Section 6.0 cross-references, and cross-reference of outcomes and
case studies ....................................................................................................................... 55
30 Conceptual depiction of the source flux zone being controlled by P&T and a
downgradient attenuation zone, whose extent must be determined by the site
decision makers ................................................................................................................ 57
Tables
1 Summary of Decision Criteria and Outcomes .................................................................. 54

1
1.0 Introduction
Groundwater remediation by the pump-and-treat (P&T) technology has been applied at
numerous sites. Existing guidance (e.g., EPA 1994, 1996a, 1997, 1999a, 1999b, 2000a, 2002a,
2007a, 2008; USACE 1999, 2000) provides information on design, operation, and optimization
for P&T systems. Research has also identified factors that impact the performance of P&T
remedies (e.g., Rivett et al. 2006; Sale and Newell 2011). Consistent with the U.S. Environ-
mental Protection Agency’s Groundwater Road Map (EPA 2011a) and Groundwater Remedy
Completion Strategy (EPA 2014a), performance assessment during remedy implementation may
be needed and should consider optimization of a remedy, transition to alternative remedies, or
remedy closure. In addition, a recent National Research Council study (NRC 2013) examined
groundwater remediation at complex contaminated sites and concluded that it may be beneficial
to evaluate remedy performance and the potential need for transition to alternative approaches at
these sites. The intent of this document is to provide a structured approach for assessing P&T
performance to support a decision to optimize, transition, or close a P&T remedy.
The process presented in this document for gathering information and performing evaluations
to support P&T remedy decisions includes 1) considering how the P&T system is applied, 2)
revisiting the conceptual site model, and 3) use of decision elements to distinguish between
potential outcomes of a remedy decision. Case studies are used to augment descriptions of
decision elements and to illustrate each type of outcome identified in the performance
assessment approach.
The remainder of this introduction section presents key concepts, terms, and assumptions
relevant to implementation of this guidance. Section 2.0 provides a description of the categories
of P&T applications and discusses key design and performance aspects that are important to
consider when evaluating P&T performance. The regulatory context for P&T performance
assessment and any associated remedy decisions is discussed in Section 3.0. Section 4.0
provides a description of the P&T performance assessment approach and decision logic. Most
sites will have a conceptual site model (CSM) that was used to support the original remedy
design, but after P&T operation this CSM should be revisited in the context of defining the
current conditions. Data compiled during P&T operations and any additional data needed to
support optimization, transition, and closure decisions should be compiled. Section 5.0
addresses actions to update the CSM and provide technical information for the decision elements
used in the P&T performance assessment. Section 6.0 describes application of the P&T
performance assessment approach to support a remedy decision process. Full descriptions of
case studies referred to in Section 6.0 are provided in Appendix A.
1.1 Concepts Relevant to a Pump-and-Treat Scenario
The P&T remediation technology is conceptually simple, being comprised of three main
aspects: groundwater extraction, aboveground treatment, and groundwater monitoring to assess

2
performance (Figure 1). However, P&T performance is impacted by a number of factors and the
technology encompasses a broad range of variations in how it is applied. It is beyond the scope
of this document to discuss all such variations, thus, P&T closure and transition are discussed
here in the context of general scenarios and major categories of P&T implementation (Section
2.0). Each site will need to consider how their site-specific implementation is related to the
general framework discussed in this document.
Figure 1. Diagram depicting the general pump-and-treat scenario where a source zone results
in a dissolved phase plume, extraction wells are used to intercept the contaminant
plume, and contaminated water is treated in an aboveground treatment system prior
to final disposition. This is a simplistic depiction, which does not include all
variations of P&T categories, or other important mass transfer processes like
adsorption and diffusion.
A core component of P&T is the process of extracting contaminated groundwater from a
saturated zone (i.e., aquifer) in the subsurface via pumping wells. This is a bulk process that
transfers contaminants dissolved in the groundwater from the subsurface to processing
equipment/facilities located aboveground. The counterpart technology for extracting
contaminants from unsaturated (vadose) zone soils is soil vapor extraction (SVE). Such bulk
transfer involving fluid flow through the porous media of the subsurface also involves mass
transfer processes related to the nature of the porous media, the phases present, contaminant
properties, and flow regimes derived from the distribution of geological materials in the

3
subsurface. One common factor in the efficiency of extracting contaminants from the subsurface
is interphase mass transfer, for example between non-aqueous phase liquid (NAPL) or solid
phase materials and the groundwater. A second common factor is the variation in groundwater
flow characteristics resulting from geologic layering and the heterogeneity in hydrogeological
property values of the subsurface materials. Zones with high permeability (e.g., sand materials)
are “flushed” more readily, resulting in better removal of contaminants. In contrast, low-
permeability materials may have less advective flow, thus mass transfer of contaminant to
groundwater for extraction may be limited by diffusional processes (in addition to the interphase
mass transfer processes). Thus, the design and operation of the extraction well system to
appropriately capture and extract contamination is of primary concern for the P&T technology.
P&T may also be applied for hydraulic manipulation of the aquifer for the purpose of
changing the hydraulic gradient and capturing or containing contaminated groundwater. This
type of manipulation can be used to help contain the impact of an ongoing source of
contamination or prevent the plume from migrating further, even though overall contaminant
mass reduction within the source or plume is not efficient. Hydraulic manipulation includes the
effects of groundwater extraction and/or injection (or infiltration) of clean water on the hydraulic
gradients in the aquifer.
Moving contamination to an aboveground location opens up many options for treating the
groundwater and destroying the contaminant or reducing the volume of contaminated media.
Aboveground treatment processes are very versatile and are designed with well-understood
process engineering methods and treatment principles. A wide range of aboveground treatment
technologies can be employed, including air stripping, granular activated carbon adsorption, ion
exchange, chemical oxidation, thermal treatment, electrochemical treatment, and many others.
There is often little uncertainty in the aboveground treatment system, with the considerations
being more along the line of determining design specifications (e.g., the treatment system size,
number of “stages,” etc.) that are required to achieve the desired level of treatment in the most
cost-effective manner. Because there are many variations of aboveground treatment and because
it is primarily a matter of suitable engineering design to achieve the desired treatment level, the
“treat” portion of P&T will not be discussed in any detail in this document (and “P&T” will refer
mainly to the groundwater extraction portion of the technology).
Groundwater monitoring is the third aspect of applying the P&T technology. Process and
contaminant concentration data obtained from monitoring the P&T extraction wells themselves
is important, but a monitoring well network provides additional information for assessing the
performance of the P&T system. Monitoring well information may be important to augment
P&T system data for additional spatial coverage of the plume or source, in particular for
assessing the portion of the plume downgradient of the P&T system. Information on P&T
performance is useful for optimizing the P&T groundwater extraction system and assessing P&T
closure and transition, as discussed in later sections of this document.

4
1.2 Definition of Terms
Terminology of P&T remediation systems is presented below to facilitate the subsequent
description of P&T performance assessment. Additional terminology/concepts related to P&T
implementation categories are discussed in Section 2.0. Concepts relevant to the P&T
performance assessment, such as contaminant mass discharge and attenuation capacity, are
described in Sections 4.0 to 6.0.
1.2.1 Contamination, Source Areas, Plumes
The contamination addressed by P&T consists of dissolved-phase contaminants, i.e., organic
or inorganic contaminants that are solutes in the groundwater of a saturated zone in the
subsurface. This document does not include applications of multi-phase extraction that are
designed to extract NAPL as a source reduction method. P&T is not applied within unsaturated
(vadose) zone soils; SVE is the counterpart technology for extraction of vadose zone vapor
contamination.
Contamination can be introduced to the groundwater in multiple ways. Common
mechanisms by which contaminants are introduced into groundwater include infiltration of a
NAPL, infiltration of dissolved aqueous solutes along with natural or artificial recharge, leaching
of contaminants from soil to groundwater, or mass transfer between vadose zone soil gas and the
groundwater. A less common mechanism would be direct pollution of groundwater (e.g., via
leakage of waste containers or tanks placed within the saturated zone or disposal of waste via a
well screened in a saturated zone). Contaminants will interact with the environment as they
migrate to (and through) the groundwater and the contamination will typically result in a source
area that produces a dissolved contaminant plume in the groundwater.
When organic or inorganic contaminants are introduced to the subsurface, they will interact
with the environment, which can affect the mobility/availability of the contaminants for
extraction processes. Interactions with the environment include mass transfer between phases
(gas, aqueous, NAPL, and solid), including volatilization, dissolution, and adsorption processes.
Minerals and/or organic solids may adsorb contaminant mass, depending on the contaminant
concentrations, the contaminant properties, and the properties of the soil components. Other
interactions include chemical reactions, either abiotic or biologically mediated. Chemical
reactions can result in transformation of a contaminant to a different compound (whether that is
another contaminant or an innocuous compound). Chemical reactions can also enhance
adsorption or precipitation by changing the redox state of a contaminant (i.e., for inorganic
contaminants). The interphase mass transfer and environmental interactions play a role in how a
contaminant migrates (due to advective and/or diffusive gradients) and the potential for
contaminant accumulation in a particular phase or zone. This type of accumulation could result
in a long-term source of contamination. For example, adsorbed contaminant mass in a diffusion-
limited zone can become a source for future aqueous phase contamination when conditions
change to become suitable for desorption of the contaminant.

5
The source area for a waste site is a zone of high contaminant concentration that is the origin
of a groundwater contaminant plume. There may be more than one source area at a site,
depending on the nature of the environmental release. For the purpose of this document, the
source area is defined to be in the vicinity where waste disposal or leakage initially occurred. At
this location, contaminants may be present in the vadose zone, with ongoing mass transfer to the
groundwater as the groundwater plume source. The source area may also (or instead) have a
continuing source within the aquifer. Aquifer locations where contaminant mass has
accumulated (e.g., residual NAPL mass immobilized within the soil pore structure, such as in
low permeability layers/lenses in the subsurface) can be a continuing source to the plume as
mass transfers out of these zones. Depending on the history of contaminant interactions in the
subsurface, continuing sources may be present downgradient of the original source area through
mechanisms such as matrix diffusion. In general, these downgradient sources are more dispersed
and are considered part of the plume with respect to implementing “source control.”
The distribution of dissolved phase contamination in the groundwater comprises a
“contaminant plume.” Generally, a contaminant plume is defined as the spatial extent of
dissolved phase contaminant concentrations at or above the maximum contaminant level (MCL).
Contaminant plumes will have a gradation in concentrations, with high concentrations at the
source area (or core of the plume) and lower concentrations further downgradient.
1.2.2 Extraction Wells
An extraction well uses a pump to pull water from a vertical (or occasionally from a
horizontal) interval screened in the saturated zone, moving the water to the surface for further
disposition (e.g., treatment, beneficial use, etc.). Pumping an extraction well “captures” water in
a zone around the well, although the time it takes for water to travel to the well will differ
depending on proximity to the extraction well. The spatial extent of this capture zone is related
to the pumping rate, thickness of the aquifer, aquifer hydraulic properties, and the hydraulic
gradient in the aquifer. These parameters also determine the “drawdown” (depression) of the
groundwater hydraulic head (a measure of pressure) from static conditions. Multiple wells may
be used together for an extraction system and may be located in a variety of configurations.
Common multiple-extraction-well P&T configurations include a line of wells and a V-shaped
arrangement. Using multiple extraction wells can improve capture of groundwater because of
the additive effects on the drawdown of hydraulic head.
Contaminated groundwater that is extracted from the saturated zone requires treatment
(discussed in Section 1.1) and subsequent disposition. There are several common outlets for
treated groundwater (EPA 2007b). Groundwater is often returned to the subsurface via injection
wells or infiltration galleries. Injection wells or infiltration galleries can be used in conjunction
with extraction wells to manipulate the local hydraulic gradient, influencing the direction and
velocity of plume movement for the purpose of enhancing capture or plume control. Another
common outlet for treated water, when appropriate permits are secured, would be into the
collection system for a publicly owned treatment works (POTW) or into surface waters (e.g., a

6
lake or river). The beneficial use of treated groundwater (for example, as the supply for a
cooling water system) is a third possible category of treated water disposition.
1.2.3 Monitoring, Receptors, and Goals
The implementation and performance monitoring for a P&T remedy are influenced by key
factors, including the nature of the hydrogeological units that are contaminated, the direction of
contaminant movement, how fast the contamination is migrating, what attenuation process are
involved, the location of potential receptors, and the objectives of the remedial action. These
factors are typically identified in a CSM as part of the remediation planning and design
processes. The CSM should include quantitative information about important factors that will be
used to support remedy decisions about optimization, transition, or closure of a P&T system.
After a period of remediation, it is typically necessary to update the CSM using available
characterization, plume monitoring, and P&T operational data. An important aspect of updating
the CSM is inclusion of trend data that are available from the period of P&T remediation. The
trend data will help define the plume behavior and related conceptual site model elements.
Protecting potential receptors is a key focus of the remedial action and will influence the
nature of the remedy. A receptor is a point where human or ecological exposure to contaminants
may occur via a defined exposure route (e.g., ingestion, inhalation) as a result of contaminant
migration. The location of a potential receptor and the rate of contaminant migration can lead to
different requirements for the remedy. If a receptor is distant or contaminant migration is slow,
then the urgency of remediation is less. In contrast, a receptor within or close to the
contamination would require more urgency in remediation and would have different objectives
for the remedy. In addition, future beneficial use of groundwater is typically considered as part
of setting remedial action objectives (RAOs) and may also have important implications for
remedy design and evaluation of P&T closure or transition to alternative approaches, especially
for “complex” sites (NRC 2013).
Collection of monitoring data is important to determine the effectiveness of the remedial
technology. Thus, it is important to follow guidance (e.g., EPA 1994, 2002a, 2003, 2004; ITRC
2010a, 2011b) on the design and placement of monitoring wells to obtain useful data to answer
the relevant questions about the remediation. The length of the screened interval and the well
screen location (relative to the contamination and to hydrogeological units) are important
considerations for monitoring well installation. Measured concentrations can be influenced by
dilution (e.g., by water from other zones for long well screens). Similarly, layering of subsurface
materials within a screened zone can affect both the interpretation of measured concentrations
and, for extraction wells, the effectiveness of mass removal. In addition, it is important to
consider the monitoring aspect of P&T extraction wells and the P&T operational information. In
many cases, the P&T system is particularly well suited to evaluate contaminant mass
flux/discharge over time, which can be used to interpret source and plume behavior, in addition
to providing input for P&T operations.

7
1.3 Assumptions and Issues
The discussion of terms and concepts pertaining to P&T has introduced some ideas that are
relevant to the limitations of the technology. The issues with P&T and some overall assumptions
about P&T are described further in this section to provide the context for the discussion of P&T
performance assessment.
For the purposes of this document, several assumptions apply. As mentioned above, the
focus of this document is on the groundwater extraction portion of the P&T technology, with the
assumption that the aboveground treatment has been suitably designed to achieve effective
treatment. P&T is assumed to have been operating for some period of time as part of a remedy.
During this period of operation, it is assumed that some amount of data has been collected,
whether that data consists of groundwater contaminant concentrations from extraction wells
(individual or combined), concentrations from a spatially broader groundwater monitoring
network, and/or concentration data from specific tests (e.g., an integrated pump test to determine
mass flux/discharge). Along with the concentration data, it is assumed that operational data for
the P&T system is available (i.e., flow rates, timeframes for periods of operation and for periods
without pumping). Relative to the groundwater contamination, it is assumed that the location of
the source and the dissolved plume are generally understood. That is, this document does not
cover initial site investigation or remedial investigation phases, nor are investigations to
determine new sources discussed.
There are many variations in P&T system configurations (well patterns, well placement
relative to plume/source, operational strategy [flow rates/schedule], type of aboveground
treatment, etc.). The guidance in this document is framed around typical CSM elements and
categories of P&T implementation, so the guidance may need to be adapted by the reader to
account for site-specific situations.
While P&T is a prevalent remedy, it is not uncommon to find limitations in the effectiveness
of the contaminant extraction component of the P&T technology. In particular, there may be
performance limitations in terms of the technology requiring a long cleanup timeframe, including
implications about associated ongoing costs. Assuming that the plume location is understood
and a P&T system was appropriately designed, P&T may reach a point of diminishing returns.
P&T is a mass transfer process involving bulk extraction of groundwater and associated
dissolved contaminant mass, plus processes at a smaller scale involving mass transfer between
hydrogeologic units (i.e., between fine-grained and high permeability units) and between phases
(either soil particles or NAPL). At some point, it is possible that the bulk extraction has
successfully removed contaminant mass from high permeability materials where groundwater
flows readily. Yet, contaminant may still remain and be slowly be extracted as it is released by
desorption, diffusion, or dissolution. At such a point, the capture of contaminant mass
encounters mass transfer limitations associated with those small-scale processes. The
performance of P&T over time can exhibit an initial large mass removal that declines and

8
approaches a long period of tailing, possibly asymptotically approaching a concentration (which
may be above the cleanup goal). Similar to SVE, it may be possible to halt the P&T system for a
period, and then observe a “rebound” to higher extracted concentrations upon restarting the
system. Identifying rebound can provide useful information to support remedy decisions.
In addition to the inherent mass transfer limitations faced by P&T remediation, other
activities may influence the performance of the system. For example, a source
treatment/removal action may have taken place concurrent with the P&T. Such actions change
the site scenario and need to be included in the CSM, after which it may be appropriate to revisit
the P&T remedy to assess whether the new conditions warrant P&T closure or transition.

9
2.0 P&T Categories
The objective for deploying P&T determines the design factors of the system, particularly
with respect to the placement and operation of the extraction wells. P&T remediation is
frequently focused on extraction or control of the dissolved-phase groundwater contaminant
plume located downgradient from the source. There are three basic categories of P&T
implementation, depending on the functional purpose or remedial goals of the system. These
three P&T categories are discussed in the following sub-sections.
2.1 Source Control
The general purpose of applying P&T for source control (Figure 2) is to intercept and capture
dissolved phase contamination from the saturated zone adjacent to or within the source area,
thereby preventing or minimizing mass flux to downgradient areas. In essence, the goal for this
type of application is to cut off the downgradient dissolved phase plume from the source of
contamination, resulting in a “detached plume” (i.e., a dissolved-phase plume detached from the
source area). The source control is typically achieved by two aspects of the P&T. The P&T
system not only extracts contaminated groundwater to prevent downgradient migration, but it
also alters the hydraulic gradient and thus decreases the driving force for downgradient
advection.
Note that source control differs from source reduction, for example by multiphase extraction
wells designed to remove NAPL. In source control, the objective is to manage mass flux of
dissolved contamination out of the source area, while source reduction involves removal of
contaminant mass to diminish the source. As noted in Section 1.2.1, source reduction is not
addressed in this document. However, source reduction activities may affect the system in ways
(e.g., by influencing the hydraulic gradient) that may need to be considered when defining the
CSM.
Capture of the contaminants at the source area to allow the downgradient plume to diminish
is a key performance goal when applying P&T for source control. Thus, capture analysis and
indication that the downgradient plume has diminished are key performance assessment elements
during operations. Decisions about potential termination of source control P&T are related to a
diminished source strength and the ability of either natural attenuation in the downgradient
aquifer or an alternative technology to meet the remedial action objectives. That is, an
assessment would evaluate whether there is a diminished need to contain the source.

10
Figure 2. Conceptual application of P&T for source control, showing the intended outcome of
cutting off the source from the main dissolved phase plume. The detached plume
would need to be treated by natural attenuation or an active remediation technology.
Solid points denote an example configuration of extraction wells just downgradient
from the source area. Dashed circles indicate additional options of extraction wells
within the source area (for source reduction and control), extraction wells upgradient
of the source area (for hydraulic control to facilitate source control), or injection
wells upgradient of the source area (for increased flushing of the source zone).
Example Site: At Joint Base Lewis McChord (Tacoma, Washington), a P&T system is
being used for source control as part of the remedy for a TCE plume. After source
reduction by thermal treatment had diminished the source, a Source Control P&T
system was applied to hasten decline of the large downgradient plume (Figures 3
and 4). This action helps limit the operational duration of plume containment P&T
systems being applied further downgradient of the source area.

11
A
B
Figure 3. Change in TCE concentrations over time at plume monitoring wells located (A) 1100
feet downgradient and (B) 2700 feet downgradient from a Source Control P&T
system. The nearer well exhibits a noticeable decline in TCE concentrations in the
period after thermal treatment was applied for source reduction and the Source
Control P&T system had been started. TCE concentrations at the farther well are
slower to respond, but are expected to decline over time.

12
Figure 4. Predicted contaminant mass discharge across a flux plane located about 7500 ft
downgradient from a Source Control P&T system, with the plane oriented
perpendicular to the direction of groundwater flow and spanning the width/depth of
the plume (adapted from Truex and Johnson [2013]). The source control P&T was
initiated in 2006 and the mass discharge response shows how the downgradient
plume is predicted to diminish over time at this location (which corresponds to the
location of a downgradient plume containment P&T system) as a result of “cutting
off” the plume from the source. These simulations were conducted during the design
phase of the Source Control P&T.
For source control, design and operation of the P&T system are focused on containment of
dissolved phase contamination located within or at the periphery of the source area.
Distinguishing characteristics of dissolved-phase source control include the following items.
1. Extraction well(s) are positioned at the periphery of the contamination source. Some
applications may include extraction wells within the source area (for source control)
and/or upgradient of the source area (for hydraulic manipulation to facilitate source
control) or may include injection wells (to increase flushing of the source zone).
2. Collection and extraction of contaminated groundwater outside of the source area (i.e.,
from the downgradient plume) is not a factor in the design, location selection, or
operation of the source control P&T wells.
3. The groundwater pumping rate is usually high enough to depress the local water table to
facilitate contaminant capture and minimize contaminant migration away from source
area.
4. Extraction wells are designed to remove water, not NAPL.
5. The aboveground treatment system equipment is designed to treat only dissolved phase
contamination in the groundwater.

13
6. Source Control P&T extraction wells, because of their proximity to the source of
contamination, may be used to capture byproducts or untreated contaminants released
from a separate and independent source treatment process deployed within the source
area. Examples of separate source treatment processes include thermal heating,
biological treatment, or chemical oxidation of source area contaminants.
7. Source Control P&T systems may facilitate use of other concurrently implemented
actions to address downgradient plume reduction and/or containment.
2.2 Plume Containment
The general purpose of applying P&T for plume containment is to intercept and remove
dissolved-phase contamination at a specific location to prevent or minimize the continued
expansion of the plume (Figure 5). Control of the extent of the dissolved-phase plume, not mass
reduction, is the primary objective of P&T for plume containment. Plume containment is often
used to protect potential downgradient receptors or to prevent migration of the plume beyond site
boundaries.
Capture of the plume to prevent further migration past the P&T location, so that the
downgradient plume can diminish and/or so that receptors are protected, is a key performance
goal when applying P&T for plume containment. Thus, capture analysis and indication that the
downgradient plume is diminishing (attenuating) or is not present are key performance assess-
ment elements during operations. Decisions about potential termination of P&T that is applied
for plume containment are related to a diminished plume upgradient of the P&T system such that
natural attenuation in the aquifer or use of an alternative technology can meet the RAOs.
Distinguishing characteristics of P&T for plume containment include the following items.
1. The extraction well system is designed to maximize interception of plume at the selected
P&T location. Wells are placed sufficient in number and spacing to laterally intercept
and capture the plume. The screened interval, pump placement, and extraction flow rate
are designed to capture contamination across the vertical extent of the plume.
2. Extraction well(s) are positioned either at the downgradient edge of or within the
dissolved-phase plume to intercept the contamination. When wells are located within the
plume, some portion of the plume (potentially as a detached “bubble” of contamination)
may continue moving downgradient, typically with the intent that natural attenuation will
meet cleanup goals for this contamination.
3. Collection and extraction of contamination in the source area is not a factor in the design,
location selection, or operation of the P&T wells installed for plume containment.
4. Plume containment P&T systems may be deployed to protect downgradient receptors or
prevent migration across site boundaries while other actions are concurrently
implemented to address plume reduction and/or source area treatment.
14
Figure 5. Conceptual application of P&T for plume containment, showing intended outcomes for
two examples of extraction well positioning (A) within the plume and (B) at the leading edge
of the plume. With interception within the plume, contamination remains at locations down-
gradient from the P&T wells (potentially resulting in a “bubble” of contamination), which
could be acceptable if the attenuation capacity can diminish the downgradient concentrations
to meet remedial goals. Solid dots indicate extraction wells. Potential source area remedia-
tion is shown as the hatched zone covering the source area (for some source removal/reduc-
tion technology, such as thermal treatment) and dashed circles (for Source Control P&T).

15
Example Site: At Joint Base Lewis McChord, a P&T system is being used for plume
containment as part of the remedy for a TCE plume. Mass discharge across flux
planes (depicted in Figure 6) was calculated from simulation results of history
matching and predicted plume behavior. Figure 7 shows the simulation mass
discharge decreasing when plume containment P&T is initiated, with the source
control enhancing the performance over time.
Figure 6. Lateral locations of flux planes for the estimated mass discharge analysis shown in
Figure 7 (adapted from Truex and Johnson [2013]). Note that the line for wells
reflects the transect location, not the details of number and position of wells.

16
Figure 7. Contaminant mass discharge across the flux planes depicted in Figure 6 for history matching and predictive portions of a
numerical model simulation for a plume-containment P&T system (adapted from Truex and Johnson [2013]). The total
pumping rate at the plume containment P&T system is plotted for reference, reflecting system startup and operational
changes over time. Existing contamination downgradient of the plume containment P&T location decline over time.
Startup of an upgradient Source Control P&T system in 2006 is denoted as a key event affecting the overall plume,
resulting .in an eventual decrease in contaminant flux moving to the plume containment P&T system.

17
2.3 Plume Reduction
The general purpose of applying P&T for plume reduction is to diminish the dissolved-phase
contamination below a target value (Figure 8). Volumetric extent and concentration of the
contaminant plume can be reduced by P&T, though typically with more aggressive manipulation
of the groundwater (i.e., higher pumping rates) and generally a greater number of extraction
wells than applied for source control or plume containment.
Figure 8. Conceptual application of P&T for plume reduction, showing progress towards the
intended outcome of dissolved phase plume volumetric treatment. In most cases, it
will be important to remove or contain the source for plume reduction to be
successful. Solid dots indicate extraction wells (in one example layout). Potential
source area remediation is shown as the hatched zone covering the source area (for
some source removal/reduction technology, such as excavation or thermal treatment)
and dashed circles (for source control).
Volumetric capture of the plume to hasten attainment of contaminant concentrations at or
below the remedial goals and to prevent further migration is a key performance goal when
applying P&T for plume reduction. Thus, capture analysis and indication that the plume is
diminishing are key performance assessment elements during operations. Decisions about
potential termination of P&T that is applied for plume reduction are related to reaching a plume
condition such that natural attenuation in the aquifer or the use of an alternative technology can
meet the RAOs.

18
Distinguishing characteristics of P&T for plume reduction include the following items.
1. Multiple extraction wells are positioned throughout the extent of the dissolved-phase
plume to maximize capture of contamination. A distribution of extraction wells along the
axis of the plume (following the plume flow path) would be a typical approach, but is just
one example.
2. The P&T system total extraction rate may be greater than would be specified for a plume
containment strategy.
3. The extraction well system is designed to maximize contaminant mass removal within the
plume. That is, the screened interval and pump placement are designed to capture
contamination across the vertical extent of the plume and wells are placed sufficient in
number and spacing to maximize capture of contamination while the pumping rate is set
to minimize the overall duration of operation.
4. P&T systems for plume reduction may be constructed with the goal of transitioning to
passive technologies for attaining final cleanup goals.
Example Site: At the U.S. Department of Energy Hanford Site (Richland, Washing-
ton), a P&T system was installed to reduce plume concentrations sufficiently that it
would be feasible to transition to monitored natural attenuation (MNA) to complete
remediation. With respect to P&T implementation and subsequent MNA of the
remaining plume, the Record of Decision (EPA, DOE, and WDOE 2008) includes
the following statements (pp. 2-3).
A groundwater pump-and-treat system will be designed, installed, and operated in
accordance with an approved remedial design/remedial action (RD/RA) work
plan. The system will be designed to capture and treat contaminated ground-
water to reduce the mass of carbon tetrachloride, total chromium (chromium III
and chromium VI), nitrate, trichloroethylene, iodine-129, and technetium-99,
throughout the 200-ZP-1 OU by a minimum of 95% in 25 years. The pump-and-
treat component will be designed and implemented in combination with monitored
natural attenuation to achieve cleanup levels … for all COCs in 125 years.
Carbon tetrachloride concentrations in the groundwater above 100 µg/L corre-
spond to approximately 95% of the mass of carbon tetrachloride currently
residing in the aquifer.
…
Natural attenuation processes to be relied on as part of this component include
abiotic degradation, dispersion, sorption, and, for tritium, natural radioactive
decay. Monitoring will be employed in accordance with the approved RD/RA
documents to evaluate the effectiveness of the pump-and-treat system and natural
attenuation processes. Fate and transport analyses conducted as part of the
[feasibility study] indicate that the timeframe necessary to reduce the remaining
COC concentrations to acceptable levels through MNA will be approximately 100

19
years. Modeling also indicates that this portion of the plume area will remain on
the Central Plateau geographic area during this timeframe.
…
The overarching requirement is to meet the groundwater cleanup levels identified
in this ROD within 125 years.

20
21
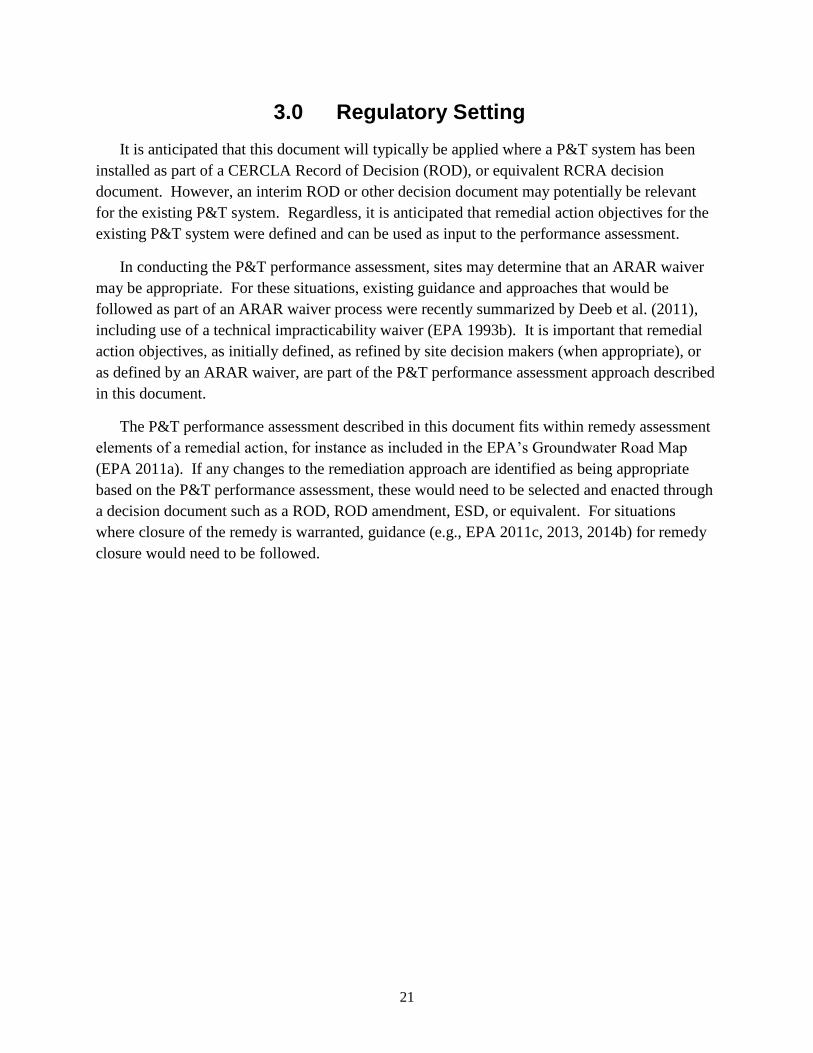
3.0 Regulatory Setting
It is anticipated that this document will typically be applied where a P&T system has been
installed as part of a CERCLA Record of Decision (ROD), or equivalent RCRA decision
document. However, an interim ROD or other decision document may potentially be relevant
for the existing P&T system. Regardless, it is anticipated that remedial action objectives for the
existing P&T system were defined and can be used as input to the performance assessment.
In conducting the P&T performance assessment, sites may determine that an ARAR waiver
may be appropriate. For these situations, existing guidance and approaches that would be
followed as part of an ARAR waiver process were recently summarized by Deeb et al. (2011),
including use of a technical impracticability waiver (EPA 1993b). It is important that remedial
action objectives, as initially defined, as refined by site decision makers (when appropriate), or
as defined by an ARAR waiver, are part of the P&T performance assessment approach described
in this document.
The P&T performance assessment described in this document fits within remedy assessment
elements of a remedial action, for instance as included in the EPA’s Groundwater Road Map
(EPA 2011a). If any changes to the remediation approach are identified as being appropriate
based on the P&T performance assessment, these would need to be selected and enacted through
a decision document such as a ROD, ROD amendment, ESD, or equivalent. For situations
where closure of the remedy is warranted, guidance (e.g., EPA 2011c, 2013, 2014b) for remedy
closure would need to be followed.

22

23
4.0 Performance Assessment Decision Logic
The performance assessment approach described in this P&T document is organized to use a
set of decision elements to help decision makers distinguish between several categories of
decision outcomes associated with transition, optimization, or closure of P&T systems. This
document is targeted at performance evaluation for P&T systems that have been operated for
enough time that their performance with respect to reaching RAOs can be assessed, and site
decision makers have determined that the performance needs to be evaluated.
The process includes revisiting the CSM, where it is important to consider the current nature
of the source and plume, as well as the aspects controlling contaminant transport and remedy
performance. However, to effectively support the P&T performance assessment and associated
remedy decisions, efforts for updating the CSM are focused on describing the site and current
conditions in terms of the decision elements described below. These decision elements are then
applied in a decision logic framework to facilitate determining the outcome that is best supported
by the performance assessment. Details of implementing this outcome can then be finalized
based on the site-specific conditions. As the P&T assessment progresses, indications of a
persistent plume may generate the need to conduct additional evaluations and refine the CSM
with respect to the factors causing plume persistence.
In applying the decision logic, a site may have more information about some decision
elements than for others. It is expected that decision elements will be used as lines-of-evidence,
similar to the balancing approach used in a CERCLA feasibility study. Thus, complete, detailed
information about all decision elements may not be needed for a site to effectively interpret the
performance assessment for selecting the most appropriate outcome. It is also important to
recognize that the decision outcome for the P&T performance assessment will be based on
available data and analysis that together provide a prediction of future performance for the
selected outcome in reaching the site RAOs. Like other remedy decisions, the outcome of the
P&T performance assessment would be implemented with ongoing verification that the expected
performance is being achieved (e.g., Case Study 2A).
The decision elements selected for use in the P&T performance assessment are introduced
below and described in more detail in Sections 5.0 and 6.0.
Contaminant concentrations and trends: These data are used to evaluate whether the
plume has declined during the P&T remedy and to provide input for use in the
subsequent decision element assessments.
Contaminant mass discharge (CMD) (mass/time): The CMD at a given location in a
plume (or at the source) is an indication of the amount of contaminant mass migrating
past that location over time. P&T system data can provide contaminant mass extracted
over time, which is an indicator of extraction efficiency. With knowledge of the natural
gradient at the site, the P&T data can be interpreted in terms of the CMD that would
occur from the capture zone if the P&T system operations were discontinued. This CMD
information is useful when assessing performance and future plume behavior using an

24
approach that examines the CMD in comparison to factors that relate to the downgradient
transport of the contaminants (e.g., the attenuation capacity, as described below and
shown conceptually in Figure 9). It is also important to consider the variation in contami-
nant concentrations within the plume or source upgradient of the CMD measurement
location. When there are steep concentration gradients or order of magnitude variation in
concentrations across the plume, concentration-based approaches may be more appropri-
ate than spatially averaged mass-based approaches to evaluate the downgradient transport
and attenuation (e.g., a threshold concentration approach as discussed in Section 6.2.1).
For example, it may be necessary to assess what happens with a high concentration core
of a plume, because that is the portion of the plume that will constrain assessment/
remediation (versus lower concentrations further from the plume core).
Figure 9. Conceptual depiction of the source flux zone being controlled by P&T and a
downgradient attenuation zone, whose extent must be determined by the site decision
makers. Under natural-gradient conditions, the CMD from the source zone (or
potentially an upgradient plume) must not be greater than the attenuation capacity in
the attenuation zone for the plume to stay within the limits defined by the site decision
makers (e.g., to potentially support a decision to transition to an MNA remedy).

25
Attenuation capacity (AC) of the aquifer: The AC is a way to quantify the ability of an
aquifer (or portion of an aquifer) to decrease contaminant concentration over time
without active remediation. There are multiple approaches to evaluate attenuation rates
and mechanisms in the aquifer. These rates and mechanisms are important as part of
assessing the role of natural attenuation during P&T or for transitioning P&T to MNA or
another remedy that includes the contribution of natural attenuation. The attenuation
capacity can be conceptually estimated as a decrease in contaminant mass over time
within a given volume of the aquifer (shown in Figure 9). Performance and future plume
behavior can be assessed by comparing this attenuation capacity to the CMD (described
above). In some cases, especially when there is a higher concentration plume core, it
may be more appropriate to represent the attenuation capacity as an attenuation rate
(change in concentration per time), using the threshold concentration approach (discussed
in Section 6.2.1) for evaluating the concentration emanating from the source zone plume
core.
Estimated future plume behavior and time to reach RAOs: Like any remedy decision, a
prediction of plume fate and transport and the time needed to reach the RAOs is an
important part of P&T performance assessment. The plume behavior under continued
P&T, MNA, or with application of other remedy components or alternative remedies
needs to be estimated. Key components of this decision element include evaluating
protectiveness (e.g., controlling exposure during remediation) and estimating the time to
reach the RAOs. For the plume behavior estimate, it is also important to consider the
controlling features at the site (e.g., matrix diffusion) or source conditions that may
contribute to extending the remediation timeframe. It is also important to consider the
uncertainty associated with estimating future plume behavior and time to reach RAOs
when using these estimates to support a remedy decision.
P&T system design, operational, and cost information: As part of the performance
assessment, information about the P&T design, operation, and cost are important to
consider for assessing whether optimization would help performance or for comparison
of P&T to other remediation alternatives.
The following categories of decision outcomes are included in the decision logic for the P&T
performance assessment. The outcome categories are introduced below and described in more
detail in Section 6.0.
Initiate P&T Remedy Closure: If the site conditions meet RAOs for the P&T system,
then an appropriate outcome of the analysis is to proceed with P&T remedy closure.
Criteria used to evaluate whether RAOs have been met may have been established in site
remedy decision documents. In some cases, a rebound study to assess concentration
trends with the P&T system off may be needed as part of assessing whether concentration
goals have been met. EPA provides guidance (e.g., EPA 2011c, 2013, 2014b) for the
remedy closure process.
Transition P&T to MNA: This outcome is for sites where P&T has changed plume
conditions such that RAOs can now be met with MNA.

26
Continue with Existing or Optimized P&T: If P&T has diminished the plume, it may be
appropriate to continue P&T or optimize the system and continue P&T, if it is practical to
meet RAOs. As time progresses, the P&T system may need to be re-evaluated with
respect to progress toward meeting the RAOs.
Supplement P&T with Other Treatment Technologies: This outcome may be appropriate
at sites where P&T has been inefficient or ineffective in progressing toward RAOs, but
where a specific plume condition or feature can be addressed by a supplementary
treatment (e.g., targeted treatment of a contaminant hot spot) such that RAOs can then be
met with this combined approach. At some sites, there may be site complexities that
need to be considered in evaluating a supplemented P&T approach (NRC 2013; ITRC
2015). In this case, the site may need to consider adaptive remedy approaches and means
to mitigate exposure while addressing contamination. It is also possible that, over time,
the supplemented P&T system may need to be re-evaluated with respect to progress
toward meeting the RAOs.
Transition to a New Remedy Approach: At sites where P&T has been inefficient or
ineffective in progressing toward RAOs, another remedy approach may be more cost
effective in reaching RAOs. At some sites, there may be site complexities that need to be
considered in selecting the new remedy approach (NRC 2013; ITRC 2015). In this case,
the site may need to consider adaptive remedy approaches and means to mitigate
exposure while addressing contamination.
The decision logic for the P&T performance assessment, incorporating the decision elements
and the decision outcomes, is presented in Figure 10. After updating the conceptual site model
and assessing whether RAOs have been met, the decision logic consists of several primary
assessments that distinguish between outcomes. The first assessment is based on whether the
plume has declined during P&T operations. If the plume has declined, then an assessment of
whether MNA is warranted is conducted. If MNA is not appropriate, then the logic points to
evaluating continued/optimized P&T. For plumes that have not declined during P&T or for
situations where the plume has declined but RAOs cannot be practically reached with P&T or
MNA, the decision logic points to evaluation of other approaches. In this case, the decision logic
specifies evaluating technologies to supplement P&T or switching to a remedy approach based
on a different technology to address factors inhibiting remediation. Site decision makers may
also consider ARAR waivers or revisiting RAOs (e.g., using approaches to define objectives as
described in the Integrated DNAPL Site Strategy document [ITRC 2011b]) depending on the
conditions driving the need for an alternative remedy approach to P&T.
To support the decision logic presented in Figure 10, Section 5.0 provides information on
updating the CSM and gathering information on the decision elements. Section 6.0 describes the
performance assessment approach to facilitate selecting an appropriate outcome based on the
decision logic. Also in Section 6.0, the tools and approaches introduced in Section 5.0 are
mapped to elements of the decision logic flow chart, as are case studies illustrating each category
of outcome.

27
Figure 10. Decision logic flow chart.


29
5.0 Conceptual Site Model Update and Approaches for Obtaining Decision Element Information
The fundamental site information in a conceptual site model includes descriptions of the
geology, hydrology, contaminant distribution, and remedy configuration. However, to support
remedy decisions such as optimization, transition, or closure of a P&T system, the CSM should
include quantitative information about the decision elements identified in Section 4.0. To
support P&T performance assessment, the CSM should be updated at the time of the assessment
using available characterization, plume monitoring, and P&T operational data. An important
aspect of updating the CSM is inclusion of trend data that are available from the period of P&T
remediation. The trend data will help define the plume behavior and related conceptual site
model elements. Section 5.1 reviews the type of fundamental site information that provides the
foundation for the CSM. Section 5.2 then describes collection and analysis of data in support of
each decision element.
Because site characteristics and remedy situations vary, some decision elements may not be
important for a given site. Site decision makers will need to determine the appropriate level of
detail needed for updating the CSM to support the P&T assessment.
5.1 Fundamental Site Information
The following information provides the foundation for the CSM at a site.
Overview of the site plume and remedy configuration
Description of the subsurface hydrogeology
Description of the groundwater flow field (with and without the P&T system operating)
Description of the source, plume, and known controlling features, events, and processes
affecting the contamination
5.1.1 Site Overview and Context of the Plume and Remedy Configuration
An overview figure depicting the site plume and the remedy is useful as a starting point to
provide context for displaying and discussing additional, more detailed information. Figure 11
shows an example of a site plume and remedy overview from the Joint Base Lewis McChord
Logistics Center site. The overview information should also include an assessment of land use
and other factors that need to be considered in the remedy, such as groundwater use in the
vicinity (e.g., off-site pumping wells), surface water discharge concerns, or other adjacent soil or
groundwater remediation activities.

30
Figure 11. Example depiction of a site plume and remedy overview from Joint Base Lewis
McChord.
5.1.2 Describe the Subsurface Hydrogeology
Cross sectional and plan views of hydrogeologic features related to plume migration and
regional groundwater flow should be prepared. A key focus should be on features controlling
plume migration and performance of the remedy. Thus, descriptions at a regional, plume-scale,
and/or local-scale may be appropriate. For instance, some sites may benefit from high resolution
characterization techniques (e.g., https://clu-in.org/) because features at a small scale are exerting
significant control of plume behavior. Plume behavior at other sites may be suitably described
based on larger-scale information. The purpose of this information is to provide the spatial
context of the groundwater flow system in relation to plume behavior and P&T impacts. Figures
12 through 14 show example cross sections from the Joint Base Lewis McChord Logistics
Center site that progress from interpreted hydrogeology (Figure 12), to representation of the
hydrogeology in a numerical model (Figure 13), to a localized hydrologic cross section overlain
with observed contaminant data (Figure 14).

31
Figure 12. Conceptual geologic cross section approximately along the centerline of the plume in
the Vashon Aquifer (from Truex et al. [2006]; adapted from Borden and Troost
[2001]). For the cross section, white areas (Qv, Qpog, Qpog2) correspond to
outwash gravels, the grey area is low-permeability glaciolacustrine sediment, the
dark area (Qob) is Olympia bed material, the hashed areas (Qpon and Qpon2) are
non-glacial aquitard materials, and the areas with the “v” symbol pattern
correspond to low permeability till material.

32
Figure 13. Annotated numerical model cross section along the nominal axis of the contaminant plume in the Vashon Aquifer located
above the Qpon Aquitard (adapted from Truex et al. [2006]). Blue arrows show the groundwater flow direction (to the left
towards American Lake in the Vashon Aquifer; down through the Window, then out of the page in the Sea Level Aquifer).
The red box shows the nominal are of the cross section shown in Figure 14.

33
Figure 14. Localized cross section (corresponding to the red box on Figure 13) of the nominal
hydrogeology along the Vashon Aquifer plume centerline near the I-5 P&T system
and the window to the lower Sea Level Aquifer (SLA) (adapted from Truex and
Johnson [2013]). Labeled points indicate wells projected onto the cross section and
the associated average 2012 TCE concentration in µg/L at that well.
5.1.3 Describe the Hydraulic Head Distribution with and without P&T Operating
Hydraulic head data at regional, plume, and local scales, particularly in the vicinity of the
P&T system(s), should be displayed and contoured (as possible) to identify groundwater flow
gradient magnitude and direction. Data with and without the P&T system operating is important.
Vertical hydraulic gradients may be important to consider for some sites. If data prior to the
P&T system operation are not available, a period of P&T shutdown could be considered to
obtain natural hydraulic gradient information. This type of shutdown would need to be
coordinated with regulatory agencies because it may take weeks or longer for water levels to
recover to a pseudo-equilibrium following extended pumping periods. Note, though, that at most
sites, the rates of migration may be slow enough that the plume configuration would not change
appreciably in a matter of several weeks while the P&T system was shut down. At some sites,
temporal or seasonal variation in hydraulic conditions (which may be a result of nearby pumping
or river fluctuation, amongst other things) may also be important. The purpose of this natural
hydraulic gradient information is to provide a baseline for evaluation of the groundwater flow
component of contaminant mass discharge and/or contaminant attenuation capacity. Figures 15
and 16 show examples of the hydraulic head distribution from the Joint Base Lewis McChord
Logistics Center site.

34
Figure 15. General flow path (red dashed arrow) of contamination in the Sea Level Aquifer (SLA) from the window toward Puget
Sound. Contour lines are hydraulic head under natural gradient conditions (adapted from Truex et al. [2006] and
Dinicola [2005]).

35
Figure 16. Representative 2004 hydraulic head data (feet relative to mean sea level) for wells
projected onto the cross section along the Vashon plume centerline near the I-5 P&T
system and the window to the lower Sea Level Aquifer (SLA) (adapted from Truex and
Johnson [2013]). Annotations and magenta arrows describe the interpretation of
groundwater flow paths and contaminant plume behavior.
5.1.4 Describe the Source, Plume, and Known Controlling Features, Events, and Processes
As a refinement of the overview of the site plume and remedy configuration (Section 5.1.1),
the fundamental site information should culminate in a CSM depiction of the source, plume, and
known controlling features, events, and processes. At every site, multiple factors collectively
control the groundwater flow and associated contaminant plume behavior. A high-level descrip-
tion of the important system components is a key communication tool that helps describe a
systematic understanding of the site and factors affecting contaminant fate and transport. In
addition, this type of conceptual site model is a starting point from which more detailed aspects
of the conceptual site model can be identified and put into context. Figures 17 and 18 from The
Scenarios Approach to Attenuation Based Remedies for Inorganic and Radionuclide Contami-
nants (Truex et al. 2011) provide some examples of system-level conceptual site model
depictions.

36
Figure 17. Example initial site depiction (a) identifying the major elements of the site (defined as source
components and plume segments) that will need to be evaluated as part of contaminant fate/transport
assessment and remediation design, (b) considering contaminant fluxes and conditions that will affect
contaminant fate and transport, and (c) identifying reaction, sorption, or solubility control processes
with contaminants (which can be helpful in describing the conceptual site model and controlling
features and processes relevant to contaminant transport at the site) (adapted from Truex et al.
[2011]). In some cases, changes in conditions are expected at the site. When a change occurs, there
is a “gradient” between the existing conditions and the future conditions that may be important to
evaluate and monitor (e.g., as shown in (b)).
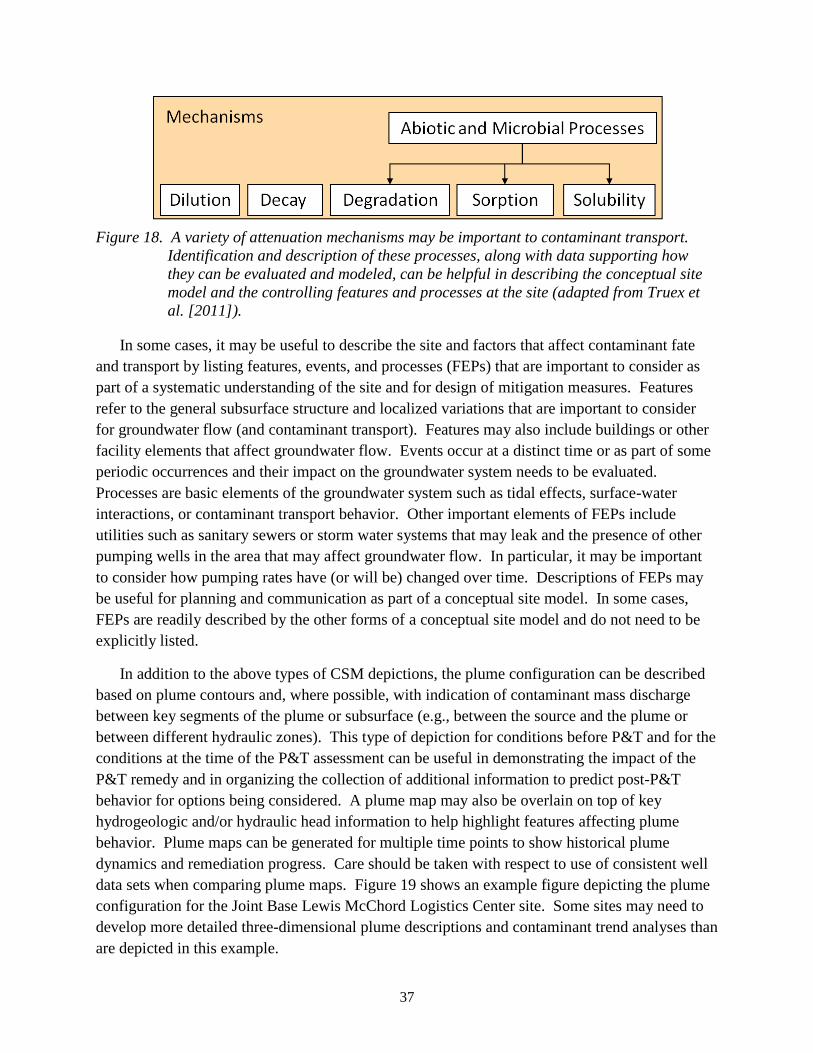
37
Figure 18. A variety of attenuation mechanisms may be important to contaminant transport.
Identification and description of these processes, along with data supporting how
they can be evaluated and modeled, can be helpful in describing the conceptual site
model and the controlling features and processes at the site (adapted from Truex et
al. [2011]).
In some cases, it may be useful to describe the site and factors that affect contaminant fate
and transport by listing features, events, and processes (FEPs) that are important to consider as
part of a systematic understanding of the site and for design of mitigation measures. Features
refer to the general subsurface structure and localized variations that are important to consider
for groundwater flow (and contaminant transport). Features may also include buildings or other
facility elements that affect groundwater flow. Events occur at a distinct time or as part of some
periodic occurrences and their impact on the groundwater system needs to be evaluated.
Processes are basic elements of the groundwater system such as tidal effects, surface-water
interactions, or contaminant transport behavior. Other important elements of FEPs include
utilities such as sanitary sewers or storm water systems that may leak and the presence of other
pumping wells in the area that may affect groundwater flow. In particular, it may be important
to consider how pumping rates have (or will be) changed over time. Descriptions of FEPs may
be useful for planning and communication as part of a conceptual site model. In some cases,
FEPs are readily described by the other forms of a conceptual site model and do not need to be
explicitly listed.
In addition to the above types of CSM depictions, the plume configuration can be described
based on plume contours and, where possible, with indication of contaminant mass discharge
between key segments of the plume or subsurface (e.g., between the source and the plume or
between different hydraulic zones). This type of depiction for conditions before P&T and for the
conditions at the time of the P&T assessment can be useful in demonstrating the impact of the
P&T remedy and in organizing the collection of additional information to predict post-P&T
behavior for options being considered. A plume map may also be overlain on top of key
hydrogeologic and/or hydraulic head information to help highlight features affecting plume
behavior. Plume maps can be generated for multiple time points to show historical plume
dynamics and remediation progress. Care should be taken with respect to use of consistent well
data sets when comparing plume maps. Figure 19 shows an example figure depicting the plume
configuration for the Joint Base Lewis McChord Logistics Center site. Some sites may need to
develop more detailed three-dimensional plume descriptions and contaminant trend analyses than
are depicted in this example.

38
Figure 19. Example of the Joint Base Lewis McChord plume system with interpretation of flow
paths, TCE contaminant concentrations, and CMD for conditions prior to P&T
operations. Black bars represent the location of P&T systems. General plume
configuration and key features such as the “window” between the Vashon and Sea
Level Aquifers are also shown on Figures 11, 13, and 15.
5.2 Decision Element Information
The following decision element information for the CSM is discussed in this section.
Quantitative description of the plume contaminant concentration distribution and trends
Contaminant mass discharge estimates for key locations in the plume system (including
the P&T system location[s])
Estimates for contaminant attenuation and the aquifer attenuation capacity
Estimated future plume behavior and time to reach RAOs
P&T system design, performance, and cost information

39
5.2.1 Contaminant Concentrations and Trends
Contaminant concentration distribution and trend data are used to evaluate whether the plume
has declined during the P&T remedy and to provide input for use in the subsequent decision
element assessments. Overall plume descriptions as discussed in Section 5.1 (and more
specifically in Section 5.1.4) provide a context for evaluating the plume contaminant
concentration distribution and trends using plume maps. These plume maps provide a visual
depiction of plume behavior and, with comparison of plume maps over time, can provide
information on overall trends (e.g., Figure 20). Plume-scale contamination changes can be
quantified using a mass-based assessment, as described in EPA (2002b). In addition, trends at
individual wells or along transects of plume movement are also useful to quantify plume changes
over time. The information gathered for contaminant concentrations and trends needs to provide
a basis for assessing whether or not the overall plume has declined during the P&T remedy.
However, it may also be useful to examine segments of the plume to determine if there are
segments that are recalcitrant to the P&T remedy (i.e., resulting in a persistent plume or plume
segment). Some sites may need to develop more detailed three-dimensional plume descriptions
and contaminant trend analyses using high-resolution characterization and monitoring.

40
Figure 20. Interpolation of TCE concentration data (µg/L) in the Vashon Aquifer at Joint Base
Lewis McChord for 2007 (top) and 2012 (bottom) (adapted from Truex and Johnson
[2013]). Source Control P&T at Landfill 2 was initiated in 2006.

41
5.2.2 Contaminant Mass Discharge
The CMD at a given location in a plume (or at the source) is an indication of the amount of
contaminant mass migrating past that location over time. ITRC (2010a) provides a thorough
discussion of CMD and can serve as a resource for this portion of the P&T performance
assessment. The P&T system data can provide contaminant mass extracted over time, which is
an indicator of extraction efficiency and can be interpreted in terms of the CMD that would occur
from the capture zone if the P&T system were terminated. The CMD information is useful when
assessing performance and future plume behavior using a mass balance approach (e.g., ITRC
2008) that examines the CMD in comparison to factors relating to the downgradient transport of
the contaminants (e.g., the attenuation capacity, described below).
For any pumping well (or group of pumped wells), CMD at the well is readily calculated
from measured extraction flow rate and concentration data. This CMD is a measure of the CMD
in the aquifer within the capture zone of the well (or well system), as depicted in Figure 21.
Thus, standard data collected for a P&T system can be translated into a measure of CMD in the
captured portion of the aquifer. Using data collected over time, the changes in CMD over time
can be determined. Figure 22 shows example data for CMD of a source control P&T system
depicting the impact of a source reduction treatment technology applied in the source zone. The
P&T system CMD is a reasonable estimate of CMD in the aquifer within the capture zone.
However, if the CMD is to be used for estimates of post-P&T plume behavior, then this CMD
from the P&T system must be scaled based on the ratio of the groundwater flow through the
capture zone during P&T operations to the flow under natural-gradient conditions. Interpretation
of CMD computed for plume reduction P&T systems may be more complex than for source
control or plume containment P&T systems because of the (typical) significant change in flow
direction between pumping conditions versus natural flow conditions.
Figure 21. Representation of a plume captured at a pumping well. Here, contaminant concen-
tration multiplied by the extraction flow rate at the well would provide a measure of
the contaminant mass discharge for the capture zone (adapted from ITRC [2010a]).

42
Figure 22. Concentrations at (A) individual P&T wells (PW-#) over time and (B) grouped by
individual well for each year. Also shown is a plot (C) of total system CMD for times
when coincident flow and concentration data were available.

43
The distribution of CMD between wells, in conjunction with knowledge of the upgradient
capture for individual wells within the P&T system, may be useful in identifying zones of more
significant source or the location of plume cores. For instance, in Figure 22, the most significant
remaining source is within the capture zone of wells PW-1, PW-2 and PW-3. This information
may be combined with upgradient monitoring well data to further refine conditions upgradient of
the P&T system. The CMD is a volume-averaged measurement of the plume or source
upgradient of the measurement location. It is also important to consider the concentration profile
across the plume or within the source upgradient of the CMD measurement location. When
concentrations are highly variable, concentration-based approaches to evaluate the downgradient
transport and attenuation may be more appropriate than spatially averaged mass-based
approaches (e.g., a threshold concentration approach as discussed in Section 6.2.1). Thus, when
collecting CMD information, concentration profile information should also be collected.
CMD (i.e., mass flux) data from transects of monitoring wells perpendicular to the direction
of flow (Figure 23) can be computed from concentration data and groundwater flow data (e.g., as
interpreted from hydraulic head data). In addition, passive flux meters (ITRC 2010a) can be
employed in a transect of monitoring wells perpendicular to the direction of plume movement to
estimate the vertical and lateral distribution and magnitude of contaminant mass flux across the
plane represented by the transect of wells. Figure 24 depicts the concept of how passive flux
meter data is interpreted as an estimate of the actual mass flux across the transect. A transect of
monitoring wells perpendicular to the direction of plume movement can also be used to conduct
an integrated pumping test (Figure 25). The integrated pump test analyzes the observed
concentration data over the duration of the test to determine contaminant mass flux and average
concentration in the plume at that transect. Note that the P&T system wells can be used for the
above CMD determination if pumping is suspended for a period of time or applied as described
for the integrated pump test. Note that all of these techniques may be more difficult to apply for
highly heterogeneous sites, such as those with fractured flow.
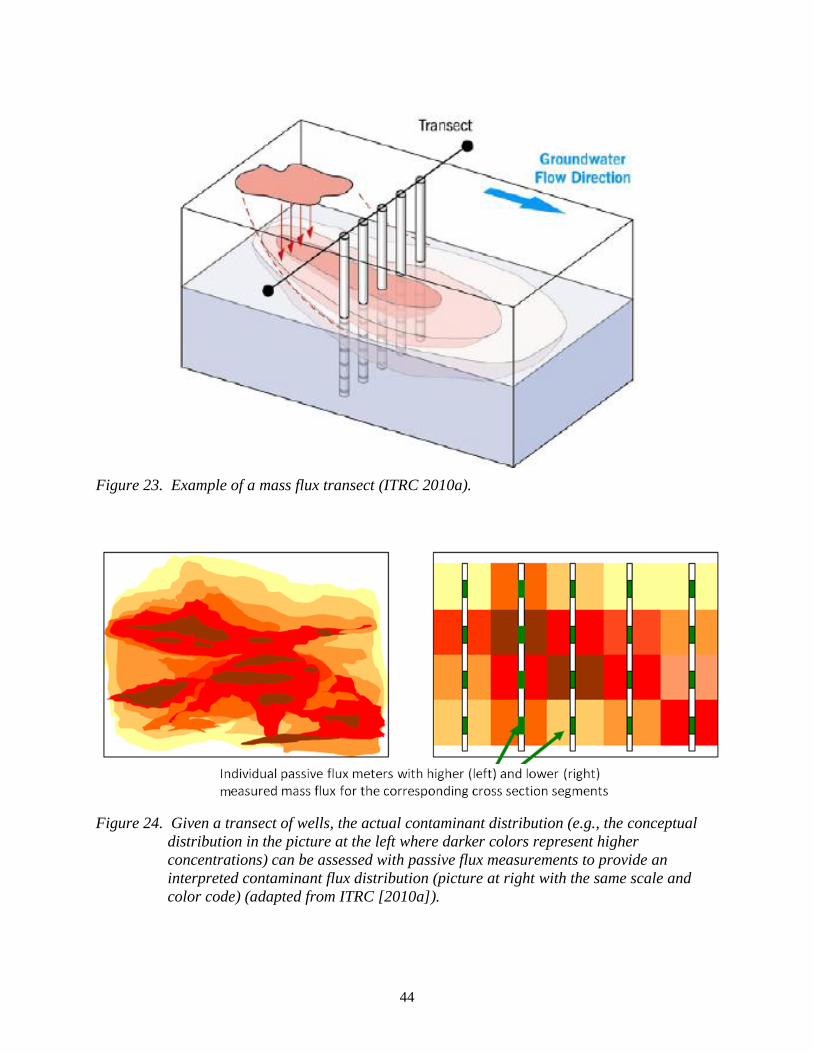
44
Figure 23. Example of a mass flux transect (ITRC 2010a).
Figure 24. Given a transect of wells, the actual contaminant distribution (e.g., the conceptual
distribution in the picture at the left where darker colors represent higher
concentrations) can be assessed with passive flux measurements to provide an
interpreted contaminant flux distribution (picture at right with the same scale and
color code) (adapted from ITRC [2010a]).

45
Figure 25. Elements of an integrated pump test in which concentration data from a transect of
wells perpendicular to the plume flow direction is analyzed to determine contaminant
mass flux and average concentration at the transect (ITRC 2010a).
If the P&T system can be turned off temporarily, the P&T wells and monitoring wells in the
vicinity may be suitable for field measurements to estimate a post-P&T CMD. The cessation of
P&T operations need only be a temporary action of sufficient duration to collect the data of
interest. The data under natural conditions would be important for assessing termination of P&T
and the potential transition to a different treatment technology. During the non-operational
period, concentration data from monitoring wells can be observed over time to determine the
magnitude of any concentration rebound. The water discharge component may be known from
initial site characterization and modeling or could be evaluated by measuring the hydraulic
gradient in the vicinity of the P&T system with the P&T system off. The hydraulic gradient can
be used with estimates of hydraulic conductivity to estimate the water discharge through the
P&T location. With the P&T system off, contaminant concentrations at the P&T wells and
appropriate monitoring wells in the vicinity can be collected to evaluate the concentration
component of the CMD. Note that the water level rebound that occurs with the P&T system off
may allow contact between ground water and “stranded” contaminant in the previously
dewatered soil, which may affect observed concentrations.
The above field measurements of CMD can also be augmented with numerical contaminant
transport modeling, if available for the site. The CMD at locations of interest can be readily
extracted from numerical model results and used as an estimate for the CMD decision element.
Numerical modeling would enable estimates of CMD under both pumping and non-pumping
conditions. The numerical model could also be used to supply an estimate for just the
groundwater flow component of the CMD evaluation. This estimate could then be combined
with measured concentration data to estimate the CMD at the selected location.

46
5.2.3 Natural Attenuation Capacity
There are multiple approaches to evaluate attenuation rates and mechanisms in the aquifer.
These are important as part of assessing the role of natural attenuation during P&T or for
transitioning P&T to MNA or another remedy that includes the contribution of natural
attenuation. For assessing performance and future plume behavior using a mass balance
approach (e.g., ITRC 2008), attenuation capacity can be estimated as a decrease in contaminant
mass over time within a given volume of the aquifer for comparison to the CMD (Section 5.2.2).
The attenuation capacity is a volumetric assessment and is conceptually useful in evaluating
when natural attenuation may be sufficient to meet RAOs. In some cases, especially when there
is a higher concentration plume core, use of an attenuation rate (change in concentration per
time) with comparison to the concentration emanating from the source zone plume core should
also be considered in evaluating the ability to meet concentration-based RAOs (e.g., a threshold
concentration approach as discussed in Section 6.2.1).
Attenuation capacity is the degree to which natural attenuation process can reduce
contaminant plume concentrations to the remedial goals within spatial and time constraints. The
natural attenuation processes providing the attenuation capacity comprise all of the processes that
diminish plume concentrations along a flow path, including dispersion, sorption, and
biogeochemical reactions. These reactions can include biologically mediated transformation of
contaminants, or abiotic processes such as contact with reactive minerals (e.g., magnetite for
chlorinated compounds [EPA 2009a]) or hydrolysis.
Existing guidance documents (e.g., EPA 1998, 1999c, 2002b, 2003, 2004, 2007c, 2007d,
2010, 2011b; ITRC 1999a, 1999b, 2008, 2010b; USGS 2003; Wiedemeier et al. 1999) provide
information on the approaches for assessing natural attenuation at a site. A variety of metrics
can be employed to assess attenuation and provide lines of evidence for the attenuation capacity
of the aquifer. These metrics include rate assessments, measurement of specific attenuation
processes, and assessment of contaminant fate and transport. Components contributing to the
attenuation capacity can be evaluated using measurements that target specific processes.
Examples of these measurements are laboratory evaluations with site sediments and
groundwater, environmental molecular diagnostics (EMD), and push-pull tests. Information
about options for evaluating the attenuation capacity associated with specific processes is
available in multiple published documents (e.g., EPA 2004, 2011b; ITRC 2011a, 2013; Gilmore
et al. 2006).
Attenuation rates can be computed in different ways and each provides slightly different
information about contaminant attenuation (EPA 2002b; Figure 26). A point attenuation rate is
based on contaminant concentrations at a single monitoring location over time and primarily
imparts information about the duration of the plume (i.e., time required to meet remedial goals).
However, point attenuation rates for multiple wells across the plume can be useful to assess the
overall plume attenuation. A bulk attenuation rate can be calculated from concentration versus
distance data (typically for a transect of wells extending from the source to a downgradient
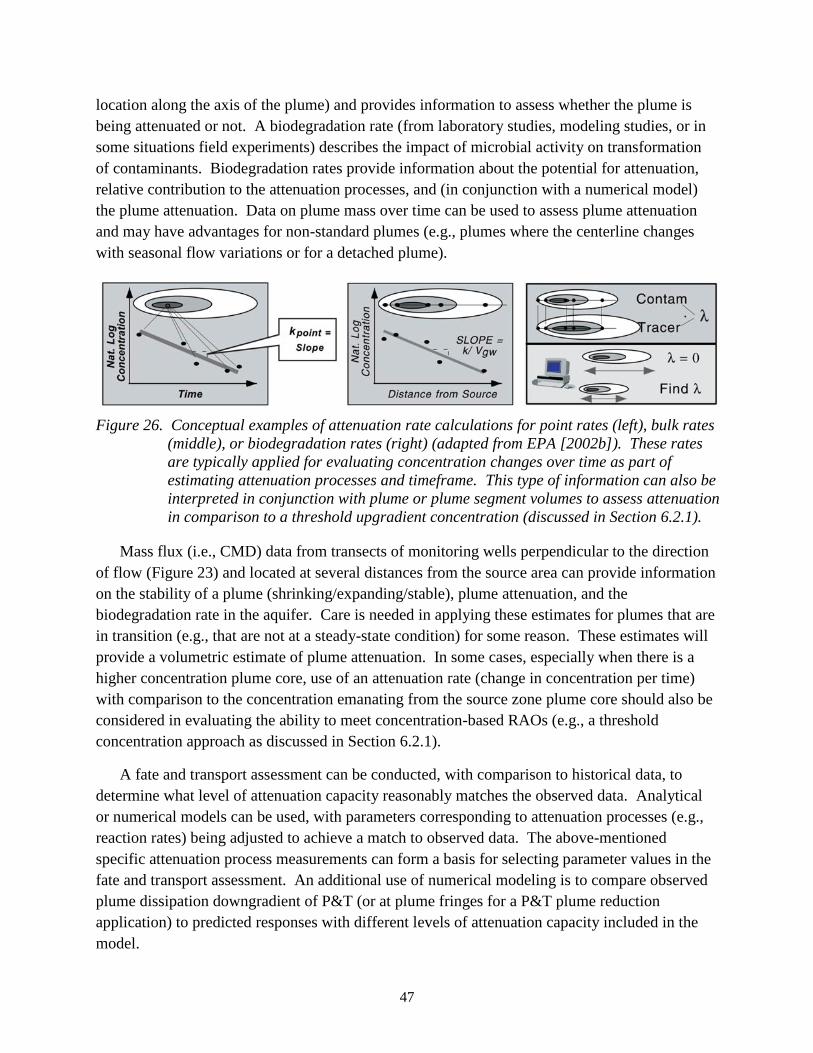
47
location along the axis of the plume) and provides information to assess whether the plume is
being attenuated or not. A biodegradation rate (from laboratory studies, modeling studies, or in
some situations field experiments) describes the impact of microbial activity on transformation
of contaminants. Biodegradation rates provide information about the potential for attenuation,
relative contribution to the attenuation processes, and (in conjunction with a numerical model)
the plume attenuation. Data on plume mass over time can be used to assess plume attenuation
and may have advantages for non-standard plumes (e.g., plumes where the centerline changes
with seasonal flow variations or for a detached plume).
Figure 26. Conceptual examples of attenuation rate calculations for point rates (left), bulk rates
(middle), or biodegradation rates (right) (adapted from EPA [2002b]). These rates
are typically applied for evaluating concentration changes over time as part of
estimating attenuation processes and timeframe. This type of information can also be
interpreted in conjunction with plume or plume segment volumes to assess attenuation
in comparison to a threshold upgradient concentration (discussed in Section 6.2.1).
Mass flux (i.e., CMD) data from transects of monitoring wells perpendicular to the direction
of flow (Figure 23) and located at several distances from the source area can provide information
on the stability of a plume (shrinking/expanding/stable), plume attenuation, and the
biodegradation rate in the aquifer. Care is needed in applying these estimates for plumes that are
in transition (e.g., that are not at a steady-state condition) for some reason. These estimates will
provide a volumetric estimate of plume attenuation. In some cases, especially when there is a
higher concentration plume core, use of an attenuation rate (change in concentration per time)
with comparison to the concentration emanating from the source zone plume core should also be
considered in evaluating the ability to meet concentration-based RAOs (e.g., a threshold
concentration approach as discussed in Section 6.2.1).
A fate and transport assessment can be conducted, with comparison to historical data, to
determine what level of attenuation capacity reasonably matches the observed data. Analytical
or numerical models can be used, with parameters corresponding to attenuation processes (e.g.,
reaction rates) being adjusted to achieve a match to observed data. The above-mentioned
specific attenuation process measurements can form a basis for selecting parameter values in the
fate and transport assessment. An additional use of numerical modeling is to compare observed
plume dissipation downgradient of P&T (or at plume fringes for a P&T plume reduction
application) to predicted responses with different levels of attenuation capacity included in the
model.

48
If the P&T system can be turned off temporarily, the P&T wells and monitoring wells in the
vicinity may be suitable for field measurements to estimate contaminant rebound and subsequent
plume behavior as input to assessment of natural attenuation. The cessation of P&T operations
would need to be of sufficient duration to collect the data of interest. Thus, this type of
shutdown would need to be coordinated with regulatory agencies.
Example calculations of attenuation capacity for use in comparison to CMD as part of the
performance assessment approach are provided in Section 6. In Section 6, these examples are
presented in the context of applying the performance assessment decision logic.
5.2.4 Estimates of Plume Behavior and Time to Reach RAOs
Like any remedy decision, a prediction of plume behavior and the time needed to reach the
RAOs is an important part of a P&T remedy assessment. The estimated plume behavior under
continued P&T, MNA, or with application of other remedy components or alternative remedies
needs to be estimated. Key components are evaluating protectiveness (e.g., controlling exposure
during remediation) and estimating the time to reach the RAOs. In estimating the remediation
timeframe, consideration of whether this timeframe is reasonable is important in evaluating
remedy performance and in assessing whether the site has complexities that cause difficulties
with remediation that need to be considered in developing the remediation strategies (NRC 2013;
ITRC 2015; Hawley et al. 2014). For the plume behavior estimate, it is also important to
consider the controlling features at the site (e.g., matrix diffusion) or the source conditions that
may contribute to extending the remediation timeframe. The decision makers at each site will
need to determine how to define a reasonable time for remediation based on the site-specific
circumstances.
Key input to the plume behavior estimate will be the data on plume behavior collected during
P&T operations. The rate of plume decline within the capture zone can be used to assess
expectations for continued decline with P&T and/or to identify areas of recalcitrance in plume
concentrations. Here, plume maps over time and concentration trends at diagnostic wells can be
used for the assessment. In addition, the change in CMD over time at P&T system wells or at
flux measurement points may also be useful. The rate of plume decline downgradient of a P&T
capture zone is also instructive in similar ways by using an assessment of whether the plume is
diminishing as expected or whether there are areas that remain recalcitrant. Because of the
impact of P&T on groundwater flow patterns, interpretation of plume behavior and concentration
distributions may be facilitated by conducting a contaminant rebound test. In this approach, the
P&T system is shut down for a period of time so that concentrations in the plume under natural
gradient conditions can be better assessed (e.g., Case Studies 1, 2A, and 2B).
For some portions of the performance assessment, it will be important to estimate future
plume behavior with a reconfigured P&T system or with application of other treatment/remedy
options. To support this assessment, an approach to estimating plume behavior and remedy

49
performance, such as that used in a screening-level or remedy-alternative-analysis-level
performance assessment for a feasibility study process, is recommended (EPA 1988, 1993a).
A fate and transport assessment, with comparison to historical data, may be a key tool to
evaluate protectiveness and estimate the time to reach the RAOs to support remedial decisions.
Analytical or numerical models, such as REMChlor (Falta 2008), BIOCHLOR (EPA 2000b;
Aziz et al. 2002), BIOSCREEN (EPA 1996b), NAS (Widdowson et al. 2005), MT3D/RT3D
(Harbaugh 2005; Clement et al. 1998; Johnson et al. 2006), STOMP/eSTOMP (White et al.
2015a, 2015b), and ASCEM (DOE 2015), can be used with estimates of transport and
attenuation parameters to assess remedy performance. Because models can have limitations in
how system features can be represented and there are often uncertainties in the nature of the
subsurface, it may be important to use a sensitivity analysis based on reasonable variations in
input parameters to assess the range of potential future plume behavior and timeframes to reach
the RAOs. Uncertainty may come from limited knowledge about preferential groundwater flow,
residual NAPL dissolution, matrix diffusion, etc. The fate and transport assessment using
available tools provides a basis for decision making, though site decision makers should update
the estimates of plume behavior and timeframes as conditions change and/or more data is
collected.
5.2.5 P&T Design and Operational Information
As part of the performance assessment, information about the P&T design, operation, and
cost are important to consider. Such information is useful for assessing whether optimization
would help performance or for comparison of P&T to other remediation alternatives. Thus, the
P&T design and operational approach are important aspects of the CSM. It is also important to
define both the benefits being provided by the P&T system and any potential detrimental impacts
of the P&T system (e.g., issues with secondary wastes or the induced hydraulic gradients with
respect to plume behavior). This information is important in terms of evaluating the costs,
benefits, and impacts of the current remedy design to support the P&T system performance
assessment.
The locations of well screen intervals should be identified relative to the geological
stratigraphy and hydrology information. Figure 27 shows an example for the Joint Base Lewis
McChord Logistics Center site where P&T well screen locations are identified on a cross section,
along with stratigraphy and contaminant data. The impact of the P&T system on the hydraulic
head distribution and an understanding of the capture zone are also important elements of the
CSM. A capture zone analysis (EPA 2008) provides information about both how the
groundwater extraction (and any associated groundwater infiltration/injection) affects the
groundwater flow in the aquifer and the extent of the capture zone. This information can be
overlaid with contaminant data to assess the effectiveness of the treatment system and can be
used to update fate and transport models, as appropriate. As an example, Figure 28 depicts the
capture zone extent and resulting hydraulic head contours for a P&T system at the Joint Base
Lewis McChord Logistics Center site.

50
Figure 27. Example geologic cross section and contaminant data for a P&T well system
segment at Joint Base Lewis McChord (Truex et al. 2008).

51
Figure 28. Example of modeling results for a P&T system at defined pumping rates, showing (A)
calculated hydraulic head contours and (B) the extent of a one-year capture zone, as
determined from backwards particle tracking at different layers/elevations (adapted
from Truex et al. [2008]). The “no-well” pathlines show flow paths without pumping.

52
Where a remedy already includes a combination of P&T and other in situ treatment
technologies, the nature of the treatment and how the overall system is designed to meet
remediation goals needs to be included as part of the CSM.
Operational and cost information is best compiled using the approaches for conducting
feasibility studies (EPA 1988, 1993a). This type of format provides a useful structure for the
information and facilitates comparison with similar data for other remediation alternatives that
may be assessed as part of the P&T performance assessment process (Section 4.0 and 6.0).
To support assessment of P&T systems, especially in comparison to other options, a listing of
benefits and detrimental effects should be developed. Benefits may include items such as
effective plume or source containment, plume reduction, beneficial use of extracted water, robust
aboveground operational performance, or complementary performance with other technology
elements of a remedy. Detrimental effects may include items such as difficult secondary waste
handling and disposal, high energy and operational costs, poor sustainability performance, poor
aboveground operational performance, hydraulic gradients that induce accelerated downgradient
contaminant migration (e.g., stretching out a plume toward a downgradient P&T system), or
injection well/gallery fouling.

53
6.0 P&T Remedy Assessment
As discussed in Section 4.0, the P&T performance assessment is organized to use a set of
decision elements to help decision makers distinguish between several categories of decision
outcomes associated with transition, optimization, or closure of P&T systems. Using the CSM
update and information about the decision elements, as described in Section 5.0, the structured
approach for the P&T performance assessment using the decision logic described in Section 4.0
(Figure 10) is elaborated upon in this section. In essence, this approach is based on collecting a
weight of evidence to identify the most appropriate outcome for a site. Table 1 provides an
overview of how decision element evidence maps to each outcome. The remainder of this
section provides a description of the recommended steps of the P&T performance assessment,
starting after the site has revisited the CSM and gathered initial supporting information for this
assessment.
The P&T performance assessment presented in this section follows the decision logic using
sub-sections as depicted on Figure 29. The steps of the assessment include the following
elements.
Perform an initial evaluation of plume conditions with respect to RAOs (Section 6.1).
If the plume has not met RAOs, but has declined during P&T, the assessment focuses on
whether MNA or continued P&T will meet RAOs (Section 6.2).
For persistent plumes, that is, plumes that have not declined during P&T or plumes that
have declined but will not meet RAOs with P&T or MNA within a reasonable time, the
ability of alternative approaches to meet RAOs needs to be assessed (Section 6.3).
Based on potential alternative approaches from Section 6.3, a process such as a feasibility
study is needed to support a remedy decision associated with the performance
assessment. Selection of the preferred alternative is described in Section 6.4.
Case study examples illustrating components of the performance assessment and each
outcome are included in the sub-sections. Full descriptions of the case studies are provided in
Appendix A.

54
Table 1. Summary of Decision Criteria and Outcomes
Decision Element
Outcomes and Associated Criteria
P&T Closure
MNA Continue/Optimize P&T Supplement P&T New Remedy Approach
Contaminant Concentrations (C)
C < goal C > goal and
concentration has declined
C > goal but is expected to decline w/
continued/optimized P&T C > goal C > goal
Contaminant Mass Discharge (CMD) and Source/Plume
Characteristics
NA CMD has declined
CMD < AC
CMD > AC CMD expected to decline w/
continued/optimized P&T
CMD > AC CMD expected to decline with supplemented P&T
CMD > AC CMD expected to decline
with new remedy approach
Attenuation Capacity (AC)
NA
Documentation of significant attenuation
mechanisms
Attenuation mechanisms may not be significant. If they are, MNA may be a component of the remedy
with P&T.
Attenuation mechanisms may not be significant. If they are, MNA may be a
component of remedy with supplemented P&T.
Attenuation mechanisms may not be significant. If they are, MNA may be a
component of a new remedy.
Plume Behavior and Time to RAOs
NA
Plume is expected to stay within an area
with control of exposure pathways and stabilize/decline within a reasonable time to reach RAOs
Plume is expected to decline w/
continued/optimized P&T
Supplementing P&T will enable RAOs to be
reached
A new remedy approach is needed to meet RAOs
P&T System Design, Performance, and
Cost NA NA
Continued/optimized P&T can meet RAOs, balance
time with cost for comparing to other approaches
P&T alone has difficulty in meeting RAOs, balance
time with cost for comparing to other
approaches
P&T has difficulty in meeting RAOs and costs are better for a new remedy approach
NA = Not applicable

55
Figure 29. Decision logic, Section 6.0 cross-references, and cross-reference of outcomes and case studies.

56
6.1 Assessment With Respect to RAOs and Plume Changes
Criteria used to evaluate whether RAOs have been met may have been established in site
remedy decision documents. RAOs may include multiple elements, but most include some
threshold related to contaminant concentrations. In some cases, it may be appropriate to evaluate
concentrations in comparison to RAOs for the condition with the P&T system temporarily shut
down (e.g., a rebound test) as discussed in Case Study 1. Sites where decision makers determine
that the P&T remedy (potentially in conjunction with other remedy components) has met the
RAOs can proceed with a closure process, as described by CERCLA and related EPA
documentation (e.g., EPA 2009b, 2011a, 2011c, 2013, 2014a, 2014b). For source control P&T
systems, the assessment will need to take into account that the RAOs in the source area may be
different than are applied within the plume.
For those plumes not meeting RAOs, an important next step is to assess how the plume has
changed during the P&T remedy. Evaluation of plume maps (Section 5.2.1), well concentration
trends (Section 5.2.1), or the temporal changes in P&T system CMD (Section 5.2.2) can be
applied to evaluate how the plume has changed during the P&T remedy. At this point in the
process, it is important to evaluate whether the overall plume is declining, and therefore, there
may be a chance that the plume has been diminished sufficiently that MNA or continued P&T
can meet RAOs in a reasonable time. If plume maps show reduced plume volume, concentration
trends at individual wells (all wells or at diagnostic locations) or collectively (such as with a
mass-based assessment) that are decreasing, and/or the P&T CMD has declined over time
sufficiently that the decisions makers agree that the plume has declined during the P&T remedy,
then the P&T performance assessment should continue with Section 6.2, assessment for
declining plumes. If the plume has not declined during the P&T remedy, then the P&T
assessment should continue with Section 6.3, assessment for persistent plumes. In some cases,
segments of the plume may decline while others portions do not. Decision makers may elect to
evaluate different plume segments separately, if that approach makes sense in the context of
overall plume remediation management.
6.2 Assessment for Declining Plumes
A primary assessment for declining plumes is to evaluate whether the plume or source and
associated driving force for migration (i.e., the CMD) have declined sufficiently that natural
attenuation would meet the RAOs within a reasonable time if P&T were discontinued.
Considering a conceptual mass balance context for this assessment (e.g., ITRC 2008; Figure 30),
if the estimated CMD (Section 5.2.2) of the source flux zone is less than AC (Section 5.2.3) in
the attenuation zone under natural-gradient conditions, then transition to MNA may be viable
and the P&T assessment should continue with Section 6.2.1, assessment of MNA. If the CMD is
clearly greater than AC in the attenuation zone under natural-gradient conditions, then MNA is
less likely to be appropriate and the P&T assessment should continue with Section 6.2.2,
assessment of continued P&T.

57
Figure 30. Conceptual depiction of the source flux zone being controlled by P&T and a
downgradient attenuation zone, whose extent must be determined by the site decision
makers. Under natural-gradient conditions, the CMD from the source zone must not
be greater than the attenuation capacity in the attenuation zone for the plume to stay
within the limits defined by the site decision makers (e.g., to potentially support a
decision to transition to an MNA remedy). This figure is the same as Figure 9, but is
repeated here for convenience.
In evaluating MNA or continued P&T for a declining plume, site decision makers will need
to incorporate consideration of uncertainty in these analyses. The following sections provide
approaches to collect suitable information to support this evaluation. A “rebound test”
measuring the concentrations during a period of P&T system shutdown, with comparison to
estimated plume attenuation rates and downgradient migration distances, is one way to evaluate
the balance of CMD and AC under natural-gradient conditions. This scenario is highlighted in
Case Studies 2A and 2B and in Section 6.2.1 below. This method offers a way to collect data in
an observational approach to help verify aquifer response if a transition is made. It is also
important that the site determine the appropriate MNA performance monitoring to verify
expected remedy performance if a transition is made.
6.2.1 Assessment of MNA
MNA may be a viable post-P&T remedy if the site decision makers agree that there is a
specified zone of the aquifer where, in conjunction with site-specific institutional controls, MNA
can be allowed to occur over time to reduce plume concentrations and will meet the RAOs in a
reasonable time. If MNA is not viable (based on the evaluation in this section), then assessment
of continued or optimized P&T as described in Section 6.2.2 would be conducted. The MNA
evaluation will need to be conducted in the context of the MNA OSWER directive (EPA 1999c)
and existing guidance and protocols for MNA remedy evaluation (e.g., EPA 1998, 2002b, 2003,

58
2004, 2007c, 2007d, 2010, 2011b; ITRC 1999a, 1999b, 2008, 2010b; USGS 2003; Wiedemeier
et al. 1999). However, in the situation where P&T has been applied at a site, evaluation of
transition to MNA after P&T is terminated, or reduced, must consider different lines of evidence
than can be applied for a site where active remedies have not been applied. For instance,
evaluation of whether a plume is stable, shrinking, or expanding is not relevant because the
plume conditions have been affected by P&T and will change again when P&T is terminated.
The items below discuss elements that may need to be incorporated into this evaluation because
P&T has been applied at a site. Analyses should include consideration of the conceptual site
model as a basis to evaluate plume behavior and features or processes that control plume
behavior.
In assessing the attenuation capacity for conditions where the P&T system is terminated,
estimates of attenuation rate can be used to evaluate threshold concentrations for which
attenuation can reduce concentrations along a downgradient flow path and meet RAOs. For
example, concentrations within the portion of the plume previously controlled by the P&T
system need to be low enough that they can decline to the RAO concentration limit before the
plume migrates beyond a defined footprint or specified downgradient location. This approach
may be particularly appropriate when there is a higher concentration plume core where
calculation of an attenuation rate (change in concentration per time) and comparison to the
concentration emanating from the source zone plume core facilitates evaluating the ability to
meet concentration-based RAOs. Case Study 2B, the Test Area North (TAN) site, used this
approach, determining an attenuation rate based on tracer-corrected contaminant concentration
attenuation within the plume. This rate was then applied to define the concentration reduction
goal for the P&T system. If the P&T system reduced concentrations to this level, the plume was
predicted to remain within an acceptable zone of administrative control. As P&T (and source
reduction) progressed, rebound tests were used to determine if the concentration goal was met
and the P&T could be turned off. This type of assessment is most feasible when the plume size
characteristics are appropriate to use concentration change determinations for estimating the
attenuation rate (EPA 2002b).

59
Example Calculation:
With a threshold concentration approach, a concentration-based attenuation rate in the
downgradient plume needs to be computed. EPA (2002b) (see also Section 5.2.3) provide
information on calculating rates (e.g., mg L-1 d-1) along the plume migration axis
(Attenuation rate|plume axis). In most cases, the rate estimated along a plume migration axis is
expected to be representative of the attenuation rate within the plume. The method for
estimating an attenuation rate highlighted in Case Study 2B may also be applicable to some
sites. Using the estimated attenuation rate and the computed contaminant transport velocity
(vcontaminant), a threshold concentration at the upgradient “source” zone or location of the P&T
system can be calculated such that the RAO concentration goal (CRAO) is reached by a selected
maximum downgradient plume migration distance. This threshold concentration can then be
compared to concentrations within the upgradient plume or to a concentration measured during
a rebound test.
Threshold concentration = CRAO + (Attenuation rate|plume axis × distance / vcontaminant)
where vcontaminant = (qnatural / n) / Rcontaminant
Notes:
Estimation of the Attenuation rate|plume axis needs to consider plume migration conditions that may affect the
calculation (see EPA 2002b).
distance = the maximum downgradient plume migration distance acceptable as a zone of MNA (i.e.,
with no impact to receptors or other downgradient constraints like property boundaries)
qnatural = the Darcy flux (hydraulic conductivity × hydraulic gradient) under natural (non-pumped) conditions
n = effective porosity
Rcontaminant = the retardation factor for the contaminant
The above threshold-concentration approach fits within a mass balance concept for MNA
(e.g., ITRC 2008). For a mass balance, the CMD from the source area (source flux) (Section
5.2.2), or CMD past a specified transect of the plume (Section 5.2.2), is compared to the
attenuation capacity in the aquifer (Section 5.2.3) downgradient of that location. Mass balance
calculations can be used, as discussed in the example calculations below, to provide input on
whether MNA will maintain the plume within an acceptable volume of the aquifer after ceasing
P&T. Site decision makers will need to determine the extent of the acceptable aquifer volume
for MNA. Any continuing sources, such as from matrix diffusion, would need to be considered
in these analyses if these conditions are present at a site. The following example provides
information about using volumetric evaluation of CMD versus AC to support the P&T
performance assessment.
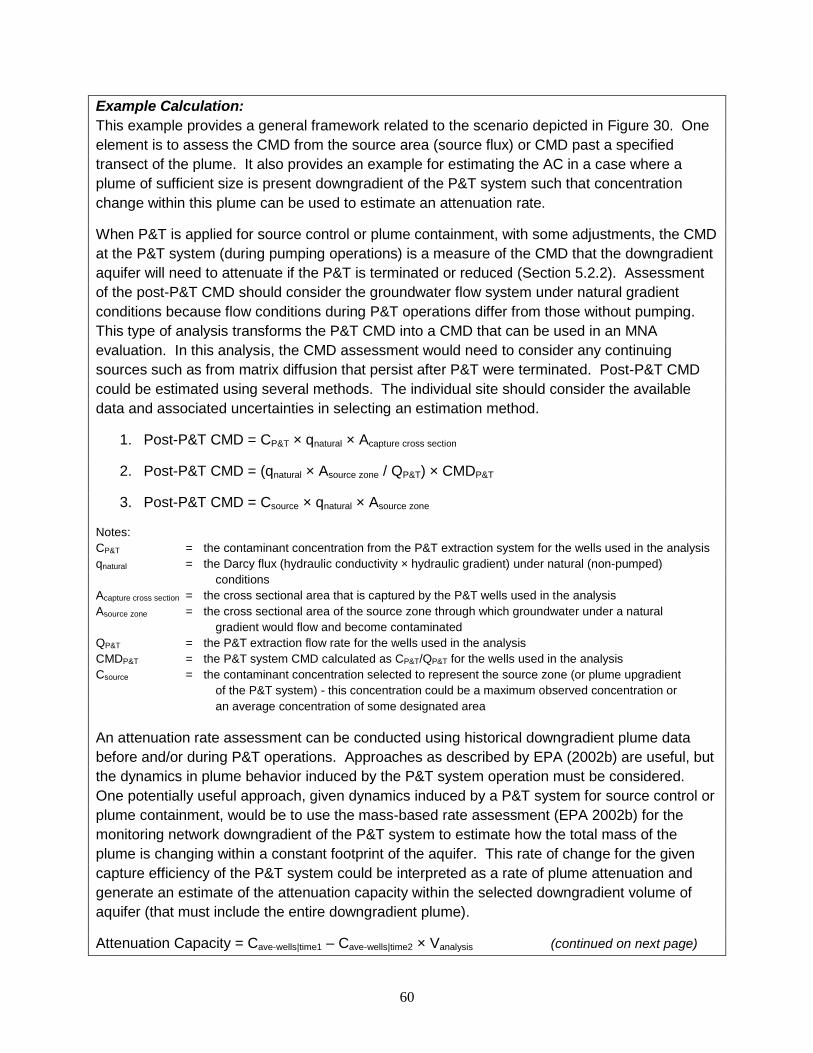
60
Example Calculation:
This example provides a general framework related to the scenario depicted in Figure 30. One
element is to assess the CMD from the source area (source flux) or CMD past a specified
transect of the plume. It also provides an example for estimating the AC in a case where a
plume of sufficient size is present downgradient of the P&T system such that concentration
change within this plume can be used to estimate an attenuation rate.
When P&T is applied for source control or plume containment, with some adjustments, the CMD
at the P&T system (during pumping operations) is a measure of the CMD that the downgradient
aquifer will need to attenuate if the P&T is terminated or reduced (Section 5.2.2). Assessment
of the post-P&T CMD should consider the groundwater flow system under natural gradient
conditions because flow conditions during P&T operations differ from those without pumping.
This type of analysis transforms the P&T CMD into a CMD that can be used in an MNA
evaluation. In this analysis, the CMD assessment would need to consider any continuing
sources such as from matrix diffusion that persist after P&T were terminated. Post-P&T CMD
could be estimated using several methods. The individual site should consider the available
data and associated uncertainties in selecting an estimation method.
1. Post-P&T CMD = CP&T × qnatural × Acapture cross section
2. Post-P&T CMD = (qnatural × Asource zone / QP&T) × CMDP&T
3. Post-P&T CMD = Csource × qnatural × Asource zone
Notes:
CP&T = the contaminant concentration from the P&T extraction system for the wells used in the analysis
qnatural = the Darcy flux (hydraulic conductivity × hydraulic gradient) under natural (non-pumped)
conditions
Acapture cross section = the cross sectional area that is captured by the P&T wells used in the analysis
Asource zone = the cross sectional area of the source zone through which groundwater under a natural
gradient would flow and become contaminated
QP&T = the P&T extraction flow rate for the wells used in the analysis
CMDP&T = the P&T system CMD calculated as CP&T/QP&T for the wells used in the analysis
Csource = the contaminant concentration selected to represent the source zone (or plume upgradient
of the P&T system) - this concentration could be a maximum observed concentration or
an average concentration of some designated area
An attenuation rate assessment can be conducted using historical downgradient plume data
before and/or during P&T operations. Approaches as described by EPA (2002b) are useful, but
the dynamics in plume behavior induced by the P&T system operation must be considered.
One potentially useful approach, given dynamics induced by a P&T system for source control or
plume containment, would be to use the mass-based rate assessment (EPA 2002b) for the
monitoring network downgradient of the P&T system to estimate how the total mass of the
plume is changing within a constant footprint of the aquifer. This rate of change for the given
capture efficiency of the P&T system could be interpreted as a rate of plume attenuation and
generate an estimate of the attenuation capacity within the selected downgradient volume of
aquifer (that must include the entire downgradient plume).
Attenuation Capacity = Cavewells|time1 – Cave-wells|time2 × Vanalysis (continued on next page)

61
Notes:
Cave-wells|time* = the average or weighted average contaminant concentration at a selected time for the group
of wells in the selected downgradient volume of aquifer for the analysis – the group of wells
should remain the same for both time points used in the calculation
Vanalysis = the selected downgradient volume of aquifer for the analysis
A similar calculation to the one shown above could be conducted based on estimating the
plume mass at different times using plume contouring techniques.
Note: When using volume-averaged approaches like CMD and AC, the site should consider the
concentration variations within the plume. If there is a plume core with a much higher
concentration than other portions of the plume, then the threshold concentration analysis, as
described in the preceding example, should be applied to assess the ability to meet
concentration targets for the plume core.
In some cases, P&T will have been deployed such that there is not a significant downgradient
plume for which concentration changes can be monitored to estimate the attenuation rate and
associated attenuation capacity within the zone of aquifer that site decision makers agree is
suitable for MNA. In these cases, other estimates of attenuation processes and rates need to be
applied. Section 5.2.3 discusses options to obtain this information. These methods would
provide an estimate of an attenuation process that can be represented in a modeling analysis to
evaluate the potential for MNA to meet goals, as described below.
Whether there is an existing downgradient plume or not, available tools (such as REMChlor
[Falta 2008], BIOCHLOR [EPA 2000b; Aziz et al. 2002], BIOSCREEN [EPA 1996b], NAS
[Widdowson et al. 2005], MT3D/RT3D [Harbaugh 2005; Clement et al. 1998; Johnson et al.
2006; Johnson and Truex 2006]) and guidance (e.g., EPA 1998, 2002b, 2011b; ITRC 1999a,
1999b, 2010b; Looney et al. 2006) that are based on conducting a fate and transport assessment
can be effectively applied to support a determination for transitioning from P&T to MNA.
Numerical or analytical simulations using these tools predict responses as a function of
contaminant conditions and estimated future fate and transport conditions. Inputs to the model
need to consider the flow conditions without P&T, the expected concentration and/or CMD
conditions, and attenuation rate and capacity estimates as part of predicting contaminant fate and
transport. In addition, it may be important to use a sensitivity analysis based on reasonable
variations in input parameters to assess the range of responses due to uncertainty about aspects
such as preferential groundwater flow, residual NAPL dissolution, or matrix diffusion. It may
also be useful to supplement this type of analysis with information about the initial CMD from
the contaminant source and resultant plume that developed. This information can then be
compared to the post-P&T remedy CMD to provide a context supporting why the post-P&T
plume will be smaller and potentially amenable to having MNA meet the RAOs.
6.2.2 Assessment of Continued P&T
If the P&T remedy has caused contaminant concentrations to decline, but not sufficiently for
MNA to meet the RAOs in a reasonable time (Section 6.2.1), then it is appropriate to consider

62
whether continuation of the existing, or an optimized, P&T system can meet RAOs in a
reasonable time. Plotting the P&T system CMD as a function of time or plume maps over time
during the P&T remedy may be instructive to determine whether the plume decline has been
steady or the rate of decline has slowed (i.e., asymptotic conditions are being approached). If the
decline has not stalled, a projection of future performance and time to reach the RAOs can be
made based on a simple projection or using a fate and transport model. Decision makers can
then use this projected time to evaluate whether the time is reasonable for supporting
continuation P&T as the remedy. In assessing this projected remediation time for cases where
the rate of plume declined has slowed or stalled, it is important to evaluate whether there are
specific areas of persistence of the plume that may need to be addressed. It is also important to
conduct a capture analysis for the P&T system (EPA 2008) and consider optimization
opportunities that could enable continued plume decline (EPA 1999a, 1999b; Minsker et al.
2004; Becker et al. 2006).
For instance, the DOE Fernald site P&T system for a uranium plume showed indications of
decreased operational effectiveness resulting in a longer projected remediation timeframe to
reach the RAOs. The site applied the groundwater model that was used for initial P&T design to
evaluate optimization alternatives for the P&T system. This optimization study was able to
identify a revised P&T system configuration that is predicted to accelerate cleanup in key
portions of the aquifer and meet site RAOs in a reasonable time, with reduced costs compared to
the original P&T design (see Case Study 3).
If the assessment of continued P&T indicates that the current system or an optimized system
is likely to meet the RAOs within a reasonable additional time of operation, the decision makers
can decide to continue P&T or evaluate alternatives on a cost/benefit basis using a feasibility
study type approach. In essence, this assessment of continued P&T can be similar to a feasibility
study assessment except that site-specific performance data are available. If the analysis
indicates that the existing or optimized P&T system is unlikely to reach RAOs in a reasonable
time (for instance, due to a persistent source zone that was unknown when P&T was initially
selected), then the P&T assessment should continue to Section 6.3, persistent plume assessment.
6.3 Persistent Plume/Source Assessment
If assessment of continued P&T or MNA for a declining plume shows that the plume cannot
be remediated by these methods in a reasonable time, or if the plume/source is not declining, the
plume/source is categorized as persistent and other approaches need to be considered. In this
case, an assessment of the factors causing the persistence is needed with respect to 1) evaluating
the potential for P&T optimization to meet RAOs (an extension of Section 6.2.2) and 2)
supporting evaluation of the expected performance of other technologies in meeting the RAOs,
potentially including assessment of a continued role for P&T in this strategy. In conducting the
assessment of a persistent plume/source, the site should consider whether the lack of plume
decline is due to an insufficient P&T system design or operational issues. If P&T optimization
has a potential to improve remedy performance and address plume/source persistence, then it

63
should be evaluated as described in Section 6.2.2 and potentially carried forward as an option for
comparison to other alternative technologies or the use of a supplemental technology.
Situations where the contaminant concentrations are persistent indicate that contaminants are
being released into the transmissive portion of the aquifer at a rate high enough to maintain
contaminant concentrations above the RAOs. Categories of factors that may cause this persis-
tence include contaminant discharge from the vadose zone, matrix diffusion processes,
remaining source material such as NAPL, desorption (e.g., a tailing plume), dissolution of solid-
phase contaminants (e.g., due to redox conditions or other geochemical gradients), or (poten-
tially) large plumes within heterogeneous aquifers where it is difficult to effectively extract
contaminants in a reasonable time. The evaluation of persistent plume/source factors is an
element of refining the CSM and can be addressed through approaches discussed in Section 5.0.
Based on the identified factors causing a persistent plume/source, supplemental or alternative
technologies (along with P&T system optimization) need to be evaluated in terms of addressing
the contamination and enabling the site to reach RAOs. Plotting the P&T system CMD as a
function of time or plume maps over time during the P&T remedy, as discussed in Section 6.2.2,
may be instructive for evaluating the persistence of the plume/source. Where possible,
individual P&T extraction well data may be useful in identifying locations of persistence based
on the capture area of an individual well. This situation is depicted in Figure 22, Section 5.2.2.
Additional high-resolution characterization may also be helpful. Analysis of plume persistence
should be coupled with an associated consideration of P&T optimization (Section 6.2.2) and may
require consideration of a supplemental or alternative technology as discussed in here. The
assessment of supplemented P&T and alternate remedies should follow an approach like that
used to evaluate technology options and assemble remedial alternatives for a feasibility study
(EPA 1988, 1993a). There are a variety of technology resources that provide information about
technologies and their performance (e.g., https://clu-in.org/). These, along with an engineering
and fate/transport assessment, can be used to determine if options are likely to meet RAOs. If
there are promising options, then the site can continue with an evaluation to select the preferred
alternative using a feasibility study approach, as discussed in Section 6.4.
For instance, in Case Study 4, a large plume at the former Cornhusker Army Ammunition
Plant was contained, but not significantly declining. Bioremediation was applied as a means to
hasten plume decline by supplementing the P&T system. In Case Study 5A, at a Superfund Site
in Nebraska, P&T was not effectively diminishing the plume. A ROD amendment process was
used to change to a remedy with in-situ thermal remediation for the source area and chemical
oxidation or enhanced bioremediation for the dissolved plume. In Case Study 5B, an arsenic
plume was being contained by P&T, but not declining. The transition to an immobilization
remedy, driven by air sparging, was evaluated and is predicted to allow the cessation of P&T
with a large cost reduction. At a minimum, it would allow a substantial reduction in pumping,
with a lesser, but still significant, savings for plant operations. Currently, pilot testing of air

64
sparging is being conducted as a means to sequester arsenic as part of the transition evaluation,
with promising results.
Sites with complexities that lead to persistent plumes/sources have been recognized in NRC
(NRC 2013) and ITRC (ITRC 2011c, 2012, 2015) studies. For sites that are, by nature, going to
be difficult to remediate (as supported by difficulties in reaching goals with the P&T system),
remediation strategies that incorporate appropriate exposure control, contaminant reduction
approaches, and adaptive management should be considered. In some cases, site decision
makers may restructure RAOs (e.g., using approaches to define objectives as described in the
Integrated DNAPL Site Strategy document [ITRC 2011b]) to improve management of a site
(Case Study 5C). Sites that will have difficulty in reaching RAOs may also need to consider
ARAR waivers such as technical impracticability (Case Study 5D). As summarized by Deeb et
al. (2011), the potential ARAR waivers are the following six options (40 CFR
300.430(f)(1)(ii)(C); see also ITRC 2012):
1. Interim Measure. If the remedy is an interim action, ARARs need not be met. However,
the final remedy still needs to achieve ARARs.
2. Greater Risk. If compliance with the ARAR would result in greater risk to human health
and environment compared with an alternative that does not comply with ARARs.
3. Technical Impracticability. If compliance with ARARs is technically impracticable from
an engineering standpoint, within a reasonable timeframe (specific guidance is found in
EPA [1993b]).
4. Equivalent Standard of Performance. If the selected remedy will attain a standard of
performance that is equivalent to the ARAR. This waiver is typically used for action-
specific or location-specific ARARs.
5. Inconsistent Application of State Standards. If the ARAR is a state standard that has not
been consistently applied to other remedial actions within the state.
6. Fund Balancing. If compliance with the ARAR would threaten the ability of the Fund
(applicable to sites that have Superfund support) to respond to and achieve protectiveness
at other sites (EPA 1991).
Other alternatives and associated resources for more information are listed below (see also
ITRC 2012).
Alternative Concentration Limits (CERCLA: Section 121(d)(2)(B)(ii)); RCRA: 40 CFR
264.94, EPA 2005)
Groundwater management/containment zones (Deeb et al. 2011)
Groundwater reclassification/classification exemptions (Deeb et al. 2011)
Remediation to the extent practicable (Deeb et al. 2011).

65
While site complexities may cause difficulty with remediation, a remediation strategy can be
developed to make progress toward RAOs, potentially recognizing that a long remediation time
will be needed. Core elements of this type of strategy would be expected to include:
control of contaminant exposure pathways during the remediation process;
mitigation of plume or source expansion, especially to maintain contamination within an
area where institutional or engineering controls to limit exposure can be applied during
remediation;
inclusion of an appropriate approach to contaminant reduction, realizing that contaminant
reduction will be difficult and may require a long duration;
engineering controls and remedy components appropriate to complement any ARAR
waivers or RAO changes that are selected; and
adaptive approaches using effective intermediate goals to guide implementation. The
fundamental concepts of adaptive management approaches are described by NRC (2003).
The ITRC has several relevant resources that incorporate adaptive management and other
strategies for sites that are difficult to remediate (ITRC 2011b, 2011c, 2012, 2015).
The steps outlined for a P&T assessment in this document are consistent with providing a
foundation for developing this type of remediation strategy. Refining the CSM and identifying
factors that cause plume/source persistence provides the technical foundation for evaluating an
appropriate strategy. Evaluating P&T remedy performance and assessing other alternatives to
address causes of persistence is important in considering options for remediation and establishing
reasonable expectations for the remediation timeframe. It is also likely effective to incorporate
optimization approaches and adaptive management, recognizing conditions will change over
time and that information gathered during remediation can be used to refine the knowledge of the
site and adapt the remedy approach. Thus, monitoring approaches such as those described in
Bunn et al. (2012) may be useful to consider.
In some cases, P&T may be applied as part of the strategy and serve to meet some site goals
even though, alone, it will not effectively diminishing the plume. Examples may include
situations where P&T is providing hydraulic containment of the plume or source control or the
extracted water is being used for a beneficial purpose. As part of strategy development, periodic
optimization and transition assessments of the P&T system should be conducted and the role and
cost/benefit of continued P&T should be evaluated.
6.4 Alternative Remedy Selection
If supplemental or alternative remedies have been identified that are likely to be able to meet
RAOs (Section 6.3), then the site should proceed with selecting the preferred alternative for
transitioning from the P&T remedy to a new remediation approach. The process for this
selection should follow an EE/CA or FS methodology (or related RCRA methods)
commensurate with the guiding regulatory documents at the site and the expected regulatory
documentation for the change in remedy (e.g., an ESD or a ROD amendment). This assessment

66
would include a comparative evaluation of the performance and cost aspects of each option using
the threshold and balancing criteria for selection of a preferred remedy. The P&T system
benefits and detrimental effects identified in Section 5.2.5 should be considered as part of the
balancing criteria comparison. These methods are appropriate if the selection process is
expected to result in a remedy that will meet the RAOs. For some sites, consideration of ARAR
waivers and revisiting RAOs (e.g., using approaches to define objectives as described in the
Integrated DNAPL Site Strategy document [ITRC 2011b]) may be appropriate in conjunction
with the above selection process.

67
7.0 References
Aziz, C.E., C.J. Newell, and J.R. Gonzales. 2002. BIOCHLOR Natural Attenuation Decision
Support System Version 2.2 User’s Manual Addendum. Air Force Center for
Environmental Excellence, Technology Transfer Division, Brooks AFB, San
Antonio, Texas.
Becker, D., B. Minsker, R. Greenwald, Y. Zhang, K. Harre, K. Yager, C. Zheng, and R. Peralta.
2006. “Reducing Long-Term Remedial Costs by Transport Modeling Optimization.”
Ground Water, 44(6):864-875.
Bunn, A.L., D.M. Wellman, R.A. Deeb, E.L. Hawley, M.J. Truex, M. Peterson, M.D. Freshley,
E.M. Pierce, J. McCord, M.H. Young, T.J. Gilmore, R. Miller, A.L. Miracle, D.
Kaback, C. Eddy-Dilek, J. Rossabi, M.H. Lee, R.P. Bush, P. Beam, G.M.
Chamberlain, J. Marble, L. Whitehurst, K.D. Gerdes, and Y. Collazo. 2012.
Scientific Opportunities Monitoring at Environmental Remediation Sites (SOMERS):
Integrated Systems-Based Approaches to Monitoring. PNNL-21379, Pacific
Northwest National Laboratory, Richland, Washington.
Clement, T.P., Y. Sun, B.S. Hooker, and J.N. Petersen. 1998. “Modeling Multi-species
Reactive Transport in Groundwater Aquifers.” Groundwater Monit. Remed. J.,
18(2):79-92.
Deeb, R., E. Hawley, L. Kell, and R. O’Laskey. 2011. Final Report – Assessing Alternative
Endpoints for Groundwater Remediation at Contaminated Sites. ESTCP Project ER-
200832, Environmental Security Technology Certification Program, U.S. Department
of Defense, Washington, D.C. Available at https://www.serdp-estcp.org/content/
download/10619/130969/file/ER-200832-FR.pdf.
Dinicola, R.S. 2005. Hydrogeology and Trichloroethene Contamination in the Sea-Level
Aquifer Beneath the Logistics Center, Fort Lewis, Washington. Scientific
Investigations Report 2005-5035, U.S. Geological Survey, Reston, Virginia.
DOE. 2015. Advanced Simulation Capability for Environmental Management (ASCEM)
(website). U.S. Department of Energy, Washington, D.C. Available at:
http://esd.lbl.gov/research/projects/ascem/.
EPA. 1988. Guidance for Conducting Remedial Investigations and Feasibility Studies under
CERCLA, Interim Final. EPA/540/G-89/004, U.S. Environmental Protection
Agency, Washington, D.C.
EPA. 1991. ARARs Q’s and A’s: The Fund-Balancing Waiver. 9234.2-13/FS, U.S.
Environmental Protection Agency, Washington, D.C. Available at:
http://epa.gov/superfund/policy/remedy/pdfs/92-34213fs-s.pdf.

68
EPA. 1993a. Guidance on Conducting Non-Time-Critical Removal Actions under CERCLA.
EPA/540/R-93/057, U.S. Environmental Protection Agency, Washington, D.C.
EPA. 1993b. Guidance for Evaluating the Technical Impracticability of Groundwater
Restoration. EPA/540/R-93/080, OSWER Directive 9234.2-25, U.S. Environmental
Protection Agency, Washington, D.C.
EPA. 1994. Methods for Monitoring Pump-and-Treat Performance. EPA/600/R-94/123, U.S.
Environmental Protection Agency, Office of Research and Development,
Washington, D.C.
EPA. 1996a. Pump-and-Treat Ground-Water Remediation: A Guide for Decision Makers and
Practitioners. EPA/625/R-95/005, U.S. Environmental Protection Agency, Office of
Research and Development, Washington, D.C.
EPA. 1996b. BIOSCREEN Natural Attenuation Decision Support System User’s Manual
Version 1.3. EPA/600/R-96/087, U.S. Environmental Protection Agency,
Washington, D.C.
EPA. 1997. Ground Water Issue: Design Guidelines for Conventional Pump-and-Treat
Systems. EPA/540/S-97/504, U.S. Environmental Protection Agency, Office of
Research and Development, Washington, D.C.
EPA. 1998. Technical Protocol for Evaluation Natural Attenuation of Chlorinated Solvents in
Groundwater. EPA/600/R-98/128, U.S. Environmental Protection Agency,
Washington, D.C.
EPA. 1999a. Hydraulic Optimization Demonstration for Groundwater Pump-and-Treat
Systems, Volume I: Pre-Optimization Screening (Method and Demonstration).
EPA/542/R-99/011A, U.S. Environmental Protection Agency, Washington, D.C.
EPA. 1999b. Hydraulic Optimization Demonstration for Groundwater Pump-and-Treat
Systems, Volume II: Application of Hydraulic Optimization. EPA/542/R-99/011B,
U.S. Environmental Protection Agency, Washington, D.C.
EPA. 1999c. “Use of Monitored Natural Attenuation at Superfund, RCRA Corrective Action,
and Underground Storage Tank Sites.” OSWER Directive 92000.4-17P, U.S.
Environmental Protection Agency, Office of Solid Waste and Emergency Response,
Washington, D.C.
EPA. 2000a. “Superfund Reform Strategy, Implementation Memorandum: Optimization of
Fund‐lead Ground Water Pump Treat (P&T) Systems.” OSWER Directive
9283.1‐13, U.S. Environmental Protection Agency, Office of Solid Waste and
Emergency Response, Washington, D.C.

69
EPA. 2000b. BIOCHLOR Natural Attenuation Decision Support System User’s Manual Version
1.0. EPA/600/R-00/008, U.S. Environmental Protection Agency, Washington, D.C.
EPA. 2002a. “Elements for Effective Management of Operating Pump and Treat Systems.”
EPA/542/R‐02/009, U.S. Environmental Protection Agency, Office of Solid Waste
and Emergency Response, Washington, D.C.
EPA. 2002b. Calculation and Use of First-Order Rate Constants for Monitored Natural Attenu-
ation Studies. EPA/540/S-02/500, U.S. Environmental Protection Agency, National
Risk Management Research Laboratory, Cincinnati, Ohio.
EPA. 2003. Performance Monitoring for Natural Attenuation Remedies in Ground Water.
EPA/540/R-03/004, U.S. Environmental Protection Agency, Washington D.C.
EPA. 2004. Performance Monitoring of MNA Remedies for VOCs in Ground Water.
EPA/600/R-04/027, U.S. Environmental Protection Agency, National Risk
Management Research Laboratory, Cincinnati, Ohio.
EPA. 2007a. Optimization Strategies for Long‐Term Ground Water Remedies (with Particular
Emphasis on Pump and Treat Systems). EPA/542/R‐07/007, U.S. Environmental
Protection Agency, Washington D.C.
EPA. 2007b. “Options for Discharging Treated Water from Pump and Treat Systems.”
EPA/542/R-07/006, U.S. Environmental Protection Agency, Washington, D.C.
EPA. 2007c. Monitored Natural Attenuation of Inorganic Contaminants in Ground Water -
Volume 1, Technical Basis for Assessment. EPA/600/R-07/139, U.S. Environmental
Protection Agency, Washington, D.C.
EPA. 2007d. Monitored Natural Attenuation of Inorganic Contaminants in Ground Water -
Volume 2, Assessment for Non-Radionuclides Including Arsenic, Cadmium,
Chromium, Copper, Lead, Nickel, Nitrate, Perchlorate, and Selenium. EPA/600/R-
07/140, U.S. Environmental Protection Agency, Washington, D.C.
EPA. 2008. A Systematic Approach for Evaluation of Capture Zones at Pump and Treat
Systems. EPA/600/R‐08/003, U.S. Environmental Protection Agency, National Risk
Management Research Laboratory, Cincinnati, Ohio.
EPA. 2009a. Identification and Characterization Methods for Reactive Minerals Responsible
for Natural Attenuation of Chlorinated Organic Compounds in Ground Water.
EPA/600/R-09/115, U.S. Environmental Protection Agency, Washington, D.C.
EPA. 2009b. “Summary of Key Existing EPA CERCLA Policies for Groundwater
Restoration.” OSWER Directive 9283.1‐33, U.S. Environmental Protection Agency,
Office of Solid Waste and Emergency Response, Washington, D.C.
70
EPA. 2010. Monitored Natural Attenuation of Inorganic Contaminants in Ground Water -
Volume 3. EPA/600/R-10/093, U.S. Environmental Protection Agency, Washington,
D.C.
EPA. 2011a. “Groundwater Road Map: Recommended Process for Restoring Contaminated
Groundwater at Superfund Sites.” OSWER 9283.1‐34, U.S. Environmental
Protection Agency, Washington, D.C.
EPA. 2011b. An Approach for Evaluating the Progress of Natural Attenuation in Groundwater.
EPA/600/R-11/204, U.S. Environmental Protection Agency, National Risk
Management Research Laboratory, Ada, Oklahoma.
EPA. 2011c. Close Out Procedures for the National Priorities List Sites. OSWER 9320.2‐22,
U.S. Environmental Protection Agency, Washington, D.C.
EPA. 2013. Guidance for Evaluating Completion of Groundwater Restoration Remedial
Actions. OSWER 9355.0-129, U.S. Environmental Protection Agency, Office of
Solid Waste and Emergency Response, Washington, D.C.
EPA. 2014a. Groundwater Remedy Completion Strategy. OSWER 9200.2-144, U.S.
Environmental Protection Agency, Office of Solid Waste and Emergency Response,
Washington, D.C.
EPA. 2014b. Recommended Approach for Evaluating Completion of Groundwater Restoration
Remedial Actions at a Groundwater Monitoring Well. OSWER 9283.1-44, U.S.
Environmental Protection Agency, Office of Solid Waste and Emergency Response,
Washington, D.C.
EPA, DOE, and WDOE. 2008. Record of Decision Hanford 200 Area 200-ZP-1 Operable Unit
Superfund Site, WA. U.S. Environmental Protection Agency, U.S. Department of
Energy, and Washington State Department of Ecology, Seattle, Washington.
EPA/541/R-08/115. Available at: http://pdw.hanford.gov/arpir/index.cfm/viewDoc
?accession=00098825.
Falta, R.W. 2008. “Methodology for Comparing Source and Plume Remediation Alternatives.”
Ground Water, 46(2):272-285.
Gilmore, T., B.B. Looney, N. Cutshall, D. Major, T. Wiedemeier, F.H. Chapelle, M. Truex, T.
Early, M. Heitkamp, J. Waugh, D. Peterson, G. Wein, C. Bagwell, M. Ankeny, K.M.
Vangleas, K.M. Adams, and C.H. Sink. 2006. Characterization and Monitoring of
Natural Attenuation of Chlorinated Solvents in Ground Water: A Systems Approach.
WSRC-STI-2006-00084, Washington Savannah River Company, Aiken, SC.

71
Harbaugh, A.W. 2005. MODFLOW-2005, The U.S. Geological Survey Modular Ground-Water
Model—the Ground-Water Flow Process. Techniques and Methods 6-A16, U.S.
Geological Survey, Reston, Virginia.
Hawley, E.L., R.A. Deeb, and H. Levine. 2014. “Groundwater Remediation and the Use of
Alternative Endpoints at Highly Complex Sites.” In: Chlorinated Solvent Source
Zone Remediation, B.H. Kueper, H.F. Stroo, C.M. Vogel, and C.H. Ward, (eds.).
Springer, New York. pp. 627-652.
ITRC. 1999a. Natural Attenuation of Chlorinated Solvents in Groundwater: Principles and
Practices. ISB-3, Interstate Technology and Regulatory Council, Washington, D.C.
Available at: http://www.itrcweb.org/GuidanceDocuments/ISB-3.pdf.
ITRC. 1999b. ITRC/RTDF Training Course: Natural Attenuation of Chlorinated Solvents in
Groundwater. ISB-7, Interstate Technology and Regulatory Council, Washington,
D.C. Available at: http://www.itrcweb.org/GuidanceDocuments/ISB-7.pdf.
ITRC. 2008. Enhanced Attenuation: Chlorinated Organics. EACO-1, Interstate Technology
and Regulatory Council, Washington, D.C. Available at: http://www.itrcweb.org/
GuidanceDocuments/EACO-1.pdf.
ITRC. 2010a. Use and Measurement of Mass Flux and Mass Discharge. MASSFLUX-1,
Interstate Technology and Regulatory Council, Washington, D.C. Available at:
http://www.itrcweb.org/GuidanceDocuments/MASSFLUX1.pdf.
ITRC. 2010b. A Decision Framework for Applying Monitored Natural Attenuation Processes
to Metals and Radionuclides in Groundwater. APMR-1, Interstate Technology and
Regulatory Council, Washington, D.C. Available at: http://www.itrcweb.org/
GuidanceDocuments/APMR1.pdf.
ITRC. 2011a. Environmental Molecular Diagnostics Fact Sheets. EMD-1, Interstate
Technology and Regulatory Council, Washington, D.C. Available at:
http://www.itrcweb.org/GuidanceDocuments/EMD1.pdf.
ITRC. 2011b. Integrated DNAPL Site Strategy. IDSS-1, Interstate Technology and
Regulatory Council, Washington, D.C. Available at: http://www.itrcweb.org/
GuidanceDocuments/IntegratedDNAPLStrategy_IDSSDoc/IDSS-1.pdf.
ITRC. 2011c. Project Risk Management for Site Remediation. RRM-1, Interstate Technology
and Regulatory Council, Washington, D.C. Available at: http://www.itrcweb.org/
GuidanceDocuments/RRM-1.pdf.
72
ITRC. 2012. Using Remediation Risk Management to Address Groundwater Cleanup
Challenges at Complex Sites. RRM-2, Interstate Technology and Regulatory Council,
Washington, D.C. Available at: http://www.itrcweb.org/GuidanceDocuments/
RRM2.pdf.
ITRC. 2013. Environmental Molecular Diagnostics New Site Characterization and
Remediation Enhancement Tools. EMD-2, Interstate Technology and Regulatory
Council, Washington, D.C. Available at: http://www.itrcweb.org/EMD-
2/Content/Resources/EMD2.pdf.
ITRC. 2015. “Remediation Management of Complex Sites” (website). Interstate Technology
and Regulatory Council, Washington, D.C. Available at: http://www.itrcweb.org/
Team/Public?teamID=64.
Johnson, C.D., M.J. Truex, and T.P. Clement. 2006. Natural and Enhanced Attenuation of
Chlorinated Solvents Using RT3D. PNNL-15937, Pacific Northwest National
Laboratory, Richland, Washington.
Johnson, C.D. and M.J. Truex. 2006. RT3D Reaction Modules for Natural and Enhanced
Attenuation of Chloroethanes, Chloroethenes, Chloromethanes, and Daughter
Products. PNNL-15938, Pacific Northwest National Laboratory, Richland, WA.
Looney, B.B., F.H. Chapelle, T.O. Early, K.M. Vangelas, K. Adams, and C.H. Sink. 2006.
Mass Balance: A Key to Advancing Monitored and Enhanced Attenuation for
Chlorinated Solvents. WSRC-STI-2006-00082, Washington Savannah River
Company, Aiken, SC.
Minsker, B., Y. Zhang, R. Greenwald, R. Peralta, C. Zheng, K. Harre, D. Becker, L. Yeh, and K.
Yager. 2004. Final Technical Report for the Application of Flow and Transport
Optimization Codes to Groundwater Pump and Treat Systems (Three Volumes).
ESTCP Project CU-0010, Environmental Security Technology Certification Program,
U.S. Department of Defense, Washington, D.C. Available at www.serdp-estcp.org/.
NRC. 2003. Environmental Cleanup at Navy Facilities: Adaptive Site Management. National
Research Council, National Academies Press, Washington, D.C.
NRC. 2013. Alternatives for Managing the Nation’s Complex Contaminated Groundwater
Sites. National Academy of Sciences, Washington, D.C.
Rivett, M.O., S.W. Chapman, R.M. Allen-King, S. Feenstra, and J.A. Cherry. 2006. “Pump-
and-Treat Remediation of Chlorinated Solvent Contamination at a Controlled Field-
Experiment Site.” Environ. Sci. Tech., 40:6770–6781.
73
Sale, T., and C. Newell. 2011. A Guide for Selecting Remedies for Subsurface Releases of
Chlorinated Solvents. ESTCP ER-200530, Environmental Technology Security
Certification Program, Alexandria, Virginia. Available at: https://www.serdp-
estcp.org/content/download/10883/137620/file/ER-200530-DG.pdf.
Truex, M.J. and C.D. Johnson. 2013. I-5 Pump-and-Treat System Performance Assessment.
Public Works, Joint Base Lewis McChord, Washington.
Truex, M.J. and C.D. Johnson. 2013. I-5 Pump-and-Treat System Performance Assessment.
Public Works, Joint Base Lewis McChord, Washington.
Truex, M.J., C.D. Johnson, and C.R. Cole. 2006. Numerical Flow and Transport Model for the
Fort Lewis Logistics Center. DSERTS NO. FTLE-33, Fort Lewis Public Works, Fort
Lewis, Washington.
Truex, M.J., V.R. Vermeul, C.D. Johnson, B.N. Bjornstad, and R.D. Mackley. 2008. Fort Lewis
Sea Level Aquifer Pump-and-Treat System: Extraction and Monitoring Well
Installation Report. Fort Lewis Public Works, IMNW-LEW-PWE, MS 17 Box
339500, Fort Lewis, Washington.
Truex, M.J., P.V. Brady, C.J. Newell, M. Rysz, M. Denham, and K. Vangelas. 2011. The
Scenarios Approach to Attenuation Based Remedies for Inorganic and Radionuclide
Contaminants. SRNL-STI-2011-00459, Savannah River National Laboratory, Aiken,
SC. Available at: https://clu-in.org/download/techfocus/na/NA-SRNL-STI-2011-
00459.pdf.
USACE. 2000. Operation and Maintenance of Extraction and Injection Wells at HTRW Sites.
EP 1110-1-27, U.S. Army Corps of Engineers, Washington, D.C.
USACE. 1999. Ground Water Extraction System Subsurface Performance Checklist. U.S.
Army Corps of Engineers, Washington, D.C. Available at:
http://www.hnc.usace.army.mil/Portals/65/docs/Directorates/EMCX/Checklists/Grou
nd%20Water%20Extraction%20System.pdf.
USGS. 2003. Methodology for Estimating Times of Remediation Associated with Monitored
Natural Attenuation. Water Resources Investigations Report 03-4057, U.S.
Geological Survey, Reston, Virginia.
White, M.D., D. Appriou, D.H. Bacon, Y. Fang, V. Freedman, M.L. Rockhold, C. Ruprecht, G.
Tartakovsky, S.K. White, and F. Zhang. 2015a. STOMP Online User Guide. Pacific
Northwest National Laboratory, Richland, Washington. Available at
http://stomp.pnnl.gov/user_guide/STOMP_guide.stm.

74
White, M.D., D. Appriou, D.H. Bacon, Y. Fang, V. Freedman, M.L. Rockhold, C. Ruprecht, G.
Tartakovsky, S.K. White, and F. Zhang. 2015b. eSTOMP Online User Guide.
Pacific Northwest National Laboratory, Richland, Washington. Available at
http://stomp.pnnl.gov/estomp_guide/eSTOMP_guide.stm.
Widdowson, M.A., E. Mendez III, F.H. Chapelle, and C.C. Casey. 2005. Natural Attenuation
Software (NAS) User’s Manual, Version 2. Virginia Tech, United States Geological
Survey (USGS), and Naval Facilities Engineering Command. Available at:
http://www.nas.cee.vt.edu/index.php.
Wiedemeier, T., J. Wilson, D. Kampbell, R. Miller, and J. Hansen. 1999. Technical Protocol
for Implementing Intrinsic Remediation with Long-Term Monitoring for Natural
Attenuation of Fuel Contaminations Dissolved in Groundwater. Air Force Center for
Environmental Excellence, Technology Transfer Division, Brooks Air Force Base,
San Antonio, Texas.

Appendix A
Case Studies


A.1
Appendix A: Case Studies
Initiate Remedy Closure
Case Study 1: Norton AFB, Riverside, CA
– Dave Becker, U.S. Army Corps of Engineers Environmental and Munitions
Center of Expertise
Transition P&T to MNA
Case Study 2A: Tooele Army Depot; Tooele, UT
– Dave Becker, U.S. Army Corps of Engineers Environmental and Munitions
Center of Expertise
Case Study 2B: Idaho National Laboratory Test Area North Site, ID
– Hope Lee, Pacific Northwest National Laboratory
Continue P&T
Case Study 3: Fernald Site, Harrison, OH
– Ken Broberg, Stoller Newport News Nuclear
Supplement P&T with Other Treatment Technologies
Case Study 4: Former Cornhusker Army Ammunition Plant, Grand Island, NE
– Dave Becker, U.S. Army Corps of Engineers Environmental and Munitions
Center of Expertise
Transition to a New Remedy Approach
Case Study 5A: Nebraska Superfund Site; Grand Island, NE
– Dave Becker, U.S. Army Corps of Engineers Environmental and Munitions
Center of Expertise
Case Study 5B: Vineland Chemical Superfund; Vineland, NJ
– Dave Becker, U.S. Army Corps of Engineers Environmental and Munitions
Center of Expertise
Case Study 5C: Commencement Bay - South Tacoma Channel Superfund Site,
Tacoma, WA
– Tamzen Macbeth, CDM Smith and Kira Lynch EPA Region 10
Case Study 5D: Del Norte Superfund, Crescent City, CA
– Dave Becker, U.S. Army Corps of Engineers Environmental and Munitions
Center of Expertise
Note that these case studies illustrate the type of outcomes described in this document.
However, they do not illustrate the specific performance assessment approach because they
represent P&T outcomes determined prior to publication of this document.

A.2

A.3
Case Study 1: Norton Air Force Base
Key Points
Transitioned P&T to remedy closure
The contaminant source area was addressed with excavation and SVE.
The plume declined during P&T application.
A concentration rebound study (while the P&T system was shut down) showed
concentrations remained below the RAOs with limited exceptions near the former source.
The P&T system was terminated based on meeting RAOs with minor areas of
exceedance declining and having no risk.
Monitoring after P&T system termination verified continued decline of contamination.
Description
The former Norton Air Force Base (AFB) in San Bernardino, California was placed on the
National Priorities List in 1987 because of the Central Base Area (CBA) and Base Boundary
(BB) TCE groundwater plumes and the associated source contamination in the vadose zone. The
Air Force addressed the contamination in the 1990s with 1) source area excavation, 2) soil vapor
extraction, and 3) two P&T systems. Excavation and off-site disposal of 4200 cubic yards of
TCE-contaminated soil was conducted in 1991. The SVE system operated from 1995 to 1997
and removed approximately 7,500 lbs of TCE during that time. The P&T systems were installed
in 1992 and 1995, with both systems using air stripping for the aboveground treatment.
The former Norton AFB is located in the Bunker Hill groundwater basin, and consists of
multiple high-permeability aquifers, typically developed for water supply to a maximum depth of
1000 feet. The water-bearing zones were categorized into shallow (as little as 57 feet below the
surface), intermediate, and deep zones. The groundwater plumes primarily affected the shallow
zone, with some impact to the intermediate zone at locations off-base. The deep zone was not
affected. Institutional controls prohibited groundwater extraction on the former base for any
purposes other than remediation.
The CBA P&T system was meant to accomplish mass reduction at concentration hot spots
rather than containment. The Base Boundary system was meant to contain and clean up the off-
site plume. The presence of cis-1,2-DCE provided evidence that some biodegradation was
occurring at the site. A “rebound” test was conducted around year 2000 while the P&T system
was shut down. Essentially no rebound was observed during the one-year period. An
independent optimization review conducted under Air Force direction in 2002 found that the
CBA system had accomplished its goal of mass reduction and only minor exceedances of
standards (42 µg/L of TCE versus the MCL of 5 µg/L) remained in the immediate vicinity of the
source area. Furthermore, the BB system had largely reduced all concentrations below cleanup
goals. As a result of the evaluation, the recommendation was to discontinue all P&T operations.

A.4
The remaining CBA plume was determined to be stable and would not migrate outside of the
former base boundary at levels above the applicable cleanup standards.
Per the recommendations, the P&T systems were shut down and permanently decommis-
sioned in 2005. As of 2011, contamination was not detected at levels above the cleanup goals at
any locations within the former plume boundaries.
Case Study Decision Element Summary
Decision Elements Site-Specific Assessment
Contaminant concentrations and trends Plume declined to meet RAOs, confirmed with a rebound study
Contaminant mass discharge from source areas or at selected plume locations
Not used
The attenuation capacity of the aquifer Not used
Estimated future plume behavior and time to reach RAOs for the site
At the time of shutdown, the assessment estimated that the plume would meet RAOs with no action
P&T system design, operational, and cost information
Not used
Additional Information:
The EPA cleanup profile for the site is available at
http://yosemite.epa.gov/r9/sfund/r9sfdocw.nsf/ViewByEPAID/CA4570024345#descr.
Dave Becker, U.S. Army Corps of Engineers Environmental and Munitions Center of Expertise

A.5
Case Study 2A: Tooele Army Depot
Key Points
Transitioned P&T to MNA
Chlorinated solvent contaminant source area was initially addressed with capping of
former disposal sites and SVE.
The plume declined during P&T application.
The project team anticipated that the plume would be stable without P&T.
The P&T system was shut down and monitoring was initiated to verify natural
attenuation performance.
MNA is underway with some hot-spot treatment being applied (air sparging) to reduce
contaminant source flux into parts of the plume.
MNA is continuing with contingencies identified for use if plume expansion occurs.
Description
A large groundwater plume of TCE, carbon tetrachloride, and several other chlorinated
solvents was discovered at the Tooele Army Depot, Tooele, Utah in the late 1980s. The plume
was found to extend outside of the northern Depot boundary. The contamination was related to
discharge of industrial wastewater from maintenance of military equipment and munitions at the
Depot, which started in 1942. Wastes were discharged until the late 1980s into a sanitary
landfill, unlined ditches, and, later, to industrial waste lagoons. Much of the industrial activities
were discontinued in the early 1990s. Remediation of the subsurface at the Depot is
administered under a RCRA permitting process and several aspects were initiated in the early
1990s. A P&T system was installed in 1993, becoming fully operational in 1994. Other actions
were initiated to control mass flux to the groundwater, including capping of the former ditches,
lagoons, and landfill. More recently, soil vapor extraction has also been conducted to address
contaminant mass and vapors in the deep vadose zone (more than 300 feet thick in places).
The site is located in the Tooele Valley, part of the Great Salt Lake drainage area, and is
generally underlain by coarse-grained alluvial fan deposits shed from surrounding mountains.
These coarse materials are inter-bedded in places with finer-grained materials, including lake
deposits. Overall, the unconsolidated materials are over 600 feet thick. In areas, fault-bounded
bedrock highs of limestone and quartzite extent to near the surface within the boundaries of the
plume, thus complicating groundwater flow. Faults appear to act as barriers to groundwater
flow; when oriented perpendicular to the direction of groundwater flow, very steep gradients
across faults are observed. The plume has affected a significant thickness of saturated
unconsolidated materials, as well as bedrock.
The P&T system had a goal of both containment of the downgradient edge of the plume and
the restoration of the aquifer. Hence, extraction wells were placed within the plume, as well at
its downgradient end. High pumping rates were applied (approximately 5,500 gpm) and

A.6
extracted water was treated by air stripping prior to downgradient injection back into the aquifer
for hydraulic control purposes.
P&T system operation resulted in a “pull-back” of the plume from off-site locations and
some concentration reductions at locations in the plume interior. An Army-sponsored evaluation
in the mid-2000s suggested that there was little benefit to the continued operation of the P&T
system. The evaluation concluded that the plume would be relatively stable under non-pumping
conditions. As a result of these suggestions, a “non-operations” test was conducted starting in
2004 by turning off the P&T system and carefully monitoring the plume. The system remains
off and plans are being made for the decommissioning the P&T system because the plume
appears to be stable. Contingency actions are identified in case the plume was observed to
migrate outside of a defined management area.
Natural attenuation by cometabolic and abiotic processes is being investigated at the site to
assess the future fate of the plume. A robust groundwater model for the site has been developed
and is routinely updated. The model does not yet include degradation processes, but if the
outcome of studies on attenuation process indicates that such processes are important, then the
model will be updated accordingly. Hot-spot source-area treatment of groundwater using air
sparging is being conducted at select locations to reduce downgradient mass discharge.
Transition to MNA was initiated with contaminant concentrations above the cleanup goals.
Steps have been taken for targeted reduction of hot spots and study is underway to verify the
attenuation capacity. Contingent actions involving technologies other than P&T are proposed if
the plume migrates outside of the management area.
Case Study Decision Element Summary
Decision Elements Site-Specific Assessment
Contaminant concentrations and trends Plume declined with P&T.
Contaminant mass discharge from source areas or at selected plume locations
Conducted a rebound test to assess plume stability
The attenuation capacity of the aquifer Conducted a rebound test to assess plume stability. Studies underway to verify attenuation processes and capacity
Estimated future plume behavior and time to reach RAOs for the site
Estimate MNA will control the plume, but have identified contingency actions such as hot-spot treatment.
P&T system design, operational, and cost information
Not used
Additional Information:
The Installation Action Plan for the site is available at
http://www.aec.army.mil/Portals/3/IAP/UT-TEAD.pdf.
Dave Becker, U.S. Army Corps of Engineers Environmental and Munitions Center of Expertise

A.7
Case Study 2B: Idaho National Laboratory Test Area North (TAN) Site
Key Points
Transitioned P&T to MNA
A three-component remedy was initiated with bioremediation of the source zone, P&T of
the plume core, and MNA for the distal plume.
The plume core targeted by P&T declined during P&T application.
A natural attenuation analysis suggested the plume would be stable without P&T of the
plume core.
The P&T system was shut down and monitoring has verified natural attenuation
performance.
Description
The Test Area North (TAN) site at the U.S. Department of Energy’s Idaho National
Laboratory (INL) was used for historical nuclear fuel operations and heavy metal manufacturing.
From 1953 to 1972, liquid wastes and sludge from experimental facilities were disposed of to the
aquifer via an injection well at the site. The subsurface aquifer at the site is both deep and
complex, within fractured basalt. The wastes were primarily industrial and sanitary wastewater,
but also included organic, inorganic, and low-level radioactive constituents. In 1987, PCE and
TCE were detected in wells used to supply drinking water to workers at TAN and the ground-
water contamination was traced to the injection well. In 1989, TAN was included on the
National Priorities List and a remedial investigation/feasibility study (RI/FS) was completed in
1995. The RI/FS identified PCE, TCE, DCE, and some radionuclides as contaminants of
concern. The chlorinated solvent groundwater plume is nearly 3 km long and 0.8 km wide.
Several initial remedial actions were employed to address the contamination at the TAN site,
with concurrent investigation and development of a conceptual site model. Early remediation
activities included removal of some of the waste sludge from the injection well. An interim
pump-and-treat system was installed downgradient from the waste injection well and it was
operated from about 1996 to 1998 to create a hydraulic barrier to prevent contaminant migration.
The conceptual site model for TAN continued to be refined through an iterative process of
identifying the data requirements needed to understand the fate and transport parameters and
identifying further (or continuing) data gaps.
The site consists of three separate contamination zones, with different remediation approaches
evaluated for each zone. The contamination zones included 1) the source (hot spot) around the
waste injection well, with initial TCE concentrations greater than 20,000 µg/L, 2) a medial zone
of groundwater contamination with TCE concentrations between 20,000 to 1,000 µg/L extending
downgradient from the source zone, and 3) a distal portion of the TCE plume with concentrations
less than 1,000 µg/L. Remediation approaches selected for these zones and incorporated in a
2001 ROD Amendment included: 1) in situ bioremediation for the source zone, 2) groundwater
P&T for the medial zone, and 3) monitored natural attenuation for the distal zone.

A.8
The medial zone P&T system was operated from 2001 to 2005, resulting in TCE
concentrations decreasing to approximately 100 µg/L. A rebound test was conducted from 2005
to 2007 and evaluation of that data suggested that operating the P&T system on a pulsed-
pumping strategy (i.e., cycles of operation and standby modes) would produce optimal reduction
of contaminant concentrations. In addition, a tracer-corrected method was applied to estimate an
attenuation half-life for the contaminants. Biological attenuation mechanisms were evaluated
using a novel suite of assays, including DNA, enrichment cultures, and enzyme activity probes,
to reveal that indigenous microorganisms were significantly contributing to natural attenuation.
Transition to MNA was initiated using rebound data from the medial P&T area and the
attenuation rate data to demonstrate that the plume would not increase beyond an acceptable size
after cessation of P&T operations. The data showed that the plume had been diminished to the
point where P&T operations could be terminated and that MNA would meet the site RAOs.
Continued monitoring, as part of the MNA remedy, has been used to verify remedy performance.
Case Study Decision Element Summary
Decision Elements Site-Specific Assessment
Contaminant concentrations and trends Plume declined with P&T.
Contaminant mass discharge from source areas or at selected plume locations
Conducted a rebound test to assess plume stability
The attenuation capacity of the aquifer
Conducted a rebound test to assess plume stability. A tracer-corrected contaminant concentration study was used to develop attenuation rates. Additional studies verified attenuation processes.
Estimated future plume behavior and time to reach RAOs for the site
Evaluation showed that plume would not increase beyond an acceptable size with P&T terminated.
P&T system design, operational, and cost information
P&T optimized over time during the remedy
Additional Information:
Dettmers, D.L., T.W. Macbeth, K.S. Sorenson Jr., L.O. Nelson, K.L. Harris, L.N. Peterson, G.D.
Mecham, and J.S. Rothermel. 2006. “Remediation of a TCE Plume Using a Three-Component
Strategy.” Practice Periodical of Hazardous, Toxic, and Radioactive Waste Management,
10(2):116-125.
DOE. 2001. Record of Decision Amendment for the Technical Support Facility Injection Well (TSF-
05) and Surrounding Groundwater Contamination (TSF-23), and Miscellaneous No Action Sites,
Final Remedial Action. U.S. Department of Energy, Idaho Operations Office, Idaho Falls, ID.
DOE. 2010. Annual Report for the Final Groundwater Remediation, Test Area North, Operable
Unite 1-07B, Fiscal Year 2009. U.S. Department of Energy, Idaho Operations Office: Idaho
Falls, ID.
Hope Lee, Pacific Northwest National Laboratory

A.9
Case Study 3: Fernald Preserve Uranium P&T System
Key Points
Continued with optimized P&T
The plume was declining with P&T, but at a decreasing operational effectiveness,
resulting in a longer projected timeframe to reach the RAOs.
New characterization data showed an area with higher uranium concentrations than
initially estimated.
The groundwater model used for the initial P&T design was applied to evaluate
optimization alternatives for the P&T system.
The optimized P&T system is predicted to accelerate cleanup in key portions of the
aquifer and meet site RAOs in a reasonable time, with reduced costs (compared to the
original P&T design).
Description
The Fernald Preserve, 18 miles northwest of Cincinnati, Ohio, overlies the Great Miami
Aquifer (GMA), which the EPA has designated as a sole-source aquifer. A facility at the site
operated from 1952 to 1989 to produce more than 226 million kilograms (kg) of uranium metal
products. In the process of these production operations, the soil, surface water, sediment, and
groundwater on and around the site were contaminated with uranium. In 1991, the site’s mission
was formally changed from uranium production to environmental remediation and restoration
under CERCLA. The cleanup project was divided into Operable Units (OU). OU 5 focused on
environmental media and biological receptors, including groundwater, impacted by site
activities. With the exception of the GMA, completion of the CERCLA remediation was
declared on October 29, 2006, and the site was officially transferred to U.S. DOE Office of
Legacy Management. The final ROD for remedial actions at OU 5 defines a P&T groundwater
remedy for Fernald. Uranium is the principal constituent of concern.
P&T pumping in the GMA began in 1993 from four recovery wells installed in front of the
leading edge of the southernmost uranium plume. The P&T design was updated and expanded
using a groundwater model. By 2005, the P&T system consisted of 23 extraction wells pumping
groundwater at a target overall rate of 18,073 Lpm (4,775 gpm). This system was operated from
2005 through June 2014. In 2012, the site groundwater model was used to assess P&T
performance in light of 1) a characterization effort in 2011 that discovered uranium
concentrations in a portion of the plume that were greater than estimates based on the initial site
data used for the P&T system design, and 2) decreasing operational effectiveness of the P&T
operation. Following EPA guidance (EPA 1992), the trend determined from uranium
concentrations measured at the extraction wells was evaluated each year, along with the 95-
percent upper confidence limit (UCL) for the concentration data. These uranium concentration
trends were compared to the model-predicted trends to evaluate operational effectiveness.

A.10
Because of the observed decline in operational effectiveness, estimates of the cleanup timeframe
were longer than initial predictions.
Sixteen different operational alternatives were modeled using the site groundwater model to
assess the potential for P&T optimization to improve operational effectiveness and shorten
cleanup timeframes. The selected optimized configuration more efficiently addressed the
remaining uranium plume in the aquifer over time, and effectively focuses cleanup on the portion
of the uranium plume that has the greatest potential for migrating outside of DOE property
boundaries. While the initial P&T configuration showed declining performance, the model
predicts that the optimized P&T design will accelerate cleanup in key portions of the aquifer and
meet site RAOs within a reasonable time frame.
Initial results based on the P&T operational changes are promising. As the modeling
predicted, the optimized P&T configuration is removing more uranium from the aquifer.
Additional monitoring of the optimized system is underway to determine the impact that bio-
fouling and plugging will have on the extraction wells at the higher pumping rates and whether
or not continued operation at the higher pumping rates will be cost effective.
Case Study Decision Element Summary
Decision Elements Site-Specific Assessment
Contaminant concentrations and trends Plume declined, but at less than expected rate, and new data identified and area with higher concentrations than initial estimates
Contaminant mass discharge from source areas or at selected plume locations
P&T performance trends compared to groundwater model predictions to assess P&T operational effectiveness
The attenuation capacity of the aquifer Not used
Estimated future plume behavior and time to reach RAOs for the site
Groundwater model used to estimate plume behavior for P&T configuration alternatives
P&T system design, operational, and cost information
Applied optimization evaluation and selected an improved configuration that is predicted to accelerate cleanup in key portions of the aquifer and meet RAOs in a reasonable time, with reduced cost
Reference
EPA. 1992. General Methods for Remedial Operation Performance Evaluations.
EPA/600/R92002, United States Environmental Protection Agency, Ada, Oklahoma.
Additional Information:
Hooten, G., W. Hertel, and K. Broberg. 2015. “Groundwater Remediation at the Fernald Preserve
Cincinnati, Ohio: Modeling and Resulting 2014 Well Field Operational Changes.” In:
Proceedings, Waste Management Symposia 2015, Phoenix, Arizona.
Ken Broberg, Stoller Newport News Nuclear (SN3)

A.11
Case Study 4: Former Cornhusker Army Ammunition Plant
Key Points
Supplemented P&T with another treatment technology.
The site has a long plume of the explosive RDX emanating from different sources.
The contaminant source in vadose zone was addressed with excavation.
P&T was initially applied throughout the plume on site for plume reduction. The
off-site plume was allowed to naturally attenuate.
Injection of a carbon source to bioremediate and diminish the plume has been
implemented to supplement the P&T remedy.
Description
The site is a former ordnance production facility in central Nebraska that operated during
World War II, the Korean War, and the Vietnam War. The Army installation was transitioned
to inactive status in 1973, but the property is gradually being transferred to allow commercial
redevelopment. The site was listed on the National Priorities List in 1987. Investigations
revealed several distinct and overlapping explosives plumes (primarily RDX) emanating from
several sources. The plumes were ultimately found to extend over a distance of six miles,
including a two-mile-long segment off the Army installation. Soils contaminated with
explosives were largely excavated and treated in the mid- to late-1980s.
The site hydrogeology generally consists of surficial silty clay loess overlying sands and
gravels that are approximately 50-100 ft thick. The sand and gravel aquifer is a primary
drinking water source for the surrounding area. Groundwater is nominally found at depths of
approximately 5-10 feet and generally flows east-southeast. The contaminant plume is
within the sand and gravel aquifer. A clay unit underlies the sand and gravel aquifer and no
contamination has been found below this clay to date.
The final remedy for groundwater, documented in a 1994 Record of Decision (ROD),
identified remediation of the contaminant plume using P&T with extraction wells distributed
along the axis of the plume and aboveground treatment by carbon adsorption. The portion of
the remedy on the Army installation began operation in late 1998. A ROD amendment, issued
in 2001, modified the remedy to include natural attenuation of the off-installation portion of
the plume. The treatment plant was initially treating approximately 750 gallons/minute of
extracted water. Over time, several optimization efforts have been implemented for the
extraction system.
Beginning in 2006, a supplemental technology was voluntarily applied to accelerate the
remediation of the on-installation portion of the plume. This supplemental technology is a
bioremediation approach involving injection of a carbon source to stimulate anaerobic
biodegradation of the explosive compounds. Substrate injections are targeted at the higher
contaminant concentration areas. Extraction wells within the plume were incrementally shut

A.12
down as the bioremediation treatment progressed. Extraction is currently being conducted only
at the Army installation boundary. The bioremediation supplemental technology is projected to
reduce the duration of the remedy by approximately 10 years.
Case Study Decision Element Summary
Decision Elements Site-Specific Assessment
Contaminant concentrations and trends The plume was contained but did not decline as rapidly as expected.
Contaminant mass discharge from source areas or at selected plume locations
Not used
The attenuation capacity of the aquifer Assessed empirically to enable use of natural attenuation for the off-installation portion of the plume.
Estimated future plume behavior and time to reach RAOs for the site
The projected remedial timeframe was significantly reduced with application of the supplemental technology.
P&T system design, operational, and cost information
The system was optimized over time. Remedy costs have been reduced through optimization and with the supplemental technology.
Additional Information:
The EPA Region 7 project web site for the project is available at
http://cumulis.epa.gov/supercpad/cursites/csitinfo.cfm?id=0702020.
Project fact sheet available at
http://www.epa.gov/region07/cleanup/npl_files/ne2213820234.pdf.
Dave Becker, U.S. Army Corps of Engineers Environmental and Munitions Center of Expertise

A.13
Case Study 5A: Superfund Site in Nebraska
Key Points
Transitioned from P&T to another treatment remedy
The PCE contaminant source in the vadose zone was addressed with SVE.
P&T was applied at the source area to control contaminant mass discharge, but the plume
did not decline as much as anticipated.
The ROD was amended to a remedy with in situ thermal remediation (ISTR) for the
source area and in situ chemical oxidation (ISCO) or enhanced bioremediation for the
dissolved-phase plume.
The P&T system was terminated and ISCO has been implemented. ISTR planning is
underway for addressing hot spots.
Following ISTR treatment of the source area, other polishing technologies, including
bioremediation or thermally activated persulfate ISCO, may be needed.
Description
The site is a PCE groundwater plume that was identified in 1986 as affecting a municipal
water supply well for a medium-sized city in Nebraska. After additional investigation by EPA,
the primary source of contamination was found to be a former dry cleaner located in the
downtown area, approximately two blocks upgradient of the municipal well. Additional sources
in the area were identified as having had a limited contribution to the groundwater
contamination. The site was listed on the National Priorities List in 1991.
The initial remedy, documented in a 1996 Record of Decision, included application of SVE
(with vapor-phase carbon treatment) for the soils above the water table and P&T for the
groundwater remediation (with ex situ groundwater treatment by air stripping). A new well was
installed just downgradient of the source area to implement the P&T remedy. Until the
implementation of the remedy in 1998, the municipal well was pumped to contain the plume and
the extracted water was directed to either storm drains or the sanitary waste treatment plant.
The site geology generally consists of sands and gravels to a depth of 28 ft below ground
surface (bgs), a silt/silty sand unit from approximately 28 ft down to as deep as 35 ft bgs, and
sands and gravels below to a depth of approximately 90 ft bgs. Within the sands and gravels are
deposits of silty sands and occasional thin clayey sand layers and sandy clay layers.
Groundwater is generally found at depths of approximately 20 feet. The silt/silty sand layer
appears to have had a significant impact on contaminant distribution. The extraction well at the
source was primarily screened below the silt. High contaminant concentrations are still found
above, within, and below the silt/silty sand layer.
The P&T system was operated until 2009 and the SVE system was operated until 2012. A
ROD amendment issued in 2012 changed the remedy to include in situ thermal remediation for
the source area and in situ chemical oxidation or enhanced bioremediation for the dissolved-

A.14
phase plume. The initial injection of permanganate for ISCO treatment of the plume occurred in
2009. Residual oxidant remains at the site. Recent sampling has confirmed that SVE has
successfully removed contaminants in the vadose zone to levels that are not a threat. Design of
in situ thermal remediation for high groundwater concentrations under and immediately
downgradient of the dry cleaners is underway.
The transition to an alternate set of technologies was spurred by various optimization
analyses and the recognition that the P&T system was not achieving progress in diminishing the
plume at the expected rate.
Case Study Decision Element Summary
Decision Elements Site-Specific Assessment
Contaminant concentrations and trends Plume did not decline significantly
Contaminant mass discharge from source areas or at selected plume locations
Not used
The attenuation capacity of the aquifer Not used
Estimated future plume behavior and time to reach RAOs for the site
Estimated P&T would not meet goals in a reasonable time
P&T system design, operational, and cost information
Evaluated optimization and determined other treatment processes would be more effective.
Additional Information:
The most recent five-year review for the site is available at
http://www.nwk.usace.army.mil/Missions/Environmental/EnvironmentalProjects/NOP.aspx.
Dave Becker, U.S. Army Corps of Engineers Environmental and Munitions Center of Expertise

A.15
Case Study 5B: Vineland Chemical Superfund Site
Key Points
Transitioning P&T to another treatment remedy
Arsenic contamination from herbicide/fungicide manufacturing was addressed through
soil excavation/washing and groundwater P&T.
An optimization study in 2010 suggested evaluation of arsenic immobilization in lieu of
continued P&T.
Subsequent detailed characterization of the site geochemistry led to an improved
conceptual site model and bench testing of multiple approaches to arsenic immobilization
was conducted.
A pilot test of air sparging to cause arsenic immobilization is in progress.
Sparging may replace or supplement P&T. There is the potential for significant cost
savings while having comparable performance.
Description
The site is a former arsenical herbicide/fungicide manufacturing facility that was added to the
National Priority List in 1984. Arsenic contamination affected site soils, groundwater, and off-
site sediments associated with the adjacent Blackwater Branch stream and the Maurice River
downstream of its confluence with the Blackwater Branch stream.
The initial remedy specified in the 1989 Record of Decision included building demolition,
soil flushing (later changed to excavation and soil washing), sediment removal (some sediment
also underwent soil washing), and P&T. Building demolition was ultimately completed in 2004.
Soil washing for treatment of on-site soils and work on the Blackwater Branch adjacent to the
site was completed by 2010. The P&T system was installed largely as a containment system to
prevent migration of arsenic-contaminated groundwater to the Blackwater Branch stream and has
operated since construction was completed in 2000. The P&T system includes multiple
extraction wells and a large treatment system that is capable of treating about 1400 gpm.
The site geology consists largely of sands and gravels of the Cohansey Sand. Hydraulic
conductivity values are very high (ranging to over 700 ft/day). A low-permeability interval, 10-
25 feet thick and informally termed the “Banded Zone,” separates a shallow aquifer from an
intermediate aquifer. The geochemistry of the two aquifers is different and an important
geochemical boundary exists within the Banded Zone. Arsenic contamination has been confined
to the shallow aquifer since 2006. Groundwater tends to flow toward the Blackwater Branch
stream; however, the flow directions are strongly affected by active extraction operations.
Groundwater is generally encountered within 15 feet of the surface in most locations near the
extraction system.
An early study, including a field pilot test, was conducted to assess the potential to enhance
the mobility of arsenic in the saturated zone. The pilot test results were ambiguous and the

A.16
concept has not been pursued since then. A 2010 optimization study conducted at the request of
EPA evaluated the remedy and suggested the P&T system could be replaced by in situ
stabilization of the arsenic and still protect the Blackwater Branch stream. Subsequent studies
have greatly elucidated the site geochemical conditions, stream/groundwater interaction, and
possible approaches to arsenic immobilization. As a part of the transition evaluation, current
pilot testing is being conducted to evaluate air sparging as a means to sequester arsenic, with
promising results.
The transition to an immobilization remedy, driven by air sparging, would allow termination
of P&T operations and would result in a large cost reduction. At a minimum, it would allow a
substantial reduction in pumping, with a lesser, but still significant, savings for treatment system
operations.
Case Study Decision Element Summary
Decision Elements Site-Specific Assessment
Contaminant concentrations and trends Plume was contained with P&T, but was not declining
Contaminant mass discharge from source areas or at selected plume locations
Not used
The attenuation capacity of the aquifer Not used
Estimated future plume behavior and time to reach RAOs for the site
Evaluated impact of geochemistry on plume behavior to identify an alternative treatment approach.
P&T system design, operational, and cost information
Cost/benefit of alternative treatment technology better than P&T
Additional Information:
The Remediation System Evaluation report for the site is available at
http://epa.gov/tio/download/remed/rse/vineland-rse-final.pdf.
Dave Becker, U.S. Army Corps of Engineers Environmental and Munitions Center of Expertise

A.17
Case Study 5C: Commencement Bay - South Tacoma Channel Superfund Site
Key Points
Supplementing P&T to enable transition to MNA
P&T was selected as a remedy for groundwater contamination by chlorinated solvents.
P&T has partially contained the source area plume, but the plume has not declined.
A combination of excavation, thermal treatment, and bioremediation is being applied to
reduce the source and plume to meet revised remedial action objectives (RAOs) that
include a specified contaminant mass discharge (CMD) goal that will enable transition to
MNA.
Evaluated CMD coming into different extraction wells within the P&T system as a means
of quantifying significance of source strength and selecting thermal and bioremediation
treatment areas.
Modified operation of the P&T system to monitor CMD of the source remedy and
determine compliance with the CMD goal.
Description
The Well 12A site is located in Tacoma, Washington approximately 4 miles southwest of the
southernmost tip of Commencement Bay. Contamination was introduced to an aquifer from
former oil recycling operations that include releases of petroleum hydrocarbons and chlorinated
solvents as non-aqueous-phase liquids (NAPLs). The site encompasses the source of
contamination at the property of the former Time Oil Company and the dissolved phase plume
impacts the City of Tacoma’s production Well 12A. The contaminants of concern at the site are
tetrachloroethene (PCE), trichloroethene (TCE), cis1,2dichloroethene (DCE), trans-1,2-DCE,
vinyl chloride (VC), and 1,1,2,2-tetrachloroethane (PCA). TCE is considered to be the most
prevalent compound. Dense non-aqueous-phase liquid (DNAPL) has been identified in some
portions of the aquifer. These zones and a silt layer within the glacial outwash/till hydrogeology
of the subsurface act as a continuing source to a plume traveling downgradient in the gravel-
dominated zones of the aquifer. These persistent sources are spread over an area of about 16,500
m2.
The original 1983 Record of Decision (ROD) involved the installation of an air stripping
system to treat contaminated groundwater for Well 12A. A ROD amendment in 1985 included
excavation of contaminated soils at the site, installation of a P&T system near the source area,
excavation of about 5,000 cubic yards of filter cake, and installation of a SVE system for a
portion of the source zone that removed approximately 54,100 pounds of VOCs. Over a P&T
operational period of over 20 years, the system extracted approximately 860 million gallons and
removed approximately 19,000 pounds of VOCs, partially contained the source area plume, but
did not significantly diminish the extent of the plume. Source depletion, while occurring, was
slow and would likely not meet RAOs.

A.18
A 2009 ROD Amendment selected an amended remedy and developed additional RAOs.
The amended remedy includes soil contamination reduction and use of thermal treatment and
bioremediation to diminish the source of contaminants in the groundwater with the goal of
reducing CMD sufficiently to allow for transition of the active remedy (including the P&T
system) to passive long-term monitoring. A source-reduction target expressed as a CMD
objective was included in the ROD. An attenuation evaluation estimated contaminant
degradation along the flowpath from the source area to the Well 12A receptor. Based on the
estimated natural attenuation capacity of the system, it was determined that a 90% reduction in
CMD from the source would be sufficient to allow for attenuation to reduce concentrations to
MCLs before impacting the Well 12A receptor. This also would trigger when the source P&T
containment system would no longer be needed to protect the receptor and operations could be
shut down. Monitoring during and after the source reduction effort will be used to quantify
CMD and verify assumptions of the aquifer attenuation capacity as input to a decision to
transition to long-term monitoring.
The source reduction effort is being implemented using targeted actions selected as
appropriate for the different source conditions present at the site. For more saturated DNAPL
zones, responsible for the majority of contaminant discharged to the P&T system, in situ thermal
treatment was applied to volatilize and extract the DNAPL. For the discrete residual DNAPL
hotspots and diffused and sorbed contaminant mass in an extensive silt zone acting as a
secondary source of aquifer contamination, , bioremediation using a substrate combining
vegetable oil, ethyl lactate, and sodium bicarbonate is being applied. Shear-thinning fluid is also
being used to promote improved distribution of the substrate to the silt zone. At two localized
DNAPL hot spots within the bioremediation treatment area, a low-energy thermal system is
being used to accelerate the DNAPL treatment rates.
Detailed hydraulic and capture zone assessment of the P&T system led to modifications to its
operation such that it could be used to measure CMD for evaluating compliance of the ROD-
specified interim objectives. Once the interim objectives are achieved, the active treatment phase
(including P&T system) will be shut down and the source area of the site transitioned to long-
term monitoring.

A.19
Case Study Decision Element Summary
Decision Elements Site-Specific Assessment
Contaminant concentrations and trends Plume was partially contained but did not decline with P&T
Contaminant mass discharge from source areas or at selected plume locations
Analyses determined a CMD value that would enable transition for P&T to MNA and was used as a remediation objective for source reduction in the site ROD. Used CMD at individual P&T system wells in conjunction with other site data to evaluate strength of multiple sources for mapping treatment technologies.
The attenuation capacity of the aquifer An estimate of natural attenuation was coupled with the CMD evaluation to define the target CMD for transition to MNA.
Estimated future plume behavior and time to reach RAOs for the site
If the target CMD is reached, MNA may be sufficient to contain the plume and meet RAOs. Additional monitoring will be applied to support a future decision to transition from P&T to MNA after source reduction has been implemented.
P&T system design, operational, and cost information
The ROD considered a comparison of cost/benefit for continued P&T to the cost/benefit for source reduction combined with P&T and later transition to MNA.
Additional Information:
The ROD Amendment for the site is available at
http://www.epa.gov/region10/pdf/sites/cb-stc/well12a_rod_amend_oct2009.pdf.
Tamzen Macbeth (CDM Smith) and Kira Lynch (EPA Region 10)

A.20
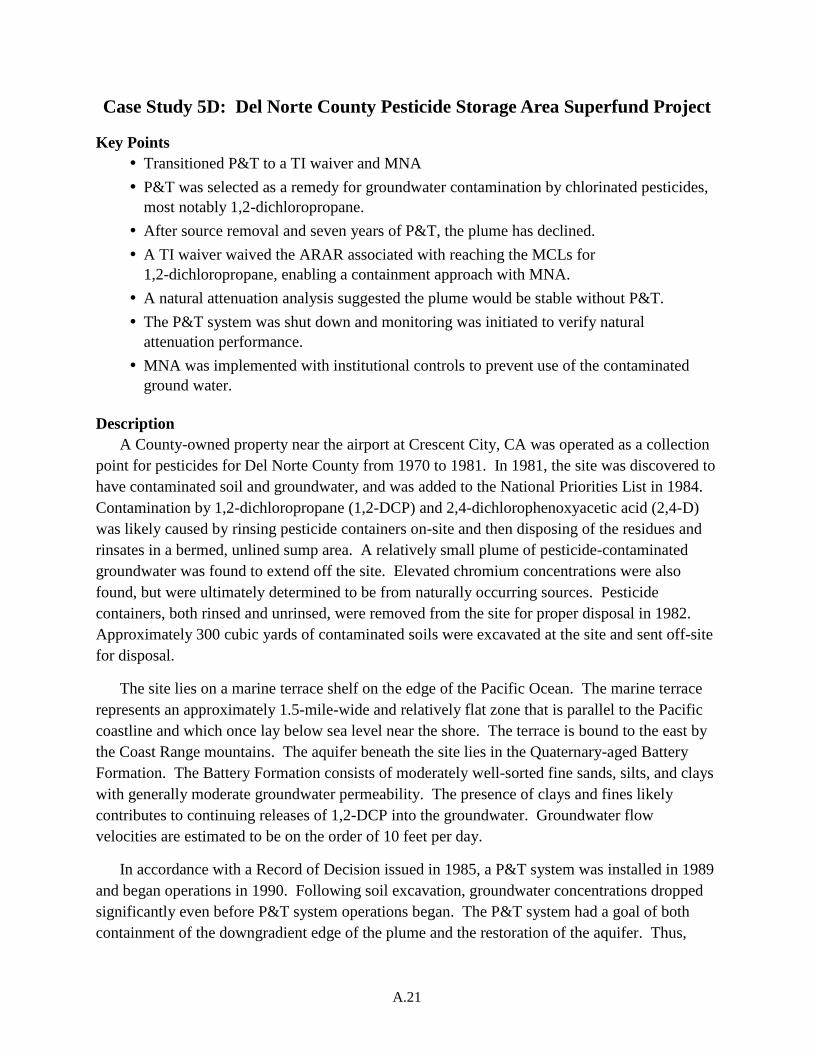
A.21
Case Study 5D: Del Norte County Pesticide Storage Area Superfund Project
Key Points
Transitioned P&T to a TI waiver and MNA
P&T was selected as a remedy for groundwater contamination by chlorinated pesticides,
most notably 1,2-dichloropropane.
After source removal and seven years of P&T, the plume has declined.
A TI waiver waived the ARAR associated with reaching the MCLs for
1,2dichloropropane, enabling a containment approach with MNA.
A natural attenuation analysis suggested the plume would be stable without P&T.
The P&T system was shut down and monitoring was initiated to verify natural
attenuation performance.
MNA was implemented with institutional controls to prevent use of the contaminated
ground water.
Description
A County-owned property near the airport at Crescent City, CA was operated as a collection
point for pesticides for Del Norte County from 1970 to 1981. In 1981, the site was discovered to
have contaminated soil and groundwater, and was added to the National Priorities List in 1984.
Contamination by 1,2-dichloropropane (1,2-DCP) and 2,4-dichlorophenoxyacetic acid (2,4-D)
was likely caused by rinsing pesticide containers on-site and then disposing of the residues and
rinsates in a bermed, unlined sump area. A relatively small plume of pesticide-contaminated
groundwater was found to extend off the site. Elevated chromium concentrations were also
found, but were ultimately determined to be from naturally occurring sources. Pesticide
containers, both rinsed and unrinsed, were removed from the site for proper disposal in 1982.
Approximately 300 cubic yards of contaminated soils were excavated at the site and sent off-site
for disposal.
The site lies on a marine terrace shelf on the edge of the Pacific Ocean. The marine terrace
represents an approximately 1.5-mile-wide and relatively flat zone that is parallel to the Pacific
coastline and which once lay below sea level near the shore. The terrace is bound to the east by
the Coast Range mountains. The aquifer beneath the site lies in the Quaternary-aged Battery
Formation. The Battery Formation consists of moderately well-sorted fine sands, silts, and clays
with generally moderate groundwater permeability. The presence of clays and fines likely
contributes to continuing releases of 1,2-DCP into the groundwater. Groundwater flow
velocities are estimated to be on the order of 10 feet per day.
In accordance with a Record of Decision issued in 1985, a P&T system was installed in 1989
and began operations in 1990. Following soil excavation, groundwater concentrations dropped
significantly even before P&T system operations began. The P&T system had a goal of both
containment of the downgradient edge of the plume and the restoration of the aquifer. Thus,

A.22
extraction wells were placed within the plume, as well at its downgradient end. Pumping rates
were high, approximately 5,500 gpm and extracted groundwater was treated by air stripping
before being injected back into the aquifer at a downgradient location.
The P&T system was operated for seven years, after which time the system was shut down
because it was believed the plume was stable and that dispersion, sorption, and other processes
would hold the 1,2-DCP plume boundary in check. Concentrations of other contaminants had
been reduced to levels below their respective standards. A 2000 ROD amendment was issued
that changed the remedy to MNA. A technical impracticability (TI) waiver was issued waiving
the need to attain the 1,2-DCP drinking water standard (MCL) of 5 µg/L everywhere at the site.
Hence, the 2000 ROD amendment also called for the implementation of institutional controls to
prevent the use of groundwater at the site, with MNA containing and slowly diminishing the
plume. The site was delisted from the NPL in 2002, but monitoring is on-going because
1,2DCP concentrations remain above the MCL.
The P&T system diminished the plume, but reaching MCL for 1,2-DCP was not expected in
a reasonable time. However, with a TI waiver that waived the drinking water standard ARAR to
allow for long-term containment, transition to MNA was possible to control the plume.
Transition to MNA was initiated with contaminant concentrations above the cleanup goals.
Institutional controls were used to prevent exposures.
Case Study Decision Element Summary
Decision Elements Site-Specific Assessment
Contaminant concentrations and trends Plume declined with P&T, but expect it will be difficult to reach the MCL for 1,2-DCP
Contaminant mass discharge from source areas or at selected plume locations
Not used
The attenuation capacity of the aquifer Not used
Estimated future plume behavior and time to reach RAOs for the site
MNA is predicted to control the plume, but with 1,2- DCP above the MCL – Used a combination of TI waiver, ICs, and MNA.
P&T system design, operational, and cost information
Not used
Additional Information:
The ROD amendment for the site is available at
http://cumulis.epa.gov/superrods/index.cfm?fuseaction=data.rodinfo&mRod=09009232000AMD113.
Dave Becker, U.S. Army Corps of Engineers Environmental and Munitions Center of Expertise

PNNL-24696
Distribution
No. of No. of
Copies Copies
Distr.1
# Electronic Distribution
Department of Energy Richland
Operations Office
JG Morse (PDF)
US Army Corps of Engineers
DJ Becker (PDF)
# Electronic Distribution
Pacific Northwest National
Laboratory
MJ Truex (PDF)
CD Johnson (PDF)
MH Lee (PDF)
DM Wellman (PDF)