performance assessment of heat exchangers for process heat
TRANSCRIPT

Performance Assessment of Heat Exchangers for Process Heat Integration
Fenwicks Shombe Musonye1,*, Hiram Ndiritu2 and Robert Kinyua3
1Institute of Energy and Environmental Technology, Jomo Kenyatta University of Agriculture and Technology, Nairobi, Kenya2College of Engineering and Technology, Jomo Kenyatta University of Agriculture and Technology, Nairobi, Kenya3Office of the Deputy Vice Chancellor (Academic Affairs), Jomo Kenyatta University of Agriculture and Technology,
Nairobi, Kenya�Corresponding Author: Fenwicks Shombe Musonye. Email: [email protected]
Received: 25 August 2020; Accepted: 01 October 2020
Abstract: Pinch Analysis is an attractive solution for reduction of thermal energycosts in thermo-chemical industries. In this approach, maximum internally reco-verable heat is determined and a heat exchange network is designed to meetthe recovery targets. The thermal performance of a heat exchanger over its life-time is however a concern to industries. Thermal performance of a heat exchangeris affected by many factors which include the physical properties of the shell andtube materials, and the chemical properties of the heat transfer fluid. In this study,thermal performance of shell and tube heat exchangers designed to meet heatrecovery targets in a Pinch Analysis study is simulated. The aim of this paperis to present predictions of thermal performances of shell and tube heat exchan-gers with different heat transfer fluids and geometries as they undergo foulingdegradation. Engineering approaches based on thermodynamic analysis, heat bal-ance and Kern Design equations, as well as what-if simulation modeling are usedin this work. Shell and tube heat exchangers were designed to meet internal heatrecovery targets for three process plants, A, B and C. These targets were pub-lished in a separate paper. The effects of degradation of the tubes-due to incre-mental growth of fouling resistance - on thermal performance of the exchangerwere simulated using Visual Basic Analysis (VBA). Overall, it was found thatgrowth in fouling reduces thermal efficiency of shell and tube heat exchangerswith an exponential relationship. An increase of 100% of fouling resistance leadsto an average reduction of 0.37% heat transfer. Higher values of logarithmic meantemperature difference (LMTD) and higher ratios of external diameter to internaldiameter of the exchanger tubes amplify the effect of fouling growth on thermalperformance of the exchangers. The results of this work can be applied in pinchanalysis, during design of heat exchangers to meet the internal heat recovery tar-gets, especially in predicting how fouling growth can affect these targets. This canalso be useful in helping operators of shell and tube heat exchangers to determinecleaning intervals of the exchangers to avoid heat transfer loss.
Keywords: Pinch analysis; internal heat recovery; thermal performance; foulingresistance; fouling growth; what if simulation; shell and tube heat exchangers
This work is licensed under a Creative Commons Attribution 4.0 International License, whichpermits unrestricted use, distribution, and reproduction in any medium, provided the originalwork is properly cited.
Energy EngineeringDOI:10.32604/EE.2021.013890Article
echT PressScience

1 Introduction
Costs of production of goods and services have been increasing, partly due to increase in the energycosts. The energy cost is associated both with the fuel and electricity purchase prices and theenvironmental degradation [1]. Pinch analysis is one of the process integration tools used to reduceenergy consumption in thermo-chemical plants. The tool reduces costs through minimization of energyrequired in the processes [2]. It involves process energy balance, energy targeting and design of heatexchanger network to meet the computed energy targets [3].
Pinch analysis was first used in 1978 [4] and since then, various improvements have been suggested,with some of them successfully implemented. Some of these improvements and suggestions werehighlighted in work published by [5], which include the shift from process to site wide pinch analysis, theuse of stream specific values of temperature difference and a combination of principles of mathematicalprogramming and pinch analysis. Significant improvements resulting from these suggestions have beendemonstrated to work in energy targeting phases of pinch analysis. These include a combination of energyand pinch analysis [6,7], total site targeting and the use of stream specific minimum temperature difference [8].
Published work on design and simulation of heat recovery network, for example, Becker [9] and Harkinet al. [10] demonstrated that there is potential improvement in combination of mathematical programmingand pinch analysis. However, as observed by reference [5], these designs in pinch analysis have notconsidered all attendant state variables of heat exchanger systems. Various algorithms have been
Nomenclature
Symbol Property Units
Tci Initial temperature of cold stream °C
Tco Target temperature of cold stream °C
Thi Initial temperature of hot stream °C
Tho Target temperature of hot stream °C
_mt Mass flow rate of the cold stream kg/s
_ms Mass flow rate of the hot stream kg/s
Ρt Density of the cold stream kg/m3
Ρs Density of the hot stream kg/m3
Cpt Specific heat capacity of the cold stream kj/kg.°C
Cps Specific heat capacity of the hot stream kj/kg.°C
St Specific gravity of cold stream Dimensionless
Ss Specific gravity of hot stream Dimensionless
µt Dynamic viscosity of cold stream kg·m−1·s−1
µs Dynamic viscosity of hot stream kg·m−1·s−1
Uass Assumed overall coefficient of heat transfer kW/m2.°C
Ks Thermal conductivity of shell side fluid kW/m·°C
Kt Thermal conductivity of tube side fluid kW/m·°C
Kw Thermal conductivity of tube material kW/m·°C
Rt Tube side fouling factor m2.K/W
Rs Shell side fouling factor m2.K/W
2 EE, 2020

developed to make the designing and incorporation of these variables easier. Notable efforts can be found in[11], for alternative Mixed Integer Linear Programming (MILP) formulations and [12], for basic MILPformulations. The authors used MILP equations and executed them using General Algebraic ModellingSystem (GAMS). This is perhaps one of the important steps in improving the shell and tube heatexchanger design in pinch analysis.
From the available published works in pinch analysis [6–12], little attempt has been made to investigatethe ability of shell and tube heat exchangers to meet the computed heat recovery targets, over their lifetime.Thermal performance of the exchangers is bound to change with time, especially in light of growth offouling, as this reduces the heat transfer rate [13].
Some aspects of fouling growth and performance of heat exchangers have been investigated in studiesunrelated to pinch analysis. They however have not centered on thermal performance of shell and tube heatexchanger and neither have such studies elaborated how tube thickness and temperature gradient contributeto the fouling resistance effects severity on thermal performance. In [14] for example, investigation of theeffects of sea water fouling on thermal efficiency of a nuclear power plant was reported. This revealedthat a change in fouling factors from 0.00015 to 0.00035 m2.K/W resulted in decrease of the outputpower and thermal efficiency of the plant by 1.36% and 0.448%, respectively. Effects of fouling of fills ina cooling tower have been studied by [15], where the cooling tower effectiveness and the outlet watertemperatures were modelled. This study used experimental data to validate the model. It was concludedthat fill fouling had a bigger impact in medium sized as opposed to small sized cooling towers, withtemperature decreases of 18.3 per cent and 23.5 per cent. Other studies have focused on fouling, but theywere concerned with computational fluid dynamics modelling of fouling growth [16] and the effects offlow velocity on rate of fouling [17]. Effects of fouling factor on performance of shell and tube heatexchangers-in pinch analysis-can be visualized through the use of Kern Design Equations. The publishedstudies of pinch analysis discussed here do not take into account these equations, thus missing out oncapturing both the actual exchanger area and the fouling factor effects on thermal performance of the same.
This paper seeks to contribute to the research on fouling by assessing the effects of tube side foulinggrowth on thermal performance of shell and tube heat exchangers designed using Kern Design Equations.This assessment includes visual representation of the thermal performance curve and analysis of theeffects of tube thickness and fluid temperature difference on the severity of fouling resistance in heattransfer. The assessment is based on selected 5 shell and tube heat exchangers for three plants, A, B andC. Pinch analysis was carried out in these plants and heat recovery targets were determined. The targetswere published in a separate paper [18].
1.1 Pinch Analysis and Shell and Tube Heat ExchangersPinch analysis is a heat integration approach used to internally recover heat in thermo-chemical process
plants. The analysis involves heat balancing, where the total heating loads for each process stream aredetermined, using the First Law of Thermodynamics. The second stage involves determination ofmaximum possible internally recoverable heat, using the heat cascading method. A heat exchangenetwork is then developed to meet the computed recovery targets. Detailed description of pinch analysiscan be found in [3] and [4].
A heat exchange network is made up of heat exchangers which recover heat from hot streams to coldstreams. Shell and tube heat exchangers are the common types of exchangers used in thermo-chemicalindustries. They are described in [19]. During heat recovery, the fluids in the hot and cold streams in aprocessing plant are conveyed in the tube and the shell sides of the exchanger. Allocation of the fluids toeither sides of the exchanger is based on factors that vary from process to process [20]. In someprocesses, hot fluid can be conveyed in the tube side while in others, it can be conveyed in the shell side.
EE, 2020 3

Fouling in heat exchangers contributes to heat transfer resistance. Growth of fouling depends on the chemicalcharacteristics of the heat transfer fluid, the velocity profile and the temperature [21].
2 Methods
This study was executed in three stages:
i) Extraction of design from the previous pinch analysis studyii) Determination of shell and tube heat exchanger areas using Kern Design Equationsiii) What-if simulation of effects of fouling on quantity of heat transferred
2.1 Data from Previous StudyThis work is a continuation of a pinch analysis study carried out on a sulphonation plant, a dairy
processing plant and an alcohol distillery plant. The plants were named A, B and C, respectively, andthey were described in [18]. The data included the chemical and physical properties of the process streamfluids from the three plants, the heat exchanger material properties and the quantity of heat to berecovered by each exchanger.
2.2 Determination of Heat Exchanger AreasKern Design Equations were used to take into account all the variables attendant to shell and tube
exchanger heat transfer process. The starting point in design of these exchangers is expressed by:
A ¼ Q
Uass � LMTD(1)
where Uass is the estimated overall coefficient of heat transfer. Estimates of U have been published fordifferent fluids.
LMTD is the logarithmic mean temperature difference between the medium exchanging heat,computed as:
LMTD ¼ Thi � TcoÞ � ðTho � Tcið Þln
Thi � TcoTho � Tci
� � (2)
Here,
Thi is the inlet temperature of the hot fluid
Tco is the outlet temperature of the cold fluid
Tho is the outlet temperature of the hot fluid
Tci is the inlet temperature of the cold fluid
Q, the heat flux to be exchanged, is determined by the process streams variables. The hot or the coldstream can determine this value.
Q ¼ _m Tho � Thið ÞCp (3)
_m is the mass flow rate of the hot fluid
Cp is the specific heat capacity of the hot fluid
Even though Eqs. (1–3) are useful in estimation of the required heat exchanger area, they do notrepresent the actual thermo-fluid characteristics of flow in a heat exchanger. The actual characteristics areconsidered by Kern equations of heat exchanger design [22]. These equations modify the LMTD and
4 EE, 2020

Uass, and then impose some design constraints on the fluid velocity, the Reynold’s number and the pressuredrops. They as well allow selection of discrete geometrical variables.
Eq. (1) is therefore modified to become;
A ¼ Q
Uc � Ft � LMTD(4)
where Uc is the calculated overall coefficient of heat transfer and Ft is the geometric correction factor. Thisfactor corrects for true counter flow characteristics and can be determined analytically or graphically. Uc isdetermined by:
Uc ¼ 1� 1
hs
� �þ Rs þ Ao
Ai
� �dto � dti2km
� �þ Ao
Ai
1
ht
� �þ Ao
AiRt
� �(5)
In Eq. (5), all the true thermo-fluid characteristics of a heat exchanger have been captured. The variablesare as follows:
hs Shell side coefficient of heattransfer
Ai Tube internal area Rt Tube side fouling factor
ht Tube side coefficient of heattransfer
dto Tube externaldiameter
Km Thermal conductivity of the tubematerial
Rs Shell side fouling factor dti Tube internaldiameter
Ao Tube external area
dto and dti are discrete variables, determined by Tubular Exchanger Manufacturers Association (TEMA)standards [23]. From these, Ao and Ai are derived. Thermal conductivity km is also fixed, according tothe material used. Fouling factors Rs and Rt are ranges of values, provided in literature and the designerhas the latitude of varying them. They are dependent of the heat transfer fluid under consideration, thesurface of the tube and shell and the flow characteristics [24].
Tube side heat transfer coefficient ht is determined by:
ht ¼ Nut:ktdti
(6)
where kt is the thermal conductivity of the tube side fluid and Nut, the tube side Nusselt number is computedusing the Dittus-Boelter correlation:
Nut ¼ 0:023Re0:8t : Pr0:3t (7)
Prt, the Prandtl number, is given by:
Prt ¼ Cpc:mc
kt(8)
where kt is thermal conductivity of the tube side fluid, Cpc is the constant pressure specific heat capacity ofthe tube side fluid and µt is the tube side dynamic viscosity.
EE, 2020 5

The tube side Reynold’s number, Ret, is:
Ret ¼4 _mc
npnt
� �
pdtimc(9)
Here, _mc is the mass flow rate of the tube side fluid, nt is the number of tubes and np is the number ofshell passes. They are discrete too, determined by TEMA standards. Initial value of nt can be determinedusing the formula:
nt ¼ A
p:dto:L(10)
L, the length of the exchange tubes, is discrete and obtained from the TEMA standards.
Ret is a design constraint. For design to be acceptable, this value should be greater than 10000. Turbulentflow is desired for optimal convective transfer of heat [15]. This value can be manipulated only throughselection of dti, np and nt. Once this condition is satisfied, the tube side coefficient of heat transfer isdetermined.
The shell side heat transfer coefficient, hs, is determined by:
hs ¼ Nus:ksdto
(11)
Here, ks is the thermal conductivity of the shell side fluid and Nus is the shell side Nusselt number. Nus isdetermined by the Nusselt number equation for turbulent sensible flow:
Nus ¼ 0:36� Re0:5s :Pr0:33s (12)
Shell side Prandtl number Prs is calculated using:
Prs ¼ Cphmh
ks(13)
where Cph and µh are the isobaric specific heat capacity and the dynamic viscosity of the shell side fluid, inthat order.
Shell side Reynold’s number is given by:
Res ¼ De:Gs
mh(14)
Gs is the shell side fluid ratio of mass flow rate. It is a function of _mh the shell side mass flow rate andcross-sectional flow area as.
Gs ¼ _mh
as(15)
The cross-sectional flow area as is:
as ¼ C:B:Ds
PT(16)
C ¼ PT � dto (17)
6 EE, 2020

Here, dto is the external diameter of the exchanger tubes.
B ¼ 0:5Ds (18)
The equivalent shell diameter De, for square pitch, is calculated using:
De ¼4 PT2 � p
4
� d2to
� pdto
(19)
Eq. (1) was used to determine the required area of a heat exchanger, without considering the TEMAstandards and the Kern Heat Exchanger design considerations. Eqs. (4) and (5) were used to determinethe effects of fouling on thermal performance of heat exchangers.
2.3 Simulation of Effects of Fouling on Thermal PerformanceFor each heat exchanger, tube side fluid fouling factors were gradually increased, from the maximum
design recommended value, in incremental steps of 5%, to a maximum increase of 100%. The valueswere obtained from [24]. The factors were varied in Eq. (5). The result was applied in Eq. (4) to get thechange in the required heat exchanger area. To get the heat loss due to increased fouling resistance, adifference in the designed maximum allowable fouling resistance and the required area under foulingresistance that exceeds the design limit was used in Eq. (4), and applied as follows:
Qloss ¼ Aadditional � Ucf � Ft � LMTD (20)
where Aadditional is the difference between required area with designed maximum allowable resistance and therequired area due to fouling resistance that exceeds design limit, and Ucf is the coefficient of heat transferafter fouling growth. Qloss was plotted against the changes in fouling factor for each exchanger. At themaximum allowable design fouling factor, performance was assumed to be 100% (0 heat loss), becausethe exchanger meets the targets it was designed to recover. These equations were executed through VBA.Simulation was carried out on 5 heat exchangers. Selection of the exchangers was based on the type ofthe fluid on the tube side. The exchangers had air (Exchanger 1, Plant A), air (Exchanger 2, Plant A),water (Exchanger 3, Plant A), milk (Exchanger 1, Plant B) and wash (Exchanger 1, Plant C).
3 Results and Discussion
The fluid flow parameters and the Heat Exchanger Design for Plant C are presented in Tabs. 1 and 2,respectively. The parameters and design for Plants A and B are presented in the appendix section.
Table 1: Heat transfer parameters from Plant C
Symbol Exchanger 1 2 3Shell Ethanol Liquid Ethanol Vapor Ethanol VaporTube Wash Wash Wash
Tci K 333.15 301.15 334.15
Tco K 334.15 333.15 339.9
Thi K 383.15 384.15 384.15
Tho K 344.15 383.15 383.15
_mt kg/s 0.766 0.766 0.766
_ms kg/s 0.766 0.0986 0.766
Pt kg/m3 1000 1000 1000(Continued)
EE, 2020 7

In plant C, as is for A and B, the hot fluids were allocated the shell side and the cold fluids on the tubeside. The parameters in Tab. 1 were used for design of heat exchangers for Plant C, shown in Tab. 2.
The quantity of heat specified for each exchanger should be exchanged to meet the specified internalrecoverable heat, in pinch analysis.
Table 1 (continued).
Symbol Exchanger 1 2 3Shell Ethanol Liquid Ethanol Vapor Ethanol VaporTube Wash Wash Wash
Ρs kg/m3 789 3.181 3.181
Cpt kj/kg.°C 586.69 3.514 3.514
Cps kj/kg.°C 2.43 837.85 837.85
St NA 1 1 1
Ss NA 0.789 2.49 2.49
µt Pa.s 0.00089 0.00089 0.00089
µs Pa.s 0.001095 0.0000124 0.0000124
Uass kW/m2.°C 0.015 0.015 0.015
Ks W/m.°C 0.171 0.0144 0.0144
Kt W/m.°C 0.677 0.677 0.677
Kw kW/m.°C 111 111 111
Rt m2.K/W 0.00003 0.00004 0.00004
Rs m2.K/W 0.00012 0.00012 0.00012
Table 2: Heat exchanger design for plant C
Design Variable Heat Exchanger Number
1 2 3
Quantity of Heat (kW) 72.5938 86.135168 15.477413
Tube length (m) 6.096 6.096 6.096
Tube outer diameter (m) 0.012875 0.012875 0.012875
Tube inner diameter (m) 0.000635 0.000635 0.000635
Birmingham Wire Gauge 1 1 1
Tube thickness (m) 0.00762 0.00762 0.00762
Selected number of tubes 838 408 108
Number of tube passes 8 8 8
Shell inside diameter (m) 0.9398 0.38735 0.38735
Tube pitch (m) 0.0254 0.0254 0.0254
Number of baffles 20 20 20
8 EE, 2020

3.1 Heat Exchanger AreasTwo types of heat exchanger areas required, designed to meet the quantified heat recovery are presented
in this section. One area has been designed using Uass, the assumed value of coefficient of heat transfer, whilethe other area has been designed using Kern Equations. The results are shown in Fig. 1.
For all the plants, the areas computed by assuming the value of overall coefficient of heat transfer aremore than those computed using the one calculated using Kern Equations. The average percentagedifference for the plants is 10.1%, 6.9% and 14.9% for A, B and C, respectively. The design approachthat uses assumed value of overall coefficient of heat transfer does not consider the fouling factor. TheUass value from the literature is assumed to cater for the fluid fouling factor. However, this assumptionleads to overstating the required heat transfer area, thus overstating the cost of heat recovery, by thesecomputed percentages. This confirms findings of a simulation study by [25], which revealed that thedesign method that obviates the use of fouling factors during design of fin and plate heat exchangersincreased the costs by a variation of 0.34% to 21.65%.
3.2 Effects of Fouling Growth on Thermal Performance of Heat ExchangersThe percentage heat transfer loss due to growth in fouling resistance for the 5 selected heat exchangers is
presented in Fig. 2. The simulation assumed that at the optimal design fouling factor, for example, forExchanger 1, Plant A, at 0.003 m2.K/W, the heat exchanger will meet the targeted quantity of heattransfer. As fouling increases beyond the designed value, heat transfer reduces.
The heat loss has an exponential relationship with growth of fouling, for the five exchangers. Themodelled average losses, for the 100% increase in fouling factors, was 0.37%. The findings of this studyfortify the findings of the work by [14], which revealed that growth in fouling factors affected thermalefficiency of a power plant by 0.45%. Exchanger 1 and 2 for Plant A have similar increase in the foulingfactors, but their heat transfer losses are different, at 0.39% and 0.59%. The LMTD for the former is28.51°C while the latter is 55.97°C. This implies that heat exchange processes with a higher LMTD arebound to be affected more in thermal performance deterioration due to growth in fouling.
The modelled maximum fouling growth for Exchanger 3 for Plant A is almost half that of Exchangers1 and 2 for Plant A, at 0.000351 m2.K/W, compared to 0.00585 m2.K/W. However, the percentage heat loss is0.39%. Its LMTD is higher, at 52.8°C, compared to Exchanger 1, at, 28.51°C. Similarly, the ratio of theexternal to internal diameter of the tube for Exchanger 3 is higher compared to Exchanger 1, at 11.11(Birmingham Wire Gage of 7.62 mm), compared to 3.03 (Birmingham Wire Gage of 4.572 mm). This is
Figure 1: Comparison of heat exchanger areas
EE, 2020 9

illustrated in the design data in the appendices. Fouling growth thus has a higher effect on exchangers withtubes that have more thickness than those that have lower thickness.
The modelled heat transfer losses for Exchanger 1 Plant B and Exchanger 1 Plant C are 0.28% and0.19%, respectively. The same fouling growth notwithstanding, the two have different percentage losses.The LMTD for Exchanger 1, Plant B is 31.8°C while that of Exchanger 1 Plant C is 25.4°C. The tubethickness of the two is the same, with Birmingham Wire Gage of 7.62 mm. The effect of fouling growthon the heat loss in the heat exchangers was thus moderated by the LMTD of the two exchangers.
4 Conclusions
This paper has analyzed the effects of growth of fouling in shell and tube heat exchangers, by use ofthermodynamic analysis, heat balance and Kern Design equations. This study has revealed that estimationof overall heat transfer coefficient, which uses an estimated fouling factor for design of heat exchangers,leads to an overestimate of the required shell and tube exchanger area. The overestimation was by anaverage of 10.1%, 6.9% and 14.9% for plants A, B and C, respectively, compared to computation of thesame using Kern Design Equations. Increase in the design fouling factor by 100% leads to increase inheat losses by an average of 0.37%, for the three plants.
This work has led to four conclusions concerning heat exchanger design, fouling resistance and thermalperformance of shell and tube heat exchanger. The relationship between increase in fouling resistance andheat transfer losses in shell and tube heat exchangers is exponential. In design problems that estimate theoverall heat transfer coefficient, thus not factoring in the fouling factors unique to the heat transport fluid,the exchange areas are overestimated, thus overestimating the costs of heat recovery. The LMTDdetermines the severity of fouling resistance in shell and tube heat exchangers. Higher values of LMTDexacerbate the heat losses, compared to lower values, because of the exponential relationship betweenexchanger heat loss and fouling growth. Similarly, the ratio of external diameter to internal diameter ofthe exchanger tubes amplifies the effect of fouling growth on thermal performance of the exchangers. Thehigher the ratio, the higher the heat loss due to growth in fouling. There is need for more work to be
Figure 2: Effect of fouling growth on heat loss
10 EE, 2020

carried out on the effect of fouling growth in shell and tube heat exchangers conveying different fluids,especially in prediction of fouling growth using computation fluid dynamics and linking the predictedgrowth to thermal performance.
Acknowledgement: I appreciate the efforts of Prof. Kinyua and Dr. Eng Ndiritu for helping me shape thiswork, which is a continuation of pinch analysis work I carried out on three process plants.
Funding Statement: The authors received no specific funding for this work.
Conflicts of Interest: The authors declare that they have no conflicts of interest to report regarding thepresent study.
References1. Ramos, J., Aires, L. (2020). The effect of a naturally ventilated roof on the thermal behaviour of a building under
mediterranean summer conditions. Journal of Sustainable Development of Energy, Water and EnvironmentSystems, 8(3), 508–519. DOI 10.13044/j.sdewes.d7.0297.
2. Aspelund, A., Berstad, D. O., Gundersen, T. (2007). An extended pinch analysis and design procedure utilizingpressure based exergy for subambient cooling. Applied Thermal Engineering, 27(16), 2633–2649. DOI10.1016/j.applthermaleng.2007.04.017.
3. Kemp, I. C. (2011). Pinch Analysis and Process Integration: A user guide on process integration for the efficientuse of energy. Butterworth-Heinemann, Oxford.
4. Linnhoff, B., Kemp, I. C. (2007). Pinch analysis and process integration, a user guide on process integration forthe efficient use of energy. Butterworth-Heinemann, Oxford.
5. Klemeš, J. J., Kravanja, Z. (2013). Forty years of heat integration: pinch analysis (PA) and mathematicalprogramming (MP). Current Opinion in Chemical Engineering, 2(4), 461–474. DOI 10.1016/j.coche.2013.10.003.
6. Aljundi, I. H. (2009). Energy and exergy analysis of a steam power plant in Jordan. Applied Thermal Engineering,29(2), 324–328. DOI 10.1016/j.applthermaleng.2008.02.029.
7. Cihan, A., Hacıhafızoglu, O., Kahveci, K. (2006). Energy-exergy analysis and modernization suggestions for acombined-cycle power plant. International Journal of Energy Research, 30(2), 115–126. DOI 10.1002/er.1133.
8. Fodor, Z., Klemeš, J. J., Varbanov, P., Walmsley, M. R., Atkins, M. J. et al. (2012). Total site targeting with streamspecific minimum temperature difference. Chemical Engineering Transactions, 29, 409–414.
9. Becker, H. C. (2012). Methodology and thermo-economic optimization for integration of industrial heat pumps(Ph.D. Thesis). Federal Polytechnic College of Lausanne, Lausanne.
10. Harkin, T., Hoadley, A., Hooper, B. (2010). Reducing the energy penalty of CO2 capture and compression usingpinch analysis. Journal of Cleaner Production, 18(9), 857–866. DOI 10.1016/j.jclepro.2010.02.011.
11. Gonçalves, C. D. O., Costa, A. L., Bagajewicz, M. J. (2017). Shell and tube heat exchanger design using mixed-integer linear programming. AIChE Journal, 63(6), 1907–1922. DOI 10.1002/aic.15556.
12. Gonçalves, C. D. O., Costa, A. L. H., Bagajewicz, M. J. (2017). Alternative mixed-integer linear programmingformulations for shell and tube heat exchanger optimal design. Industrial & Engineering Chemistry Research,56(20), 5970–5979. DOI 10.1021/acs.iecr.6b04950.
13. Antar, M. A., Zubair, S. M. (2007). The impact of fouling on performance evaluation of multi-zone feedwaterheaters. Applied Thermal Engineering, 27(14–15), 2505–2513. DOI 10.1016/j.applthermaleng.2007.02.006.
14. Ibrahim, S. M., Attia, S. I. (2015). The influence of condenser cooling seawater fouling on the thermal performanceof a nuclear power plant. Annals of Nuclear Energy, 76, 421–430. DOI 10.1016/j.anucene.2014.10.018.
15. Khan, J. U. R., Zubair, S. M. (2004). A study of fouling and its effects on the performance of counter flow wetcooling towers. Proceedings of the Institution of Mechanical Engineers, Part E: Journal of ProcessMechanical Engineering, 218(1), 43–51. DOI 10.1243/095440804322860636.
EE, 2020 11

16. Pérez, M. G., Vakkilainen, E., Hyppänen, T. (2016). Fouling growth modeling of kraft recovery boiler fume ashdeposits with dynamic meshes and a mechanistic sticking approach. Fuel, 185, 872–885. DOI 10.1016/j.fuel.2016.08.045.
17. Wang, L. C., Li, S. F., Wang, L. B., Cui, K., Zhang, Q. L. et al. (2016). Relationships between the characteristics ofCaCO3 fouling and the flow velocity in smooth tube. Experimental Thermal and Fluid Science, 74, 143–159. DOI10.1016/j.expthermflusci.2015.12.001.
18. Musonye, F. S., Ndiritu, H., Kinyua, R. (2020). Modeling and simulation of heat balance and internal heat recoverytargets through a combination of stream specific minimum temperature difference and polynomial temperaturecoefficients of specific heat capacities using pinch analysis. AIMS Energy, 8(4), 652–668. DOI 10.3934/energy.2020.4.652.
19. Thulukkanam, K. (2013). Heat exchanger design handbook. CRC press, London.
20. Thakore, S. B., Bhatt, B. I. (2015). Introduction to process engineering and design. McGraw-Hill Education, NewDelhi.
21. Müller-Steinhagen, H. (2000). Heat exchanger fouling: mitigation and cleaning techniques. IChemE,Warwickshire.
22. Flynn, A. M., Akashige, T., Theodore, L. (2019). Kern's process heat transfer. John Wiley & Sons, New Jersey.
23. TEMA (2007). Standards of the tubular heat exchanger manufacturers association. 9th ed. New York: TubularHeat Exchanger Manufacturers Association.
24. Podolski, W. F., Schmalzer, D. K., Conrad, V. (2000). Perry's chemical engineers handbook. McGraw-HillProfessional Publishing, New York.
25. Rao, R. V., Patel, V. (2013). Multi-objective optimization of heat exchangers using a modified teaching-learning-based optimization algorithm. Applied Mathematical Modelling, 37(3), 1147–1162. DOI 10.1016/j.apm.2012.03.043.
Appendices
Appendix 1: Data for design of heat exchangers for Plant A
Symbol Exchanger 1 2 3Shell SO3 Air AirTube Air Air H20 (l)
Tci K 389.15 388.15 373.15
Tco K 414.12 389.15 374.15
Thi K 476.15 474.15 418.18
Tho K 399.15 418.18 383.15
_mt kg/s 1.303 1.303 0.417
_ms kg/s 0.435 1.235 1.235
Ρt kg/m3 1.274 1.274 1000
Ρs kg/m3 3.37 1.225 1.225
Cpt kj/kg.°C 1.013 1.013 2260
Cps kj/kg.°C 0.9 1.013 1.013
St 2 2 1
Ss 2.75 1 1
µt Pa.s 2.26E-05 2.61E-5 89E-5
12 EE, 2020

Appendix 1 (continued).
Symbol Exchanger 1 2 3Shell SO3 Air AirTube Air Air H20 (l)
µs Pa.s 3.26E-05 2.61E-5 2.61E-5
Uass kW/m2.°C 0.015 0.015 0.015
Ks W/m.°C 0.75 0.0262 0.0262
Kt W/m.°C 0.0262 0.0262 0.677
Kw kW/m.°C 0.111 0.111 0.111
Rt m2.K/W 0.003 0.003 0.00018
Rs m2.K/W 0.0012 0.0012 0.0012
Appendix 2: Data for design of heat exchangers for Plant B
Symbol Exchanger 1 2 3 4Shell Milk Milk Milk MilkTube Milk Water Steam Water
Tci K 298.15 298.15 374.15 373.15
Tco K 340.0 340.0 415.15 374.15
Thi K 358.15 349.1 420.15 418.02
Tho K 349.1 348.16 418.02 376.15
_mt kg/s 1.87 0.194 0.194 0.194
_ms kg/s 8.61 8.61 1.87 1.87
Ρt kg/m3 1026 1000 0.6 1000
Ρs kg/m3 1026 1026 1026 1026
Cpt kj/kg. °C 4.18 4.18 2.09 2260
Cps kj/kg. °C 4.18 4.18 4.18 4.18
St 1.026 1 0.49 1
Ss 1.026 1.026 1.026 1.026
µt Pa.s 0.003 0.00089 0.0000162 0.00089
µs Pa.s 0.003 0.003 0.003 0.003
Uass kW/m2.°C 0.015 0.015 0.015 0.015
Ks W/m.°C 0.637 0.637 0.637 0.637
Kt W/m.°C 0.637 0.677 0.0288 0.677
Kw kW/m.°C 111 111 111 111
Rt m2.K/W 0.00003 0.00003 0.00003 0.00003
Rs m2.K/W 0.00009 0.00009 0.00009 0.00009
EE, 2020 13
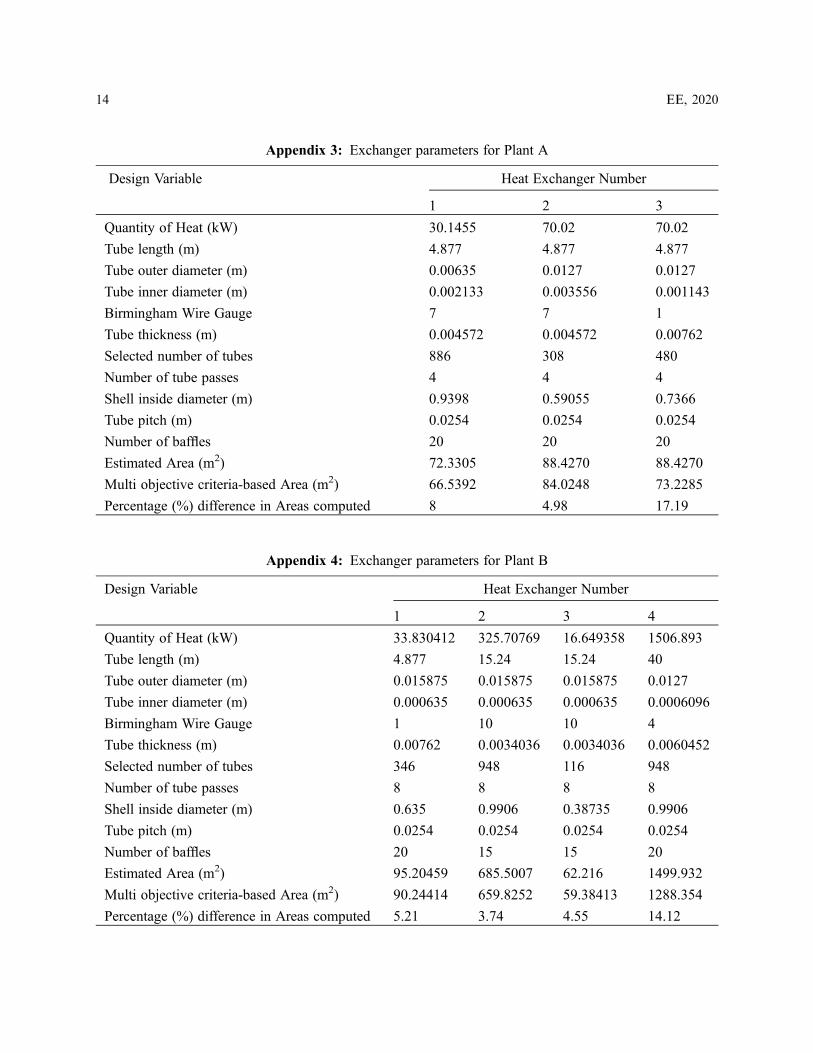
Appendix 3: Exchanger parameters for Plant A
Design Variable Heat Exchanger Number
1 2 3
Quantity of Heat (kW) 30.1455 70.02 70.02
Tube length (m) 4.877 4.877 4.877
Tube outer diameter (m) 0.00635 0.0127 0.0127
Tube inner diameter (m) 0.002133 0.003556 0.001143
Birmingham Wire Gauge 7 7 1
Tube thickness (m) 0.004572 0.004572 0.00762
Selected number of tubes 886 308 480
Number of tube passes 4 4 4
Shell inside diameter (m) 0.9398 0.59055 0.7366
Tube pitch (m) 0.0254 0.0254 0.0254
Number of baffles 20 20 20
Estimated Area (m2) 72.3305 88.4270 88.4270
Multi objective criteria-based Area (m2) 66.5392 84.0248 73.2285
Percentage (%) difference in Areas computed 8 4.98 17.19
Appendix 4: Exchanger parameters for Plant B
Design Variable Heat Exchanger Number
1 2 3 4
Quantity of Heat (kW) 33.830412 325.70769 16.649358 1506.893
Tube length (m) 4.877 15.24 15.24 40
Tube outer diameter (m) 0.015875 0.015875 0.015875 0.0127
Tube inner diameter (m) 0.000635 0.000635 0.000635 0.0006096
Birmingham Wire Gauge 1 10 10 4
Tube thickness (m) 0.00762 0.0034036 0.0034036 0.0060452
Selected number of tubes 346 948 116 948
Number of tube passes 8 8 8 8
Shell inside diameter (m) 0.635 0.9906 0.38735 0.9906
Tube pitch (m) 0.0254 0.0254 0.0254 0.0254
Number of baffles 20 15 15 20
Estimated Area (m2) 95.20459 685.5007 62.216 1499.932
Multi objective criteria-based Area (m2) 90.24414 659.8252 59.38413 1288.354
Percentage (%) difference in Areas computed 5.21 3.74 4.55 14.12
14 EE, 2020