performance effectiveness report - new mexico...
TRANSCRIPT
PerformanceEffectiveness
Report
New Mexico Universities
Council ofUniversity Presidents
November 2006

New Mexico Universities
Research UniversitiesNew Mexico Institute of Mining & Technology SocorroNew Mexico State University Las CrucesUniversity of New Mexico Albuquerque
Comprehensive UniversitiesEastern New Mexico University PortalesNew Mexico Highlands University Las VegasWestern New Mexico University Silver City
The Council of University Presidents
Daniel H. López New Mexico Institute of Mining & Technology (Chair)Michael V. Martin New Mexico State UniversityDavid W. Harris University of New MexicoSteven G. Gamble Eastern New Mexico UniversityManuel Pacheco New Mexico Highlands UniversityJohn Counts Western New Mexico University
David A. Lepre, Executive DirectorTwo Woodward Center, Suite 205 / 700 Lomas NE
Albuquerque, NM 87131Phone (505) 220-1709
CUP Accountability Work Group
Council of University Presidents Eastern New Mexico UniversityDavid Lepre, Executive Director Patrice Caldwell (Co-Chair)Therese J. Graham Amy Holt
New Mexico Institute of Mining & Technology New Mexico Highlands UniversityCarole Yee Ivy Romero
New Mexico State University Western New Mexico UniversityCarmen Santana-Melgoza Eric SiegelCandice Guzie
University of New MexicoMark Chisholm (Co-Chair)Ryan Deller
Liaison MembersPaul Landrum, Higher Education Department Arley Williams, Legislative Finance Committee
Anne Stauffer, Department of Finance and Administration

Letter from the Presidents
The New Mexico Council of University Presidents is pleased to present its eighth annual accountability andperformance report on behalf of our State’s public universities. The Performance Effectiveness Report is offered aspartial compliance with the Accountability in Government Act (AGA). This writing culminates a year-long processthat began with careful attention to feedback from numerous constituencies including Governor Richardson, theLegislature, the Commission on Higher Education, university personnel and students, private sector business leaders,analysts, and others interested in university efforts. The AGA performance measures enumerated in this submissionare a focused subset of each university’s ongoing efforts to respond to the policies and needs of New Mexico inconcert with meeting the extensive accreditation and professional standards demands placed on public universities.
The contents of this report are compiled and formatted by a highly skilled inter-institutional research work group.Great care is taken to assure the accuracy of data derived from consistently applied data definitions. Yet, the Council’scommitment continues to extend beyond simply reporting data. This report responds to a public imperative foraccountability and continuous improvement. Consistent with the provisions for governance prescribed by the NewMexico Constitution, this report is demonstrative of the resolve of New Mexico’s public universities to improve theeducational environment in our state, as well as the quality of life for all New Mexicans.
On behalf of the University of New Mexico, New Mexico State University, New Mexico Tech, Eastern New MexicoUniversity, Western New Mexico University and New Mexico Highlands University, the Council of UniversityPresidents presents the eighth annual accountability report.
Sincerely,
COUNCIL OF UNIVERSITY PRESIDENTS
Daniel H. LopezChair

This page blank intentionally.

Performance Effectiveness ReportTable of Contents
The Performance Effectiveness Plan of New Mexico’s Public Universities . . . . . . . . . . . . . . . . . . . . . . . . . . . . . . . . . . a
Executive Summary . . . . . . . . . . . . . . . . . . . . . . . . . . . . . . . . . . . . . . . . . . . . . . . . . . . . . . . . . . . . . . . . . . . . . . . . . . . . . I
Institutional Missions, Profiles and Performance Indicator Tables- Research Universities
New Mexico Institute of Mining & Technology• Institutional Mission and Profile . . . . . . . . . . . . . . . . . . . . . . . . . . . . . . . . . . . . . . . . . . . . . . . . . . . . . . . . . . 1• Performance Indicator Tables . . . . . . . . . . . . . . . . . . . . . . . . . . . . . . . . . . . . . . . . . . . . . . . . . . . . . . . . . . . . . 2• Reporting Data for Accountability in Government Act . . . . . . . . . . . . . . . . . . . . . . . . . . . . . . . . . . . . . . . . 11
New Mexico State University• Institutional Mission and Profile . . . . . . . . . . . . . . . . . . . . . . . . . . . . . . . . . . . . . . . . . . . . . . . . . . . . . . . . . 13• Performance Indicator Tables . . . . . . . . . . . . . . . . . . . . . . . . . . . . . . . . . . . . . . . . . . . . . . . . . . . . . . . . . . . . 14• Reporting Data for Accountability in Government Act . . . . . . . . . . . . . . . . . . . . . . . . . . . . . . . . . . . . . . . 24
University of New Mexico• Institutional Mission and Profile . . . . . . . . . . . . . . . . . . . . . . . . . . . . . . . . . . . . . . . . . . . . . . . . . . . . . . . . . 25• Performance Indicator Tables . . . . . . . . . . . . . . . . . . . . . . . . . . . . . . . . . . . . . . . . . . . . . . . . . . . . . . . . . . . . 26• Reporting Data for Accountability in Government Act . . . . . . . . . . . . . . . . . . . . . . . . . . . . . . . . . . . . . . . 36
University of New Mexico - Health Sciences Center• Institutional Mission and Profile . . . . . . . . . . . . . . . . . . . . . . . . . . . . . . . . . . . . . . . . . . . . . . . . . . . . . . . . . 37• Performance Indicator Tables . . . . . . . . . . . . . . . . . . . . . . . . . . . . . . . . . . . . . . . . . . . . . . . . . . . . . . 37• Reporting Data for Accountability in Government Act . . . . . . . . . . . . . . . . . . . . . . . . . . . . . . . . . . . . . . . 51
Institutional Profiles and Data Reports - Comprehensive Universities
Eastern New Mexico University• Institutional Mission and Profile . . . . . . . . . . . . . . . . . . . . . . . . . . . . . . . . . . . . . . . . . . . . . . . . . . . . . . . . . 53• Performance Indicator Tables . . . . . . . . . . . . . . . . . . . . . . . . . . . . . . . . . . . . . . . . . . . . . . . . . . . . . . . . . . . . 54• Reporting Data for Accountability in Government Act . . . . . . . . . . . . . . . . . . . . . . . . . . . . . . . . . . . . . . . 63
New Mexico Highlands University• Institutional Mission and Profile . . . . . . . . . . . . . . . . . . . . . . . . . . . . . . . . . . . . . . . . . . . . . . . . . . . . . . . . . 65• Performance Indicator Tables . . . . . . . . . . . . . . . . . . . . . . . . . . . . . . . . . . . . . . . . . . . . . . . . . . . . . . . . . . . . 66• Reporting Data for Accountability in Government Act . . . . . . . . . . . . . . . . . . . . . . . . . . . . . . . . . . . . . . . 75
Western New Mexico University• Institutional Mission and Profile . . . . . . . . . . . . . . . . . . . . . . . . . . . . . . . . . . . . . . . . . . . . . . . . . . . . . . . . . 77• Performance Indicator Tables . . . . . . . . . . . . . . . . . . . . . . . . . . . . . . . . . . . . . . . . . . . . . . . . . . . . . . . . . . . . 78• Reporting Data for Accountability in Government Act . . . . . . . . . . . . . . . . . . . . . . . . . . . . . . . . . . . . . . . 87

Appendices
I Listing of Peer Institutions . . . . . . . . . . . . . . . . . . . . . . . . . . . . . . . . . . . . . . . . . . . . . . . . . . . . . . . . . . . . . . . . 89
II New Mexico's Universities Survey of Student Satisfaction with Undergraduate Education . . . . . . . . . . . . . . 90
III New Mexico's Universities Survey of Alumni Assessment of Undergraduate Educational Preparation . . . . 92
IV Executive Summary - Research & Polling, Inc.: Employer Perceptions of New Mexico Universities . . . . . . 94
V Data Sources . . . . . . . . . . . . . . . . . . . . . . . . . . . . . . . . . . . . . . . . . . . . . . . . . . . . . . . . . . . . . . . . . . . . . . . . . . 101

Performance Effectiveness Report - New Mexico’s Universities - November 2006 a
THE PERFORMANCE EFFECTIVENESS PLANOF NEW MEXICO’S PUBLIC UNIVERSITIES
Accountability and Performance Reporting Categories
As suggested in the Letter From the Presidents, public universities respond to regional and national accreditation andprofessional standards and a host of federal and state reporting requirements. In fact, being accountable has become afull-time and highly complex job of considerable consequence. This document represents a single significantcomponent of each university’s extensive reporting efforts.
The New Mexico Council of University Presidents directly responds to the expectations of policy makers and otherconcerned citizens by publishing an annual Performance Effectiveness Report designed, in part, to comply with therequirements of the Accountability in Government Act (AGA). This report describes each university’s AGAperformance goals and offers considerable additional accountability information deemed to be of particular interest toreaders. The Council has identified a set of common indicators of university quality and effectiveness. Theseindicators are being used to measure the progress of New Mexico’s universities in meeting statewide performanceexpectations. Focusing university and public attention on these indicators will promote the improvement of highereducation and the achievement of our goals. Indicators of university quality are grouped into the followingcomprehensive categories:
I. Accessible and affordable university education II. Student progress and student success in our universitiesIII. Academic quality and a quality learning environmentIV. Effective and efficient use of resources V. Mission specific institutional reporting highlights
For each of the first four quality indicator groups listed above, a common set of performance measures has beenselected to provide a means by which each of our universities can demonstrate its performance level. Although we areusing common performance measures, each institution’s performance level reflects its unique institutional mission,students, and other constituencies, and the program and service mix it has developed in response to state and regionalneeds. Each institution is using these measures to set performance improvement goals.
Performance measures providing data on a cyclical basis are those measures dependent on broad-based surveys of ourconstituencies. These surveys provide valuable information for reviewing and enhancing our programs. Informationincludes measures on placement rates of graduates and alumni assessment of institutional quality, both of which aregathered from alumni surveys; students’ satisfaction with their undergraduate experiences, which is collected through asurvey of graduating seniors; and employers’ satisfaction with our graduates, a statewide survey of New Mexicoemployers conducted by an outside party.

Performance Effectiveness Report - New Mexico’s Universities - November 2006b
I. Accessible and Affordable University Education
• Table 1 - Is university tuition affordable relative to peers and per capita income? • Table 2 - How much financial aid must be paid back by students?• Table 3 - How much of the cost of attendance does financial aid cover and what
percent of students received aid? • Table 4 - Does enrollment reflect the diversity of the state?• Table 5 - What proportion of our transfer students come from 2-year colleges?
II. Student Progress and Student Success
• Table 6 - How many freshmen return for second year?• Table 7 - What are our graduation rates?• Table 8 - What degrees were awarded in 2001-02?• Table 9 - What are our alumni doing?
III. Academic Quality and a Quality Learning Environment
• Table 10 - How diverse are our faculty and staff?• Table 11 - Do our faculty hold the highest degrees in their fields?• Table 12 - Are we making progress on faculty pay commensurate with our peers?• Table 13 - What percent of classroom instruction is delivered by tenured/tenure-track faculty?• Table 14 - What are our student-to-faculty ratios?• Table 15 - How large are our classes?• Table 16 - How satisfied are our students with their educational experience?• Table 17 - How satisfied are our alumni with their educational experience?
IV. Effective and Efficient Use of Resources
• Table 18 - What percent of fiscal resources are allocated to our primary mission of instruction, research and public service?
• Table 19 - What percent of fiscal resources are allocated to administrative costs?
V. Mission-Specific Institutional Reporting Highlights
• Student Access and Success.• Economic Development/Research.• Community Outreach - Workforce Issues

Performance Effectiveness Report - New Mexico’s Universities - November 2006 Page 1
Associate’s 2 Bachelor’s 22Master’s 17Post-Master’sDoctorate 7
Institutional Profile ofNew Mexico Institute of Mining and Technology
Mission: New Mexico Tech is an institute of higher learning that serves the people of New Mexico by integratingeducation, research, public service, and economic development through emphasis on science, engineering, and naturalresources. Its mission is threefold:· Helping students learn creative approaches to complex issues· Creating and communicating knowledge· Solving technical and scientific problems
Fall 2006 Overall Main Campus Enrollment by Level
On-Campus Off-Campus Unduplicated Count
Degree-seeking undergraduate 1,108
Non-degree seeking undergraduate 228
First Professional
Graduates 510
Total Headcount 1,846
Total Full-time Equivalent 1,481
Number of program majors at the following degree levels for 2006-07:
2006-2007 total current funds revenue for main campus: $142,813,852
2006-2007 total state appropriation for main campus as a percent of total main campus operatingbudget: 18%

New Mexico Institute of Mining and Technology
Performance Effectiveness Report - New Mexico’s Universities - November 2006Page 2
Accessible and Affordable University Education
Table 1Is university tuition affordable relative to peers and per capita income?
Resident Undergraduate Percent of Peers* Non-Resident Undergraduate Percent of Peers*
1997-98 $2,074 57.3 $6,612 72.8
1999-00 $2,328 59.8 $7,328 74.92000-01 $2,499 60.4 $7,825 76.12001-02 $2,722 61.5 $8,419 76.12002-03 $2,911 60.2 $9,122 78.9
2003-04 $3,080 56.9 $9,601 70.5
2004-05 $3,280 56.1 $9,911 68.1
2005-06 $3,644 57.9 $10,463 68.3
2006-07 $4,187 Not available $11,405 Not available
Context for 2005:
NM Per-Capita Income: $27,912 Relative to peer states average per capita income: 82.0%
* List of peers in Appendix
Table 2How much financial aid must be paid back by students?
Type of Aid 1999-00 Percent 2004-05 Percent 2005-06 Percent
Gift Aid (not paid back) 45.0 66.0 70.8
Work Study (must work to earn) 10.6 5.4 3.0
Loans (must pay back) 44.4 68.2 26.2
Table 3How much of the cost of attendance does financial aid cover and what percent of
students received aid?Average Award Paid
Per RecipientAverage Total Cost of
Attendance PerRecipient
Percent of Students whoReceived Aid
1997-98 $6,105 $ 9,855 ---
2004-05 $7,531 $11,388 52.9
2005-06 $7,707 $11,924 49.9

New Mexico Institute of Mining and Technology
Performance Effectiveness Report - New Mexico’s Universities - November 2006 Page 3
Accessible and Affordable University Education
Table 4
Does enrollment reflect diversity of the state?
Total EnrollmentFirst-Time Freshmen from
New MexicoNM HS
Graduates2005-06
%
NM ACTTakers
2005-06 %
Fall1997
%
Fall2005
%
Fall2006
%
Fall 1997
%
Fall2005
%
Fall2006
%
Race/Ethnicity
American Indian 2.3 2.3 2.1 4.3 1.7 2.1 11.3 9.9
Asian 2.7 2.6 2.2 6.1 3.4 2.1 1.7 2.1
Black 0.6 0.7 1.1 0.0 0.0 2.1 2.3 1.7
Hispanic 15.8 17.4 19.0 26.1 26.0 26.7 44.8 31.7
White/Other 71.0 66.5 64.9 63.5 68.9 66.3 39.9 35.9Nonresident Alien 7.5 8.7 6.56 0.0 0.0 0.7 0.0 0.0
Unknown 0.1 1.7 1.8 0.0 0.0 0.0 0.0 18.7
Total Number 1,395 1,891 1,899 115 235 282 19,174 11,539
Table 5
What proportion of our transfer students come from 2-year colleges?
Fall 1997 Fall 2005 Fall 2006
N % N % N %
NM 2-Yr Colleges and Branches 24 40.0 28 41.7
Out-of-state 2-Yr Colleges 8 13.3 8 11.9
Subtotal 2-Yr Colleges 32 53.3 3.6 53.7
NM Public 4-Yr Universities 16 26.7 15 22.3
All Other Transfers 12 20.0 16 23.8
Grand Total N A N A 60 67 99.8

New Mexico Institute of Mining and Technology
Performance Effectiveness Report - New Mexico’s Universities - November 2006Page 4
Student Progress and Student SuccessTable 6
How many freshmen return for second year?Entered in Fall 1997 Entered in Fall 2004 Entered in Fall 2005
CohortN
Percent Enrolledin Fall 1998
CohortN
Percent Enrolledin Fall 2005
CohortN
Percent Enrolledin Fall 2006
Race/Ethnicity & Sex
American Indian 66.7 12 50.0 6 83.0
Asian 77.8 9 66.7 8 87.5
Black 0.0 5 80.0 1 100.0
Hispanic 82.1 69 63.8 66 75.8
White/Other 78.4 175 70.9 195 63.6
Nonresident Alien 100.0 3 66.7 4 100.0
Unknown 0.0 0 0.0 0 0.0
Men 79.0 213 65.7 197 69.0
Women 78.2 60 76.7 83 66.3
Overall 78.6 273 68.1 280 68.2
* First-time, full-time, degree-seeking freshmen
Table 7What are our graduation rates?
Entered Fall 1991 Entered Fall 1999 Entered Fall 2000
Race/Ethnicityand Sex
CohortN
% Grador Still
EnrolledAfter 6Years*
CohortN
%BachelorsDegree in6 Years
% StillEnrolledAfter 6Years
% Grador Still
EnrolledAfter 6Years*
CohortN
%BachelorsDegree in6 Years
% StillEnrolledAfter 6Years
% Grador Still
EnrolledAfter 6Years*
American Indian 0 0.0 14 28.6 14.3 42.9 13 31.0 14.3 45.3
Asian 3 100.0 10 90.0 10.0 100.0 5 40.0 20.0 60.0
Black 0 0.0 5 40.0 0 40.0 3 33.0 0.0 33.0
Hispanic 39 41.0 48 39.6 2.1 41.7 53 45.0 2.1 47.1
White/Other 130 50.8 220 50.0 2.7 52.7 173 46.0 2.7 48.7
Nonresident Alien 0 0.0 6 33.3 0 33.3 5 40.0 40.0 80.0
Unknown 0 0.0 1 100.0 0.0 100.0
Men 124 42.7 210 48.6 3.3 51.9 196 38.0 3.3 41.3
Women 48 66.7 93 47.3 3.2 50.5 57 67.0 3.2 70.2
Overall 172 49.4 303 43.0 3.3 51.5 253 45.0 3.3 47.8
Graduation/Retention Rates of Full-Time, First-Time, Degree-Seeking Freshmen After 6 Years
* Includes Associate degree recipients.

New Mexico Institute of Mining and Technology
Performance Effectiveness Report - New Mexico’s Universities - November 2006 Page 5
Student Progress and Student Success
Table 8What degrees were awarded in 2005-06?
Associate Bachelors Masters Post-Masters
Doctors First-Professional
Total
Agriculture-related
Architecture-related
Business / Public Administration 2 2
Education 16 16
Engineering / Tech / Computer 118 64 13 195
Health Professions (w/o Nursing)
Home Economics
Humanities/Social Science 1 1
Law / Protective Services
Nursing
Science and Math 55 24 6 85
Social Work
Total 176 104 19 299
Table 9What are our alumni doing?
Percent Employed (may also be in school): 96% Percent Continuing Their Education: 23%
In what fields are they employed?Private or Self Education Government or Military Other
Employment Fields 48.0% 8.0% 4.0% 6.6%
What percent of alumni are working in New Mexico?Percent of employed: 38.0%

New Mexico Institute of Mining and Technology
Performance Effectiveness Report - New Mexico’s Universities - November 2006Page 6
Academic Quality and a Quality Learning EnvironmentTable 10
How diverse are our faculty and staff?Fall 1997 Fall 2004 Fall 2005
Full-TimeFaculty %(N = 109)
Full-TimeStaff %
(N = 458)
Full-TimeFaculty %(N = 124)
Full-TimeStaff %
(N = 828)
Full-TimeFaculty %(N = 124 )
Full-TimeStaff %(N =828)
Race/Ethnicity & Sex
American Indian 3.7 2.2 1.0 3.6 1.0 3.6
Asian 11.0 2.8 12.0 3.5 12.0 3.5
Black 1.8 0.7 1.0 0.2 1.0 0.2
Hispanic 1.8 44.8 5.0 42.5 5.0 42.5
White/Other 81.7 49.6 81.0 50.0 81.0 50.0
Nonresident Alien 0.0 0.0 0.0 0.0 0.0 0.0
Unknown 0.0 0.0 0.0 0.0 0.0 0.0
Men 88.1 63.9 79.0 60.0 79.0 60.0
Women 11.9 36.9 21.0 40.0 21.0 40.0
Table 11Do our faculty hold the highest degree in their fields?
Percent of faculty holding highest degree
Fall 1997 98.0%
Fall 2004 98.0%
Fall 2005 99.0%
Table 12
Are we making progress on faculty pay commensurate with our peers?
Average Salary % of Peer Average Average Compensation % of Peer Average
Fall 1997 $48,438 85.6 $61,032 87.4
Fall 2004 $62,462 89.1 $77,765 87.0
Fall 2005 $69,395 86.4 $85,355 88.0

New Mexico Institute of Mining and Technology
Performance Effectiveness Report - New Mexico’s Universities - November 2006 Page 7
Academic Quality and a Quality Learning Environment
Table 13
What percent of classroom instruction is delivered by tenured/tenure-track faculty?
Fall 1997 Fall 2004 Fall 2005
Percent Percent Percent
Course Level
Lower Division 70.3 47.6 86.4
Upper Division 87.7 90.5 44.5
Graduate Division 85.8 80.2 80.6
Overall 79.2 66.0 62.8
Classroom instruction excludes labs, theses, internships, independent studies, etc.
Table 14What are our student to faculty ratios?
Fall 1999 12.4 to 1
Fall 2004 13.2 to 1
Fall 2005 11.0 to 1
* FTE Students/FTE Instructional Faculty
Table 15How large are our classes?
Fall 1999 Average Fall 2004 Average Fall 2005 Average
Undergraduate, lower division 21.2 23.7 27.4
Undergraduate, upper division 10.2 12.8 13.9
Graduate 3.8 4.5 3.1

New Mexico Institute of Mining and Technology
Performance Effectiveness Report - New Mexico’s Universities - November 2006Page 8
Academic Quality and a Quality Learning Environment
Table 16
How satisfied are our students with their educational experience?
2003-2004
Satisfied or Very Satisfied with Curriculum and Instruction 86.5%
Satisfied or Very Satisfied with Student Support 82.5%
Satisfied or Very Satisfied Overall with Institution 86.8%
* See Appendix III (Survey of Graduating Seniors in 2003-04)
Table 17
How satisfied are our alumni with their educational experience?
2003-2004
Satisfied or Very Satisfied with Curriculum and Instruction 92.0%
Satisfied or Very Satisfied with Student Support 83.0%
Satisfied or Very Satisfied Overall with Institution 88.0%
* See Appendix II for survey instrument (2002-03 Survey of 1998-99 Bachelors Degree Recipients)

New Mexico Institute of Mining and Technology
Performance Effectiveness Report - New Mexico’s Universities - November 2006 Page 9
Effective and Efficient Use of Resources
Table 18
What percent of fiscal resources are allocated to our primary mission of instruction,research and public service?
Percent for Institution Percent for Peers
1996-97 58.7 65.0
2002-03 69.8 70.9
2003-04 77.2 71.9
2004-05 74.9 69.7
Table 19
What percent of fiscal resources are allocated to administrative costs?
Percent for Institution Percent for Peers
1996-97 7.0 8.4
2002-03 9.6 7.3
2003-04 6.8 7.1
2004-05 7.3 7.0

New Mexico Institute of Mining and Technology
Performance Effectiveness Report - New Mexico’s Universities - November 2006Page 10
Listing of Accreditations
NMT North Central Association of Colleges & Schools
NMT Attorney General of the United States/ Non-immigrant studentsattendance
NMT US Dept. For Exchange Visitor Program P-I-1282
NMT Veteran’s Approval Division of the Office of Military Affairs
NMT American Society for Engineering Education
NMT Grad. School Western Association of Graduate Schools
NMT Grad. School Council for Graduate Schools in the US
Teacher Certification Program NM Public Education Department
Chemistry Program Committee on Professional Training of the American Chemical Society
Chemical Engineering Program Engineering Accred. Comm. Of the Accred. Board for Engineering &Technology EAC/ABET)
Electrical Engineering Program EAC/ABET
Environmental Engr. Program EAC/ABET
Engr. Mechanics Program EAC/ABET
Materials Engineering Program EAC/ABET
Mineral Engineering Program EAC/ABET
Petroleum & Natural Gas EAC/ABETEngineering Program

New Mexico Institute of Mining and Technology
Performance Effectiveness Report - New Mexico’s Universities - November 2006 Page 11
FY 06 FY 07 FY 08
Sum/Fall/Spr 2001-02
Sum/Fall/Spr 2002-03
Sum/Fall/Spr 2003-04
Sum/Fall/Spr 2004-05
Sum/Fall/Spr 2005-06
Sum/Fall/Spr 2006-07
Target 35 40 40 40
Actual Not Avail. 36 30 38 36 Due Oct 1, 2007
Fall 96 Thru Sum 02
Fall 97 Thru Sum 03
Fall 98 Thru Sum 04
Fall 99 Thru Sum 05
Fall 00 Thru Sum 06
Fall 01 Thru Sum 07
Target 40.0% 42.0% 50% 50%Actual 41.0% 42.0% 39.0% 48.0% 45.0% Due Oct 1, 2007
Benchmark: CSRDE 6-year graduation rate data for similar institutions. 39.3% 42.0% 42.0% 45.3%
Fall 02 census Fall 03 census Fall 04 census Fall 05 census Fall 06 census Fall 07 censusTarget 60 60 60 80Actual 72 64 88 105 84 Due Oct 1, 2007
Benchmark: Percent of ACT test-takers in NM who are Hispanic or Native American compared to percent of NMT's 1st-Time Freshmen Class that is Hispanic of Native American 41.0% 41.0% 41.5%
Fall 01 to Fall 02
Fall 02 to Fall 03
Fall 03 to Fall 04
Fall 04 to Fall 05
Fall 05 to Fall 06
Fall 06 to Fall 07
Target 73.0% 75.0% 75.0% 75.0% 75.0%Actual 74.0% 73.0% 70.0% 68.0% 69.0% Due Oct 1, 2007
Benchmark: CSRDE retention data for similar institutions. 69.6% 69.0% 69.6% 69.6% 74.3%
Sum/Fall/Spr 2001-02
Sum/Fall/Spr 2002-03
Sum/Fall/Spr 2003-04
Sum/Fall/Spr 2004-05
Sum/Fall/Spr 2005-06
Sum/Fall/Spr 2006-07
Target 35 41 132 150 100Actual 31 34 130 146 94 Due Oct 1, 2007
Sum/Fall/Spr 2001-02
Sum/Fall/Spr 2002-03
Sum/Fall/Spr 2003-04
Sum/Fall/Spr 2004-05
Sum/Fall/Spr 2005-06
Sum/Fall/Spr 2006-07
Target 97 105 297 300 248Actual 77 164 276 255 242 Due Oct 1, 2007
FY 2001-02 FY 2002-03 FY 2003-04 FY 2004-05 FY 2005-06 FY 2006-07Target 55M 58M 64M 71M 75M
Actual 49M 71M 62M 70M 85M Due Oct 1, 2007
Research Expenditures
Common Measures
Transfer Measure: Number of Undergraduate Transfer Students from Two-Year Colleges
Completion Measure: Percent of Full-Time, Degree-Seeking, First-Time Freshmen
Access Measure: Number of Hispanic and Native American Students in NMT's First-Time Freshmen Class.
Retention Measure: Percent of Full-Time, First-Time Freshmen Returning for Their Second Fall
Institutional Specific Measures
Enrollment in NMT's Master of Science Teaching Program
Enrollment in Distance Education
Reporting Data for DFA SubmittalsNew Mexico Institute of Mining and Technology
Trend Data DFA Column Labels

Performance Effectiveness Report - New Mexico’s Universities - November 2006Page 12
This page intentionally blank.

Performance Effectiveness Report - New Mexico’s Universities - November 2006 Page 13
Associate’s 4Bachelor’s 77Master’s 50Post-Master’s 2Doctorate 22
Institutional Profile ofNew Mexico State University
Mission: New Mexico State University is the state’s land-grant university, serving the educational needs ofNew Mexico’s diverse population through comprehensive programs of education, research, extension education,and public service.
Fall 2006 Overall Main Campus Enrollment by Level
On-Campus Off-Campus UnduplicatedCount
Degree-seeking undergraduate 12,399 3,746 12,720
Non-degree seeking undergraduate 117 43 149
First Professional 0 0 0
Graduates 2,739 1,323 3,112
Non-degree seeking post-baccalaureate 284 236 434
Total Headcount 15,539 5,348 16,415
Total Full-time Equivalent 12,793
Number of program majors at the following degree levels for 2006-07:
2006-2007 total current funds revenue for main campus: $439,722,599
2006-2007 total state appropriation for main campus as apercent of total main campus operating budget: 36%
New Mexico State University
Performance Effectiveness Report - New Mexico’s Universities - November 2006Page 14
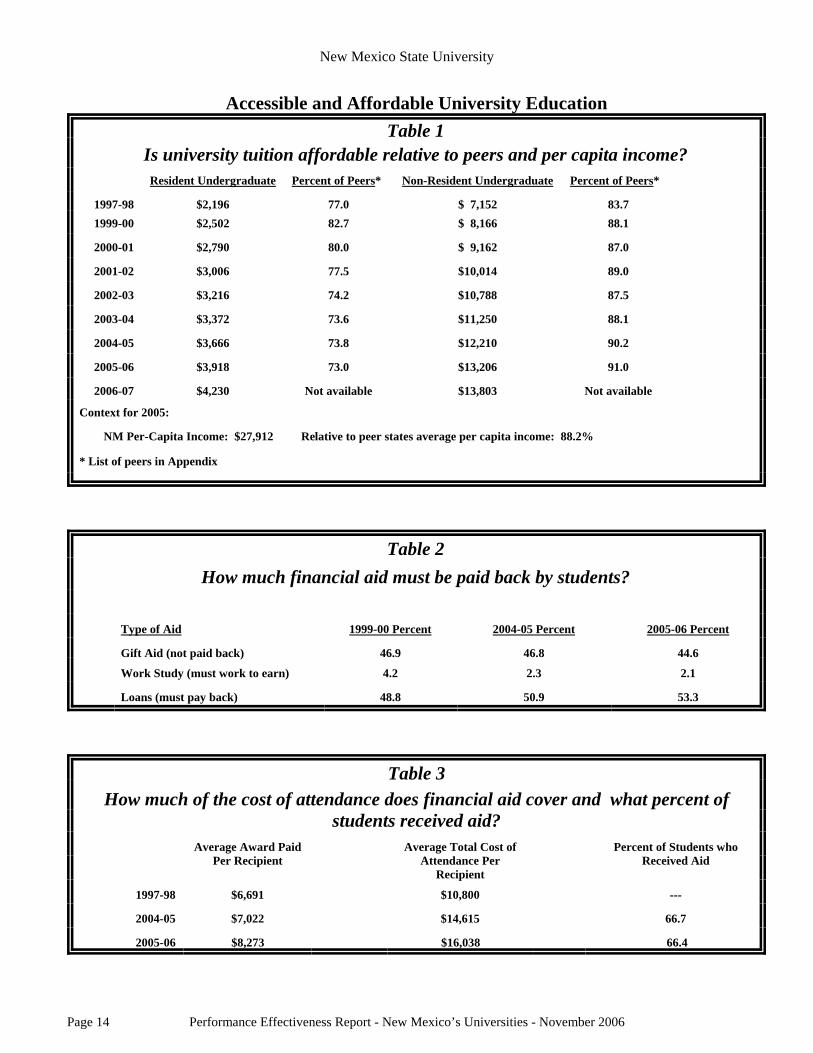
Accessible and Affordable University EducationTable 1
Is university tuition affordable relative to peers and per capita income?Resident Undergraduate Percent of Peers* Non-Resident Undergraduate Percent of Peers*
1997-98 $2,196 77.0 $ 7,152 83.71999-00 $2,502 82.7 $ 8,166 88.1
2000-01 $2,790 80.0 $ 9,162 87.0
2001-02 $3,006 77.5 $10,014 89.0
2002-03 $3,216 74.2 $10,788 87.5
2003-04 $3,372 73.6 $11,250 88.1
2004-05 $3,666 73.8 $12,210 90.2
2005-06 $3,918 73.0 $13,206 91.0
2006-07 $4,230 Not available $13,803 Not available
Context for 2005:
NM Per-Capita Income: $27,912 Relative to peer states average per capita income: 88.2%
* List of peers in Appendix
Table 2How much financial aid must be paid back by students?
Type of Aid 1999-00 Percent 2004-05 Percent 2005-06 Percent
Gift Aid (not paid back) 46.9 46.8 44.6
Work Study (must work to earn) 4.2 2.3 2.1
Loans (must pay back) 48.8 50.9 53.3
Table 3How much of the cost of attendance does financial aid cover and what percent of
students received aid?Average Award Paid
Per RecipientAverage Total Cost of
Attendance PerRecipient
Percent of Students whoReceived Aid
1997-98 $6,691 $10,800 ---
2004-05 $7,022 $14,615 66.7
2005-06 $8,273 $16,038 66.4

New Mexico State University
Performance Effectiveness Report - New Mexico’s Universities - November 2006 Page 15
Accessible and Affordable University Education
Table 4Does enrollment reflect diversity of the state?
Total EnrollmentFirst-Time Freshmen from
New MexicoNM HS
Graduates2005-06
%
NM ACTTakers
2005-06 %
Fall 1997
%
Fall2005
%
Fall2006
%
Fall 1997
%
Fall2005
%
Fall2006
%
Race/Ethnicity
American Indian 2.5 2.9 2.9 3.5 4.4 4.4 11.3 9.9
Asian 1.3 1.3 1.2 2.0 1.0 0.7 1.7 2.1
Black 2.2 2.8 2.8 0.1 1.9 1.5 2.3 1.7
Hispanic 36.1 41.4 41.1 40.9 46.9 47.6 44.8 31.7
White/Other 53.8 47.6 47.8 51.5 45.9 45.8 39.9 35.9
Nonresident Alien 4.0 4.1 4.2 0.0 0.0 0.1 0.0 0.0
Unknown 0.0 0.0 0.0 0.0 0.0 0.0 0.0 18.7
Total Number 15,067 16,072 16,415 1,213 1,668 1,699 19,174 11,539
Table 5
What proportion of our transfer students come from 2-year colleges?
Fall 1997 Fall 2005 Fall 2006
N % N % N %
NM 2-Yr Colleges and Branches 301 35.4 297 43.1 210 29.1
Out-of-state 2-Yr Colleges 261 30.6 163 23.7 245 33.9
Subtotal 2-Yr Colleges 562 66.0 460 66.8 455 63.1
NM Public 4-Yr Universities 81 9.5 78 11.3 130 18.0
All Other Transfers 209 24.5 151 21.9 137 18.9
Grand Total 852 100.0 689 100.0 722 100.0

New Mexico State University
Performance Effectiveness Report - New Mexico’s Universities - November 2006Page 16
Student Progress and Student SuccessTable 6
How many freshmen return for second year?Entered in Fall 1997 Entered in Fall 2004 Entered in Fall 2005
CohortN
PercentEnrolled
in Fall 1998
CohortN
Percent Enrolledin Fall 2005
CohortN
Percent Enrolledin Fall 2006
Race/Ethnicity & Sex
American Indian 45 60.0 68 63.2 79 68.4
Asian 34 85.3 21 52.4 22 68.2
Black 49 73.5 69 60.9 58 74.1
Hispanic 702 72.6 955 69.0 901 74.9
White/Other 843 72.6 940 73.1 919 77.1
Nonresident Alien 22 72.7 8 100.0 11 81.8
Unknown -- -- 0 0.0 0 0.0
Men 794 71.7 936 67.8 877 73.1
Women 901 73.4 1,125 72.4 1,113 77.6
Overall 1,695 72.6 2,061 70.4 1,990 75.6
* First-time, full-time, degree-seeking freshmen75.6
Table 7What are our graduation rates?
Entered Fall 1991 Entered Fall 1999 Entered Fall 2000
Race/Ethnicityand Sex
CohortN
% Grador Still
EnrolledAfter 6Years*
CohortN
%BachelorsDegree in6 Years
% StillEnrolledAfter 6Years
% Grador Still
EnrolledAfter 6Years*
CohortN
%BachelorsDegree in6 Years
% StillEnrolledAfter 6Years
% Grador Still
EnrolledAfter 6Years*
American Indian 81 19.7 68 29.4 5.9 35.3 68 42.6 11.8 54.4
Asian 16 43.8 36 38.9 5.6 44.5 29 58.6 13.8 62.1
Black 20 35.0 55 43.6 7.3 50.9 52 44.2 17.3 63.5
Hispanic 581 47.0 961 39.8 10.8 50.6 842 45.5 19.6 66.4
White/Other 944 51.3 1,077 44.7 7.5 51.5 966 46.4 13.8 62.0
Nonresident Alien 14 78.6 15 40.0 6.7 46.7 28 32.1 3.6 35.7
Unknown 0 0.0 0.0 0.0 0.0 0.0 0 0.0 0.0 0.0
Men 809 47.3 984 37.4 9.8 47.2 894 40.9 17.6 59.4
Women 847 49.1 1,228 45.5 8.1 53.6 1,091 49.8 14.9 66.8
Overall 1,656 48.2 2,212 41.9 8.9 50.8 1,985 45.8 16.1 63.5
Graduation/Retention Rates of Full-Time, First-Time, Degree-Seeking Freshmen After 6 Years
* Includes Associate degree recipients.

New Mexico State University
Performance Effectiveness Report - New Mexico’s Universities - November 2006 Page 17
Student Progress and Student Success
Table 8What degrees were awarded in 2005-06?
Associate Bachelors Masters Post-Masters
Doctors First-Professional
Total
Agriculture-related 124 39 6 169
Architecture-related 5 5
Business / Public Administration 21 473 70 4 568
Education 282 307 1 25 615
Engineering / Tech / Computer 254 137 9 400
Health Professions (w/o Nursing) 34 19 53
Home Economics 58 18 76
Humanities/Social Science 3 534 100 3 7 647
Law / Protective Services 18 121 14 153
Nursing 103 14 117
Science and Math 136 51 28 215
Social Work 63 66 129
Total 42 2,187 835 4 79 3,147
Table 9What are our alumni doing?
Percent Employed (may also be in school): 92.7% Percent Continuing Their Education: 17.3%
In what fields are they employed?Private or Self Education Government or Military Other
Employment Fields 46.1 22.7 24.6 6.6
What percent of alumni are working in New Mexico?Percent of employed: 39.9%
* See Appendix II for survey instrument (2002-03 Survey of 1998-99 Bachelors Degree Recipients)

New Mexico State University
Performance Effectiveness Report - New Mexico’s Universities - November 2006Page 18
Academic Quality and a Quality Learning EnvironmentTable 10
How diverse are our faculty and staff?Fall 1997 Fall 2004 Fall 2005
Full-TimeFaculty %(N = 664)
Full-TimeStaff %
(N = 2,289)
Full-TimeFaculty %(N = 699)
Full-TimeStaff %
(N = 2,643)
Full-TimeFaculty %(N =674 )
Full-TimeStaff %
(N = 2,863 )
Race/Ethnicity & Sex
American Indian 0.6 1.2 0.9 1.5 0.7 1.4
Asian 5.0 1.2 5.7 1.3 4.5 1.0Black 0.0 1.0 0.7 1.5 0.6 1.1
Hispanic 8.9 42.4 10.5 43.2 10.4 38.7
White/Other 85.4 54.0 79.9 50.5 73.3 44.1
Nonresident Alien 0.0 0.0 0.0 0.0 6.2 1.9
Unknown 0.1 0.3 2.3 2.0 4.3 11.8
Men 67.5 51.7 62.5 46.2 63.5 49.2
Women 32.5 48.3 37.5 53.8 36.5 50.8
Table 11Do our faculty hold the highest degree in their fields?
Percent of faculty holding highest degree
Fall 1997 83.0
Fall 2004 83.0
Fall 2005 83.2
Table 12
Are we making progress on faculty pay commensurate with our peers?
Average Salary % of Peer Average Average Compensation % of Peer Average
Fall 1997 $47,472 87.8 $57,810 87.1
Fall 2004 $60,614 87.1 $76,891 87.7
Fall 2005 $60,653 83.2 $75,334 81.4

New Mexico State University
Performance Effectiveness Report - New Mexico’s Universities - November 2006 Page 19
Academic Quality and a Quality Learning Environment
Table 13
What percent of classroom instruction is delivered by tenured/tenure-track faculty?
Fall 1997 Fall 2004 Fall 2005
Percent Percent Percent
Course Level
Lower Division 45.0 38.4 31.8
Upper Division 74.6 67.1 64.0
Graduate Division 86.5 84.0 78.1
Overall 58.7 53.1 61.0
Classroom instruction excludes labs, theses, internships, independent studies, etc.
Table 14What are our student to faculty ratios?
Fall 1999 18.9 to 1
Fall 2004 17.2 to 1
Fall 2005 18.7 to 1
* FTE Students/FTE Instructional Faculty
Table 15How large are our classes?
Fall 1999 Average Fall 2004 Average Fall 2005 Average
Undergraduate, lower division 24 38 36
Undergraduate, upper division 16 21 22
Graduate 8 10 10

New Mexico State University
Performance Effectiveness Report - New Mexico’s Universities - November 2006Page 20
Academic Quality and a Quality Learning Environment
Table 16
How satisfied are our students with their educational experience?
2003-2004
Satisfied or Very Satisfied with Curriculum and Instruction 82.9%
Satisfied or Very Satisfied with Student Support 83.1%
Satisfied or Very Satisfied Overall with Institution 87.8%
* See Appendix III (Survey of Graduating Seniors in 2002-03)
Table 17
How satisfied are our alumni with their educational experience?
2003-2004
Satisfied or Very Satisfied with Curriculum and Instruction 93.0%
Satisfied or Very Satisfied with Student Support 84.2%
Satisfied or Very Satisfied Overall with Institution 94.3%
* See Appendix II for survey instrument (2002-03 Survey of 1998-99 Bachelors Degree Recipients)

New Mexico State University
Performance Effectiveness Report - New Mexico’s Universities - November 2006 Page 21
Effective and Efficient Use of Resources
Table 18
What percent of fiscal resources are allocated to our primary mission of instruction,research and public service?
Percent for Institution Percent for Peers
1996-97 70.6 65.7
2002-03 76.3 71.0
2003-04 74.8 71.2
2004-05 76.1 70.8
Table 19
What percent of fiscal resources are allocated to administrative costs?
Percent for Institution Percent for Peers
1996-97 5.6 6.3
2002-03 5.5 6.4
2003-04 5.6 6.1
2004-05 6.1 6.1

New Mexico State University
Performance Effectiveness Report - New Mexico’s Universities - November 2006Page 22
Listing of Accreditations
NMSU North Central Association of Colleges & Secondary Schools
Counseling Center International Association of Counseling Services
Student Health Center Accreditation Association for Ambulatory Health Care
Department. of Family & ConsumerSciences
National Council for the Accreditation of Teacher EducationCommission on Accreditation for Dietetics Education
Department of Agricultural & ExtensionEducation
National Council for the Accreditation Teacher Education
Department of Animal & Range Sciences Society for Range Management
Department of Chemistry & Biochemistry (B.S. in Chemistry Program)
American Chemical Society
Department of Journalism & MassCommunications
Accrediting Council on Education for Journalism & MassCommunications
Department of Music National Association of Schools of Music
Department of Psychology(Graduate Programs in EngineeringPsychology)
Human Factors and Ergonomics Society
Master of Public Administration National Association of Schools of Public Affairs & Administration
Master of Business Administration American Assembly of Collegiate Schools of Business (AACSB) – TheInternational Association for Management Education
Undergraduate Business Program AACSB – The International Association for Management Education
Bachelor & Master of Accountancy AACSB – The International Association for Management Education
Doctorate in Business Administration AACSB – The International Association for Management Education
Athletic Training Education Committee on Allied Health Education & Accreditation
Communications Disorders (Masters) American Speech & Hearing Association
Counseling & Guidance (School Counseling Track)
NM Public Education DepartmentNational Council for the Accreditation of Teacher EducationAmerican Psychological AssociationCouncil for Accreditation of Counseling & Related EducationalPrograms
Curriculum & Instruction (Educ. Specialist & Doctoral Programs)
NM Public Education DepartmentNational Council for the Accreditation of Teacher Education
Educational Administration (Educ. Specialist & Doctoral Programs)
NM Public Education DepartmentNational Council for the Accreditation of Teacher EducationUniversity Council for Educational Administration
New Mexico State University
Performance Effectiveness Report - New Mexico’s Universities - November 2006 Page 23
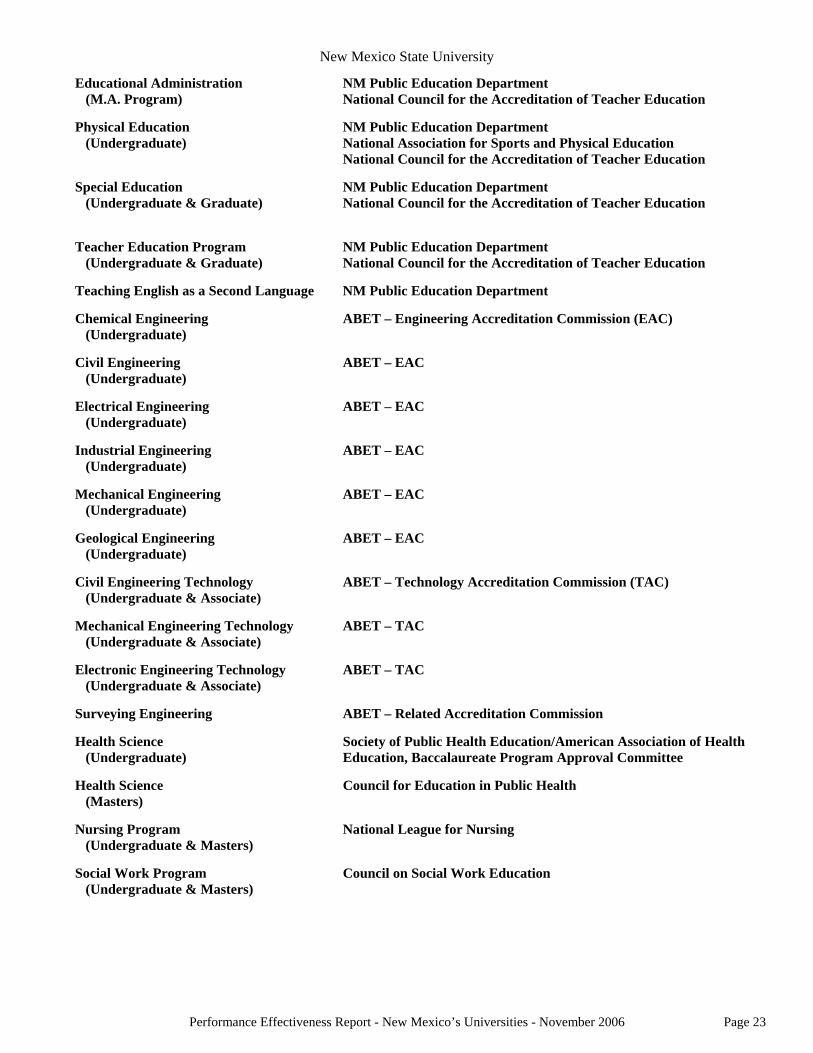
Educational Administration (M.A. Program)
NM Public Education DepartmentNational Council for the Accreditation of Teacher Education
Physical Education (Undergraduate)
NM Public Education DepartmentNational Association for Sports and Physical EducationNational Council for the Accreditation of Teacher Education
Special Education (Undergraduate & Graduate)
NM Public Education DepartmentNational Council for the Accreditation of Teacher Education
Teacher Education Program (Undergraduate & Graduate)
NM Public Education DepartmentNational Council for the Accreditation of Teacher Education
Teaching English as a Second Language NM Public Education Department
Chemical Engineering (Undergraduate)
ABET – Engineering Accreditation Commission (EAC)
Civil Engineering (Undergraduate)
ABET – EAC
Electrical Engineering (Undergraduate)
ABET – EAC
Industrial Engineering (Undergraduate)
ABET – EAC
Mechanical Engineering (Undergraduate)
ABET – EAC
Geological Engineering (Undergraduate)
ABET – EAC
Civil Engineering Technology (Undergraduate & Associate)
ABET – Technology Accreditation Commission (TAC)
Mechanical Engineering Technology (Undergraduate & Associate)
ABET – TAC
Electronic Engineering Technology (Undergraduate & Associate)
ABET – TAC
Surveying Engineering ABET – Related Accreditation Commission
Health Science (Undergraduate)
Society of Public Health Education/American Association of HealthEducation, Baccalaureate Program Approval Committee
Health Science (Masters)
Council for Education in Public Health
Nursing Program (Undergraduate & Masters)
National League for Nursing
Social Work Program (Undergraduate & Masters)
Council on Social Work Education

New Mexico State University
Performance Effectiveness Report - New Mexico’s Universities - November 2006Page 24
FY 06 FY 07 FY 08
Sum/Fall/Spr 2001-02
Sum/Fall/Spr 2002-03
Sum/Fall/Spr 2003-04
Sum/Fall/Spr 2004-05
Sum/Fall/Spr 2005-06
Sum/Fall/Spr 2006-07
Target 974 1,028 1,028 1,028Actual 929 872 926 884 656 Due Oct 1, 2007
Fall 96 Thru Sum 02
Fall 97 Thru Sum 03
Fall 98 Thru Sum 04
Fall 99 Thru Sum 05
Fall 00 Thru Sum 06
Fall 01 Thru Sum 07
Target 48.0% 50.0% 50.0% 50.0% 50.0%Actual 45.9% 42.7% 43.2% 41.9% 45.00% Due Oct 1, 2007
Benchmark: CSRDE 6-yr graduation rate data for similar institutions. 41.2% 42.1% 44.5% 45.0%
Fall 02 census
Fall 03 census
Fall 04 census
Fall 05 census
Fall 06 census
Fall 07 census
Target 84 100 116 116 116 116Actual 86 85 75 79 76 Due Oct 1, 2007
Benchmark: Percent ACT test-takers in NM who are Native American compared to percent of NMSU's 1st-Time Freshman Class that is Native American.
9.1% (NMSU =
3.6%)
9.3% (NMSU =
3.6%)
9.0% (NMSU = 3.87%)
9.9% (NMSU = 3.79%)
Fall 01 to Fall 02
Fall 02 to Fall 03
Fall 03 to Fall 04
Fall 04 to Fall 05
Fall 05 to Fall 06
Fall 06 to Fall 07
Target 73.0% 75.0% 75.0% 75.0% 75.0%Actual 70.6% 71.7% 73.3% 70.4% 75.6% Due Oct 1, 2007
Benchmark: CSRDE 6-yr graduation rate data for similar institutions. 71.5% 71.8% 72.3% 72.5%
FY 2001-02 FY 2002-03 FY 2003-04 FY 2004-05 FY 2005-06 FY 2006-07Target 9 17 21 27 28Actual 6 13 16 23 27 Due Oct 1, 2007
FY 2001-02 FY 2002-03 FY 2003-04 FY 2004-05 FY 2005-06 FY 2006-07Target 75.0% 75.0% 75.0% 85.0% 91.0% 91.0%Actual 90.0% 92.0% 84.0% 89.0% 94.00% Due Oct 1, 2007
FY 2001-02 FY 2002-03 FY 2003-04 FY 2004-05 FY 2005-06 FY 2006-07Target 2 3 5 5 5Actual 1 3 4 5* 4 Due Oct 1, 2007
FY 2001-02 FY 2002-03 FY 2003-04 FY 2004-05 FY 2005-06 FY 2006-07Target $167.4 $175.8 $175.8 $185.0 $185.0
Actual $152.2 $165.9 $160.7 $181.1 $184.2** Due Oct 1, 2007
*misreported; actual was 4**calculations for 2005-06 actuals are different than those for previous years and are therefore not comparavble to past years
Number of NMSU teacher preparation programs available at NM community college sites
Total Restricted Research, Public Services Expenditures, and Student Aid Expenditures for all NMSU campuses.
Common MeasuresTransfer Measure: Number of Undergraduate Transfer Students from Two-Year Colleges
Completion Measure: Percent of Full-Time, Degree-Seeking, First-Time Freshmen Completing an Academic Program Within Six Years
Access Measure: Number of First-Year, Native American Students Enrolled
Retention Measure: Percent of Full-time, Degree-seeking, First-time Freshmen Who Re-enroll the Following Fall Semester
Institutional Specific Measures -- Main CampusNumber of Degrees Programs Offered Via Distance Education
Departments/Programs using the results of direct outcomes assessments of student learning.
Reporting Data for DFA SubmittalsNew Mexico State University - Main Campus
Trend Data DFA Column Labels

Performance Effectiveness Report - New Mexico’s Universities - November 2006 Page 25
Associate’s 2Bachelor’s 94Master’s 70Post-Master’s 5Graduate Certificates 5Doctorate 37First Professional 3
Institutional Profile ofUniversity of New Mexico
Mission: The University will engage students, faculty, and staff in its comprehensive educational, research,and service programs. UNM will provide students the values, habits of mind, knowledge, and skills that theyneed to be enlightened citizens, to contribute to the state and national economies, and to lead satisfying lives.Faculty, staff, and students create, apply, and disseminate new knowledge and creative works; the provideservices that enhance New Mexicans’ quality of life and promote economic development; and they advance ourunderstanding of the world, its peoples, and cultures. Building on its educational, research, and creativeresources, the University provides services directly to the City and State, including health care, social services,policy studies, commercialization of inventions, and cultural events.
Fall 2006 Overall Main Campus Enrollment by Level
On-Campus Off-Campus UnduplicatedCount
Degree-seeking undergraduate 17,624 1,974 18,152
Non-degree seeking undergraduate 1,631 250 1,786
First Professional - Medicine 306 0 306
First Professional - Law 344 0 344
First Professional - PharmD 359 0 359
Graduates 4,600 425 4,834
Total Headcount 24,864 2,649 25,817
Total Full-time Equivalent 20,289
Number of program majors at the following degree levels for 2006-07:
2006-2007 total current funds revenue for maincampus: $605,816,953
2006-2007 total state appropriation for main campusas a percent of total main campus operating budget: 25.3%

University of New Mexico
Performance Effectiveness Report - New Mexico’s Universities - November 2006Page 26
Accessible and Affordable University Education
Table 1Is university tuition affordable relative to peers and per capita income?
Resident Undergraduate Percent of Peers* Non-Resident Undergraduate Percent of Peers*
1997-98 $2,165 71.8 $ 8,174 86.3
2000-01 $2,795 81.5 $10,548 96.0
2001-02 $3,026 82.9 $11,424 97.5
2002-03 $3,169 78.6 $11,436 89.3
2003-04 $3,313 70.7 $11,954 84.9
2004-05 $3,738 71.4 $12,500 81.6
2005-06 $4,109 71.7 $13,438 81.8
2006-07 $4,336 Not available $14,177 Not Available
Context for 2005:
NM Per-Capita Income: $27,912 Relative to peer states average per capita income: 88.3%
* List of peers in Appendix
Table 2How much financial aid must be paid back by students?
Type of Aid 1999-00 Percent 2004-05 Percent 2005-06 Percent
Gift Aid (not paid back) 38.0 40.9 41.4
Work Study (must work to earn) 4.1 2.9 2.8
Loans (must pay back) 57.9 56.2 55.8
Table 3How much of the cost of attendance does financial aid cover and what percent of
students received aid?Average Award Paid
Per RecipientAverage Total Cost of
Attendance PerRecipient
Percent of Students whoReceived Aid
1997-98 $7,858 $12,242 53.5
2004-05 $8,623 $14,812 64.2
2005-06 $8,720 $15,618 65.1

University of New Mexico
Performance Effectiveness Report - New Mexico’s Universities - November 2006 Page 27
Accessible and Affordable University Education
Table 4Does enrollment reflect diversity of the state?
Total EnrollmentFirst-Time Freshmen from
New MexicoNM HS
Graduates2005-06
%
NM ACTTakers2005-06
%
Fall 1997
%
Fall2005
%
Fall2006
%
Fall 1997
%
Fall2005
%
Fall2006
%
Race/Ethnicity
American Indian 4.7 5.8 5.9 5.9 4.7 5.5 11.3 9.9
Asian 3.0 3.4 3.6 3.7 3.6 4.6 1.7 2.1
Black 2.4 2.6 2.8 1.2 2.2 2.9 23 1.7
Hispanic 24.4 30.0 30.5 36.3 41.2 39.3 44.8 31.7
White/Other 60.2 48.1 49.0 52.2 44.3 44.7 39.9 35.9
Nonresident Alien 2.6 3.3 3.3 0.0 0.1 0.2 0.0 0.0
Unknown 2.8 6.8 5.0 0.8 3.8 3.0 0.0 18.7
Total Number 24,063 26,280 25,817 1,695 2,725 2,627 19,174 11,539
Table 5
What proportion of our transfer students come from 2-year colleges?
Fall 1997 Fall 2005 Fall 2006
N % N % N %
NM 2-Yr Colleges and Branches 583 39.0 744 54.3 747 54.9
Out-of-state 2-Yr Colleges 191 12.8 132 9.6 112 8.2
Subtotal 2-Yr Colleges 774 51.8 876 64.0 859 63.2
NM Public 4-Yr Universities 154 10.3 141 10.3 126 9.3
All Other Transfers 566 37.9 352 25.7 375 27.6
Grand Total 1,494 100.0 1,369 100.0 1,360 100.0

University of New Mexico
Performance Effectiveness Report - New Mexico’s Universities - November 2006Page 28
Student Progress and Student SuccessTable 6
How many freshmen return for second year?Entered in Fall 1997 Entered in Fall 2004 Entered in Fall 2005
CohortN
PercentEnrolled
in Fall 1998
CohortN
Percent Enrolledin Fall 2005
CohortN
Percent Enrolledin Fall 2006
Race/Ethnicity & Sex
American Indian 118 56.8 180 65.6 136 55.1
Asian 74 83.8 95 81.1 115 80.0
Black 43 67.4 108 80.6 81 77.8
Hispanic 691 71.3 1,134 75.7 1,160 73.0
White/Other 1,158 72.3 1,328 76.5 1,390 76.0
Nonresident Alien 8 87.5 10 70.0 20 90.0
Unknown 21 66.7 168 78.6 115 80.9
Men 959 69.4 1,304 72.3 1,294 72.3
Women 1,154 73.1 1,719 78.7 1,723 76.0
Overall 2,113 71.4 3,023 76.0 3,017 74.4
* First-time, full-time, degree-seeking freshmen
Table 7What are our graduation rates?
Entered Fall 1991 Entered Fall 1999 Entered Fall 2000
Race/Ethnicityand Sex
CohortN
% Grador Still
EnrolledAfter 6Years*
CohortN
%BachelorsDegree in6 Years
% StillEnrolledAfter 6Years
% Grador Still
EnrolledAfter 6Years*
CohortN
%BachelorsDegree in6 Years
% StillEnrolledAfter 6Years
% Grador Still
EnrolledAfter 6Years*
American Indian 79 27.8 91 28.6 15.4 44.0 105 27.6 13.3 41.0
Asian 39 64.1 94 47.9 8.5 56.4 86 41.9 18.6 60.5
Black 34 44.1 85 25.9 15.3 41.2 72 30.6 11.1 41.7
Hispanic 573 48.2 934 39.7 10.3 50.0 943 41.0 10.8 51.9
White/Other 954 53.2 1,421 43.5 8.5 52.0 1,297 47.0 8.6 55.6
Nonresident Alien 19 68.4 22 45.5 4.5 50.0 11 72.7 0.0 72.7
Unknown 3 66.7 53 32.1 7.5 39.6 59 37.3 8.5 45.8
Men 795 44.75 1,198 36.4 9.7 46.1 1,103 40.3 11.2 51.6
Women 906 56.0 1,502 44.8 9.4 54.2 1,470 45.5 9.0 54.5
Overall 1,701 50.6 2,700 41.1 9.5 50.6 2,573 43.3 9.9 53.2
Graduation/Retention Rates of Full-Time, First-Time, Degree-Seeking Freshmen After 6 Years
* Includes Associate degree recipients.

University of New Mexico
Performance Effectiveness Report - New Mexico’s Universities - November 2006 Page 29
Student Progress and Student Success
Table 8What degrees were awarded in 2005-06?
Associate Bachelors Masters Post-Masters
Doctors First-Professional
Total
Agriculture-related
Architecture-related 42 48 6 96
Business / Public Administration 480 240 2 722
Education 414 395 26 34 869
Engineering / Tech / Computer 191 173 3 38 405
Health Professions (w/o Nursing) 7 93 86 11 132 329
Home Economics 47 12 59
Humanities/Social Science 1,314 186 62 1,562
Law / Protective Services 129 117 246
Nursing 157 45 4 206
Science and Math 286 47 36 369
Social Work
Total 7 3,153 1,232 41 181 249 4,863
Table 9What are our alumni doing?
Percent Employed (may also be in school): 88.6 Percent Continuing Their Education: 19.3
In what fields are they employed?Private or Self Education Government or Military Other
Employment Fields 45.0 31.4 16.5 5.5
What percent of alumni are working in New Mexico?Percent of employed: 66.1
* See Appendix II for survey instrument (2002-03 Survey of 1998-99 Bachelors Degree Recipients)

University of New Mexico
Performance Effectiveness Report - New Mexico’s Universities - November 2006Page 30
Academic Quality and a Quality Learning Environment
Table 10
How diverse are our faculty and staff?Fall 1997 Fall 2004 Fall 2005
Full-TimeFaculty %(N = 1,375)
Full-TimeStaff %
(N = 4,544)
Full-TimeFaculty %(N = 1,501 )
Full-TimeStaff %
(N = 4,580)
Full-TimeFaculty %
(N = 1,514 )
Full-TimeStaff %
(N = 4,512 )
Race/Ethnicity & Sex
American Indian 1.6 3.5 2.2 4.7 2.4 4.0
Asian 4.1 1.5 5.9 1.8 6.0 2.0Black 0.8 2.4 1.4 2.1 1.9 1.9
Hispanic 8.8 31.9 8.9 33.9 9.0 34.2
White/Other 81.0 58.8 77.1 55.2 75.9 55.2
Nonresident Alien 2.6 0.7 3.7 0.9 3.6 0.9
Unknown 1.1 1.1 0.9 1.5 1.1 1.7
Men 63.9 39.2 58.9 37.3 57.9 37.1
Women 36.1 60.8 41.1 62.7 42.1 62.9
Table 11Do our faculty hold the highest degree in their fields?
Percent of faculty holding highest degree
Fall 1997 87.1
Fall 2004 85.7
Fall 2005 85.9
Table 12
Are we making progress on faculty pay commensurate with our peers?
Average Salary % of Peer Average Average Compensation % of Peer Average
Fall 1997 $53,736 90.2 $64,421 88.0
Fall 2004 $71,755 92.9 $86,711 89.2
Fall 2005 $73,269 91.3 $88,715 87.6

University of New Mexico
Performance Effectiveness Report - New Mexico’s Universities - November 2006 Page 31
Academic Quality and a Quality Learning Environment
Table 13
What percent of classroom instruction is delivered by tenured/tenure-track faculty?
Fall 1997 Fall 2004 Fall 2005
Percent Percent Percent
Course Level
Lower Division 33.4 20.1 23.1
Upper Division 65.4 55.0 51.4
Graduate Division 82.7 72.4 71.9
Overall 52.6 37.9 38.3
Classroom instruction excludes labs, theses, internships, independent studies, etc.
Table 14What are our student to faculty ratios?
Fall 1999 18.8 to 1
Fall 2004 20.0 to 1
Fall 2005 19.2 to 1
* FTE Students/FTE Instructional Faculty
Table 15How large are our classes?
Fall 1999 Average Fall 2004 Average Fall 2005 Average
Undergraduate, lower division 39 37 36
Undergraduate, upper division 22 20 20
Graduate 11 11 10
University of New Mexico
Performance Effectiveness Report - New Mexico’s Universities - November 2006Page 32
Academic Quality and a Quality Learning Environment
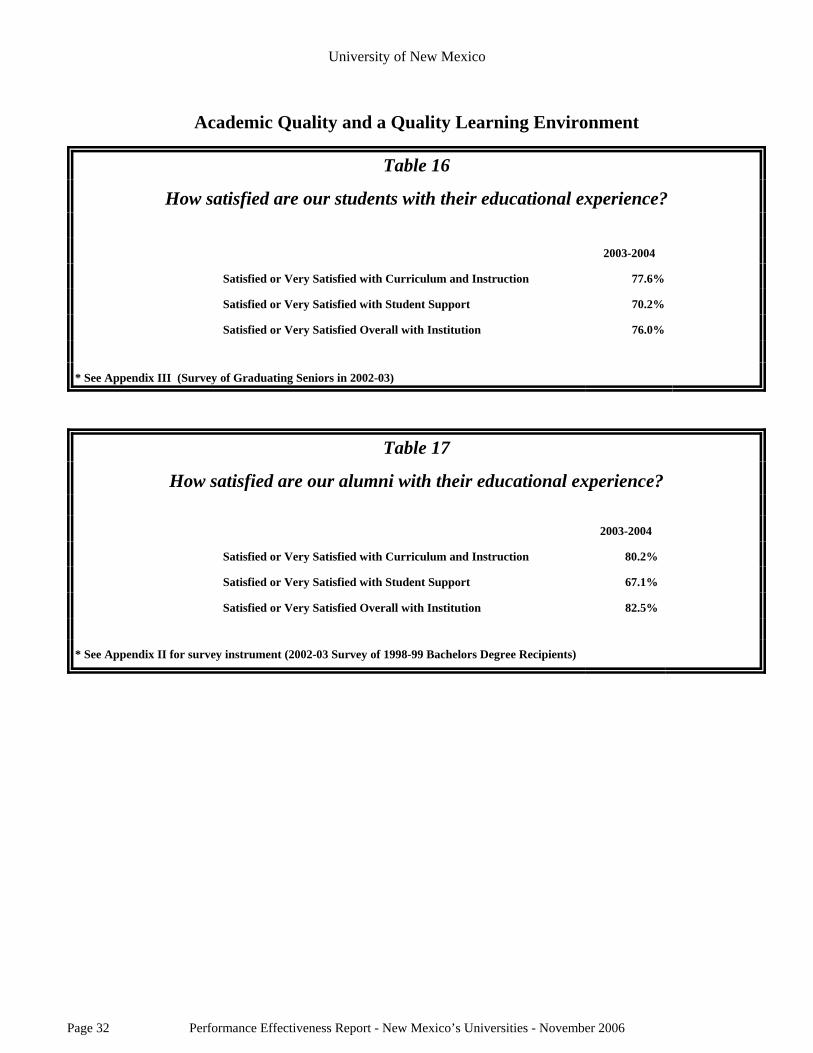
Table 16
How satisfied are our students with their educational experience?
2003-2004
Satisfied or Very Satisfied with Curriculum and Instruction 77.6%
Satisfied or Very Satisfied with Student Support 70.2%
Satisfied or Very Satisfied Overall with Institution 76.0%
* See Appendix III (Survey of Graduating Seniors in 2002-03)
Table 17
How satisfied are our alumni with their educational experience?
2003-2004
Satisfied or Very Satisfied with Curriculum and Instruction 80.2%
Satisfied or Very Satisfied with Student Support 67.1%
Satisfied or Very Satisfied Overall with Institution 82.5%
* See Appendix II for survey instrument (2002-03 Survey of 1998-99 Bachelors Degree Recipients)

University of New Mexico
Performance Effectiveness Report - New Mexico’s Universities - November 2006 Page 33
Effective and Efficient Use of Resources
Table 18
What percent of fiscal resources are allocated to our primary mission of instruction,research and public service?
Percent for Institution Percent for Peers
1996-97 76.1 64.5
2002-03 76.7 70.6
2003-04 77.2 70.3
2004-05 74.2 70.1
Table 19
What percent of fiscal resources are allocated to administrative costs?
Percent for Institution Percent for Peers
1996-97 5.1 6.0
2002-03 4.5 6.6
2003-04 4.3 6.4
2004-05 6.2 6.6

University of New Mexico
Performance Effectiveness Report - New Mexico’s Universities - November 2006Page 34
Listing of Accreditations
UNM North Central AssociationB.B.A., M.B.A., E.M.B.A., & Masters ofAccountancy
American Assembly of Collegiate Schools of Business
Accounting, undergraduate & graduate American Assembly of Collegiate Schools of Business
Masters in Public Administration National Association of Schools of Public Affairs &Admin.
Master of Architecture National Architectural Accrediting BoardMaster of Community & Regional Planning Planning Accreditation BoardMaster of Landscape Architecture Landscape Architectural Accreditation BoardUndergraduate Program American Chemical SocietyPh.D. Clinical Psychology American Psychological AssociationSpeech/Language Pathology, M.S. &Audiology, M.S.
American Speech Language Hearing Association
M.A. and Ph.D. Counselor Education Council for the Accreditation of Counseling & RelatedEducation Programs
B.A., M.A., & Ph.D. All programs forpreparation of teachers, schooladministrators, and guidance counselors
National Council for Accreditation of TeacherEducation and the New Mexico State Board ofEducation
B.S. Athletic Training Program Commission on Acc. Of Allied Health Educ. ProgramsB.S. in Nutrition, Nutrition/Dietetics Program.Post B.S. in Dietetics
Commission on Accreditation/Approval for DieteticsEducation of the American Dietetic Association
M.A., Ed.S. and Ed.D. All programs inEducational Administration and Leadership
University Council for Educational Administration
B.S. Chemical Engineering EAC / ABET
B.S. Nuclear Engineering EAC / ABETB.S. Civil Engineering EAC / ABETB.S. Construction Engineering EAC / ABETB.S. Electrical Engineering EAC / ABETB.S. Computer Engineering EAC / ABETB.S. Mechanical Engineering EAC / ABETB.S. Computer Science Computer Science Accreditation Comm. Of the
Computing Sciences Accreditation Board
B.S. Construction Management American Council for Construction EducationB.M., B.A., B.M.E. & M.M. Music National Association of Schools of MusicB.A., B.F.A. & M.A. Theatre National Association of Schools of TheatreB.A. and M.A. Dance National Association of Schools of DanceNursing National League of Nursing
Approval by the NM Board of Nursing.

University of New Mexico
Performance Effectiveness Report - New Mexico’s Universities - November 2006 Page 35
M.S.N. with a certificate in Nurse Midwifery American College of Nurse-Midwives, Division ofAccreditation
B.S. & Pharm.D., Pharmacy American Council on Pharmaceutical Education
M.D. Medicine Undergraduate MedicalEducation Curriculum
Liaison Committee on Medical Education Representingthe Association of American Medical Colleges & theAmerican Medical Association
"Part of a B.S. degree program & also a cert.Program.” Paramedic Course.
Comm. For Accreditation Of Health EducationPrograms, Joint Review Committee
B.S. and cert. Of completion Physician Asst.Educ.
Comm. On Accreditation Of Allied Health EducationPrograms
Masters in Public Health in CommunityHealth & Preventive Medicine, throughBiomedical Sciences Graduate Program
Council on Education for Public Health
B.S. Occupational Therapy Program Accreditation Council for Occupational Therapy
B.S. Physical Therapy Program Commission on Accreditation. In Physical TherapyEducation
B.S. or cert. For those with a B.S. Degree,Med. Laboratory Sciences
National Accrediting Agency for Clinical LaboratorySciences
B.S. Dental Hygiene Commission on Dental Accreditation
Dental Assisting Commission on Dental AccreditationLaw American Bar Assoc. and Association of American Law
Schools

University of New Mexico
Performance Effectiveness Report - New Mexico’s Universities - November 2006Page 36
FY 06 FY 07 FY 08
Sum/Fall/Spr 2001-02
Sum/Fall/Spr 2002-03
Sum/Fall/Spr 2003-04
Sum/Fall/Spr 2004-05
Sum/Fall/Spr 2005-06
Sum/Fall/Spr 2006-07
Target 1,560 1,590 1,610 1,630Actual 1,416 1,513 1,609 1,617 1,600 Due Oct 1, 2007
Fall 96 Thru Sum 02
Fall 97 Thru Sum 03
Fall 98 Thru Sum 04
Fall 99 Thru Sum 05
Fall 00 Thru Sum 06
Fall 01 Thru Sum 07
Target 41.0% 42.5% 44.0% 44.0%Actual 45.8% 42.5% 40.0% 41.1% 43.3% Due Oct 1, 2007
Benchmark 45.2% 45.9% 48.0%
Fall 02 census
Fall 03 census
Fall 04 census
Fall 05 census
Fall 06 census
Fall 07 census
Target 101 135 162 183 204 204Actual 118 122 161 129 144 Due Oct 1, 2007
Benchmark 216 235 244 245 237 241
Fall 01 to Fall 02
Fall 02 to Fall 03
Fall 03 to Fall 04
Fall 04 to Fall 05
Fall 05 to Fall 06
Fall 06 to Fall 07
Target 73.5% 75.0% 75.5% 76.0% 76.5% 76.6%Actual 76.3% 76.2% 75.2% 76.0% 74.4% Due Oct 1, 2007
Benchmark 74.8% 74.8% 75.4%
Sum/Fall/Spr 2001-02
Sum/Fall/Spr 2002-03
Sum/Fall/Spr 2003-04
Sum/Fall/Spr 2004-05
Sum/Fall/Spr 2005-06
Sum/Fall/Spr 2006-07
Target 125 150 170 190 190Actual 107 91 127 133 172 Due Oct 1, 2007
Sum/Fall/Spr 2001-02
Sum/Fall/Spr 2002-03
Sum/Fall/Spr 2003-04
Sum/Fall/Spr 2004-05
Sum/Fall/Spr 2005-06
Sum/Fall/Spr 2006-07
Target 1,210 1,275 1,300 1,325 1,350Actual 1,256 1,250 1,296 1,395 1,435 Due Oct 1, 2007
FY 2001-02 FY 2002-03 FY 2003-04 FY 2004-05 FY 2005-06 FY 2006-07Target $110.0 $112.2 $114.4 $116.7 $117.0Actual $100.8 $96.6 $103.3 $111.1 $112.3 Due Oct 1, 2007
Number of Degrees Awarded Utilizing Extended University Courses
Number of Post-baccalaureate Degrees Awarded: Main Campus
Increase External Research and Public Service Expenditures: Main Campus
Trend Data
Transfer Measure: Number of Undergraduate Transfer Students from Two-Year Colleges
Completion Measure: Percent of Full-Time, Degree-Seeking, First-Time Freshmen Completing an Academic Program Within Six Years
Retention Measure: Percent of Full-Time, First-Time Freshmen Who Re-enroll the Following Fall Semester
Institutional Specific Measures -- Main Campus
Access Measure: Increase Number of First-Year, Native American Students from New Mexico Enrolled
Reporting Data for DFA SubmittalsUniversity of New Mexico - Main Campus
DFA Column Labels
Common Measures

University of New Mexico - Health Sciences Center
Performance Effectiveness Report - New Mexico’s Universities - November 2006 Page 37
1997-98 1998-99 1999-00 2000-01 2001-02 2002-03 2003-04 2004-05 2005-06 2006-07 2007-08 2008-09 2009-10UNM-HSC
Target 25 25 25 25 25 25 25 25 Actual 10 23 48 25 17 24 18 21 41
Academic Years Include Summer, Fall, and Spring Semesters
HSC Degrees Granted Utilizing Extended University Courses
0
10
20
30
40
50
60
1997
-98
1998
-99
1999
-00
2000
-01
2001
-02
2002
-03
2003
-04
2004
-05
2005
-06
2006
-07
2007
-08
2008
-09
2009
-10
Academic Year
Num
ber o
f Deg
rees
Gra
nted
HSC-TargetHSC-Actual
Institutional Profile ofUniversity of New Mexico - Health Sciences Center
Mission: The mission of the University of New Mexico’s Health Sciences Center is to provide added value tohealth care through leadership in: providing innovative, collaborative education; advancing frontiers of sciencethrough research critical to the future of health care; delivering health care services that are at the forefront ofscience; and facilitating partnerships with public and private biomedical and health enterprises.
Number of Degrees Awarded Utilizing Extended University Courses
Providing access to courses has been important to UNM for many years. With the advent of theExtended University (EU) four years ago, this became a priority, with the emphasis now on providing thenecessary course work for students to be able to complete the last two years for an undergraduate degreeor most of the necessary course work for a masters degree. The UNM definition of "degrees grantedutilizing Extended University Courses" covers some graduates of the College of Nursing. Based on theUNM definition, EU graduates in Nursing are not expected to increase significantly in the coming years.NOTE: These numbers represent graduates who were taking at least 1 Extended University class in theirfinal semester, and who had a total of 12 credit hours via the Extended University while enrolled atUNM. From 2000-01 forward, the list of Extended University classes comes from EU, and includesinternet and courses within the Albuquerque area as well as courses delivered outside of Albuquerque.In previous years, only the "extended services" courses reported to the CHE were available for analysis.In some cases, even after 2000-01, there are extended services courses that were not in the EU list--thesecourses were included in the analysis.

University of New Mexico - Health Sciences Center
Performance Effectiveness Report - New Mexico’s Universities - November 2006Page 38
HSC Postbaccalaureate Degrees
0
50
100
150
200
250
300
2001
-02
2002
-03
2003
-04
2004
-05
2005
-06
2006
-07
2007
-08
2008
-09
2009
-10
2010
-11
Academic Year
Num
ber o
f Deg
rees
Gra
nted
HSC-TargetHSC-Actual
2001-02 2002-03 2003-04 2004-05 2005-06 2006-07 2007-08 2008-09 2009-10 2010-11UNM-HSC
Target 250 276 275 277 277 277 277 277 Actual 270 239 253 271 253
Academic Years Include Summer, Fall, and Spring Semesters
Number of Post-baccalaureate Degrees Awarded
Providing a highly trained workforce for New Mexico is one of the primary missions of the University.In particular, the Health Sciences Center (HSC) is the only provider of many unique professionalprograms in New Mexico (e.g., Medicine and Pharmacy). Note that both Main Campus and HSCprograms depend on units across the university. Because of class size limits in most HSC post-baccalaureate programs, increasing the number of degrees depends on additional funding for theprograms.

University of New Mexico - Health Sciences Center
Performance Effectiveness Report - New Mexico’s Universities - November 2006 Page 39
HSC Research and Public Service Expenditures
$0
$50
$100
$150
$200
$250
$300
1997
-98
1998
-99
1999
-00
2000
-01
2001
-02
2002
-03
2003
-04
2004
-05
2005
-06
2006
-07
2007
-08
2008
-09
2009
-10
2010
-11
Academic Year
Tota
l Dol
lars
(in
mill
ions
)
HSC-TargetHSC-Actual
1997-98 1998-99 1999-00 2000-01 2001-02 2002-03 2003-04 2004-05 2005-06 2006-07 2007-08 2008-09 2009-10 2010-11UNM-HSC
Target 212.0$ 236.0$ 240.7$ 245.5$ 250.4$ 255.5$ 260.6$ 265.8$ Actual 101.5$ 110.8$ 133.1$ 142.4$ 172.5$ 209.7$ 218.4$ 229.4$ 218.0$
Academic Years Include Summer, Fall, and Spring Semesters (values are in Millions)
Increase External Research and Public Service Expenditures
Bringing external dollars into New Mexico is one way that UNM contributes to economic developmentand to help support the research and public service mission of the University. Expenditures are trackedseparately for Main Campus and the Health Sciences Center (HSC), even though many research andpublic service projects are joint, interdisciplinary projects across both divisions of the university. Thegraph above shows the HSC expenditures. The HSC's goal is to increase our target by 2% per yearbeginning in AY 2006.

University of New Mexico - Health Sciences Center
Performance Effectiveness Report - New Mexico’s Universities - November 2006Page 40
* Benchmark is the U.S./Canadian Medical Students Passing Rates from the National Board of Medical Examiners.
USMLE Step 3 Pass Rates on First Taking
80
84
88
92
96
100
1996
1997
1998
1999
2000
2001
2002
2003
2004
2005
2006
Class Year
Pass
ing
Rat
es
HSC-TargetHSC-ActualBenchmark*
Scale not set at zero
USMLE Step 3 Pass Rates on First Taking
80
84
88
92
96
100
1996
1997
1998
1999
2000
2001
2002
2003
2004
2005
2006
2007
2008
Class Year
Pass
ing
Rat
es
HSC-TargetHSC-ActualBenchmark*
Scale not set at zero
1996 1997 1998 1999 2000 2001 2002 2003 2004 2005 2006 2007 2008UNM-HSC
Target 99 99 98 98 98 98 98 Actual 94 97 100 100 98 98 100 96
Class Years
Pass Rates on National USMLE Step 3 Board Exam - First Attempt
The graph above shows that the HSC SOM’s high quality medical education has produced students thathave surpassed the national average on its national exam test for the past several years. The target is theaverage SOM pass rate over previous four class years.

University of New Mexico - Health Sciences Center
Performance Effectiveness Report - New Mexico’s Universities - November 2006 Page 41
Medical Students Securing 1 of Top 3 Choices in Residency Program
0
20
40
60
80
100
2002
2003
2004
2005
2006
Calendar Year
% o
f Stu
dent
s W
ho S
ecur
ed T
op 1
of 3
R
esid
ency
Cho
ices
HSC-TargetHSC-Actual
Medical Students Securing 1 of Top 3 Choices in Residency Program
0
20
40
60
80
100
1997
1998
1999
2000
2001
2002
2003
2004
2005
2006
Calendar Year
% o
f Stu
dent
s W
ho S
ecur
ed T
op 1
of
3 R
esid
ency
Cho
ices
HSC-TargetHSC-Actual
% Medical Students Securing 1 of Top 3 Choices in Residency Program
0
20
40
60
80
100
2002
2003
2004
2005
2006
2007
2008
2009
2010
2011
Class Year
% o
f Stu
dent
s W
ho S
ecur
ed 1
of T
op 3
R
esid
ency
Cho
ices
HSC-TargetHSC-Actual
2002 2003 2004 2005 2006 2007 2008 2009 2010 2011UNM-HSC
Target 85 85 83 85 85 84 84 84 84 84 Actual 83 77 100 77 78
Class Years
Percent Medical Students Who Secured One of Their Top ThreeChoices in the Residency Program
The graph above shows that a high percentage of HSC School of Medicine medical students secured oneof their top three choices in a residency program, but an important aspect is that 100% of the SOM'sgraduates make it into a residency program - illustrating the SOM's high quality medical education. Notethat the actual data is influenced by the students' agreement to self-report because it is not mandatory.

University of New Mexico - Health Sciences Center
Performance Effectiveness Report - New Mexico’s Universities - November 2006Page 42
Medical Students' Satisfaction Rates
0
20
40
60
80
100
2001
2002
2003
2004
2005
2006
2007
2008
Calendar Year
% o
f Stu
dent
s Sa
tisfie
d
HSC-TargetHSC-ActualBenchmark*
Medical Students' Satisfaction Rates
0
20
40
60
80
100
1999
2000
2001
2002
2003
2004
2005
2006
2007
2008
Calendar Year
% o
f Stu
dent
s Sa
tisfie
d
HSC-TargetHSC-ActualBenchmark*
Medical Students' Satisfaction Rates
50
60
70
80
90
100
2001
2002
2003
2004
2005
2006
2007
2008
2009
2010
Calendar Year
% o
f Stu
dent
s Sa
tisfie
d
HSC-TargetHSC-ActualBenchmark*
Scale not set at zero
2001 2002 2003 2004 2005 2006 2007 2008 2009 2010UNM-HSC
Target 87.1 87.1 89.3 91.0 91.0 91.0 91.0 Actual 86.4 83.7 81.0 90.8 84.6
Calendar Years
Medical Student Satisfaction Rates on National Standardized Survey
* Benchmark is overall satisfaction ratings of all AAMC schools participating in graduation questionnaire.
The graph above shows that the SOM's medical students' overall satisfaction with the quality of theirmedical education at the HSC SOM is close to what is experienced nationally. The CY 07 target is thebenchmark level from two years prior. Note that the actual data is influenced by the students' agreementto self-report because it is not mandatory.

University of New Mexico - Health Sciences Center
Performance Effectiveness Report - New Mexico’s Universities - November 2006 Page 43
UNM Hospital Clinic Visits
310,000
320,000
330,000
340,000
350,000
360,000
370,000
380,000
390,000
2002
2003
2004
2005
2006
2007
2008
2009
2010
2011
Fiscal Year
No.
of C
linic
Vis
its
HSC-TargetHSC-Actual
Scale not set at zero
2002 2003 2004 2005 2006 2007 2008 2009 2010 2011UNM-HSC
Target 334,649 332,166 349,417 372,031 362,806 381,571 362,806 362,806 362,806 362,806 Actual 334,195 334,843 344,999 341,347 364,063
Fiscal Years
Total Number of UNM Hospital Clinic Visits
The graph above shows an increase in the Hospital's patient base to its clinics with an upturn expected inthe near future. The Hospital's target represents budgeted clinic visits and was adjusted to reflect a moremodest near-term growth rate.

University of New Mexico - Health Sciences Center
Performance Effectiveness Report - New Mexico’s Universities - November 2006Page 44
2002 2003 2004 2005 2006 2007 2008 2009 2010 2011UNM-HSC
Target 23,022 23,166 23,748 23,748 23,748 23,748 23,748 Actual 22,666 21,844 22,349 22,724 22,832
Fiscal Years
UNM Hospital Patient Discharges
21,000
22,000
23,000
24,000
25,000
26,000
27,000
2002
2003
2004
2005
2006
2007
2008
2009
2010
2011
Fiscal Year
No.
of P
atie
nt D
isch
arge
s
HSC-TargetHSC-Actual
Scale not set at zero
Total Number of UNM Hospital Inpatient Discharges
The graph above shows an overall downturn in the number of Hospital patient discharges over recenthistory. The trend is expected to turn around after the Hospital expands its capacity in its pediatrics andwomen’s inpatient services from its West Wing Expansion project.

University of New Mexico - Health Sciences Center
Performance Effectiveness Report - New Mexico’s Universities - November 2006 Page 45
% Human Poisoning Exposures Treated Safely At Home After PDIC Contact
50%
60%
70%
80%
90%
100%
2002
2003
2004
2005
2006
2007
2008
2009
2010
2011
Fiscal Year
% H
uman
Exp
osur
es T
reat
ed A
t Hom
e
HSC-TargetHSC-ActualBenchmark*
Scale not set at zero
2002 2003 2004 2005 2006 2007 2008 2009 2010 2011UNM-HSC
Target 67% 67% 70% 70% 73% 75% 75% 75% Actual 64% 65% 65% 67% 68%
Fiscal Years
Percent Human Poisoning Exposures Treated Safely at Home AfterPoison & Drug Information Center (PDIC) Contact
* Benchmark is the aggregate value for all national poison centers.
The graph above shows that the COP Poison & Drug Information Center (PDIC) has made progressrelative to the successful treatment of poisoning exposures at home after patients have called. The targetis to reach the national benchmark by about FY 2009. The measure is calculated by dividing the numberof human exposures treated at home by the total human exposures calls. The number of humanexposures treated at home was 15,582 in FY 2006, and 12,444 in FY 2001. In FY 2006, the total numberof calls received by the center was 41,367, up 3,599 from FY 2001.

University of New Mexico - Health Sciences Center
Performance Effectiveness Report - New Mexico’s Universities - November 2006Page 46
UNM Hospital Inpatient Readmission Rate
0.0
2.0
4.0
6.0
8.0
10.0
12.0
14.0
16.0
2001
2002
2003
2004
2005
2006
2007
2008
2009
2010
2011
Calendar Year
Perc
ent HSC-Target
HSC-ActualBenchmark*
Lower Percent Is Better
2001 2002 2003 2004 2005 2006 2007 2008 2009 2010 2011UNM-HSC
Target 12.0 12.0 12.0 12.0 12.0 12.0 12.0 12.0 Actual 11.4 10.7 10.5 10.0 9.1 9.8
Calendar Years
UNM Hospital Inpatient Readmission Rate
* Benchmark is the 50th Percentile of all UHC hospital readmission rates and is weighted average of the two mostrecent quarters of data.
The graph above shows that the Hospital has consistently made improvements in its inpatientreadmission rates over time. The Hospital’s target is the 25th percentile of the UHC Clinical Data Base.The target is to be at least below 12%, while peers are around 14%.

University of New Mexico - Health Sciences Center
Performance Effectiveness Report - New Mexico’s Universities - November 2006 Page 47
UNM Hospital Inpatient Satisfaction Rate
70
75
80
85
90
95
100
3-1-03
to 5-
31-03
3-1-04
to 6-
30-04
3-1-05
to 6-
30-05
3-1-06
to 6-
30-06
3-1-07
to 6-
30-07
3-1-08
to 6-
30-08
3-1-09
to 6-
30-09
3-1-10
to 6-
30-10
3-1-11
to 6-
30-11
Ove
rall
Mea
n Sc
ore
HSC-TargetHSC-ActualBenchmark*
Scale not set at zero
3-1-03 to5-31-03
3-1-04 to6-30-04
3-1-05 to6-30-05
3-1-06 to6-30-06
3-1-07 to6-30-07
3-1-08 to6-30-08
3-1-09 to6-30-09
3-1-10 to6-30-10
3-1-11 to6-30-11
UNM-HSC Target 78.1 79.1 80.1 80.6 81.1 81.6 82.1 Actual 76.8 76.1 76.8 79.0
Survey Periods
UNM Hospital Inpatient Satisfaction Rate
* Benchmark is the 20-member UHC Comparison Group mean score.
The above graph shows that the Hospital had a increase in overall mean score from 2005 to 2006. Thetarget represents a previous satisfaction high point (78.1) for the Hospital with a 1.0 percentage pointannual increase for the years 2005-2007, from 2007 - 2010 the target will rise by .5% per year. Thistarget is an internal working number that can change at any time and at present time is being evaluatedby hospital leadership. The hospital's overall inpatient satisfaction mean score of 79.0 (n=279) places it inthe 1st percentile ranking among the UHC Comparison Group hospitals (n=21). The benchmark (82.9)represents the 50th percentile of the UHC Comparison Group hospitals.

University of New Mexico - Health Sciences Center
Performance Effectiveness Report - New Mexico’s Universities - November 2006Page 48
UNM CRTC Cancer Clinical Trials
0
50
100
150
200
250
FY00FY01
FY02CY03
CY04CY05
CY06CY07
CY08CY09
CY10
Year
Num
ber
HSC-TargetHSC-Actual
FY00 FY01 FY02 CY03 CY04 CY05 CY06 CY07 CY08 CY09 CY10UNM-HSC
Target 210 215 185 188 190 190 190 Actual 116 125 155 171 177 209
Years
Number of Cancer Research & Treatment Center (CRTC) CancerClinical Trials
In the graph above, the UNM Cancer Research & Treatment Center (CRTC) has experienced steadygrowth in cancer clinical trials and expects the trend to continue. The Clinical Protocol DataManagement & Informatics Shared Resource (CRTC Clinical Trials Office) has reorganized the clinicaltrial menu, closing several non-accruing trials, and does not currently anticipate having in excess of 180-190 clinical trials open during any calendar year period. (Several non-accruing clinical trials are underreview for closure by the Principal Investigator and the Medical Director at the present time.) A robustclinical trial menu, containing trials that are applicable to the New Mexico population, will encourageadditional accruals without having an excess of non-accruing trials.
Note that the data reporting time frames changed to calendar years beginning with CY 2003 as requiredby National Cancer Institute (NCI). The data for CRTC's CY 2003 represents totals through May 2004.In FY 2002, the CRTC reported all trials of 210 instead of only therapeutic trials and normalized thedata at 155 therapeutic trials as a best estimate for the year. In 2003, the CRTC changed back toreporting only therapeutic trials as required by the NCI.

University of New Mexico - Health Sciences Center
Performance Effectiveness Report - New Mexico’s Universities - November 2006 Page 49
CON BSN Students' Pass Rates on NCLEX Test
50
60
70
80
90
100
2001
2002
2003
2004
2005
2006
2007
2008
2009
2010
Calendar Year
Pass
ing
Rat
es
HSC-TargetHSC-ActualBenchmark*
Scale not set at zero
2001 2002 2003 2004 2005 2006 2007 2008 2009 2010UNM-HSC
Target 90.0 90.0 90.0 85.0 85.0 85.0 85.0 Actual 94.0 90.3 90.6 90.8 93.8
Calendar Years
Pass Rates on NCLEX Test by College of Nursing BSN Students
* Benchmark is the national rate for the BSN students taking the NCLEX test.
The graph above shows that the HSC College of Nursing’s students have consistently scored above thenational average for all BSN students taking the standardized NCLEX test showing high qualitygraduates and teaching in the CON.

University of New Mexico - Health Sciences Center
Performance Effectiveness Report - New Mexico’s Universities - November 2006Page 50
Total HSC Technology Commercialization Activities
0
20
40
60
80
100
120
2002
2003
2004
2005
2006
2007
2008
2009
2010
2011
Fiscal Year
Num
ber HSC-Target
HSC-ActualBenchmark*
2002 2003 2004 2005 2006 2007 2008 2009 2010 2011UNM-HSC
Target 95 83 86 89 90 91 94 Actual 33 38 93 66 85
Fiscal Years
Year: 2002 2003 2004 2005 2006 2007 2008 2009 2010 201119 17 41 35 33 40 40 40 40 40
8 10 37 18 32 25 25 25 25 254 5 7 4 6 9 10 11 12 122 5 6 6 10 10 12 12 12 140 1 2 3 4 2 2 2 2 3
Total 33 38 93 66 85 86 89 90 91 94
Detail for Target Data
Start-up based on HSC Tech.
Detail for Actual Data
Options/License Agreements Issued Patents
New Patent Applications Filed Disclosures
Commercialization (Licensing) Measures
Total Number of HSC Technology Commercialization Activities
* Benchmark: The average of the total commercialization activity levels among the 4-member group of UNM peerinstitutions in FY 2002 & the 3-member group in FY 2003 & 2004 (1) with health sciences components separatelyreporting in the Association of University Technology Managers FY 2002-2004 Licensing Survey and (2) researchexpenditures under $120 million in 2002, $130 million in 2003, and $140 million in 2004.
The graph above shows that the HSC's increased emphasis on licensing and related activities caused alarge jump in 2004 with the enhanced partnership with the Science & Technology Corporation (STC) atUNM. Some of the pent-up demand stabilized by 2005. The 2006-2010 targets were adjusted accordinglyafter the peak year in 2004, in consultation with STC.

Performance Effectiveness Report - New Mexico’s Universities - November 2006 Page 51
FY 07 FY 08
Sum/Fall/Spr 2002-03
Sum/Fall/Spr 2003-04
Sum/Fall/Spr 2004-05
Sum/Fall/Spr 2005-06
Sum/Fall/Spr 2006-07
Target 25 25 25 25Actual 24 18 21 41
Sum/Fall/Spr 2002-03
Sum/Fall/Spr 2003-04
Sum/Fall/Spr 2004-05
Sum/Fall/Spr 2005-06
Sum/Fall/Spr 2006-07
Target 250 276 275 277Actual 239 253 271 253
FY 2002-03 FY 2003-04 FY 2004-05 FY 2005-06 FY 2006-07Target $212.0M $236.0M $240.7M $245.5MActual $209.7M $218.4M $229.4M $218.0M
Class Year2000
Class Year2001
Class Year2002
Class Year2003
Class Year2004
Target 99 99 98Actual 98 98 100 96
95 96 96 96
Class Year2004
Class Year2005
Class Year2006
Class Year2007
Class Year2008
Target 83 85 85 84 84Actual 100 77 78 n/a
CY 2003 CY 2004 CY 2005 CY 2006 CY 2007Target 87.1 87.1 89.3 91.0Actual 81.0 90.8 84.6 n/a
87.1 89.3 91.0 n/a
(SOM Measure B-2)Percent Medical Students Who Secured One of Their Top Three Choices in the Residency Program
Institutional SOM Specific Measures -- HSC Only (Specific to HSC and not Main Campus)
Institutional Specific Measures -- HSC Only (Main Campus reports same measures)
Reporting Data for DFA SubmittalsUniversity of New Mexico - HSC Only
DFA Column LabelsTrend Data
(HSC Measure A-1)Number of Degrees Awarded Utilizing Extended University Courses
Measures
(HSC Measure A-2)Number of Post-baccalaureate Degrees Awarded: HSC
(SOM Measure B-3)Medical Student Satisfaction Rates on National Standardized Survey
(SOM Measure B-1)Pass Rates on National USMLE Step 3 Board Exam – First Attempt
(HSC Measure A-3)Increase External Research and Public Service Expenditures: HSC
Benchmark: U.S./Canadian Medical Students Passing Rates from the National Board of Medical Examiners.
Benchmark: Overall satisfaction ratings of all AAMC schools participating in graduation questionnaire.

Performance Effectiveness Report - New Mexico’s Universities - November 2006Page 52
FY 2002-03 FY 2003-04 FY 2004-05 FY 2005-06 FY 2006-07Target 349,417 372,031 362,806 381,571Actual 334,843 344,999 341,347 364,063
FY 2002-03 FY 2003-04 FY 2004-05 FY 2005-06 FY 2006-07Target 23,022 23,166 23,748Actual 21,844 22,349 22,724 22,832
FY 2002-03 FY 2003-04 FY 2004-05 FY 2005-06 FY 2006-07Target 67.0% 67.0% 70.0% 70.0%Actual 65.0% 65.0% 67.0% 68.0%
74.5% 73.9% n/a n/a
CY 2003 CY 2004 CY 2005 CY 2006 CY 2007Target 12.0 12.0 12.0 12.0Actual 10.5 10.0 9.1 9.8
14.1 14.0 14.0 14.6
3-1-03 to 5-31-03
3-1-04 to 6-30-04
3-1-05 to 6-30-05
3-1-06 to 6-30-06
3-1-07 to 6-30-07
Target 78.1 79.1 80.1Actual 76.8 76.1 76.8 79.0
81.4 82.3 82.5 82.9
CY 2003 CY 2004 CY 2005 CY 2006 CY 2007Target 210 215 185 188Actual 171 177 209 n/a
CY 2003 CY 2004 CY 2005 CY 2006 CY 2007Target 90.0 90.0 90.0 85.0Actual 90.6 90.8 93.8 n/a
86.9 85.3 82.8 n/a
FY 2002-03 FY 2003-04 FY 2004-05 FY 2005-06 FY 2006-07Target 95 83 86Actual 38 93 66 85
64 77 n/a n/a
(HSC Measure C-3)Percent Human Poisoning Exposures Treated Safely at Home After PDIC Contact
(HSC Measure C-4)UNM Hospital Inpatient Readmission Rate
(HSC Measure C-1)Total Number of UNM Hospital Clinic Visits
(HSC Measure C-2)Total Number of UNM Hospital Inpatient Discharges
Institutional HSC Specific Measures -- HSC Only (Specific to HSC and not Main Campus)
(HSC Measure C-7)Pass Rates on NCLEX Test by College of Nursing BSN Students
(HSC Measure C-8)Total Number of HSC Technology Commercialization Activities
Benchmark: 20-member UHC Comparison Group mean score.
Benchmark: National rate for the BSN students taking the NCLEX test.
Benchmark: The average of the total commercialization activity levels among the 4-member group of UNM peer institutions in FY 2002 & the 3-member group in FY 2003 & 2004 (1) with health sciences components separately reporting in the Association of University Technology Managers FY 2002-2004 Licensing Surveys and (2) research expenditures under $120 million in 2002, $130 million in 2003, and $140 M in 2004.
Benchmark: Aggregate value for all national poison centers.
Benchmark: 50th Percentile of all UHC hospital readmission rates and is a weighted average of the two most recent quarters of data.
(HSC Measure C-5)UNM Hospital Inpatient Satisfaction Rate
(HSC Measure C-6)Number of UNM CRTC Cancer Clinical Trials

Performance Effectiveness Report - New Mexico’s Universities - November 2006 Page 53
Associate’s 5 Bachelor’s 49Master’s 13
Institutional Profile ofEastern New Mexico University
Mission: Eastern New Mexico University combines a traditional learning environment with twenty-first centurytechnology to provide a rich educational experience. Eastern emphasizes liberal learning, freedom ofinquiry, cultural diversity and whole student life. Excellent teaching and active learning define campusrelationships. Scholarship, both primary and applied, cultural enrichment, and professional service arealso important contributions of the University community.
Eastern, a state institution offering bachelor’s and master’s degrees, serves students from New Mexico,other states and other nations. Educational programs are offered at the Portales campus and also byinteractive distance education, public broadcast television, a branch community college in Roswell, NewMexico, and a university center in Ruidoso, New Mexico.
Eastern’s Focus• Prepare students for careers and advanced study,• Impart citizenship and leadership skills and values, • Support and expand the role of education and excellent teaching at all levels, and• Enable citizens to respond to a rapidly changing world.
Fall 2006 Overall Main Campus Enrollment by Level
On-Campus Off-Campus UnduplicatedCount
Degree-seeking undergraduate 2,817 269 2,964
Non-degree seeking undergraduate 275 41 315
First Professional
Graduates 505 400 856
Total Headcount 3,597 710 4,135
Total Full-time Equivalent 2,833 218 3,051
Number of program majors at the following degree levels for 2006-07:
2006-2007 total current funds revenue for main campus: $64,054,141
2006-2007 total state appropriation for main campus as apercent of total main campus operating budget: 48.72%

Eastern New Mexico University
Performance Effectiveness Report - New Mexico’s Universities - November 2006Page 54
Accessible and Affordable University EducationTable 1
Is university tuition affordable relative to peers and per capita income?Resident Undergraduate Percent of Peers* Non-Resident Undergraduate Percent of Peers*
1997-98 $1,716 68.3 $6,378 97.7
1999-00 $1,830 66.1 $6,714 94.0
2000-01 $1,944 68.9 $7,128 96.5
2001-02 $2,088 69.0 $7,644 96.7
2002-03 $2,292 69.0 $7,848 91.1
2003-04 $2,472 65.5 $8,028 84.4
2004-05 $2,616 62.0 $8,172 87.9
2005-06 $2,784 87.2 $8,340 89.4
2006-07 $2,964 Not Available $8,520 Not Available
Context for 2005:
NM Per-Capita Income: $27,912 Relative to peer states average per capita income: 80.9%
* List of peers in Appendix
Table 2How much financial aid must be paid back by students?
Type of Aid 1999-00 Percent 2004-05 Percent 2005-06 Percent
Gift Aid (Not paid back) 43.2 42.2 39.4
Work Study (Must work to earn) 8.6 5.5 5.2
Loans (Must pay back) 48.2 52.2 55.4
Table 3How much of the cost of attendance does financial aid cover and what percent of
students received aid?Average Award
PaidPer Recipient
Average Total Cost ofAttendance Per
Recipient
Percent of Students whoReceived Aid
1997-98 $6,143 $10,755 ---
2004-05 $7,603 $13,024 67.4
2005-06 $7,730 $15,667 68.8

Eastern New Mexico University
Performance Effectiveness Report - New Mexico’s Universities - November 2006 Page 55
Accessible and Affordable University Education
Table 4Does enrollment reflect diversity of the state?
Total EnrollmentFirst-Time Freshmen from
New MexicoNM HS
Graduates2005-06
%
NMACT
Takers2005-06
%
Fall 1997
%
Fall2005
%
Fall2006
%
Fall 1997
%
Fall2005
%
Fall2006
%
Race/Ethnicity
American Indian 2.5 2.7 3.1 5.3 2.6 4.3 11.3 9.9
Asian 1.0 1.0 1.2 0.5 .94 2.0 1.7 2.1
Black 3.4 6.3 5.5 2.7 3.5 2.4 2.3 1.7
Hispanic 21.5 26.8 27.6 28.2 32.3 37.4 44.8 31.7
White/Other 70.1 57.8 57.1 63.1 58.5 50.3 39.9 35.9
Nonresident Alien 0.9 1.4 1.3 0.0 0.0 0.0 0.0 0.0
Unknown 0.6 3.9 4.3 0.2 2.1 3.5 0.0 18.7
Total Number 3,495 4,052 4,135 434 424 459 19,174 11,537
Table 5
What proportion of our transfer students come from 2-year colleges?
Fall 1997 Fall 2005 Fall 2006
N % N % N %
NM 2-Yr Colleges and Branches 186 60.2 181 58.0 176 57.1
Out-of-state 2-Yr Colleges 63 20.2 75 24.3
Subtotal 2-Yr Colleges 186 60.2 244 78.2 251 81.4
NM Public 4-Yr Universities 28 9.1 17 5.4 26 8.4
All Other Transfers 95 30.7 51 16.3 31 10.1
Grand Total 309 100.0 312 100.0 308 100.0

Eastern New Mexico University
Performance Effectiveness Report - New Mexico’s Universities - November 2006Page 56
Student Progress and Student SuccessTable 6
How many freshmen return for second year?Entered in Fall 1997 Entered in Fall 2004 Entered in Fall 2005
CohortN
Percent Enrolledin Fall 1998
CohortN
PercentEnrolled
in Fall 2005
CohortN
PercentEnrolled
in Fall 2006Race/Ethnicity & Sex
American Indian 23 61.0 20 50.0 11 63.6
Asian 2 50.0 6 66.7 6 50.0
Black 15 27.0 46 52.0 46 50.0
Hispanic 123 52.0 169 61.5 162 48.8
White/Other 328 61.0 311 53.4 322 54.7
Nonresident Alien 3 100.0 5 100.0 3 100.0
Unknown -- -- 23 91.3 13 23.1
Men 235 48.9 294 54.1 295 48.5
Women 261 62.1 286 61.2 268 56.3
Overall 496 57.3 580 57.6 563 52.2
* First-time, full-time, degree-seeking freshmen
Table 7What are our graduation rates?
Entered Fall 1991 Entered Fall 1999 Entered Fall 2000
Race/Ethnicityand Sex
CohortN
% Grador StillEnroll-ed After
6Years*
CohortN
%BachelorsDegree in6 Years
% StillEnrolledAfter 6Years
% Grador Still
EnrolledAfter 6Years*
CohortN
%BachelorsDegree in6 Years
% StillEnrolledAfter 6Years
% Grador StillEnroll-ed After
6Years*
American Indian 13 16.0 12 16.7 33.3 50.0 15 46.7 6.7 53.4
Asian 8 38.0 3 100 0.0 100 4 50.0 25.0 75.0
Black 34 21.0 16 31.3 0.0 31.3 38 13.2 13.2 26.4
Hispanic 147 26.0 151 35.1 6.6 41.7 177 20.3 7.9 28.2
White/Other 370 36.0 283 34.3 5.3 39.5 290 34.8 5.2 40.0
Nonresident Alien 1 0.0 3 0.0 0.0 0.0 2 0 0 0
Unknown 0 0.0 14 50.0 0.0 50.0 16 25.0 6.3 71.3
Men 255 24.0 214 27.1 5.6 32.7 253 24.5 7.1 31.6
Women 318 38.0 268 40.7 6.3 47.0 289 32.2 6.6 38.8
Overall 573 32.0 482 34.6 6.0 40.6 542 28.6 6.8 35.4
Graduation/Retention Rates of Full-Time, First-Time, Degree-Seeking Freshmen After 6 Years
* Includes Associate degree recipients.

Eastern New Mexico University
Performance Effectiveness Report - New Mexico’s Universities - November 2006 Page 57
Student Progress and Student Success
Table 8What degrees were awarded in 2005-06?
Associate Bachelors Master Post-Masters Doctor First-Prof Total
Agriculture-related 27 27
Architecture-related
Business / Public Administration 64 9 73
Education 108 70 178
Engineering / Tech / Computer 6 6
Health Professions (w/o Nursing) 9 7 16
Home Economics 1 12 13
Humanities/Social Science 11 217 28 256
Law / Protective Services 22 22
Nursing 2 2
Science and Math 41 17 58
Social Work 1 1
Total 12 509 131 652
Table 9What are our alumni doing?
Percent Employed (may also be in school): 79.6 % Percent Continuing Their Education: 24.0%
In what fields are they employed?Private or Self Education Government or Military Other
Employment Fields 30.1% 30.1% 19.3% 6.6%
What percent of alumni are working in New Mexico?Percent of employed: 54.2%
* See Appendix II for survey instrument (2002-03 Survey of 1998-99 Bachelors Degree Recipients)

Eastern New Mexico University
Performance Effectiveness Report - New Mexico’s Universities - November 2006Page 58
Academic Quality and a Quality Learning Environment
Table 10
How diverse are our faculty and staff?Fall 1997 Fall 2004 Fall 2005
Full-TimeFaculty %(N = 139)
Full-TimeStaff %
(N =364 )
Full-TimeFaculty %(N = 140)
Full-TimeStaff %
(N = 371 )
Full-TimeFaculty %(N = 152 )
Full-TimeStaff %
(N = 382 )
Race/Ethnicity &
American Indian 1.4 0.6 0.7 1.5 0.7 1.3
Asian 3.6 0.6 3.5 1.0 5.3 0.8
Black 1.4 3.3 2.1 1.0 1.3 1.0
Hispanic 8.6 21.9 4.9 24.5 3.9 23.6
White/Other 85.0 73.6 86.7 71.2 87.5 72.0
Nonresident Alien 0.0 0.0 1.4 0.0 1.3 0.0
Unknown 0.0 0.0 0.7 0.8 0.0 1.3
Men 61.2 42.3 55.9 44.6 55.3 45.0
Women 38.8 57.7 44.1 55.4 44.7 55.0
Table 11Do our faculty hold the highest degree in their fields?
Percent of faculty holding highest degree
Fall 1997 85.0
Fall 2004 81.3
Fall 2005 79.1
Table 12
Are we making progress on faculty pay commensurate with our peers?
Average Salary % of Peer Average Average Compensation % of Peer Average
Fall 1997 $39,328 92.7 $48,432 92.3
Fall 2004 $50,183 92.4 $63,797 94.8
Fall 2005 $50,386 90.7 $64,017 91.2

Eastern New Mexico University
Performance Effectiveness Report - New Mexico’s Universities - November 2006 Page 59
Academic Quality and a Quality Learning Environment
Table 13
What percent of classroom instruction is delivered by tenured/tenure-track faculty?
Fall 1997 Fall 2004 Fall 2005
Percent Percent Percent
Course Level
Lower Division 54.1 49.2 50.4
Upper Division 73.6 79.0 70.0
Graduate Division 88.1 92.0 92.5
Overall 62.2 61.0 59.6
Classroom instruction excludes labs, theses, internships, independent studies, etc.
Table 14What are our student to faculty ratios?
Fall 1999 17 to 1
Fall 2004 18 to 1
Fall 2005 17 to 1
* FTE Students/FTE Instructional Faculty
Table 15How large are our classes?
Fall 1999 Average Fall 2004 Average Fall 2005 Average
Undergraduate, lower 24 22.8 21.6
Undergraduate, upper 16 10.0 11.0
Graduate 8 7.0 7.5

Eastern New Mexico University
Performance Effectiveness Report - New Mexico’s Universities - November 2006Page 60
Academic Quality and a Quality Learning Environment
Table 16
How satisfied are our students with their educational experience?
2003-2004
Satisfied or Very Satisfied with Curriculum and Instruction 91.0%
Satisfied or Very Satisfied with Student Support 84.0%
Satisfied or Very Satisfied Overall with Institution 93.4%
* See Appendix III (Survey of Graduating Seniors in 2002-03)
Table 17
How satisfied are our alumni with their educational experience?
2003-2004
Satisfied or Very Satisfied with Curriculum and Instruction 87.0%
Satisfied or Very Satisfied with Student Support 78.3%
Satisfied or Very Satisfied Overall with Institution 88.0%
* See Appendix II for survey instrument (2002-03 Survey of 1998-99 Bachelors Degree Recipients)

Eastern New Mexico University
Performance Effectiveness Report - New Mexico’s Universities - November 2006 Page 61
Effective and Efficient Use of Resources
Table 18
What percent of fiscal resources are allocated to our primary mission of instruction,research and public service?
Percent for Institution Percent for Peers
1996-97 48.4 48.3
2000-01 44.7 48.4
2003-04 49.8 51.3
2004-05 49.8 52.7
Table 19
What percent of fiscal resources are allocated to administrative costs?
Percent for Institution Percent for Peers
1996-97 8.3 11.6
2000-01 8.9 11.2
2003-04 8.6 14.4
2004-05 8.6 12.5

Eastern New Mexico University
Performance Effectiveness Report - New Mexico’s Universities - November 2006Page 62
Listing of Accreditations
Higher Learning Commission of the North Central Association of Colleges and Schools
National Association of Schools of Music
Association of Collegiate Business Schools and Programs
American Speech-Language-Hearing Association
National League for Nursing
National Council for Accreditation of Teacher Education
American Chemical Societies

Eastern New Mexico University
Performance Effectiveness Report - New Mexico’s Universities - November 2006 Page 63
FY 06 FY 07 FY 08
Sum/Fall/Spr 2001-02
Sum/Fall/Spr 2002-03
Sum/Fall/Spr 2003-04
Sum/Fall/Spr 2004-05
Sum/Fall/Spr 2005-06
Sum/Fall/Spr 2006-07
Target 350 360 370 400Actual 415 331 356 431 411 Due Oct 1, 2007
Fall 96 Thru Sum 02
Fall 97 Thru Sum 03
Fall 98 Thru Sum 04
Fall 99 Thru Sum 05
Fall 00 Thru Sum 06
Fall 01 Thru Sum 07
Target 31.5% 32.0% 32.5% 33.0%Actual 29.3% 31.2% 32.1% 34.6% 28.6% Due Oct 1, 2007
Benchmark: CSRDE 6-year graduation rate data for similar institutions. 35.2% 36.5% 36.1% 34.9% 33.6%
Fall 02 census
Fall 03 census
Fall 04 census
Fall 05 census
Fall 06 census
Fall 07 census
Target 185 200 210 220 225Actual 168 193 159 162 219 Due Oct 1, 2007
Benchmark: ENMU's service area is 38% Hispanic; percent of Hispanic first-time freshmen should reflect that percentage.
32.4% of first-time
freshmen are Hispanic
35.5% of first-time
freshmen are Hispanic
27.6% of first-time
freshmen are Hispanic
29.08% of first-time freshman
are Hispanic
36% of first-time
freshman are Hispanic
Fall 01 to Fall 02
Fall 02 to Fall 03
Fall 03 to Fall 04
Fall 04 to Fall 05
Fall 05 to Fall 06
Fall 06 to Fall 07
Target 60.0% 61.0% 62.0% 62.5% 60.0%Actual 57.4% 60.0% 59.2% 57.6% 52.4% Due Oct 1, 2007
Benchmark: CSRDE retention data for similar institutions. 69.8% 69.8% 67.0% 67.7% 65.5%
Sum/Fall/Spr 2001-02
Sum/Fall/Spr 2002-03
Sum/Fall/Spr 2003-04
Sum/Fall/Spr 2004-05
Sum/Fall/Spr 2005-06
Sum/Fall/Spr 2006-07
Target 45 55 65 75 150Actual 37 44 55 101 172 Due Oct 1, 2007
Spring 2002 Spring 2003 Spring 2004 Spring 2005 Spring 2006 Spring 2007Target 95% 95%Actual 92.5% 93.5% 93.2% 96.9% 96.8% Due Oct 1, 2007
FY 2001-02 FY 2002-03 FY 2003-04 FY 2004-05 FY 2005-06 FY 2006-07Target $5.25M $8.5M $8.6M $8.7M $8.8MActual $7.58M $8.29M $8.3M $8.3M $7.8M Due Oct 1, 2007
*Excluded some grant monies
External funding support: Main Campus (excludes restricted accounts)
Common MeasuresTransfer Measure: Number of Undergraduate Transfer Students from Two-Year Colleges
Completion Measure: Percent of Full-Time, Degree-Seeking, First-Time Freshmen Completing an Academic Program Within Six Years
Access Measure: Number of Hispanic first-time freshmen
Retention Measure: Percent of Full-time, First-time Freshmen Returning for their Second Fall Semester
Institutional Specific Measures -- Main Campus
Number of Internet-based courses offered
Graduating seniors who are "satisfied" or "very satisfied" with ENMU eudcational experience (new measure
Reporting Data for DFA SubmittalsEastern New Mexico University - Main Campus
Trend Data DFA Column Labels

Performance Effectiveness Report - New Mexico’s Universities - November 2006Page 64
This page blank intentionally.

Performance Effectiveness Report - New Mexico’s Universities - November 2006 Page 65
Associate’s 1 Bachelor’s 28Master’s 14
Institutional Profile ofNew Mexico Highlands University
Mission:• New Mexico Highlands University is committed to excellence in teaching, discovering,
preserving and applying knowledge. NMHU is responsive to any new opportunities forteaching, learning, research, and public service that are created by a changing environment.
• NMHU provides personal attention to students from distinctive cultural, socioeconomic,linguistic, geographic, religious, and educational backgrounds. NMHU offers a sensitiveadmissions program and challenging academic programs that provide all students with theopportunity to achieve their full potential.
• NMHU is committed to programs that focus on its multiethnic student body, especially the richheritage of Hispanic and Native American cultures, and clearly perceives that its successdepends upon an appreciation of the region’s cultural and linguistic identifies.
Fall 2006 Overall Main Campus Enrollment by Level
On-Campus Off-Campus UnduplicatedCount
Degree-seeking undergraduate 1,492 570 1,881
Non-degree seeking undergraduate 133 124 248
First Professional
Graduates 821 800 1,471
Total Headcount 2,446 1,494 3,600
Total Full-time Equivalent 1,768 759 2,526.0
Number of program majors at the following degree levels for 2006-07:
2006-2007 total current funds revenue for maincampus: $59,236,800
2006-2007 total state appropriation for main campus as a percent of total main campus operatingbudget: 55.7%

New Mexico Highlands University
Performance Effectiveness Report - New Mexico’s Universities - November 2006Page 66
Accessible and Affordable University EducationTable 1
Is university tuition affordable relative to peers and per capita income?
Resident Undergraduate Percent of Peers* Non-Resident Undergraduate Percent of Peers*
1997-98 $1,602 67.6 $6,786 101.1
1999-00 $1,866 71.5 $7,578 102.6
2000-01 $2,017 74.2 $8,300 107.4
2001-02 $2,114 73.5 $8,834 108.2
2002-03 $2,184 70.5 $9,096 103.0
2003-04 $2,184 63.2 $9,096 94.6
2004-05 $2,280 60.3 $9,624 93.1
2005-06 $2,280 54.2 $3,420 31.2
2006-07 $2,424 Not available $3,636 Not Available
Context for 2005:
NM Per-Capita Income: $27,912 Relative to peer states average per capita income: 87.4%
* List of peers in Appendix
Table 2How much financial aid must be paid back by students?
Type of Aid 1999-00 Percent 2004-05 Percent 2005-06 Percent
Gift Aid (Not paid back) 60.0 37.6 36.9
Work Study (Must work to earn) 6.8 9.3 7.3
Loans (Must pay back) 33.2 53.1 55.6
Table 3How much of the cost of attendance does financial aid cover and what percent of
students received aid?Average Award Paid
Per RecipientAverage Total Cost of
Attendance PerRecipient
Percent of Students whoReceived Aid
1997-98 $5,242 $11,005 ---
2004-05 $9,264 $14,632 77.0
2005-06 $6,686 $14,891 78.0

New Mexico Highlands University
Performance Effectiveness Report - New Mexico’s Universities - November 2006 Page 67
Accessible and Affordable University Education
Table 4Does enrollment reflect diversity of the state?
Total EnrollmentFirst-Time Freshmen from
New MexicoNM HS
Graduates2005-06
%
NM ACTTakers
2005-06 %
Fall 1997
%
Fall2005
%
Fall2006
%
Fall1997
%
Fall2005
%
Fall2006
%
Race/Ethnicity
American Indian 4.9 7.0 7.0 10.2 7.0 7.0 11.3 9.9
Asian 0.9 1.0 1.5 1.1 1.0 0.1 1.7 2.1
Black 3.5 3.0 3.8 3.2 2.0 4.0 2.3 1.7
Hispanic 59.9 52.0 52.2 69.6 73.0 73.0 44.8 31.7
White/Other 28.0 32.3 30.1 12.4 13.0 13.0 39.9 35.9
Nonresident Alien 1.1 1.0 1.9 0.0 0.0 0.1 0.0 0.0
Unknown 1.7 3.7 3.5 3.5 4.0 2.0 0.0 18.7
Total Number 2,534 3,421 3,600 283 215 328 19,174 11,539
Table 5
What proportion of our transfer students come from 2-year colleges?
Fall 1997 Fall 2005 Fall 2006
N % N % N %
NM 2-Yr Colleges and Branches 145 28.8 196 57.0 188 48.0
Out-of-state 2-Yr Colleges 26 5.2 60 17.0 95 24.0
Subtotal 2-Yr Colleges 171 34.0 256 74.0 283 72.0
NM Public 4-Yr Universities 184 36.5 65 19.0 69 18.0
All Other Transfers 149 29.5 24 7.0 39 10.0
Grand Total 504 100.0 345 100.0 391 100.0

New Mexico Highlands University
Performance Effectiveness Report - New Mexico’s Universities - November 2006Page 68
Student Progress and Student Success
Table 6How many freshmen return for second year?
Entered in Fall 1997 Entered in Fall 2004 Entered in Fall 2005
CohortN
PercentEnrolled
in Fall 1998
CohortN
Percent Enrolledin Fall 2005
CohortN
Percent Enrolledin Fall 2006
Race/Ethnicity & Sex
American Indian 30 53.0 36 67.0 17 58.8
Asian 2 50.0 1 100.0 4 75.0
Black 10 50.0 12 66.0 14 50.0
Hispanic 170 53.0 151 53.0 154 60.3
White/Other 38 47.0 36 44.0 33 51.5
Nonresident Alien 5 80.0 0.0 0.0 0 0.0
Unknown 1 0.0 11 45.0 8 37.5
Men 136 46.0 130 53.0 128 52.3
Women 120 59.0 117 47.0 102 64.7
Overall 256 52.0 247 54.0 230 58.0
* First-time, full-time, degree-seeking freshmen
Table 7What are our graduation rates?
Entered Fall 1991 Entered Fall 1999 Entered Fall 2000
Race/Ethnicityand Sex
CohortN
% Grador Still
EnrolledAfter 6Years*
CohortN
%BachelorsDegree in6 Years
% StillEnrolledAfter 6Years
% Grador Still
EnrolledAfter 6Years*
CohortN
%BachelorsDegree in6 Years
% StillEnrolledAfter 6Years
% Grador Still
EnrolledAfter 6Years*
American Indian 22 27.2 28 14 0.0 21 10 40.0 30.0 70.0
Asian 0 0.0 1 0.0 0.0 0.0 0 0.0 0.0 0.0
Black 8 25.0 10 0.0 1.0 10.0 11 0.0 9.0 9.0
Hispanic 278 33.8 218 25.0 15.0 40.0 199 22.0 16.0 38.0
White/Other 40 32.5 50 18.0 12.0 30.0 44 14.0 0.0 14.0
Nonresident Alien 0 0.0 10 30.0 10.0 40.0 1 100.0 0.0 100.0
Unknown 1 0.0 6 50.0 33.0 83.0 9 1.0 11.0 22.0
Men 163 26.4 152 14.0 11.0 26.0 146 19.0 12.0 31.0
Women 186 38.7 171 30.0 16.0 46.0 128 22.0 15.0 37.0
Overall 349 33.0 323 23.0 14.0 37.0 274 20.0 13.0 34.0
Graduation/Retention Rates of Full-Time, First-Time, Degree-Seeking Freshmen After 6 Years
* Includes Associate degree recipients.

New Mexico Highlands University
Performance Effectiveness Report - New Mexico’s Universities - November 2006 Page 69
Student Progress and Student Success
Table 8What degrees were awarded in 2005-06?
Associate Bachelors Masters Post-Masters Doctors First-Prof Total
Agriculture-related
Architecture-related
Business / Public Administration 63 30 93
Education 3 115 111 229
Engineering / Tech / Computer 6 6
Health Professions (w/o Nursing) 2 2
Home Economics
Humanities/Social Science 47 20 67
Law / Protective Services 7 7
Nursing
Science and Math 12 6 18
Social Work 78 132 210
Total 3 324 305 632
Table 9What are our alumni doing?
Percent Employed (may also be in school): Percent Continuing Their Education:
90% 32.5%
In what fields are they employed?Private or Self Education Government or Military Other
Employment Fields 21% 34% 35% 10%
What percent of alumni are working in New Mexico?Percent of employed: 86%
* See Appendix II for survey instrument (2002-03 Survey of 1998-99 Bachelors Degree Recipients)

New Mexico Highlands University
Performance Effectiveness Report - New Mexico’s Universities - November 2006Page 70
Academic Quality and a Quality Learning Environment
Table 10
How diverse are our faculty and staff?Fall 1997 Fall 2004 Fall 2005
Full-TimeFaculty %(N = 142)
Full-TimeStaff %
(N =247 )
Full-TimeFaculty %(N = 114)
Full-TimeStaff %
(N = 374)
Full-TimeFaculty %(N = 110 )
Full-TimeStaff %
(N =355 )
Race/Ethnicity & Sex
American Indian 0.0 0.8 1.0 2.0 1.0 2.0
Asian 0.7 9.3 0.0 2.0 0.0 0.0
Black 0.7 2.0 1.0 0.0 1.0 3.0
Hispanic 29.6 67.2 25.0 74.0 32.0 75.0
White/Other 69.0 20.7 71.0 18.0 60.0 17.0
Nonresident Alien 0.0 0.0 1.0 0.0 0.0 0.0
Unknown 0.0 0.0 1.0 4.0 6.0 3.0
Men 63.4 36.0 61.0 44.0 55.0 52.0
Women 36.6 64.0 39.0 56.0 45.0 48.0
Table 11Do our faculty hold the highest degree in their fields?
Percent of faculty holding highest degree
Fall 1997 83.0%
Fall 2004 88.0%
Fall 2005 84.0%
Table 12
Are we making progress on faculty pay commensurate with our peers?
Average Salary % of Peer Average Average Compensation % of Peer Average
Fall 1997 $39,151 89.2 $49,722 91.6
Fall 2004 $46,794 84.4 $58,551 84.1
Fall 2005 $48,906 88.9 $62,217 87.6
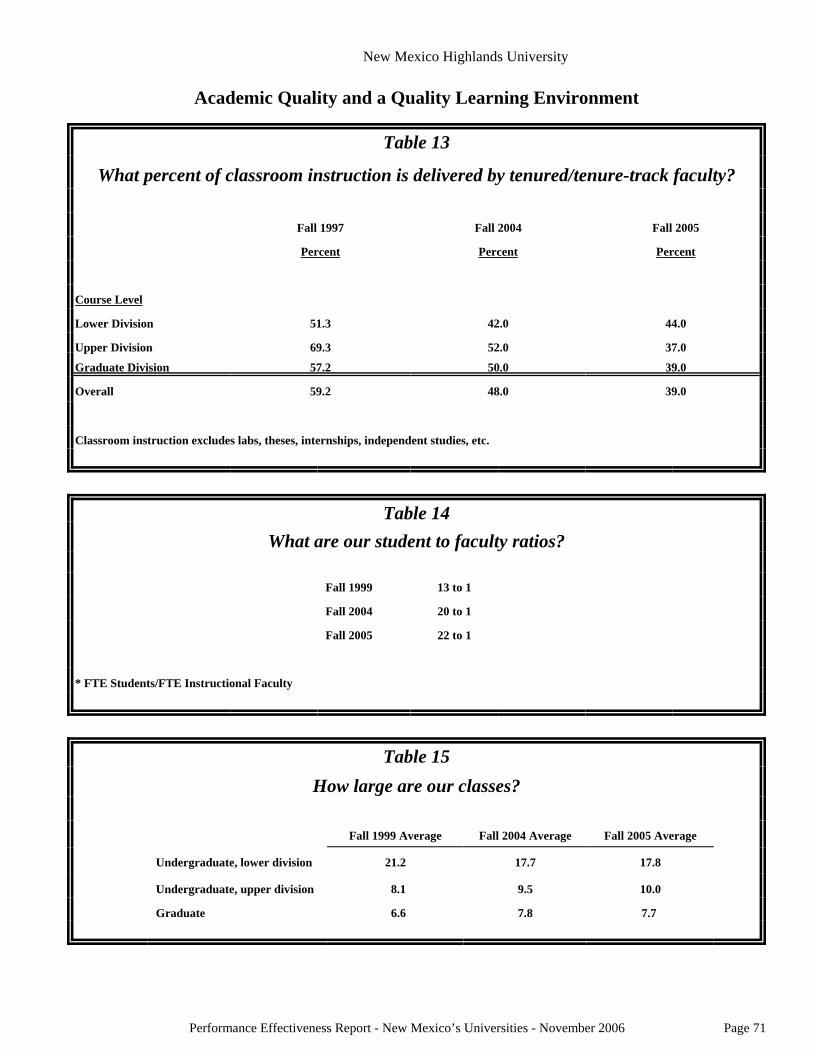
New Mexico Highlands University
Performance Effectiveness Report - New Mexico’s Universities - November 2006 Page 71
Academic Quality and a Quality Learning Environment
Table 13
What percent of classroom instruction is delivered by tenured/tenure-track faculty?
Fall 1997 Fall 2004 Fall 2005
Percent Percent Percent
Course Level
Lower Division 51.3 42.0 44.0
Upper Division 69.3 52.0 37.0
Graduate Division 57.2 50.0 39.0
Overall 59.2 48.0 39.0
Classroom instruction excludes labs, theses, internships, independent studies, etc.
Table 14What are our student to faculty ratios?
Fall 1999 13 to 1
Fall 2004 20 to 1
Fall 2005 22 to 1
* FTE Students/FTE Instructional Faculty
Table 15How large are our classes?
Fall 1999 Average Fall 2004 Average Fall 2005 Average
Undergraduate, lower division 21.2 17.7 17.8
Undergraduate, upper division 8.1 9.5 10.0
Graduate 6.6 7.8 7.7

New Mexico Highlands University
Performance Effectiveness Report - New Mexico’s Universities - November 2006Page 72
Academic Quality and a Quality Learning Environment
Table 16
How satisfied are our students with their educational experience?
2003-2004
Satisfied or Very Satisfied with Curriculum and Instruction 88.0%
Satisfied or Very Satisfied with Student Support 66.3%
Satisfied or Very Satisfied Overall with Institution 89.5%
* See Appendix III (Survey of Graduating Seniors in 2002-03)
Table 17
How satisfied are our alumni with their educational experience?
2003-2004
Satisfied or Very Satisfied with Curriculum and Instruction 78.0%
Satisfied or Very Satisfied with Student Support 66.2%
Satisfied or Very Satisfied Overall with Institution 85.9%
* See Appendix II for survey instrument (2002-03 Survey of 1998-99 Bachelors Degree Recipients)

New Mexico Highlands University
Performance Effectiveness Report - New Mexico’s Universities - November 2006 Page 73
Effective and Efficient Use of Resources
Table 18
What percent of fiscal resources are allocated to our primary mission of instruction,research and public service?
Percent for Institution Percent for Peers
1996-97 58.4 45.8
2000-01 60.8 46.0
2003-04 60.2 52.1
2004-05 56.6 51.6
Table 19
What percent of fiscal resources are allocated to administrative costs?
Percent for Institution Percent for Peers
1996-97 8.5 11.0
2000-01 7.9 11.1
2003-04 10.0 11.3
2004-05 11.4 11.4
Data for 2001-02 not available for peer comparison purposes because IPEDS survey changed methodology and many peer institutionsdid not use new methodology. Comparison should be possible in next year’s report.

New Mexico Highlands University
Performance Effectiveness Report - New Mexico’s Universities - November 2006Page 74
Listing of Accreditations
NMHU North Central Association of Colleges and Schools
School of Business Association of Collegiate Business Schools and Programs
School of Education NM Public Education Department
School of Education National Council for Accreditation of Teacher Education
School of Social Work Council on Social Work Education
Chemistry Program American Chemical Society

New Mexico Highlands University
Performance Effectiveness Report - New Mexico’s Universities - November 2006 Page 75
FY 06 FY 07 FY08
Fall 2001 Fall 2002 Fall 2003 Fall 2004Sum/Fall/Spr
2005-06Sum/Fall/Spr
2006-07Target 145 250 275 (FA) 437Actual 142 131 242 256 417 Due Oct 2007
Fall 96 Thru Sum 02
Fall 97 Thru Sum 03
Fall 98 Thru Sum 04
Fall 99 Thru Sum 05
Fall 00 Thru Sum 06
Fall 01 Thru Sum 07
Target 24% 24% 28% 20%Actual 18.3% 18.0% 18.0% 23.0% 20% Due Oct 2007
Benchmark: CSRDE 6-yr graduation rate data for similar institutions. 36.1% 34.9% 33.6%
Fall 2002 Census
Fall 2003 Census
Fall 2004 Census
Fall 2005 Census
Fall 2006 Census
Fall 2007 Census
Target 8.0% 8.0% 8.0%Actual 9.5% 7.6% 6.5% 6.8% 8.0% Due Oct 2007
Benchmark: The percent Native American population in San Miguel county is 2%. NMHU Native American enrollment exceeds the expected proportional representation. 2% 2% 2% 2% 2%
Fall 01 to Fall 02
Fall 02 to Fall 03
Fall 03 to Fall 04
Fall 04 to Fall 05
Fall 05 to Fall 06
Fall 06 to Fall 07
Target 63.0% 64.0% 53.0% 57.0% 61%Actual 41.5% 57.3% 45.0% 54.0% 58.0% Due Oct 2007
Benchmark: CSRDE retention data for similar institutions. 67.0% 67.1% 65.5%
Fall 2002 Census
Fall 2003 Census
Fall 2004 Census
Fall 2005 Census
Fall 2006 Census
Fall 2007 Census
Target 1,090 1,300 1,300 1,300 1300Actual 991 1,329 1,248 1,285 1,277 Due Oct 2007
FY 2001-02 FY 2002-03 FY 2003-04 FY 2004-05 FY2005-06 FY 2006-07Target 86.7% 91.0% 93.0% 93% 90%
Actual 85% 89.5% 93.0% 80.0% 80% Due Oct 2007
FY 2001-02 FY 2002-03 FY 2003-04 FY 2004-05 FY2005-06 FY 2006-07Target 20,000,000 19,561,000 14,659,039 15,766,075Actual 19,836,327 19,664,659 20,041,224 17,899,356 16,573,150 Due Oct 2007
Sum/Fall/Spr 2001-02
Sum/Fall/Spr 2002-03
Sum/Fall/Spr 2003-04
Sum/Fall/Spr 2004-05
Sum/Fall/Spr 2005-06
Sum/Fall/Spr 2006-07
Target 31.0% 23.0% 20.0%Actual 30.0% 26.0% 26.0% Due Oct 2007
Increase external dollars for research and student learning initiatives
Percent of total funds generated by grants & contracts.
Retention Measure: Percent of full-time, degree-seeking, first-time freshmen persisting to second year.
Number of students enrolled in Extended Services courses.
Percent of graduating seniors indicating "Satisfied" or "Very Satisfied" with NMHU in all categories of the Student Satisfaction Survey.
Institutional Specific Measures
Transfer Measure: Number of undergraduate transfer sudents from two-year colleges. No Benchmarks Available.
Completion Measure: Percent of full-time, degree-seeking, first-time freshmen completing programs within six years.
Access Measure: Percent of Native American first-year students enrolled.
Common Measures
Trend DataDFA Column Labels
Reporting Data for DFA Submittals New Mexico Highlands University

Performance Effectiveness Report - New Mexico’s Universities - November 2006Page 76
This page intentionally blank.

Performance Effectiveness Report - New Mexico’s Universities - November 2006 Page 77
Certificate’s 10 Associate’s 16Bachelor’s 40 Master’s 8
Institutional Profile ofWestern New Mexico University
Vision:Western New Mexico University’s vision is to be a leader in higher education known throughout the southwestas the university of choice for our students, faculty, and staff because of the following:• We provide relevant education that is affordable, accessible and of the highest quality.• We encourage innovation and scholarly work.• We are committed to enhancing the quality of life for all WNMU students, faculty, and staff.• We promote responsive and responsible community and public service, and• We are guardians of the public’s trust and champions of diversity.
Fall 2006 Overall Main Campus Enrollment by Level
On-Campus Off-Campus UnduplicatedCount
Degree-seeking undergraduate 1,442 314 1,756
Non-degree seeking undergraduate 101 75 299
First Professional
Graduates 301 231 532
Total Headcount 1,967 620 2,587
Total FTE 1403 314 1717
Number of program majors at the following degree levels for 2006-07:
2006-2007 total current funds revenue for maincampus: $33,660,955
2006-2007 total state appropriation for main campus as a percent of total main campus operatingbudget: 54%

Western New Mexico University
Performance Effectiveness Report - New Mexico’s Universities - November 2006Page 78
Accessible and Affordable University Education
Table 1Is university tuition affordable relative to peers and per capita income?
Resident Undergraduate Percent of Peers* Non-Resident Undergraduate Percent of Peers*
1997-98 $1,564 69.7 $5,652 92.6
1999-00 $1,768 72.1 $6,456 97.0
2000-01 $1,943 78.2 $7,079 100.5
2001-02 $2,042.5 77.7 $7,786.5 102.1
2002-03 $2,280 76.4 $8,532 103.6
2003-04 $2,470 71.3 $9,022 99.9
2004-05 $2,667 70.4 $9,675 98.6
2005-06 $2,863 71.3 $10,423 101.8
2006-07 $3,065 Not Available $11,321 Not Available
Context for 2005:
NM Per-Capita Income: $27,912 Relative to peer states average per capita income: 88.4%
* List of peers in Appendix
Table 2How much financial aid must be paid back by students?
Type of Aid 1999-00 Percent 2004-05 Percent 2005-06 Percent
Gift Aid (Not paid back) 60.0 53.8 50.6
Work Study (Must work to earn) e 6.8 5.5 4.6
Loans (Must pay back) 33.2 40.7 44.8
Table 3How much of the cost of attendance does financial aid cover and what percent of
students received aid?Average Award Paid
Per RecipientAverage Total Cost of
Attendance PerRecipient
Percent of Students whoReceived Aid
1997-98 $4,868 $7,565 ---
2004-05 $5,977 $12,409 82.1
2005-06 $6,057 $13,501 83.2

Western New Mexico University
Performance Effectiveness Report - New Mexico’s Universities - November 2006 Page 79
Accessible and Affordable University Education
Table 4Does enrollment reflect diversity of the state?
Total EnrollmentFirst-Time Freshmen from
New MexicoNM HS
Graduates2005-06
%
NM ACTTakers
2005-06 %
Fall 1997
%
Fall2005
%
Fall2006
%
Fall 1997 %
Fall2005
%
Fall2006
%
Race/Ethnicity
American Indian 2.0 4.3 3.7 0.4 2.6 0.9 11.3 9.9
Asian 0.4 0.8 0.7 0.0 0.0 0.4 1.7 2.1
Black 1.7 2.4 3.1 0.7 1.4 1.7 2.3 1.7
Hispanic 38.4 40.8 39.7 44.8 50.2 55.9 44.8 31.7
White/Other 53.2 41.6 40.8 49.0 34.1 28.4 39.9 35.9
Nonresident Alien 2.1 1.1 2.1 1.1 1.5 1.3 0.0 0.0
Unknown 2.1 9.0 9.9 4.0 10.2 11.4 0.0 18.7
Total Number 2,624 2,627 2,587 453 273 229 19,174 11,539
Table 5
What proportion of our transfer students come from 2-year colleges?
Fall 1997 Fall 2005 Fall 2006
N % N % N %
NM 2-Yr Colleges and Branches 6 4.8 13 7.5 15 9.4
Out-of-state 2-Yr Colleges 68 39.1 71 44.7
Subtotal 2-Yr Colleges 6 4.8 81 46.6 86 54.1
NM Public 4-Yr Universities 17 13.2 42 24.1 36 22.6
All Other Transfers 105 82.0 51 29.3 37 23.3
Grand Total 128 100.0 174 100.0 159 100
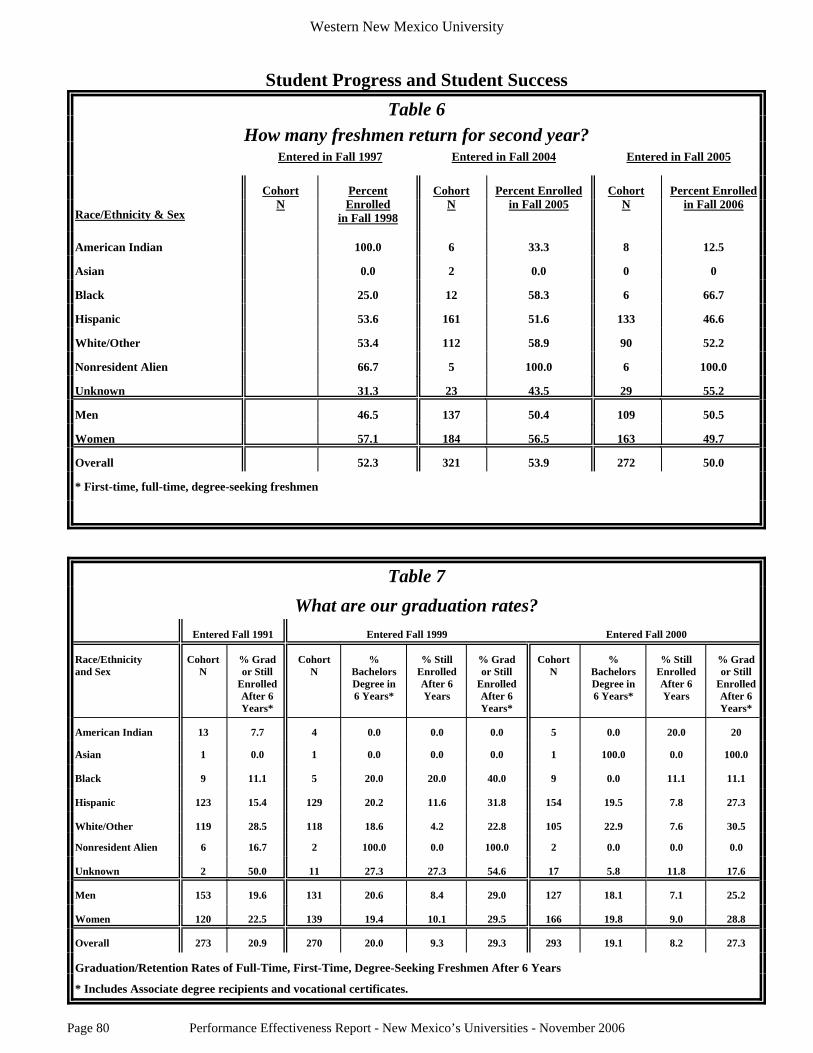
Western New Mexico University
Performance Effectiveness Report - New Mexico’s Universities - November 2006Page 80
Student Progress and Student SuccessTable 6
How many freshmen return for second year?Entered in Fall 1997 Entered in Fall 2004 Entered in Fall 2005
CohortN
PercentEnrolled
in Fall 1998
CohortN
Percent Enrolledin Fall 2005
CohortN
Percent Enrolledin Fall 2006
Race/Ethnicity & Sex
American Indian 100.0 6 33.3 8 12.5
Asian 0.0 2 0.0 0 0
Black 25.0 12 58.3 6 66.7
Hispanic 53.6 161 51.6 133 46.6
White/Other 53.4 112 58.9 90 52.2
Nonresident Alien 66.7 5 100.0 6 100.0
Unknown 31.3 23 43.5 29 55.2
Men 46.5 137 50.4 109 50.5
Women 57.1 184 56.5 163 49.7
Overall 52.3 321 53.9 272 50.0
* First-time, full-time, degree-seeking freshmen
Table 7What are our graduation rates?
Entered Fall 1991 Entered Fall 1999 Entered Fall 2000
Race/Ethnicityand Sex
CohortN
% Grador Still
EnrolledAfter 6Years*
CohortN
%BachelorsDegree in6 Years*
% StillEnrolledAfter 6Years
% Grador Still
EnrolledAfter 6Years*
CohortN
%BachelorsDegree in6 Years*
% StillEnrolledAfter 6Years
% Grador Still
EnrolledAfter 6Years*
American Indian 13 7.7 4 0.0 0.0 0.0 5 0.0 20.0 20
Asian 1 0.0 1 0.0 0.0 0.0 1 100.0 0.0 100.0
Black 9 11.1 5 20.0 20.0 40.0 9 0.0 11.1 11.1
Hispanic 123 15.4 129 20.2 11.6 31.8 154 19.5 7.8 27.3
White/Other 119 28.5 118 18.6 4.2 22.8 105 22.9 7.6 30.5
Nonresident Alien 6 16.7 2 100.0 0.0 100.0 2 0.0 0.0 0.0
Unknown 2 50.0 11 27.3 27.3 54.6 17 5.8 11.8 17.6
Men 153 19.6 131 20.6 8.4 29.0 127 18.1 7.1 25.2
Women 120 22.5 139 19.4 10.1 29.5 166 19.8 9.0 28.8
Overall 273 20.9 270 20.0 9.3 29.3 293 19.1 8.2 27.3
Graduation/Retention Rates of Full-Time, First-Time, Degree-Seeking Freshmen After 6 Years
* Includes Associate degree recipients and vocational certificates.

Western New Mexico University
Performance Effectiveness Report - New Mexico’s Universities - November 2006 Page 81
Student Progress and Student Success
Table 8What degrees were awarded in 2005-06?
Certificates Assoc Bachelors Masters Total
Agriculture-related
Architecture-related
Business / Public Administration 11 24 9 44
Education 2 26 26 98 152
Engineering / Tech / Computer Science 2 25 3 30
Health Professions (w/o Nursing) 15 14 29
Home Economics
Humanities/Social Science 23 34 57
Law / Protective Services 13 1 6 20
Nursing 27 27
Science and Math 23 23
Social Work 11 11
Total 17 128 141 107 393
Table 9What are our alumni doing?
Percent Employed (may also be in school): 100% Percent Continuing Their Education: 23.0%
In what fields are they employed?Private or Self Education Government or Military Other
Employment Fields 33.0% 17.0% 33.0% 17.0%
What percent of alumni are working in New Mexico?Percent of employed: 58.3%
* See Appendix II for survey instrument (2002-03 Survey of 1998-99 Bachelors Degree Recipients)
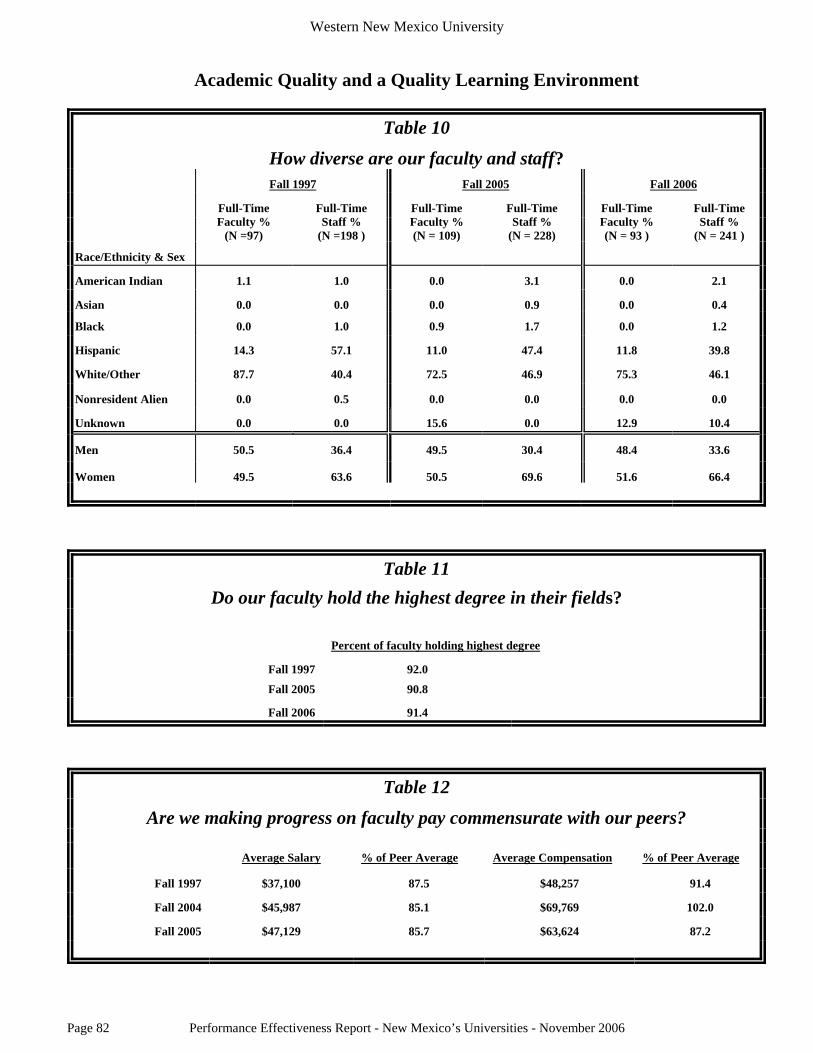
Western New Mexico University
Performance Effectiveness Report - New Mexico’s Universities - November 2006Page 82
Academic Quality and a Quality Learning Environment
Table 10
How diverse are our faculty and staff?Fall 1997 Fall 2005 Fall 2006
Full-TimeFaculty %
(N =97)
Full-TimeStaff %
(N =198 )
Full-TimeFaculty %(N = 109)
Full-TimeStaff %
(N = 228)
Full-TimeFaculty %(N = 93 )
Full-TimeStaff %
(N = 241 )
Race/Ethnicity & Sex
American Indian 1.1 1.0 0.0 3.1 0.0 2.1
Asian 0.0 0.0 0.0 0.9 0.0 0.4
Black 0.0 1.0 0.9 1.7 0.0 1.2
Hispanic 14.3 57.1 11.0 47.4 11.8 39.8
White/Other 87.7 40.4 72.5 46.9 75.3 46.1
Nonresident Alien 0.0 0.5 0.0 0.0 0.0 0.0
Unknown 0.0 0.0 15.6 0.0 12.9 10.4
Men 50.5 36.4 49.5 30.4 48.4 33.6
Women 49.5 63.6 50.5 69.6 51.6 66.4
Table 11Do our faculty hold the highest degree in their fields?
Percent of faculty holding highest degree
Fall 1997 92.0
Fall 2005 90.8
Fall 2006 91.4
Table 12
Are we making progress on faculty pay commensurate with our peers?
Average Salary % of Peer Average Average Compensation % of Peer Average
Fall 1997 $37,100 87.5 $48,257 91.4
Fall 2004 $45,987 85.1 $69,769 102.0
Fall 2005 $47,129 85.7 $63,624 87.2

Western New Mexico University
Performance Effectiveness Report - New Mexico’s Universities - November 2006 Page 83
Academic Quality and a Quality Learning Environment
Table 13
What percent of classroom instruction is delivered by tenured/tenure-track faculty?
Fall 1997 Fall 2004 Fall 2005
Percent Percent Percent
Course Level
Lower Division 77.2 48.9 59.3
Upper Division 74.8 74.1 76.8
Graduate Division 66.6 67.0 78.1
Overall 75.7 59.3 67.5
Classroom instruction excludes labs, theses, internships, independent studies, etc.
Table 14What are our student to faculty ratios?
Fall 1997 15 to 1
Fall 2004 14 to 1
Fall 2005 13 to 1
* FTE Students/FTE Instructional Faculty
Table 15How large are our classes?
Fall 1997 Average Fall 2004 Average Fall 2005 Average
Undergraduate, lower division 17.5 18.5 14.9
Undergraduate, upper division 12.3 10.6 10.3
Graduate 7.0 9.2 8.2

Western New Mexico University
Performance Effectiveness Report - New Mexico’s Universities - November 2006Page 84
Academic Quality and a Quality Learning Environment
Table 16
How satisfied are our students with their educational experience?
2003-2004
Satisfied or Very Satisfied with Curriculum and Instruction 87.9
Satisfied or Very Satisfied with Student Support 85.4
Satisfied or Very Satisfied Overall with Institution 85.7
* See Appendix III (Survey of Graduating Seniors in 2002-03)
Table 17
How satisfied are our alumni with their educational experience?
2003-2004
Satisfied or Very Satisfied with Curriculum and Instruction 90.8%
Satisfied or Very Satisfied with Student Support 91.7%
Satisfied or Very Satisfied Overall with Institution 90.1%
* See Appendix II for survey instrument (2002-03 Survey of 1998-99 Bachelors Degree Recipients)
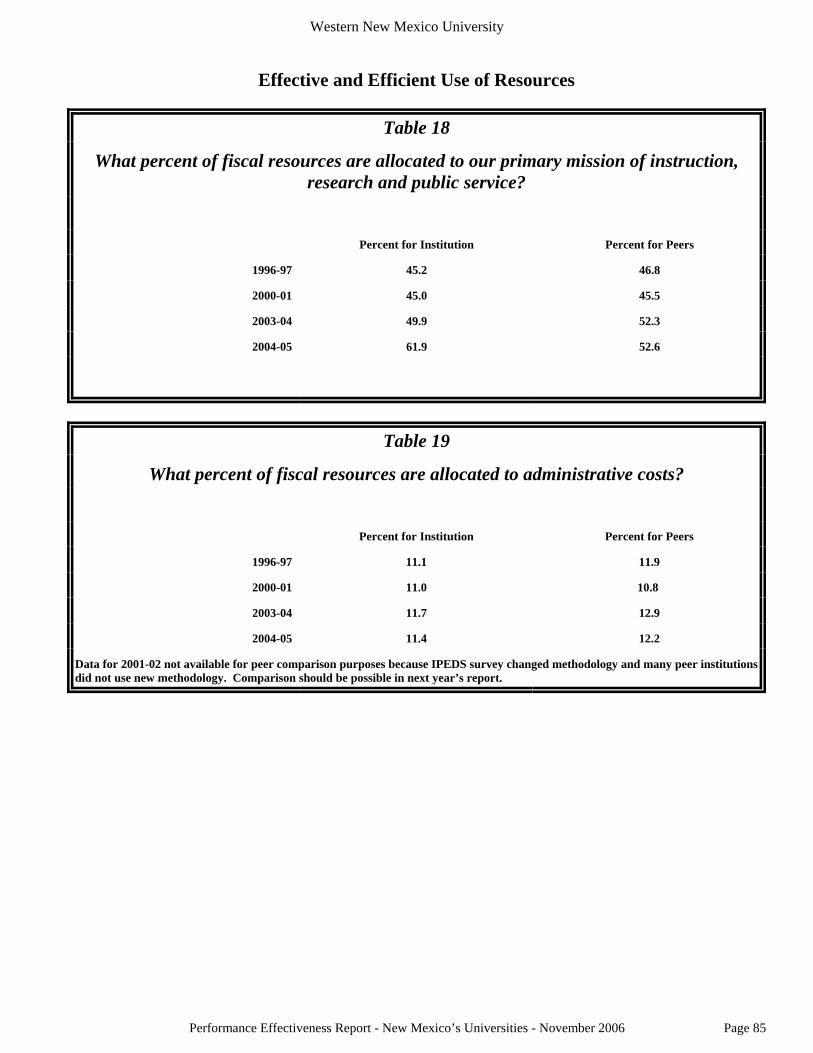
Western New Mexico University
Performance Effectiveness Report - New Mexico’s Universities - November 2006 Page 85
Effective and Efficient Use of Resources
Table 18
What percent of fiscal resources are allocated to our primary mission of instruction,research and public service?
Percent for Institution Percent for Peers
1996-97 45.2 46.8
2000-01 45.0 45.5
2003-04 49.9 52.3
2004-05 61.9 52.6
Table 19
What percent of fiscal resources are allocated to administrative costs?
Percent for Institution Percent for Peers
1996-97 11.1 11.9
2000-01 11.0 10.8
2003-04 11.7 12.9
2004-05 11.4 12.2
Data for 2001-02 not available for peer comparison purposes because IPEDS survey changed methodology and many peer institutionsdid not use new methodology. Comparison should be possible in next year’s report.
Western New Mexico University
Performance Effectiveness Report - New Mexico’s Universities - November 2006Page 86
Listing of Accreditations
WNMU North Central Association of Colleges and Schools
Business Administration Association of Collegiate Business Schools and Programs and Criminal Justice (Bachelors and Masters programs)
Child Development Center National Academy of Early Childhood Programs
Economic Development Course International Economic Development Council
Nursing (Associate degree program) National League for Nursing
Occupational Therapy Accrediting Council for Occupational Therapy Education (Associate degree program)
School of Education National Council for Accreditation of Teacher Education (Bachelor and Masters programs)
Social Work Council on Social Work Education
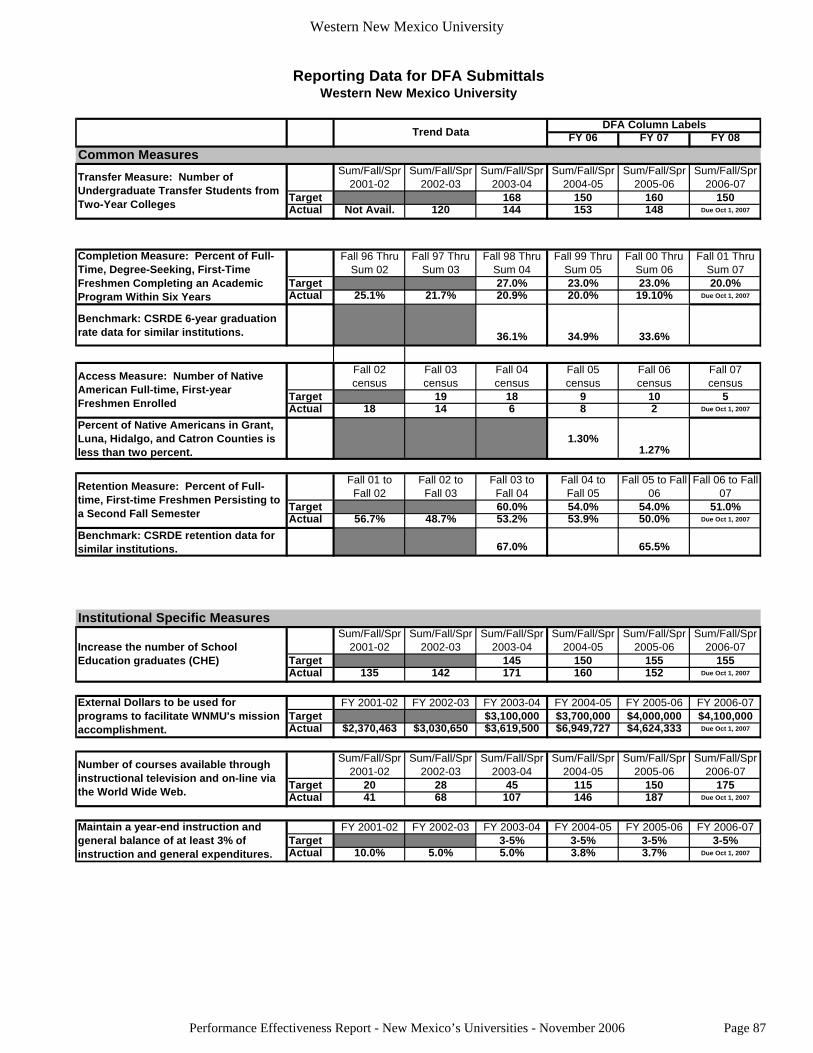
Western New Mexico University
Performance Effectiveness Report - New Mexico’s Universities - November 2006 Page 87
FY 06 FY 07 FY 08
Sum/Fall/Spr 2001-02
Sum/Fall/Spr 2002-03
Sum/Fall/Spr 2003-04
Sum/Fall/Spr 2004-05
Sum/Fall/Spr 2005-06
Sum/Fall/Spr 2006-07
Target 168 150 160 150Actual Not Avail. 120 144 153 148 Due Oct 1, 2007
Fall 96 Thru Sum 02
Fall 97 Thru Sum 03
Fall 98 Thru Sum 04
Fall 99 Thru Sum 05
Fall 00 Thru Sum 06
Fall 01 Thru Sum 07
Target 27.0% 23.0% 23.0% 20.0%Actual 25.1% 21.7% 20.9% 20.0% 19.10% Due Oct 1, 2007
Benchmark: CSRDE 6-year graduation rate data for similar institutions. 36.1% 34.9% 33.6%
Fall 02 census
Fall 03 census
Fall 04 census
Fall 05 census
Fall 06 census
Fall 07 census
Target 19 18 9 10 5Actual 18 14 6 8 2 Due Oct 1, 2007
Percent of Native Americans in Grant, Luna, Hidalgo, and Catron Counties is less than two percent.
1.30%1.27%
Fall 01 to Fall 02
Fall 02 to Fall 03
Fall 03 to Fall 04
Fall 04 to Fall 05
Fall 05 to Fall 06
Fall 06 to Fall 07
Target 60.0% 54.0% 54.0% 51.0%Actual 56.7% 48.7% 53.2% 53.9% 50.0% Due Oct 1, 2007
Benchmark: CSRDE retention data for similar institutions. 67.0% 65.5%
Sum/Fall/Spr 2001-02
Sum/Fall/Spr 2002-03
Sum/Fall/Spr 2003-04
Sum/Fall/Spr 2004-05
Sum/Fall/Spr 2005-06
Sum/Fall/Spr 2006-07
Target 145 150 155 155Actual 135 142 171 160 152 Due Oct 1, 2007
FY 2001-02 FY 2002-03 FY 2003-04 FY 2004-05 FY 2005-06 FY 2006-07Target $3,100,000 $3,700,000 $4,000,000 $4,100,000Actual $2,370,463 $3,030,650 $3,619,500 $6,949,727 $4,624,333 Due Oct 1, 2007
Sum/Fall/Spr 2001-02
Sum/Fall/Spr 2002-03
Sum/Fall/Spr 2003-04
Sum/Fall/Spr 2004-05
Sum/Fall/Spr 2005-06
Sum/Fall/Spr 2006-07
Target 20 28 45 115 150 175Actual 41 68 107 146 187 Due Oct 1, 2007
FY 2001-02 FY 2002-03 FY 2003-04 FY 2004-05 FY 2005-06 FY 2006-07Target 3-5% 3-5% 3-5% 3-5%Actual 10.0% 5.0% 5.0% 3.8% 3.7% Due Oct 1, 2007
Reporting Data for DFA SubmittalsWestern New Mexico University
Trend Data DFA Column Labels
Common MeasuresTransfer Measure: Number of Undergraduate Transfer Students from Two-Year Colleges
Completion Measure: Percent of Full-Time, Degree-Seeking, First-Time Freshmen Completing an Academic Program Within Six Years
Access Measure: Number of Native American Full-time, First-year Freshmen Enrolled
Number of courses available through instructional television and on-line via the World Wide Web.
Maintain a year-end instruction and general balance of at least 3% of instruction and general expenditures.
Retention Measure: Percent of Full-time, First-time Freshmen Persisting to a Second Fall Semester
Institutional Specific Measures
Increase the number of School Education graduates (CHE)
External Dollars to be used for programs to facilitate WNMU's mission accomplishment.

Performance Effectiveness Report - New Mexico’s Universities - November 2006Page 88
This page intentionally blank.

Performance Effectiveness Report - New Mexico’s Universities - November 2006 Page 89
APPENDIX IPEER INSTITUTIONS
New Mexico Institute of Mining & Technology Eastern New Mexico State UniversityColorado School of Mines Central Washington UniversityGeorgia Institute of Technology Emporia State UniversityMichigan Technological University Henderson State UniversityMontana Tech of the University of Montana Northeastern Illinois UniversityNew Jersey Institute of Technology Montana State University – BillingsNorth Dakota State University – Main Campus Northwest Missouri State UniversitySouth Dakota School of Mines & Technology Pittsburg State UniversitySUNY College of Environmental Science & Forestry Southeastern Oklahoma State UniversityTennessee Technological University Texas A & M University – KingsvilleUniversity of Missouri – Rolla Truman State University
University of Central OklahomaNew Mexico State University University of Colorado at Colorado SpringsClemson University University of MontevalloColorado State University University of North FloridaIowa State University Western Oregon UniversityKansas State University Winthrop UniversityLouisiana State UniversityOklahoma State University New Mexico Highlands UniversityOregon State University Adams State UniversityTexas A & M University Albany State UniversityThe University of Tennessee Central Washington UniversityUniversity of Arizona Fort Hays State UniversityUniversity of Arkansas Henderson State UniversityUniversity of Missouri-Columbia Lincoln UniversityUniversity of Wyoming Montana State University – BillingsUtah State University Southeastern Oklahoma State UniversityVirginia Polytechnic Institute & State University Texas A & M University – Corpus ChristiWashington State University Truman State University
The University of Texas – Pan AmericanUniversity of New Mexico University of Colorado at Colorado SpringsUniversity of Arizona University of MontevalloUniversity of Arkansas University of North FloridaUniversity of Colorado at Boulder University of Wisconsin – SuperiorUniversity of Iowa Western Oregon UniversityUniversity of KansasUniversity of Kentucky Western New Mexico UniversityUniversity of Missouri-Columbia Adams State CollegeUniversity of Nebraska at Lincoln Albany State UniversityUniversity of Oklahoma – Norman Chadron State CollegeUniversity of Oregon East Central UniversityUniversity of South Carolina at Columbia Fort Hays State UniversityThe University of Tennessee Henderson State UniversityThe University of Texas at Austin Indiana University – South BendUniversity of Utah Montana State University – BillingsUniversity of Virginia Southeastern Oklahoma State UniversityUniversity of Washington Sul Ross State University
Texas A & M International UniversityUniversity of Colorado at Colorado SpringsUniversity of West AlabamaUniversity of Wisconsin – SuperiorWayne State UniversityWestern Oregon University

Performance Effectiveness Report - New Mexico’s Universities - November 2006Page 90
APPENDIX IINEW MEXICO’S UNIVERSITIES 2002-2003 SURVEY OF STUDENT SATISFACTION WITH
UNDERGRADUATE EDUCATION
The Council of University Presidents is committed to seeking regular feedback from appropriate constituencies on thequality and effectiveness of our universities’ academic programs and services. Students currently enrolled in ouruniversities are a valuable source of information, which can be used to improve our programs. During the2002-2003academic year, New Mexico’s six universities surveyed graduating seniors in their respective student bodies to elicitstudents’ perceptions regarding their undergraduate educational experiences. The universities had developed a commonset of questions, so all institutions would have comparable information on their students’ satisfaction with their educationalexperiences.
In the body of this PEP report, each institution has reported summary information on its graduating seniors’ satisfactionwith a number of factors related to the university’s undergraduate curriculum/instruction, support services and an overallassessment of their educational experiences at the university. The common set of questions asked of graduating seniors isprovided below. Interested parties are encouraged to contact each university for further and more detailed data on theresponses of its students. The survey results will be shared throughout each university community and will contribute tofuture program improvements.
2002-2003 Student Satisfaction Survey
Please rate your satisfaction with your university regarding the following issues:((1) Very Satisfied, (2) Satisfied, (3) Dissatisfied, (4) Very Dissatisfied, (5) Does Not Apply)
Curriculum/InstructionQuality of instruction in your major 1 2 3 4 5Quality of instruction outside your major 1 2 3 4 5Quality of academic advising 1 2 3 4 5Availability of courses in your major 1 2 3 4 5Quality of intellectual challenge of your program 1 2 3 4 5
Student SupportAdequacy of financial assistance ($) 1 2 3 4 5Quality of career counseling and advising 1 2 3 4 5Contact with faculty outside of class 1 2 3 4 5Adequacy of laboratories and equipment 1 2 3 4 5Adequacy of library facilities 1 2 3 4 5Adequacy of computer facilities 1 2 3 4 5
Overall AssessmentValue of your education, relative to cost 1 2 3 4 5Your sense of community on campus 1 2 3 4 5Your preparation for work or graduate school 1 2 3 4 5Your satisfaction with your college experience 1 2 3 4 5
Your major(s):

Performance Effectiveness Report - New Mexico’s Universities - November 2006 Page 91
If you had to do it over again, would you attend the institution?
If you had to do it over again, would you choose the same major?
What’s next?___________________________________________________________________________________________________________________________________________________________________________________________________________________________________________________________________
Choose one or more: graduate school, seek job, already have job in my field, teacher (K-12),seek job in another field,military, or other.
Will you be staying in New Mexico after graduation?
Please comment on any aspect of your collegiate experience that you felt was a particular strength or a particular weaknessin the areas of curriculum, instruction, academic support, or your overall college experience.
If you were able to make one significant change in the programs, services or environment for students at this university,what would it be?

Performance Effectiveness Report - New Mexico’s Universities - November 2006Page 92
APPENDIX IIINEW MEXICO’S UNIVERSITIES 2002-2003 SURVEY OF ALUMNI
ASSESSMENT OF UNDERGRADUATE EDUCATIONAL PREPARATION
Alumni are a critical source of evaluative information on the quality of a university’s academic programs and supportservices for students. Alumni can offer their perceptions of the quality of the programs and services in place while theywere at the university. Alumni also have the advantage of knowing now what would have been useful universitypreparation for their current employment or educational pursuits. During the 2002-2003 academic year, New Mexico’s sixuniversities surveyed alumni who were in the graduating class of 1998-1999. At the time they received the survey, thesealumni had been employed and/or enrolled in further education for three years. The universities developed a common setof questions to be asked of all alumni surveyed in order to have comparable information relating to their alumni’ssatisfaction with their undergraduate educational preparation.
The alumni survey provided feedback to each university on what its alumni are doing three years after receiving theirbaccalaureate degrees. This information on alumni employment and further education contributes to a more completepicture of our students’ progress and success. Each university has provided the placement data on its alumni. Alsoincluded with the data for each institution in this PEP report is a summary of alumni responses regarding their satisfactionwith their undergraduate curriculum and instruction, academic support available to them, and their overall assessment ofhow well their undergraduate programs developed their skills and prepared them for work and further education. Thespecific set of questions asked in this alumni survey is provided below. Anyone seeking additional information related tothe results of these alumni surveys is encouraged to contact the specific university for a complete report.
2002-2003 Alumni Survey of 1998-1999 Academic Year GraduatesEmployment and Further Education
Which of the following best describes what you are currently doing? (Choose only one.)Employed Continuing my educationEmployed and continuing my education UnemployedCaring for home/family Military
What is your occupation?_________________________________________
If employed, which category best describes your employer? (Choose only one.)Private Education Military Does Not ApplyGovernment Self-Employed Other
What is your position?___________________________________________If employed, are you employed in New Mexico or outside the state?_______If employed outside of New Mexico, please indicate the state/country where you are employed._______What is your (individual) annual salary/income?____________If employed, how satisfied ((1) Very Satisfied, (2) Satisfied, (3) Dissatisfied, (4) Very Dissatisfied, (5)Does Not Apply) are you with the following aspects of your job?
Intellectual and personal challenge 1 2 3 4 5Advancement potential 1 2 3 4 5Location 1 2 3 4 5
Have you continued your education since graduating from this university?________________________________________________________________________________________________________________________________________________________________________________________________________________________________________________________________________________________________________________________________________

Performance Effectiveness Report - New Mexico’s Universities - November 2006 Page 93
Your Experience While at This University
Please rate your satisfaction ((1)Very Satisfied, (2)Satisfied, (3)Dissatisfied, (4)Very Dissatisfied,(5)Does Not Apply) with the quality of your undergraduate education in the following aspects:
CurriculumQuality of instruction in your major 1 2 3 4 5Quality of instruction outside your major 1 2 3 4 5Quality of academic advising 1 2 3 4 5Availability of courses in your major 1 2 3 4 5Appropriateness of courses in your major 1 2 3 4 5
Student SupportQuality of career advisement 1 2 3 4 5Contact with faculty outside of class 1 2 3 4 5Adequacy of facilities (labs, library, computers, equipment) 1 2 3 4 5
Overall AssessmentYour preparation to communicate effectively (oral and written) 1 2 3 4 5Your preparation to think analytically and logically 1 2 3 4 5Your preparation to define and solve problems 1 2 3 4 5Your preparation for your current job 1 2 3 4 5Your preparation for graduate study 1 2 3 4 5Your satisfaction with your college experience 1 2 3 4 5
If you had to do it over again, would you attend this university?__________________________________________________________________________________________________________________________________________________________________________________________________________________________________________________________________________________________________________________________________________________________________________________________________________________________
If you had to do it over again, would you choose the same major?____________________________________________________________________________________________________________________________________________________________________________________________________________________________________________________________________________________________________________________________________________________________________________________________________________________________________________________________________________________________________________
Comments and Suggestions
Please comment about your experience at this university or list suggestions for program and universityimprovement.____________________________________________________________________________________________________________________________________________________________________________________________________________________________________________________________________________________________________________________________________________________________________________________________________________________________________________________________________________________________________________
If you were able to make one significant change in the programs, services or environment for studentsat this university, what would it be?____________________________________________________________________________________________________________________________________________________________________________________________________________________________________________________________________________________________________________________________________________________________________________________________________________________________________________________________________________________________________________

Performance Effectiveness Report - New Mexico’s Universities - November 2006Page 94
APPENDIX IV
Council of University PresidentsEmployer Perceptions of New Mexico
Universities Survey
Executive Summary
November 2002
Prepared for:New Mexico Council of University PresidentsTwo Woodward Center700 Lomas Blvd., NE Suite 203Albuquerque, NM 87131(505) 277-9692
Prepared by:Research & Polling, Inc.5140 San Francisco Rd., NEAlbuquerque, New Mexico 87109-4640(505) 821-5454 Fax: (505) 821-5474

Performance Effectiveness Report - New Mexico’s Universities - November 2006 Page 95
METHODOLOGY
Research ObjectivesThis study was commissioned by the Council of University Presidents (CUP). The major objectives of thesurvey were to ascertain employer satisfaction with the educational preparation of students by the four-year public universities in New Mexico, identify employers' suggestions for how these universities maybe improved from the perspective of the end-user, and identify employer hiring practices.
The survey focused strictly on the four-year public universities in New Mexico, which are comprised of:the University of New Mexico (UNM), New Mexico State University (NMSU), New Mexico HighlandsUniversity (Highlands), the New Mexico Institute of Mining and Technology (Tech), Eastern New MexicoUniversity (ENMU), and Western New Mexico University (WNMU). The random sample of New Mexicobusinesses represented all types, sizes, and regions of employers.
Questionnaire DesignResearch & Polling worked closely with the Council of University Presidents (CUP) to identify specificresearch objectives to be used in the development and refinement of questionnaire survey drafts. Thequestionnaire was comprised of both closed-ended and open-ended items, the latter of which allowedCUP to identify issues from employers in an unaided format. Closed-ended questions were structured insuch a way that would allow for comparisons among questionnaire items using quantitative statisticaltechniques. The questionnaire is presented in the Appendix of this report.
Sampling MethodResearch & Polling generated the random sample of New Mexico industries for the survey using its databases, which include employers of all sizes, industrial sectors, and geographic areas throughout NewMexico. Only employers who reported having hired at least one employee over the past three years whoattended one of the six New Mexico public four-year universities were interviewed since one of theprimary research objectives of the survey was to ascertain the image of these higher educationinstitutions.
Statistical ConfidenceFive hundred and one employers were interviewed, resulting in an overall margin of error of ±4.4% atthe 95% confidence interval. In theory, in 95 out of 100 cases, the results based on a sample of 501 willdiffer by no more than 4.4 percentage points in either direction from what would have been obtained byinterviewing all New Mexico employers hiring those who have attended one of the four-year NewMexico public universities.
Interviewing MethodInterviews were conducted over the telephone during business hours Monday through Friday in April2002. Interviews were conducted by professional executive interviewers briefed on the particularspecifications for the survey. Those unavailable at the time of the initial call were called back in anattempt to interview the relevant individual at the organization.
The questionnaire instrument was pre-tested prior to survey administration to ascertain that the surveyitems were understood by the respondents and to determine how to best procure an interview with therelevant person at each organization. It was found that it was appropriate to screen for the ‘manager,’or ‘head of personnel’ to obtain the most accurate information for the survey.
Data Processing & AnalysisAll completed questionnaires were edited, coded, and entered into Research & Polling’s custom surveyresearch software. Responses to open-ended questions were coded for the purpose of allowingquantitative analysis of the results to open-ended questions. Chi-square analysis revealed whetherstatistically significant differences existed among employer subgroups such as employer geographicregion, size, and hiring practice profiles. When such differences are noted, they are pointed out in thereport.

Performance Effectiveness Report - New Mexico’s Universities - November 2006Page 96
SUMMARY OF RESULTS
New Mexico’s four-year public universities play an extremely important role not only in the lives of theirstudents, but in the quality of life of New Mexico as a whole. The universities have an importantresponsibility to provide a quality education to students while contributing to the economic vitality ofthe state. Higher education is important to prospective employers. In fact, the majority (55%) ofemployers who within the last three years have hired at least one employee who attended one of NewMexico’s four-year public universities say it is important for prospective employees to have a four-yearcollege degree. Furthermore, 30% of employers say they have actively recruited employees atuniversities throughout the state.
Overall, employers give the universities relatively high marks for preparing students for life beyondcollege. In fact, just over two-thirds (69%) of employers give the universities an ‘A’ or ‘B’ grade forproviding students with a well-rounded education and 64% give a grade of ‘A’ or ‘B’ for preparingstudents for the workforce. The majority (54%) also give the universities high grades for preparingemployees for their specific type of business. Although the majority of employers give high marks foreach of the attributes listed, there is room for improvement as indicated by the fact 14% of employersgive grades of ‘D’ or ‘F’ for the job being done to prepare employees for their type of business andanother 27% give the universities a ‘C’ grade.
In addition to asking employers to grade the universities on the attributes mentioned above, they wereasked to rate the importance of various skills and attributes employees may possess and also asked torate how well the universities are doing in preparing students for each skill or attribute. All of the skillslisted were deemed to be important by the large majority of employers, though integrity/honesty, apositive work attitude, responsibility/accountability and a willingness to learn new things are rated asbeing the most important. Interestingly, the skills and attributes that are deemed to be the mostimportant are perhaps the most difficult for the universities to instill into students for they are morepersonal in nature, unlike tangible skills such as reading, writing and arithmetic.
In addition to asking employers to rate the importance of various skills and attributes, they were askedto rate how well prepared students are when they come out of New Mexico’s four-year publicuniversities. Overall, employers feel students are best prepared in their reading skills, willingness towork in teams, computer skills and math skills. Conversely, students are perceived to be least preparedin leadership skills, creative thinking, decision making and problem solving. These are areas that maywarrant further exploration as universities work to develop the skills employees will need to besuccessful in their careers.
It is also interesting to note there is often a large discrepancy in the perceived importance of variousskills and attributes and how well students are being prepared. For instance, while 90% of employersfeel problem solving skills are important, just 49% feel the universities are doing a good job preparingstudents in this area. Furthermore, 91% say listening skills are important, though 53% feel thestudents are well prepared. The disparity between perceived importance of employee skills andattributes to how well they are being prepared should be looked into more closely so that ways can befound to better prepare students for the workforce.
Finally, it is important to note that there are opportunities to promote the New Mexico four-year publicuniversities. Media and promotional programs can emphasize the types of educational programs andskills employers desire that are offered at these universities. For example, promotion of the four-yearpublic universities might emphasize curriculum that focus on work ethics and the partnership of suchuniversities for on-the-job training programs. The promotion of the four-year public universities isparticularly important in counteracting any negative perceptions regarding the funding of theseinstitutions that may have resulted from media reports regarding funding challenges.

Performance Effectiveness Report - New Mexico’s Universities - November 2006 Page 97
Importance of a Four-Year College Degree to New Mexico Employers
IMPORTANCE OFA COLLEGE DEGREE TO EMPLOYERS
TOTAL SAMPLEAPR. 2002(N = 501)
5 - Very important 36%4 19%3 24%2 9%1 - Not at all important 12%Don't know/refused 1%
MEAN † 3.6
† The mean score is derived by taking the average score based on the 5-point scale. The very important response is assigneda value of 5, the not at all important response is assigned a value of 1, etc. The “don’t know/won’t say” responses areexcluded from the calculation of the mean.
As previously mentioned, the majority of employers (55%) say it is important for prospective employees of their companyto have a four-year college degree. In fact, 36% say a four-year degree is very important for prospective employees.Employers in the field of education (90%), government (71%) and those with 101 or more employees (79%) are most apt tofeel a four-year college degree is important.
Hiring Practices & Employment Recruitment
PERCENT OF NEW MEXICO EMPLOYERS HIRINGFROM EACH 4-YEAR NEW MEXICO PUBLIC UNIVERSITY
TOTAL SAMPLEAPR. 2002(N = 501)
University of New Mexico (UNM) 65%
New Mexico State University (NMSU) 51%
Eastern New Mexico University (ENMU) 21%
New Mexico Highlands University (NMHU) 18%
Western New Mexico University (WNMU) 11%
NM Institute of Mining and Technology (NMT) 10%
The table above shows the percentage of employers who have hired at least one employee from New Mexico’s publicuniversities in the past three years. Approximately two-thirds (65%) of employers say they have hired at least oneemployee who attended UNM, while half (51%) have hired an employee who attended NMSU and approximately one-fifthhave hired employees from ENMU (21%) or Highlands (18%).

Performance Effectiveness Report - New Mexico’s Universities - November 2006Page 98
Evaluation of Student Preparedness & Work Skills Employers Desire
GENERAL PREPARATION OF STUDENTS
APRIL 2002 - TOTAL SAMPLE (N = 501)
A B C D F
Providing students with a well-rounded education 23% 46% 21% 3% 1%
Preparation of students for the workforce 18% 46% 24% 4% 2%
Preparing employees for your type of business 17% 37% 27% 9% 5%
Employers were asked to grade various aspects of New Mexico’s four-year public universities as a group using an academicgrading system of A, B, C, D, and F. As shown above, the universities receive the highest overall grades for providing awell-rounded education as 23% of employers assign a grade of ‘A’ and 46% give a ‘B’ grade. The majority (64%) ofemployers also give the universities grades of ‘A’ (18%) or ‘B’ (46%) for preparing students for the workforce, though itshould be noted that 24% give a grade of ‘C’ and 6% give a lower grade. Finally, while the majority (54%) of employersgive the universities a grade of ‘A’ or ‘B’ for preparing students for their type of business, 27% have a ‘C’ grade and 14%give grades of ‘D” or ‘F’ for such specific training.
PERCEIVED IMPORTANCE OF EMPLOYEE SKILLS/ATTRIBUTESRanked By Highest Percentage “Very Important”
APRIL 2002 TOTAL SAMPLE (N = 501)VERY NOT AT ALL
IMPORTANT IMPORTANT DON’T KNOW/5 4 3 2 1 WON’T SAY MEAN †
Integrity and honesty 90% 6% 2% * * 1% 4.9
Positive work attitude 85% 11% 2% - * 1% 4.8
Responsibility & accountability 85% 11% 3% 1% * 1% 4.8
Willingness to learn new things 83% 13% 3% 1% - 1% 4.8
Reading skills 72% 20% 4% 1% 2% 1% 4.6
Problem solving skills 69% 21% 8% 1% 1% 1% 4.6
Listening skills 68% 23% 6% 2% 1% 1% 4.6
Willingness to work in teams 68% 20% 8% 1% 1% 1% 4.5
Decision making skills 60% 26% 11% 2% 1% - 4.4
Writing skills 53% 26% 13% 4% 3% 1% 4.2
Creative thinking skills 49% 31% 16% 2% 2% 1% 4.2
Computer skills 48% 30% 15% 3% 4% 1% 4.2
Leadership skills 45% 34% 16% 4% 2% * 4.2
Math skills 45% 29% 18% 5% 2% 1% 4.1 * Less than 1% reported.† The mean score is derived by taking the average score based on the 5-point scale. The very important response is assigned
a value of 5, the not at all important response is assigned a value of 1, etc. The “don’t know/won’t say” responses areexcluded from the calculation of the mean.

Performance Effectiveness Report - New Mexico’s Universities - November 2006 Page 99
Employers were asked to rate the importance of various employee skills and attributes based on a 5-point scale where 5 isvery important and 1 is not at all important. As shown above, over four-in-five employers feel each of the following attributesis very important: integrity and honesty (90%), positive work attitude (85%), responsibility and accountability (85%), andthe willingness to learn new things (83%). Furthermore, two-thirds or more employers believe reading skills (72%),problem solving skills (69%), listening skills (68%), and willingness to work in teams (68%) is very important. It should alsobe noted that approximately one-fifth of the employers assign a rating of ‘4’ to each of these attributes indicating they areimportant to these employers.
The majority of employers feel decision making skills (60%) and writing skills (53%) are very important skills with another26% giving a rating of ‘4’ to each. The large majority of employers also feel creative thinking skills, computer skills,leadership skills and math skills are important with approximately half of the employers saying these attributes are veryimportant.
PERCEIVED PREPAREDNESS OF EMPLOYEE SKILLS/ATTRIBUTES BY UNIVERSITIESRanked By Highest Percentage “Very Well Prepared”
APRIL 2002 TOTAL SAMPLE (N = 501)
VERY NOT AT ALLWELL PREPARED PREPARED DON’T KNOW/
5 4 3 2 1 WON’T SAY MEAN †
Reading skills 32% 38% 19% 5% 2% 4% 4.0
Willingness to work in teams 31% 35% 22% 7% 3% 3% 3.9
Computer skills 25% 37% 25% 6% 1% 6% 3.8
Math skills 20% 35% 30% 9% 2% 4% 3.6
Writing skills 19% 31% 30% 13% 4% 3% 3.5
Listening skills 18% 35% 32% 8% 4% 4% 3.6
Problem solving skills 17% 32% 35% 8% 4% 4% 3.5
Decision making skills 15% 31% 39% 11% 3% 2% 3.5
Creative thinking skills 15% 31% 38% 9% 4% 3% 3.5
Leadership skills 12% 26% 42% 12% 3% 5% 3.3
† The mean score is derived by taking the average score based on the 5-point scale. The very well prepared response isassigned a value of 5, the not at all prepared response is assigned a value of 1, etc. The “don’t know/won’t say” responsesare excluded from the calculation of the mean.
In addition to asking employers to rate the importance of various skills and attributes, they were asked to rate how wellstudents are prepared in these areas at the state’s four-year public universities. Ratings are based on a 5-point scale where5 is very well prepared and 1 is not at all prepared. As shown above, 70% of employers feel students are well prepared inreading skills as indicated by a score of 4 or 5, with 32% saying they are very well prepared. Two-thirds also believestudents are well prepared in the willingness to work in teams as 31% say students are very well prepared. The majority ofemployers also believe students are well prepared in computer skills (62%), math skills (55%), and listening skills (53%).
Half of the employers believe students are well prepared in writing skills (50%), and problem solving skills (49%). Itshould be noted that less than 20% of employers feel students are very well prepared in these skill areas. Less than half ofemployers feel the universities are doing a good job of preparing students in decision making skills (46%), creative thinkingskills (46%) and leadership skills (38%). For many of these attributes the plurality of employers give neutral or mixedreviews as indicated by a score of ‘3' on a 5-point scale which suggests that while employers are not being overly critical ofthe universities, they do believe that more can be done to improve these skills.

Performance Effectiveness Report - New Mexico’s Universities - November 2006Page 100
PERCEIVED IMPORTANCE & PREPAREDNESS OF EMPLOYEE SKILLS/ATTRIBUTESCOMBINED 4 & 5 SCORES BASED ON A 5-POINT SCALE
(‘5’ = ‘VERY IMPORTANT/VERY WELL PREPARED;’ ‘1’ = ‘NOT AT ALL IMPORTANT/NOT AT ALL PREPARED’)
APRIL 2002 TOTAL SAMPLE (N = 501)
COMBINED 4 & 5 SCORESBASED ON A 5-POINT SCALE
IMPORTANCE PREPAREDNESS
Reading skills 92% 70%Listening skills 91% 53%Problem solving skills 90% 49%
Willingness to work in teams 88% 66%Decision making skills 86% 46%Creative thinking skills 80% 46%
Writing skills 79% 50%Leadership skills 79% 38%Computer skills 78% 62%Math skills 74% 55%
The table above shows the percentage of employers who give combined ratings of 4 and 5 on a 5-point ratingscale for the importance of employee attributes and how well students are being prepared by the state’s four-year public universities. The results show a disparity between perceived importance and overall preparednessof students. For example, while 91% of employers rate listening skills as being important, just 53% feelstudents are well prepared in this area. Furthermore, 90% of employers believe problem solving skills areimportant, yet just 49% feel students are well prepared by the universities. Similar results are observed formany of the attributes tested, though it should be noted the universities are doing relatively well when it comesto computer skills, math skills, reading skills, and willingness to work in teams as the gap between importanceand preparedness is smaller in these areas.

Performance Effectiveness Report - New Mexico’s Universities - November 2006 Page 101
APPENDIX V
Data Sources (in order of appearance in report)Enrollments Institutional files
Program majors-counts Institutional files
Current funds revenues Exhibit 1 of “Santa Fe” budget documentHED Overview of Institutional OperatingBudgets
State appropriation as percent of operatingbudgets
HED Overview of Institutional OperatingBudgets
Annual undergraduate tuition/required fee ratescompared with peers
IPEDS Institutional Characteristics survey
State personal per capita income for New Mexicoand peers
University of New Mexico – Bureau ofBusiness and Economic Research
Financial Aid – average award and average cost HED Financial Aid File and StudentFinancial Aid File
Financial aid – by Aid Type HED Financial Aid File and StudentFinancial Aid File
Enrollment by race/ethnicity HED Student Files
NM high school graduates NM Public Education Department
NM ACT test takers ACT – The College Board
Undergraduate Transfer Students Institutional files
Freshman persistence rates Institutional files
Graduation rates IPEDS Graduation Rate Survey
Degrees Awarded IPEDS Completions Survey
Faculty and staff profile by race/ethnicity and sex Institutional files
Full-time faculty with terminal degrees Institutional files
Comparison of average facultysalaries/compensation with peers
AAUP Full-time Instructional FacultySalary Survey (Academe)
Percent of student credit hours taught bytenured/tenure-track faculty
Institutional files
Student/Faculty ratio Institutional files
Average class size HED Course File
Primary mission (instruction, research & publicservice) as a percent of Education and Generalexpenditures
IPEDS Finance Survey
Administrative cost (institutional support) as apercent of Education and General expenditures
IPEDS Finance Survey
External Accreditations Institutional files

Performance Effectiveness Report - New Mexico’s Universities - November 2006Page 102
This page blank intentionally.

Page 103
Please contact the following web pages for additional information about New Mexico’s public universities:
New Mexico Institute of Mining & TechnologySocorro, New Mexico 87801
http://www.nmt.edu/
New Mexico State UniversityLas Cruces, New Mexico 88003-8001
http://www.nmsu.edu/
University of New MexicoAlbuquerque, New Mexico 87131
http://www.unm.edu/
Eastern New Mexico UniversityPortales, New Mexico 88130
http://www.enmu.edu/
New Mexico Highlands UniversityLas Vegas, New Mexico 87701
http://www.nmhu.edu/
Western New Mexico UniversitySilver City, New Mexico 88062
http://www.wnmu.edu/