performance limits for structural walls
TRANSCRIPT

Performance Limits for Structural Walls
P. Gülkan1 and İ. Kazaz2
1Başkent University, 06790 Ankara, Turkey2Erzurum Technical University, 25100 Erzurum, Turkey
1

Math
SkillsProblem
Solving
People
Skills
Drinking
Disorder
Heartless
Obsessive
Compulsive
Disorder
Engineer
Lawyer
Management
SalesHuman
resources
Accountant
Selecting the Right Profession Was
Never Easier
2

Institutional building near Erzincan
where an M7.9 earthquake occurred
in 1939, virtually destroying the city.3

Street scene following the M6.8
earthquake in Erzincan, 1992.
4

One of about twenty bare-frame school buildings
that were retrofitted at great cost. (Erzincan, 1992).
5

Outline
• Performance limits for structural walls
• Component (local) vs system (global) response
• Tests vs calculations
• The need for investigating full range of parameter variations
• Synthesis of analytical experiments
• Conclusions
6

Investigation of performance limits of structural walls
is required to:
Improve the limit state definitions and corresponding values
too conservative?
very generous, possibly unsafe, limits?
Examine the validity of recently adopted strain limit definitions
(TSRB* 2019) compared with conventional rotation limits (FEMA
356)
inadequate experimental verification of proposed strain limits, i.e., do
strain limits and damage states match?
Does the plane section analysis for walls work?
The gap is mainly due to
Limitations in the experimental setups and the range of variables
that dictate the outcome. Numerical experiments involving a range
of parameters may prove to be illuminating.
Accuracy of analytical procedures in predicting reinforced concrete
response under varying loading and stress conditions.* Turkish Seismic Regulation for Buildings, sometimes elevated, incorrectly, to the status of «code.» It is not. 7

Attempting to predict the real behavior of reinforced concrete systems in the
advanced inelastic range can be an experience that teaches humility.
8

(TSRB-19)
ASCE/SEI 41IO: Immediate OccupancyLS: Life SafetyCP: Collapse Prevention
TSRB-19MD: Minimum Damage LimitSL: Safety LimitCL: Collapse Limit
Eurocode 8 (EC8)DL: Damage LimitationSD: Significant DamageNC: Near Collapse
Component performance levels for flexural members
(TSRB-19)
(TSRB-19)
No unanimity in designation of limit states. No change between TSRB (2007) and (2019).
9

Plastic rotation limits for shear wall members controlled by
flexure in ASCE/SEI 41
Acceptable Plastic Hinge
Rotation (radians)
Performance Level
IO LS CP
Shear walls and wall segments
'
')(
cww
yss
flt
PfAA '
cww flt
ForceShear Confined
boundary
≤ 0.10 ≤ 0.25 (3)* Yes 0.005 0.010 0.015
≤ 0.10 ≥ 0.50 (6)* Yes 0.004 0.008 0.010
≥ 0.25 ≤ 0.25 (3)* Yes 0.003 0.006 0.009
≥ 0.25 ≥ 0.50 (6)* Yes 0.0015 0.003 0.005
≤ 0.10 ≤ 0.25 (3)* No 0.002 0.004 0.008
≤ 0.10 ≥ 0.50 (6)* No 0.002 0.004 0.006
≥ 0.25 ≤ 0.25 (3)* No 0.001 0.002 0.003
≥ 0.25 ≥ 0.50 (6)* No 0.001 0.001 0.002
*The values in parentheses are in psi
10

0.225 0.35'
100v1 max(0.01; )0.016 0.3 25 1.25
max(0.01; )
ywsx
c d
f
fv
um c
el
Lf
h
0.3 0.35'
1000.2 v1 max(0.01; )0.0145 0.25 25 1.275
max(0.01; )
ywsx
c d
f
fpl v
um c
el
Lf
h
Eurocode 8:
0.002 1 0.125 0.133
b yv vy y y
v c
d fL z h
L f
• Limit State of Damage Limitation (DL):
• Limit State of Near Collapse (NC):
Total chord rotation:
Plastic component:
Regressed equations aren’t all
seeing.
11
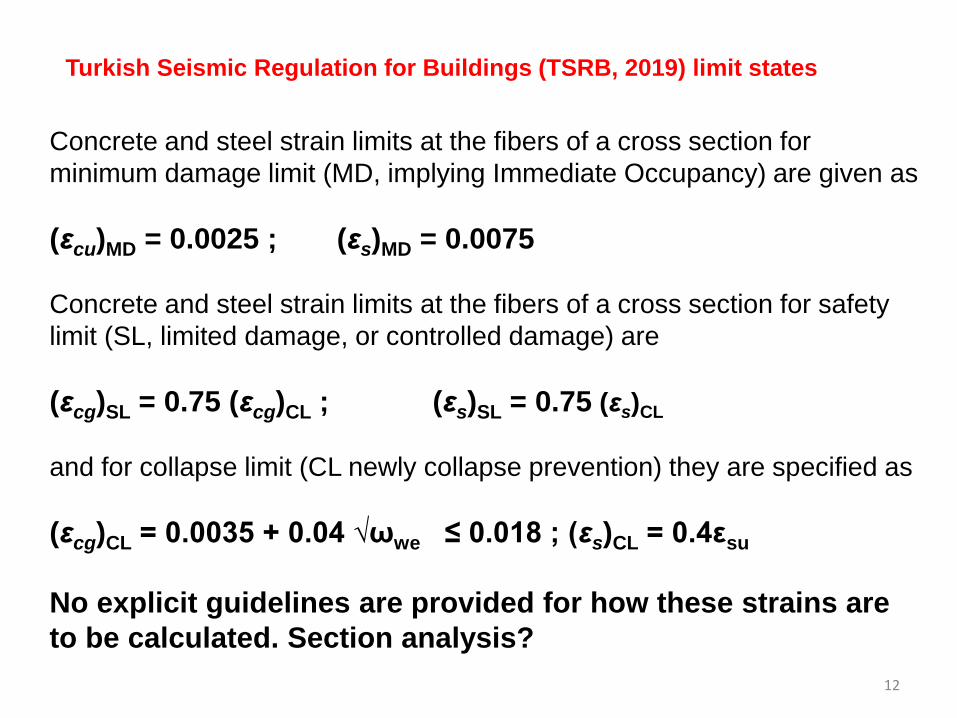
Turkish Seismic Regulation for Buildings (TSRB, 2019) limit states
Concrete and steel strain limits at the fibers of a cross section for
minimum damage limit (MD, implying Immediate Occupancy) are given as
(εcu)MD = 0.0025 ; (εs)MD = 0.0075
Concrete and steel strain limits at the fibers of a cross section for safety
limit (SL, limited damage, or controlled damage) are
(εcg)SL = 0.75 (εcg)CL ; (εs)SL = 0.75 (εs)CL
and for collapse limit (CL newly collapse prevention) they are specified as
(εcg)CL = 0.0035 + 0.04 √ωwe ≤ 0.018 ; (εs)CL = 0.4εsu
No explicit guidelines are provided for how these strains are
to be calculated. Section analysis?
12

13

The test specimen
14

15

16

•Numerical simulations of the test specimen were carried out with
ANSYS
•Two sets of models generated
3D model = 3464 elements and
6047 nodes
2D model = 1966 elements and
3728 nodes
17

Boundary conditions at the wall-table connection
Steel anchor bars were modeledwith tension only elements
Spring elements allocatedK=20000 N/mm
Filled with elastic mortar (unknownproperties)
18
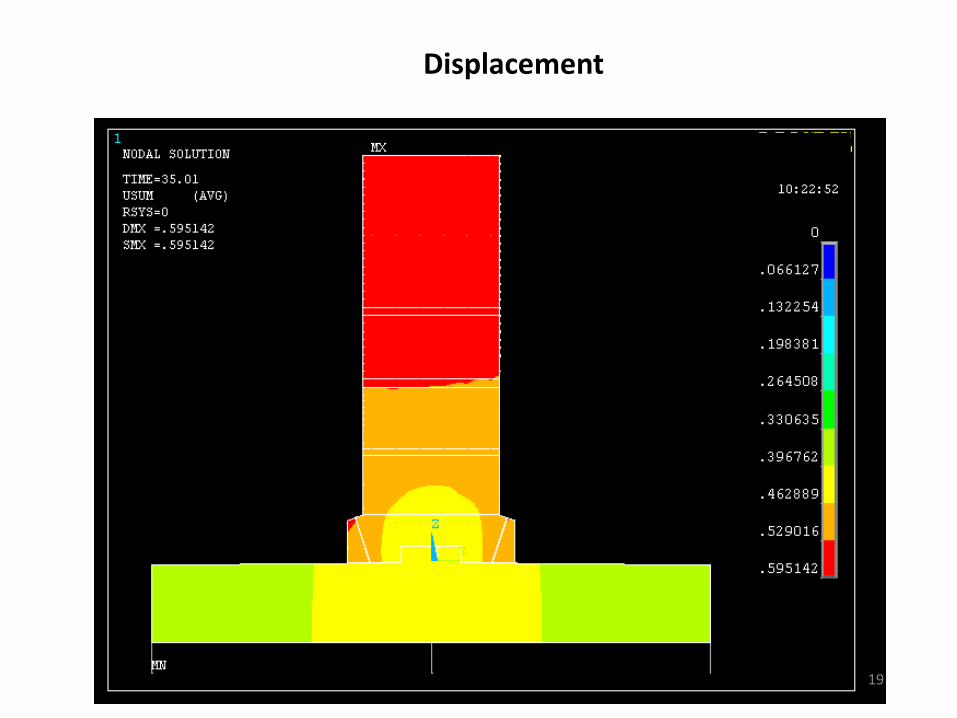
Displacement
19
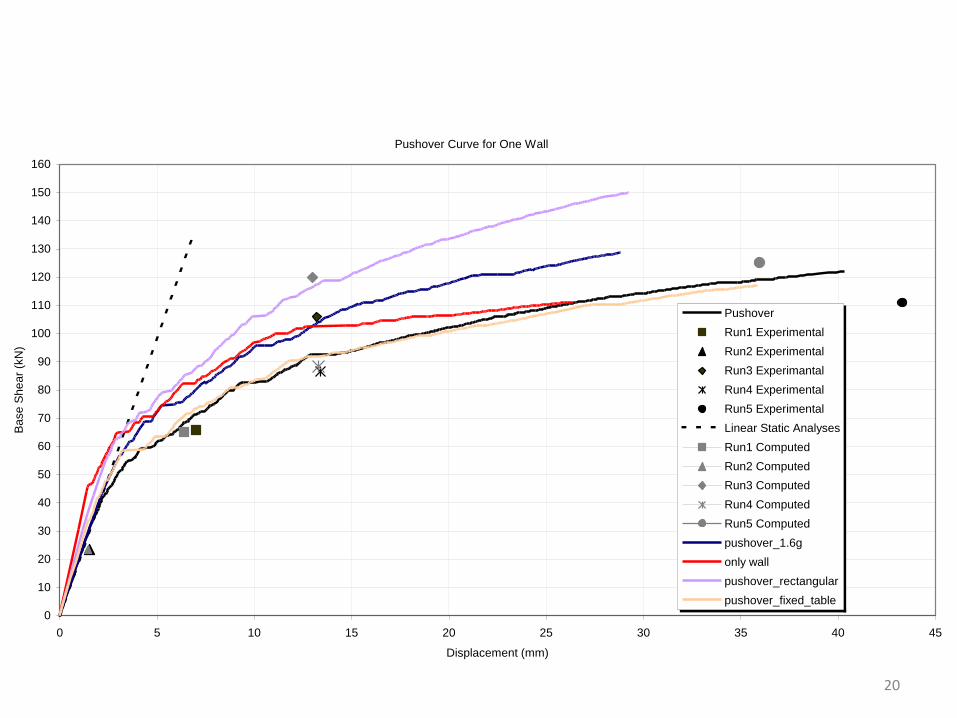
Pushover Curve for One Wall
0
10
20
30
40
50
60
70
80
90
100
110
120
130
140
150
160
0 5 10 15 20 25 30 35 40 45
Displacement (mm)
Ba
se
Sh
ea
r (k
N)
Pushover
Run1 Experimental
Run2 Experimental
Run3 Experimantal
Run4 Experimental
Run5 Experimental
Linear Static Analyses
Run1 Computed
Run2 Computed
Run3 Computed
Run4 Computed
Run5 Computed
pushover_1.6g
only wall
pushover_rectangular
pushover_fixed_table
20

-40
-30
-20
-10
0
10
20
30
40
50
0 5 10 15 20 25 30 35 40 45 50
Time (sec)
Dis
pla
ce
me
nt (m
m)
experiment
computed
Run1 Run2
Run3Run4
Run5
Satisfactory global results!!!
21

Top Horizontal Displacement _ Run4
-15
-10
-5
0
5
10
15
4 6 8 10 12 14 16Time (sec)
Dis
pla
ce
me
nt (m
m)
experiment
computed
Shear at Level1 _ Run4
-100
-75
-50
-25
0
25
50
75
100
4 6 8 10 12 14 16Time (sec)
Sh
ea
r F
orc
e(k
N)
experiment
computed
22

Crack pattern before Run 3
Crack pattern after Run 3
Yielding of reinforcement occurred at levels
2, 3 and 4. The trend was the same as the
experiments.
Local Results
Run3= Non-linearity initiated
23

24

25

26

27

PowerPoint Poisoning
28

Computational Tests Are Required
This would serve two purposes: (1) the range and number of parameters
would be increased, and (2) the power of our computational tools would be
assessed.
29

The parameters were
• Wall width (Lw): 3 m, 5 m and 8 m.
• Effective shear span (Lv): 5 m, 6 m, 9 m, 15 m, 24 m.
• Boundary element longitudinal reinforcement ratio (b): 0.5, 1, 2, 4%.
• Wall axial load ratio at the base (P/fc/Aw): 0.02, 0.05, 0.1, 0.15, 0.5.
• Horizontal web reinforcement ratio (sh): whatever design requires.
A parametric study was conducted.
Typical wall section:
30
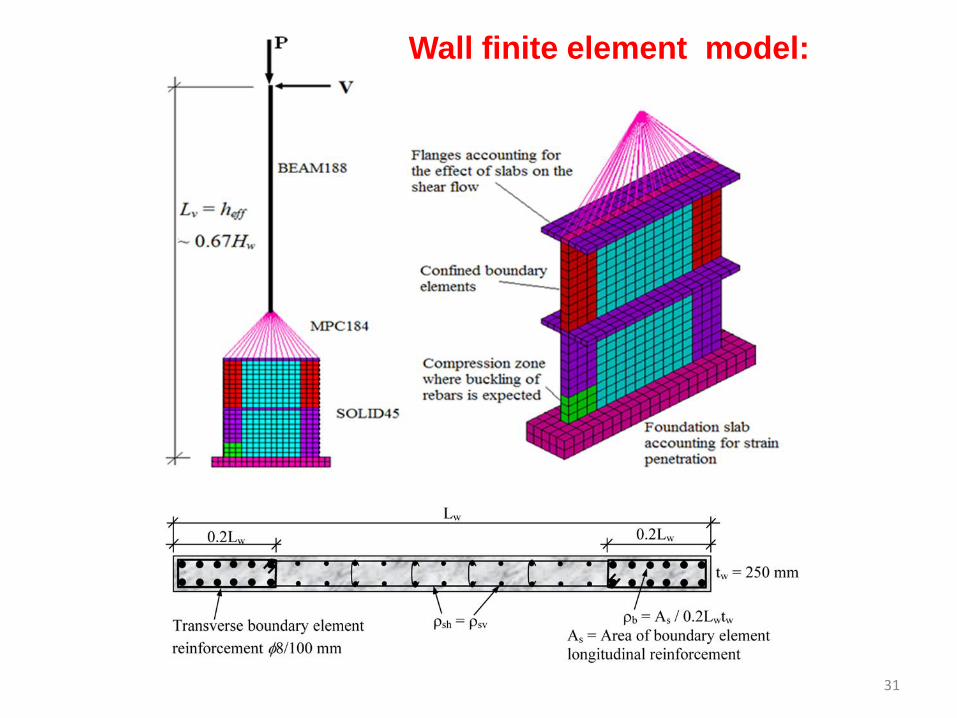
Wall finite element model:
31

Material models used in the FE model:
32

Results of one of several verification examples:
33

• Static monotonic loading was applied on wall models.
• As a general rule the overall deformation capacity under a realistic
ground motion could be expected to be over 75 percent of the
deformation capacity under monotonic loading conditions (Vallenas et
al., 1979).34

-0.02
-0.01
0
0.01
0.02
0.03
0.04
0.05
0 244 488 732 976 1220
Bir
im ş
ek
ild
eğ
işti
rme
Gövde yatay uzunluğu (mm)
Test %1 ötelenme oranı
Test %2 ötelenme oranı
SEM %1 ötelenme oranı
SEM %2 ötelenme oranı
Çekme kenarı
Kesit analizinden eşdeğer eğrilik için elde edilen birim şekildeğiştirme dağılımları
Basınç kenarıa)
-200
-150
-100
-50
0
50
100
150
200
-100 -75 -50 -25 0 25 50 75 100
Yan
al yü
k (
kN
)
Tepe noktası ötelemesi (mm)
Deneysel
ÇevrimselhesaplananMonotonikhesaplanan
Loading
-3
-2
-1
0
1
2
3
0Dri
ft (
%)
Total # of Cycles = 20
F
P
b)
Thomsen ve Wallace [31]
tarafından test edilen RW2 perde
elemanı için deneysel ve sonlu
eleman hesabı sonuçlarının
karşılaştırılması a) perde alt
noktasından itibaren 229 mm
yüksekliğinde bölge üzerinde
ölçülen ve hesaplanan birim şekil
değiştirme dağılımları, b) yük-
deformasyon eğrileri.
35

Determination of Performance limits:Performance levels-Damage states
Life Safety (LS) at ¾ of Dult
Collapse Prevention (CP) at Dult
Immediate Occupancy (IO)
at es = 0.01 or ec = 0.0035whichever occurs first
Drift ratio (%)
0 1 2 3 4 5
No
rma
lize
d S
hea
r
0.0
0.1
0.2
0.3
0.4
0.5Lw = 3m ; b = 0.01 ; M/V = 5m
P/Po = 0.02
P/Po = 0.05
P/Po = 0.10
P/Po = 0.15
P/Po = 0.25
36

Calculation of the Curvature, Plastic rotation and Strains
• The strain limits given in TSC-07 and in other documents (such as
Priestley et al., 2007) are compatible with the (iffy) section (moment-
curvature) analysis!
• But section-based analytical procedures may underestimate the actual
concrete compression strains.
• Instead of using strains from FE analysis, strains from section analysis
were used by matching the two different analyses results on the basis of
curvatures.37

Şekil 9. a) Plastik mafsal boyunun perde boyuna göre normalleştirilmiş değerlerinin beton
dayanımına göre normalleştirilmiş kesme gerilmelerine karşı gösterimi, b) (10) bağıntısı ile
tahmin edilen plastik mafsal boyunun gerçek değerlerle korelâsyonu
0.0 0.2 0.4 0.6 0.8 1.0 1.2 1.4 1.6
Lp /
Lw
0.0
0.1
0.2
0.3
0.4
0.5
0.6
0.7
Lw = 8 m
Lw = 5 m
Lw = 3 m
cww fLtVmax Lp (m) - SEM
0.0 0.5 1.0 1.5 2.0 2.5 3.0 3.5
Lp (
m)
- B
ağ
ıntı
(1
0)
0.0
0.5
1.0
1.5
2.0
2.5
3.0
3.5
R2 = 0.94
a) b)
(a) Plastic hinge length normalized with respect to wall width (b) Plastic hinge
length as predicted by FEM and the expression
38

Şekil 10. Perde modelleri için Kesit Hesabı(KH) ve Sonlu Eleman Metodu (SEM)
kullanılarak hesaplanan perde taban kesiti eğrilik kapasitelerinin karşılaştırılması
0.0 0.2 0.4 0.6 0.8 1.0 1.2 1.4 1.6
KA /
S
EM
0.0
0.5
1.0
1.5
2.0
2.5
3.0
Lw = 3 m
Lw = 5 m
Lw = 8 m
cww fLtVmax
Ratio of ultimate curvature capacities obtained from section ΦKA and finite element
analysis ΦFEM
39

Şekil 13. İki farklı yöntem kullanılarak perde uç bölgelerinde elde edilen beton birim
kısalması (ec) karşılaştırması
0.0 0.2 0.4 0.6 0.8 1.0 1.2 1.4 1.6 1.8
c
0.000
0.002
0.004
0.006
0.008
0.010
MN
0.000 0.002 0.004 0.006 0.008 0.010
(c) S
EM
0.000
0.002
0.004
0.006
0.008
0.010
MN
0.0 0.2 0.4 0.6 0.8 1.0 1.2 1.4 1.6 1.8
c
0.00
0.01
0.02
0.03
0.04(
c)KA
(c)SEM
DBYBHY-07
GV
0.00 0.01 0.02 0.03 0.04
(c) S
EM
0.00
0.01
0.02
0.03
0.04
GV
0.0 0.2 0.4 0.6 0.8 1.0 1.2 1.4 1.6 1.8
c
0.00
0.02
0.04
0.06
0.08
GÇ
cw fAVmax(
c)KA
0.00 0.01 0.02 0.03 0.04 0.05 0.06 0.07
(c) S
EM
0.00
0.01
0.02
0.03
0.04
0.05
0.06
0.07
GÇ
(c)SEM
=2.11(c)KA
(c)SEM
=1.78(c)KA
(c)s
SEM =1.63(
c)KA
Comparison of extreme fiber compressive strains in the concrete and damage
states from section and finite element analysis
40

Şekil 14. İki farklı yöntem kullanılarak perde uç bölgelerinde elde edilen çelik birim
uzaması (et) karşılaştırması
0.0 0.2 0.4 0.6 0.8 1.0 1.2 1.4 1.6 1.8
t
0.000
0.005
0.010
0.015
0.020
0.025
0.030
(c)KA
(c)SEM
DBYBHY-07
MN
0.000 0.005 0.010 0.015 0.020 0.025
(t)
SE
M
0.000
0.005
0.010
0.015
0.020
0.025
MN
0.0 0.2 0.4 0.6 0.8 1.0 1.2 1.4 1.6 1.8
t
0.00
0.02
0.04
0.06
0.08
0.10
GV
0.00 0.02 0.04 0.06 0.08
(t)
SE
M
0.00
0.02
0.04
0.06
0.08
GV
0.0 0.2 0.4 0.6 0.8 1.0 1.2 1.4 1.6 1.8
t
0.00
0.02
0.04
0.06
0.08
0.10
0.12
GÇ
cw fAVmax(
t)KA
0.00 0.02 0.04 0.06 0.08 0.10 0.12
(t)
SE
M
0.00
0.02
0.04
0.06
0.08
0.10
0.12
GÇ
Comparison of extreme fiber tensile strains in the steel and damage states from
section and finite element analysis
41

0.0 0.2 0.4 0.6 0.8 1.0 1.2 1.4 1.6
SE
C /
S
IM
0.0
0.5
1.0
1.5
2.0
2.5
3.0
3.5
Lw = 3 m
Lw = 5 m
Lw = 8 m
cww fLtVmax
Curvature- (1/m)
0.000 0.005 0.010 0.015 0.020 0.025 0.030
M (
kN
-m)
0
10000
20000
30000
40000
FEM Analysis
Section Analysis(SEC)
Comparison of typical moment-curvature relationships obtained from section
and finite element analysis
Ratio of ultimate curvature capacities obtained from section (SEC) and finite element
analysis (SIM)
42

Comparison of extreme fiber compression strains at global yield and
ultimate limit states for section and finite element analyses.
0.0 0.2 0.4 0.6 0.8 1.0 1.2 1.4 1.6 1.8
c
0.000
0.001
0.002
0.003
0.004
(c)SEC
(c)FEM
a) Global Yield
0.000 0.001 0.002 0.003 0.004
(c) F
EM
0.000
0.001
0.002
0.003
0.004
0.0 0.2 0.4 0.6 0.8 1.0 1.2 1.4 1.6 1.8
c
0.00
0.02
0.04
0.06
0.08
(c)SEC
(c)FEM
b) Ultimate
cw fAVmax (c)SEC
0.00 0.02 0.04 0.06 0.08
(c) F
EM
0.00
0.02
0.04
0.06
0.08
(c)FEM
=2.11(c)SEC
(c)FEM
=1.56(c)SEC
43

0.0 0.2 0.4 0.6 0.8 1.0 1.2 1.4 1.6 1.8
t
0.000
0.002
0.004
0.006
0.008
(t)SEC
(t)FEM
a) Global Yield
0.000 0.002 0.004 0.006 0.008
(t)
FE
M
0.000
0.002
0.004
0.006
0.008
0.0 0.2 0.4 0.6 0.8 1.0 1.2 1.4 1.6 1.8
t
0.00
0.02
0.04
0.06
0.08
0.10
0.12
(t)SEC
(t)FEM
b) Ultimate
cw fAVmax (t)SEC
0.00 0.02 0.04 0.06 0.08 0.10 0.12
(t)
FE
M
0.00
0.02
0.04
0.06
0.08
0.10
0.12
Comparison of extreme fiber steel tensile strains at global yield and
ultimate limit states for section and finite element analyses.
44
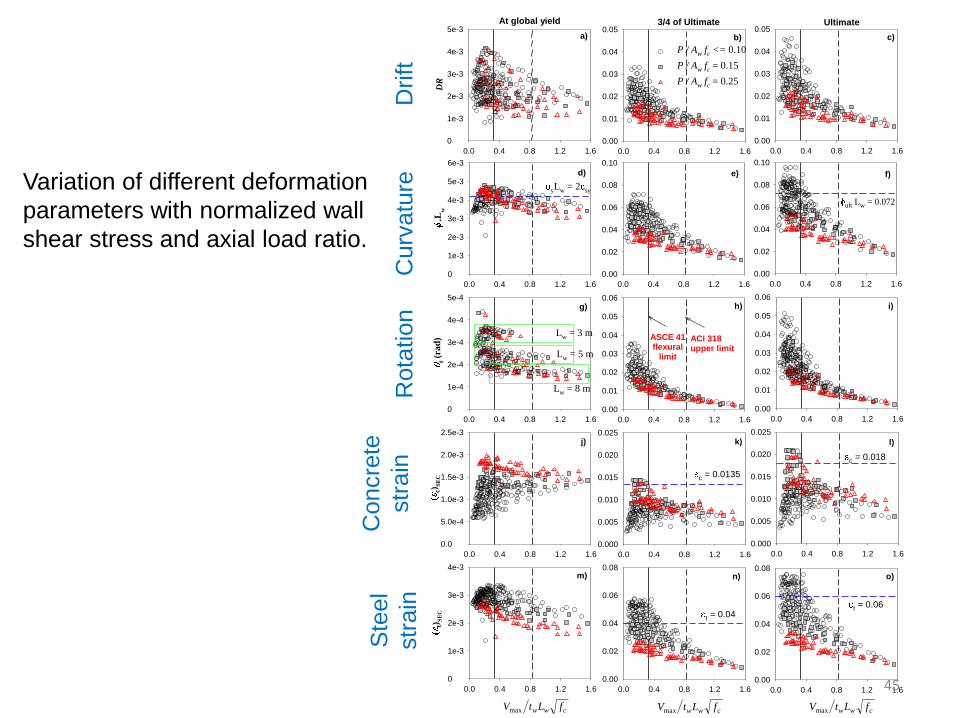
Variation of different deformation
parameters with normalized wall
shear stress and axial load ratio.
0.0 0.4 0.8 1.2 1.6
DR
0
1e-3
2e-3
3e-3
4e-3
5e-3
0.0 0.4 0.8 1.2 1.6
.L
w
0
1e-3
2e-3
3e-3
4e-3
5e-3
6e-3
0.0 0.4 0.8 1.2 1.6
t (r
ad
)
0
1e-4
2e-4
3e-4
4e-4
5e-4
0.0 0.4 0.8 1.2 1.6
0.00
0.01
0.02
0.03
0.04
0.05
P / Aw fc <= 0.10
P / Aw fc = 0.15
P / Aw fc = 0.25
0.0 0.4 0.8 1.2 1.6
0.00
0.02
0.04
0.06
0.08
0.10
0.0 0.4 0.8 1.2 1.6
0.00
0.01
0.02
0.03
0.04
0.05
0.06
0.0 0.4 0.8 1.2 1.6
0.00
0.01
0.02
0.03
0.04
0.05
0.0 0.4 0.8 1.2 1.6
0.00
0.02
0.04
0.06
0.08
0.10
0.0 0.4 0.8 1.2 1.6
0.00
0.01
0.02
0.03
0.04
0.05
0.06
At global yield 3/4 of Ultimate Ultimate
0.0 0.4 0.8 1.2 1.6
c)S
EC
0.0
5.0e-4
1.0e-3
1.5e-3
2.0e-3
2.5e-3
0.0 0.4 0.8 1.2 1.6
0.000
0.005
0.010
0.015
0.020
0.025
0.0 0.4 0.8 1.2 1.6
0.000
0.005
0.010
0.015
0.020
0.025
0.0 0.4 0.8 1.2 1.6
t)S
EC
0
1e-3
2e-3
3e-3
4e-3
cww fLtVmax
0.0 0.4 0.8 1.2 1.6
0.00
0.02
0.04
0.06
0.08
cww fLtVmax
0.0 0.4 0.8 1.2 1.6
0.00
0.02
0.04
0.06
0.08
cww fLtVmax
a) b) c)
d) e) f)
g) i)h)
j) l)k)
m) o)n)
ASCE 41flexural
limit
ACI 318upper limit
c = 0.0135
c = 0.018
t = 0.04t = 0.06
yL
w = 2
sy
ult Lw = 0.072
Lw = 3 m
Lw = 5 m
Lw = 8 m
Drift
Rota
tion
Concre
te
str
ain
Curv
atu
reS
teel
str
ain
45

Comparison of calculated plastic rotation limits at specific performance levels with
the limits available in ASCE/SEI 41.
(p)
SIM (rad)
0 2e-3 4e-3 6e-3 8e-3 1e-2
(p) A
SC
E 4
1 ( r
ad
)
0
2e-3
4e-3
6e-3
8e-3
1e-2
(p)
SIM (rad)
0.00 0.01 0.02 0.03 0.04 0.05
0.00
0.01
0.02
0.03
0.04
0.05P / Aw fc <= 0.10
P / Aw fc = 0.15
P / Aw fc = 0.25
(p)
SIM (rad)
0.00 0.01 0.02 0.03 0.04 0.05
0.00
0.01
0.02
0.03
0.04
0.05Immediate Occupancy Life Safety Collapse Prevention
a) b) c)
46

Comparison of calculated plastic rotation limits at specific performance levels with
the plastic chord rotation limits in EC8.
(y)
SIM (rad)
0 2e-3 4e-3 6e-3 8e-3 1e-2
(y)
EC
S ( r
ad
)
0
2e-3
4e-3
6e-3
8e-3
1e-2
(p)
SIM (rad)
0.00 0.01 0.02 0.03 0.04 0.05
(p) E
CS ( r
ad
)
0.00
0.01
0.02
0.03
0.04
0.05P / Aw fc <= 0.10
P / Aw fc = 0.15
P / Aw fc = 0.25
(p)
SIM (rad)
0.00 0.01 0.02 0.03 0.04 0.05
a) b) c)
For damage limitation
EC8 uses yield rotation
Damage Limitation Significant Damage Near Collapse
M/V/Lw > 3.5
47

Comparison of calculated plastic rotation limits at specific performance levels with
the limits available in TSC-07.
(p)
SIM (rad)
0 2e-3 4e-3 6e-3 8e-3 1e-2
(p) T
SC
( r
ad
)
0
2e-3
4e-3
6e-3
8e-3
1e-2
(p)
SIM (rad)
0.00 0.01 0.02 0.03 0.04 0.05
0.00
0.01
0.02
0.03
0.04
0.05
P / Aw fc <= 0.10
P / Aw fc = 0.15
P / Aw fc = 0.25
(p)
SIM (rad)
0.00 0.01 0.02 0.03 0.04 0.05
0.00
0.01
0.02
0.03
0.04
0.05a) c)b)
Minimum Damage Safety Limit Collapse Limit
Plastic hinge length was taken as Lp=0.5Lw
48

Lower bound plastic rotation limits at different performance levels
49

The proposed plastic rotation limits for shear wall members controlled by flexure
(underlined values are ASCE/SEI 41 limits)
IO LS CP P
/Po ≤
0.1
0
< 0.33
= 0.33
0.005 - 0.0106
0.0015 / 0.005§
0.018 - 0.02420.01 / 0.01
0.025 - 0.03030.015 / 0.015
0.33 < < 0.50 0.0015 0.0139 - 0.0118 0.0247 - 0.0294
> 0.50
= 0.50
0.0015
0.0015 / 0.004 0.012 - 0.0080.008 / 0.008
0.015 - 0.010.01 / 0.01
P/P
o =
0.1
5
< 0.33
= 0.33
0.005 - 0.00450.0025 / 0.0043
0.018 - 0.02730.009 / 0.0087
0.025 - 0.03940.012 / 0.013
0.33 < < 0.50 0.0035 - 0.0029 0.0148 - 0.0176 0.016 - 0.012
> 0.50
= 0.50
0.0025 - 0.0010.002 / 0.0032
0.0085 - 0.005(0.006 / 0.0063
0.016 - 0.0120.01 / 0.0083
P/P
o ≥
0.2
5
< 0.33
= 0.33
0.004 - 0.00450.0025 / 0.003
0.015 - 0.02420.007 / 0.006
0.02 - 0.03330.009 / 0.009
0.33 < < 0.50 0.0035 - 0.0029 0.0118 - 0.0109 0.012 - 0.009
> 0.50
= 0.50
0.0025 - 0.0010.002 / 0.0015
0.007 – 0.0040.005 / 0.003
0.012 – 0.0090.0075 / 0.005
1.75
(1.90 1.47 / )
(0.031 0.053 / ). / 0.10
(0.031 0.053 / ). / 0.10o
o o
p P P
o o
P P e if P P
P P e if P P
§(This study / ASCE/SEI 41)
50
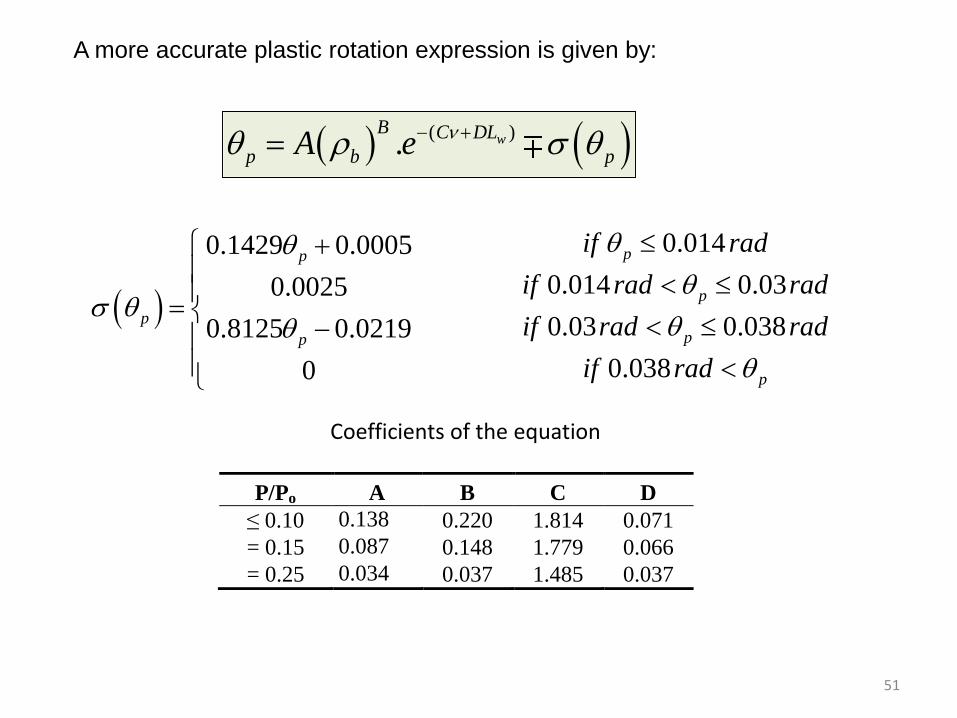
( ). w
B C DL
p b pA e
0.014 0.1429 0.0005
0.014 0.03 0.0025
0.03 0.038 0.8125 0.0219
0.038 0
pp
p
p
pp
p
if rad
if rad rad
if rad rad
if rad
P/Po A B C D
≤ 0.10 0.138 0.220 1.814 0.071
= 0.15 0.087 0.148 1.779 0.066
= 0.25 0.034 0.037 1.485 0.037
A more accurate plastic rotation expression is given by:
Coefficients of the equation
51
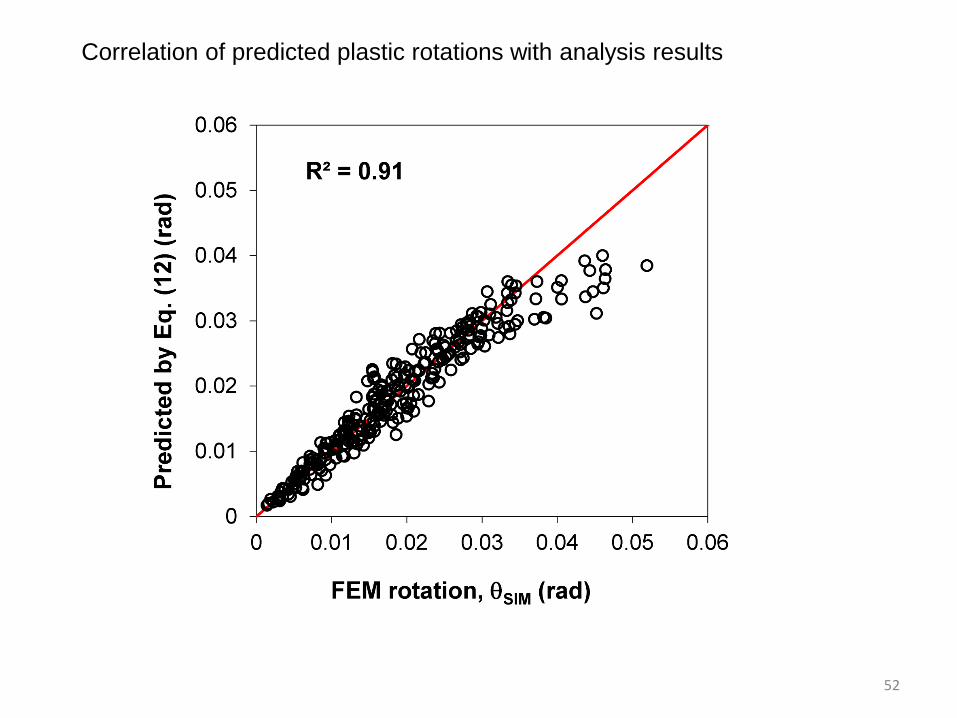
Correlation of predicted plastic rotations with analysis results
52

(ec)GVmaks = 0.010 – 0.005 (17)
(ec)GÇmaks = 0.0135 – 0.006 (18)
Şekil 16. Güvenlik ve göçme sınır durumları için davranışı beton basınç birim kısalması
tarafından kontrol edilen iyi sargılanmış perde elemanları birim kısalma kapasiteleri
0.000
0.005
0.010
0.015
0.020
0.025
0.0 0.2 0.4 0.6 0.8 1.0 1.2 1.4 1.6 1.8
Be
ton
bri
m k
ısa
lma
sı
=
GV
GÇ
(ec)GÇ = 0.018
cw fAVmax
(ec)GV = 0.010 - 0.005
(ec)GÇ = 0.0135 - 0.006
(ec)GÇ = 0.0135
Limiting concrete compressive strains for code-conforming walls for Life Safety
(GV) and Collapse Prevention (GC) limit states
53

Conclusions
• Accuracy in predicting local strains or curvatures is very difficult to
achieve. Global parameters vary less rapidly.
• Among the documents evaluated, ASCE/SEI 41 limits were observed to be
the most accurate ones yielding conservative results at all levels except
the low axial load levels.
• Neither EC8-3 nor TSR-07 (or -19?) specify consistent deformation limits.
TSC-07 suggests un-conservative limits at all performance levels, and it
appears to fall short of capturing the variation reflected in the calculated
values.
54

Conclusions (Cont.)
• Likewise EC8-3 seems to fall short of representing the variation in plastic
rotation in contrast to several parameters employed in the calculation. The
estimations are un-conservative at damage limitation. Although conservative
estimations are obtained at life safety and collapse prevention levels, the
values are not logical.
• Calibration of local or global response parameters against different ground
motion levels proved to be difficult.
• Expressions for plastic rotations that expand and improve ASCE/SEI 41 limit
states are proposed. These expressions are adjusted to err on the safe side,
and represent an improvement over existing provisions.
55

Kazaz, I., Gülkan, P. and Yakut, A. (2012): «Performance limits for structural walls: An analytical perspective,» Engineering Structures, 43: 105–119 .
Kazaz, I., Gülkan, P. and Yakut, A. (2012): «Deformation Limits for Structural Wallswith Confined Boundaries,» Earthquake Spectra, 28(3), pp. 1019–1046.
56