performance measurement framework for engineering supply chain
TRANSCRIPT

Master’s thesis
Business Information Systems (MBA)
2014
Kyung-Yeol Chun
PERFORMANCE MEASUREMENT FRAMEWORK
FOR ENGINEERING SUPPLY CHAIN
MASTER´S THESIS | ABSTRACT TURKU UNIVERSITY OF APPLIED SCIENCES
Business Information Systems (MBA)
2014| 86
Seppo Sirkemaa, Emmanuel Querrec
PERFORMANCE MEASUREMENT FRAMEWORK FOR ENGINEERING SUPPLY CHAIN
One of the primary concern on the supply chain management (SCM) is the performance measurement because it is evident that there cannot be managed where there cannot be measured in supply chain performance. Supply chain performance measurement (SCPM) has taken a great role for set-up the concrete strategy and a driving force for improvement in organizational productivity. Accordingly, it is vital to establish the right performance measures and measurement system to set up strategic objectives, to evaluate the organizational performance, and to manage the future of business goal and activities effectively.
The main objective of this case study research is to define the most effective performance metrics and to develop the corresponding framework with its criteria to improve the efficiency of engineering supply chain performance. Moreover, the performance measurement framework has been targeted to support the managerial decision-making systematically and dynamically by providing a management dashboard including feedbacks and KPIs.
The research questions are generated to identify the problems, and the objectives of research works are defined as following three tasks. First, what measures can represent the performance effectively? Second, how can the performance are measured systematically? Third, how can the measured performance be analyzed and utilized to provide with a managerial decision-making tool?
As the result of the research, performance module concept based on BSC (Balanced Score Card) with implementation of AHP (Analytic Hierarchy Process) methodology has been developed to meet the research objectives. The framework of BSC+AHP has been proposed, and it can contribute on the performance measurement and its effective measures and metrics for engineering supply chain, where the multi-dimensional performance measures are transformed into the representing BSC+AHP modules for a dedicated performance evaluation.
This SCPM (Supply chain performance measurement) framework proposes the measures and metrics for the engineering supply chain performance. However, this measurement framework also could be utilized in different industrial areas of business by customizing the BSC+AHP modules and its metrics in accordance with the business characteristics.
KEYWORDS:
Supply chain performance measurement; Performance measures and metrics; Analytic Hierar-chy Process (AHP); BSC+AHP Performance measurement framework;
CONTENTS
FIGURES 5
LIST OF ABBREVIATIONS (OR) SYMBOLS 6
1 INTRODUCTION 7
1.1 Background of Research 8
1.2 Goal and Specific Objectives of Research 9
1.3 Research Tasks 9
1.4 Thesis structure and research methods 11
2 LITERATURE REVIEW 13
2.1 Supply Chain Performance Measurement (SCPM) 14
2.2 Measures and Metrics of Supply Chain Performances 16
2.3 Supply Chain Performance Measurement System Approach 22
2.3.1 Supply Chain Performance Metrics Framework 24
2.3.2 Supply Chain Balanced Score Card (BSC) Framework 26
2.3.3 Supply Chain Operations reference (SCOR) Model Framework 29
2.3.4 SCOR – BSC Framework 33
2.3.5 Process-based Performance Measurement Approach 35
2.4 Challenges for Supply Chain Performance Measurement 38
2.5 Conclusion of Literature Review in view of Engineering SCPM 41
3 DEVELOPMENT OF PERFORMANCE MEASUREMENT FRAMEWORK FOR ENGINEERING SUPPLY CHAIN 46
3.1 Establishment of key metrics for SC Performance measurement 47
3.1.1 Metrics for order planning performance evaluation 47
3.1.2 Metrics for managerial performance evaluation 48
3.1.3 Metrics for production performance evaluation 50
3.1.4 Metrics for progress performance evaluation 51
3.1.5 Metrics of delivery performance evaluation 52
3.1.6 Metrics for quality service evaluation 53
3.2 Hierarchical structure of metrics for performance measurement criteria 54
3.3 Constructing AHP structure for performance measurement 56
3.3.1 Selection of key performance criteria and sub-criteria 56

3.3.2 Prioritization of performance criteria and performance metrics 57
3.3.3 Multi-criteria analysis with an AHP approach 57
3.3.3.1 Key performance criteria priority weights and ratings 58
3.3.3.2 Tactical Operation matrix priority weights and ratings (sub-criteria) 60
3.3.3.3 Order Progress matrix priority weights and ratings (sub-criteria) 62
3.3.3.4 Service Quality matrix priority weights and ratings (sub-criteria) 64
3.3.3.5 Composite priorities of key performance criteria and sub-criteria 66
3.4 Integrated Performance measurement with BSC+AHP approach 66
3.5 Transformation of SC performance measures into BSC+AHP Modules 68
3.5.1 Formulation of Tactical Operation- [BSC-SCPM-TO Module: “A”] 69
3.5.2 Formulation of Order Process- [BSC-SCPM-OP Module: “B”] 69
3.5.3 Formulation of Service Quality- [BSC-SCPM-SQ Module: “C”] 70
3.6 Development of integrated BSC+AHP Modules 70
3.6.1 Balanced Scorecard-Tactical Operation- [BSC-SCPM-TO Module “A”] 71
3.6.2 Balanced scorecard-Order Progress-[BSC-SCPM-OP Module “B”] 72
3.6.3 Balanced scorecard-Service Quality- [BSC-SCPM-SQ Module “C”] 73
3.6.4 Supply Chain Performance Management Dashboard 74
3.7 Framework of SC Performance Measurement for the case Company 75
4 CONCLUSION AND DISCUSSION 77
4.1 Research Conclusion 77
4.2 Future Research 80
REFERENCES 82
FIGURES
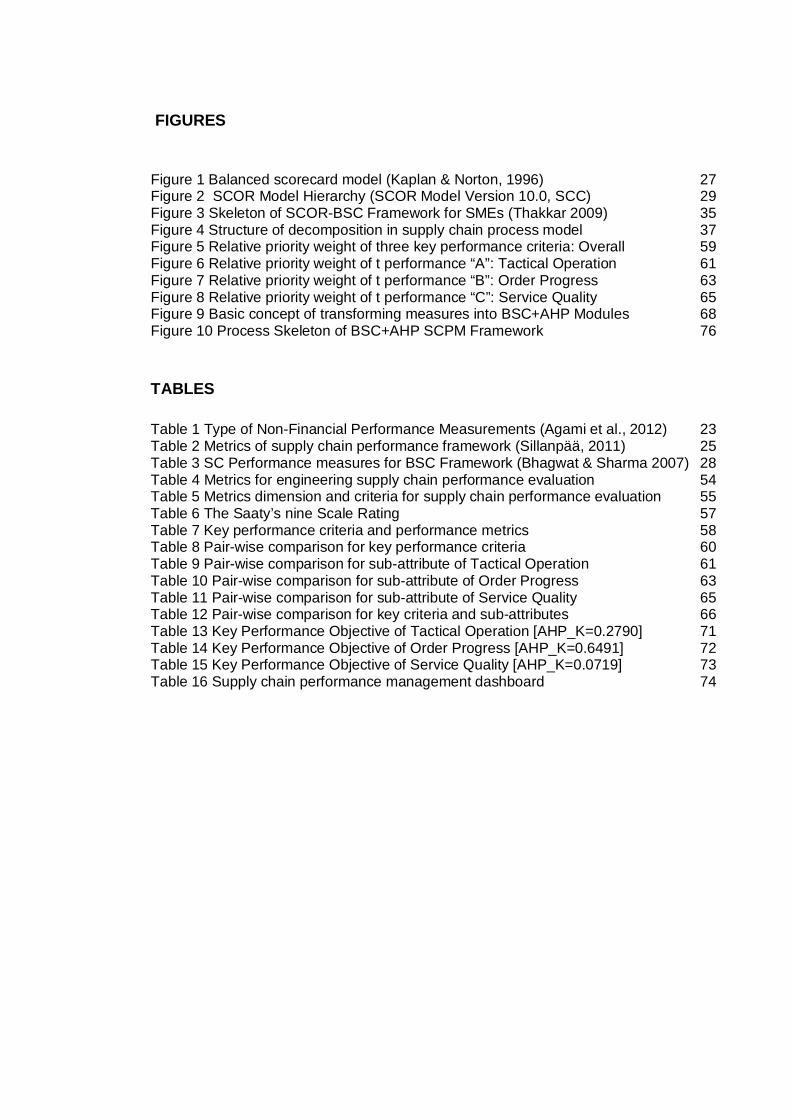
Figure 1 Balanced scorecard model (Kaplan & Norton, 1996) 27 Figure 2 SCOR Model Hierarchy (SCOR Model Version 10.0, SCC) 29 Figure 3 Skeleton of SCOR-BSC Framework for SMEs (Thakkar 2009) 35 Figure 4 Structure of decomposition in supply chain process model 37 Figure 5 Relative priority weight of three key performance criteria: Overall 59 Figure 6 Relative priority weight of t performance “A”: Tactical Operation 61 Figure 7 Relative priority weight of t performance “B”: Order Progress 63 Figure 8 Relative priority weight of t performance “C”: Service Quality 65 Figure 9 Basic concept of transforming measures into BSC+AHP Modules 68 Figure 10 Process Skeleton of BSC+AHP SCPM Framework 76
TABLES
Table 1 Type of Non-Financial Performance Measurements (Agami et al., 2012) 23 Table 2 Metrics of supply chain performance framework (Sillanpää, 2011) 25 Table 3 SC Performance measures for BSC Framework (Bhagwat & Sharma 2007) 28 Table 4 Metrics for engineering supply chain performance evaluation 54 Table 5 Metrics dimension and criteria for supply chain performance evaluation 55 Table 6 The Saaty’s nine Scale Rating 57 Table 7 Key performance criteria and performance metrics 58 Table 8 Pair-wise comparison for key performance criteria 60 Table 9 Pair-wise comparison for sub-attribute of Tactical Operation 61 Table 10 Pair-wise comparison for sub-attribute of Order Progress 63 Table 11 Pair-wise comparison for sub-attribute of Service Quality 65 Table 12 Pair-wise comparison for key criteria and sub-attributes 66 Table 13 Key Performance Objective of Tactical Operation [AHP_K=0.2790] 71 Table 14 Key Performance Objective of Order Progress [AHP_K=0.6491] 72 Table 15 Key Performance Objective of Service Quality [AHP_K=0.0719] 73 Table 16 Supply chain performance management dashboard 74
LIST OF ABBREVIATIONS (OR) SYMBOLS
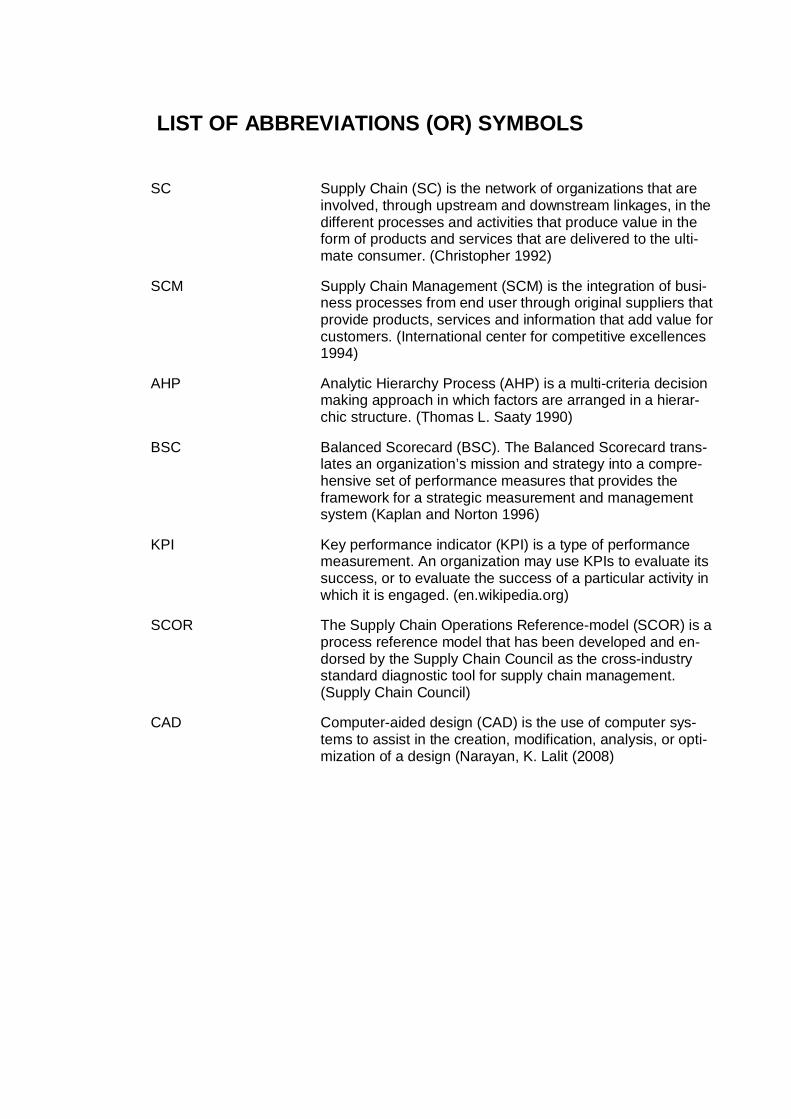
SC Supply Chain (SC) is the network of organizations that are involved, through upstream and downstream linkages, in the different processes and activities that produce value in the form of products and services that are delivered to the ulti-mate consumer. (Christopher 1992)
SCM Supply Chain Management (SCM) is the integration of busi-ness processes from end user through original suppliers that provide products, services and information that add value for customers. (International center for competitive excellences 1994)
AHP Analytic Hierarchy Process (AHP) is a multi-criteria decision making approach in which factors are arranged in a hierar-chic structure. (Thomas L. Saaty 1990)
BSC Balanced Scorecard (BSC). The Balanced Scorecard trans-lates an organization’s mission and strategy into a compre-hensive set of performance measures that provides the framework for a strategic measurement and management system (Kaplan and Norton 1996)
KPI Key performance indicator (KPI) is a type of performance measurement. An organization may use KPIs to evaluate its success, or to evaluate the success of a particular activity in which it is engaged. (en.wikipedia.org)
SCOR The Supply Chain Operations Reference-model (SCOR) is a process reference model that has been developed and en-dorsed by the Supply Chain Council as the cross-industry standard diagnostic tool for supply chain management. (Supply Chain Council)
CAD Computer-aided design (CAD) is the use of computer sys-tems to assist in the creation, modification, analysis, or opti-mization of a design (Narayan, K. Lalit (2008)
7
TURKU UNIVERSITY OF APPLIED SCIENCES THESIS | Kyung-Yeol Chun
1 INTRODUCTION
STX Finland Oy is one of the well-known international shipbuilding companies,
which has built the most sophisticated and biggest cruise ship of “Oasis of the
Seas” in 2010. And the company is a leading ship designer and shipbuilder of
the most innovative cruise ships and specialized vessels worldwide with the
shipbuilding history of 300 years. The employees in STX Finland Oy are varying
from 2500 to 5000 in accordance with the project workloads. Moreover, the total
number of working personnel in shipyard reached up to 8000 workers including
subcontractors at the peak time. The business characteristics of company are
collaborating with the great amount of supply chain networks globally. In other
words, supply chain management has the great importance for the case com-
pany of STX Finland.
The specialty of Finnish Shipbuilding industry has created many great products
during the long history, and it proves the innovativeness and creativeness in
design, sophisticated production management, and the qualified skillful person-
nel. However, the recent global economy recession and the competing market
situations are requesting more competitiveness in productivity together with the
higher performance of supply chains to maintain the sustainable business.
Due to the business characteristics and the nature of production processes of
the cruise shipbuilding, the functions and the roles of supply chain networks are
significant, and, therefore, their performances are substantial on the productivi-
ty, delivery, profitability and competitiveness of the case company.
This case study research has been initiated as a part of the shipyard’s cost sav-
ing initiatives through the improvement of supply chain performance measure-
ment and management. The research objective is identified as the performance
measurement and management criteria of the engineering supply chain. More-
over, the final target of this research aimed at the development of a measure-
ment framework as the managerial decision-making tool for the case Company.
8
TURKU UNIVERSITY OF APPLIED SCIENCES THESIS | Kyung-Yeol Chun
1.1 Background of Research
The case company measures the performance of the engineering supply chain
with the progress of CAD modellings in percentage, delivery accuracy in num-
ber of drawings, and customer satisfaction level by 10 grades on a monthly ba-
sis. However, it is understood that these measures do not provide with the holis-
tic view of supply chain performance. Moreover, the progress monitoring cannot
ensure the delivery reliability as well as the quality of the engineering products.
The performance of the engineering supply chains that are participated in the
project, are measured and managed by the design coordinators who are work-
ing for the organization. It is also noted that there do not exist the common pri-
ority and the common criteria of decision making among performance
measures. So, various decision priority and criteria on performance measures
are implemented by the individual design coordinators as per their expertise
and experiences. For example, delivery performance is considered as the most
important measures for a certain managers, while the quality of engineering
process is considered as a dominant measure for other design coordinators.
In shipbuilding production processes, the measures and its criteria of engineer-
ing supply chain performance have multi-dimensional characteristics, and the
decision-making is very complicated due to the performance measures are in-
terrelated and affected each other.
The common perception on the priority and criteria of performance measures,
and the enhancement of sharing the information have been the continuous chal-
lenging topic for the engineering supply chains for the case company.
In this case study, the research approaches to the implementation of multi-
dimensional criteria of the performance measures into the Analytic Hierarchy
Process (AHP) methodology together with the BSC module concept in order to
transform the characteristics and to represent the performance of the supply
chain.

9
TURKU UNIVERSITY OF APPLIED SCIENCES THESIS | Kyung-Yeol Chun
1.2 Goal and Specific Objectives of Research
The goal of this case study research is to improve the performance manage-
ment of engineering supply chain for the case company. The specific research
objectives are set up to identify the performance measures and metrics, and
then developing a performance measurement framework. The framework is uti-
lized to evaluate the performance of the supply chains, and to provide with the
managerial decision-making tool for the case Company. Also, it has been con-
sidered to implement the framework for all levels including the responsible
managers or design coordinators in operating level as well as the top managers
in higher management level.
The relevant literatures are reviewed to investigate the performance metrics and
measures that are suitable to represent the performance characteristics of en-
gineering supply chains. And then, the metrics are categorized into the key cri-
teria and sub-criteria for evaluation of performances with the influencing priori-
ties.
To realize these objectives, suitable identification and establishment of perfor-
mance criteria, measures, metrics together with the measurement methodology,
and the frameworks for performance evaluation, are needed to be developed.
1.3 Research Tasks
This case study research is aiming at understanding complex phenomena of the
engineering supply chain performance and its measurement. In order for under-
standing the engineering performance measurement, it is essential to study the
engineering processes in their genuine context.
It is not often clear on interrelationship between the phenomena and context in
engineering supply chain performance and that makes the research tasks more
complicated in development of performance framework.
10
TURKU UNIVERSITY OF APPLIED SCIENCES THESIS | Kyung-Yeol Chun
For carrying out this research work, the case study approach is utilized for im-
plementation of the research processes and methodologies.
According to Ghauri and Gronhaug (2004), a case study is suitable if the re-
search topic is focusing on the current phenomena in a real-life context and the
questions of “How” or “Why” are to be answered to the topics.
Following research question has been raised as the main issue and it has been
the driving force for further improvement on the performance measurement of
the case Company;
How to measure the progress of engineering supply chain performance?
In order to answer to the research question, the following three (3) research
tasks are settled up:
Task1. What measures and metrics can represent the progressive performance
of the engineering supply chain effectively?
Task2. How can the selected performance metrics be measured from the engi-
neering supply chain effectively?
Task3. How can the measured performance metrics be analyzed and utilized to
provide as managerial decision-making tool?
In order to carry out these research tasks, the literature reviews on the supply
chain performance measurement metrics and frameworks provides with the
benchmarking on suitable models to develop a performance measures and
measurement framework for the case company. The study also focuses on how
the performance of engineering supply chain needs to be measured and how
the performance of engineering supply chain can be evaluated and managed.
In addition to above, the final goal is planned to provide with the managerial
decision-making KPIs and its dashboard to increase the efficiency of the supply
chain performance measurement and management.
11
TURKU UNIVERSITY OF APPLIED SCIENCES THESIS | Kyung-Yeol Chun
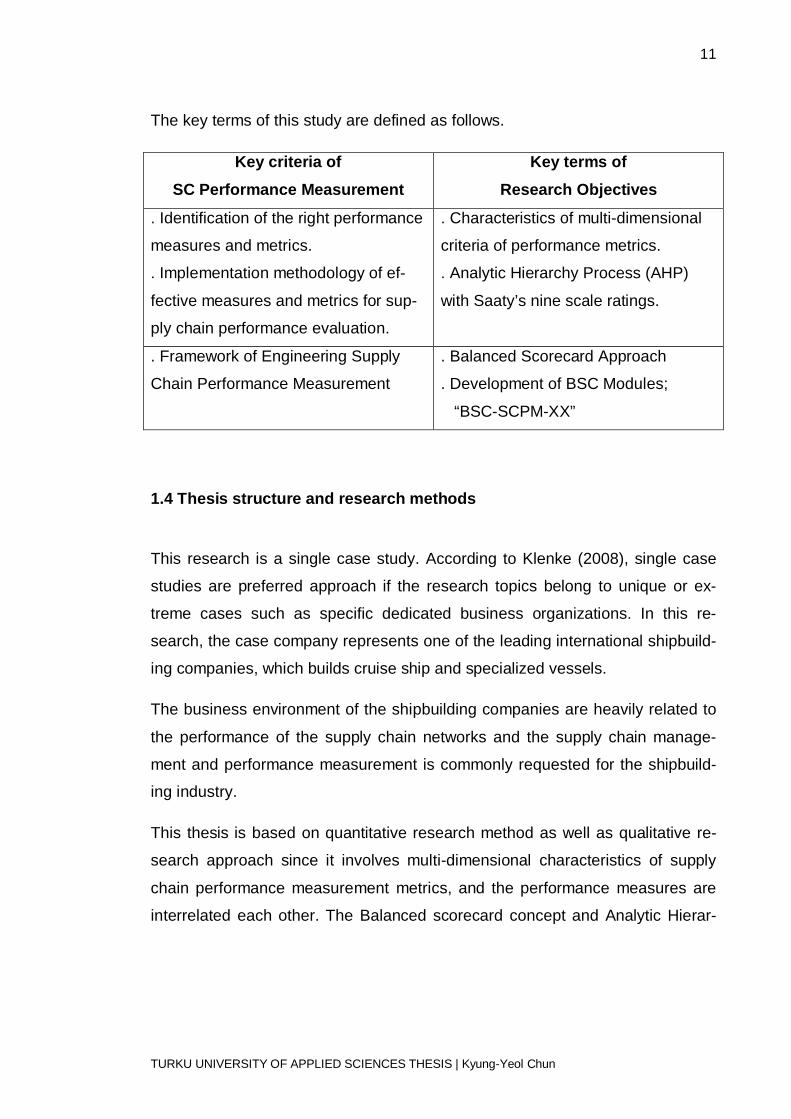
The key terms of this study are defined as follows.
Key criteria of SC Performance Measurement
Key terms of Research Objectives
. Identification of the right performance
measures and metrics.
. Implementation methodology of ef-
fective measures and metrics for sup-
ply chain performance evaluation.
. Characteristics of multi-dimensional
criteria of performance metrics.
. Analytic Hierarchy Process (AHP)
with Saaty’s nine scale ratings.
. Framework of Engineering Supply
Chain Performance Measurement
. Balanced Scorecard Approach
. Development of BSC Modules;
“BSC-SCPM-XX”
1.4 Thesis structure and research methods
This research is a single case study. According to Klenke (2008), single case
studies are preferred approach if the research topics belong to unique or ex-
treme cases such as specific dedicated business organizations. In this re-
search, the case company represents one of the leading international shipbuild-
ing companies, which builds cruise ship and specialized vessels.
The business environment of the shipbuilding companies are heavily related to
the performance of the supply chain networks and the supply chain manage-
ment and performance measurement is commonly requested for the shipbuild-
ing industry.
This thesis is based on quantitative research method as well as qualitative re-
search approach since it involves multi-dimensional characteristics of supply
chain performance measurement metrics, and the performance measures are
interrelated each other. The Balanced scorecard concept and Analytic Hierar-
12
TURKU UNIVERSITY OF APPLIED SCIENCES THESIS | Kyung-Yeol Chun
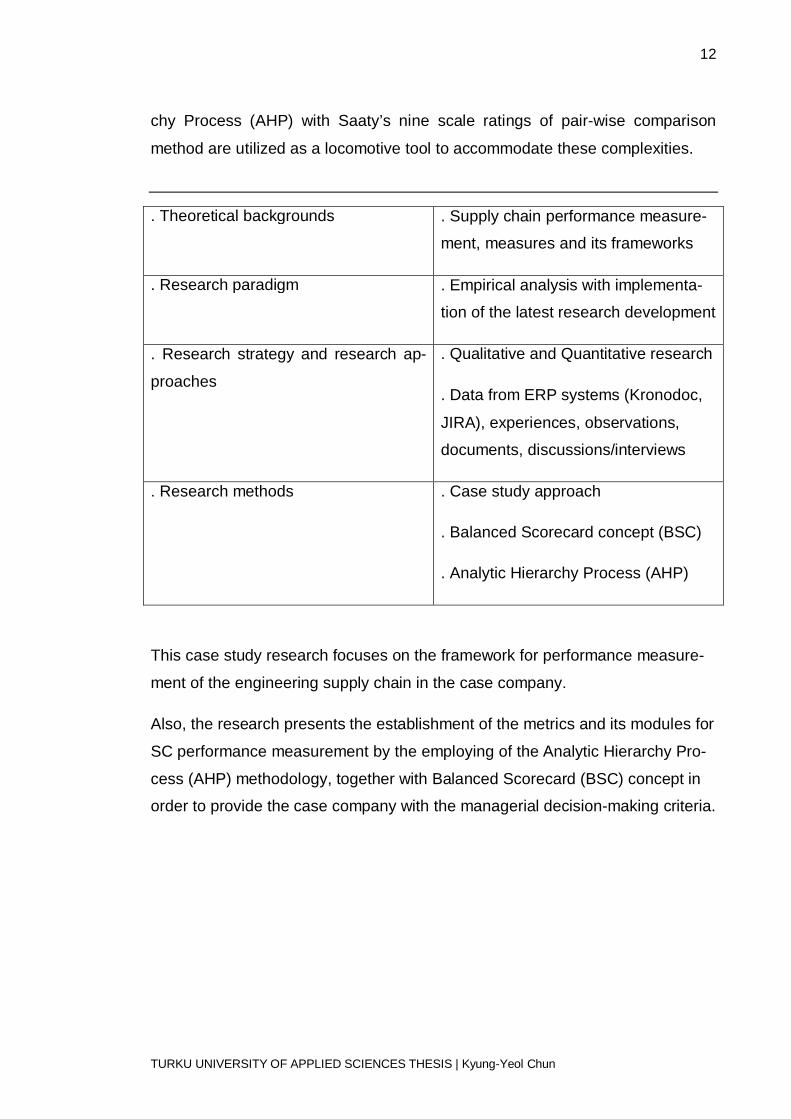
chy Process (AHP) with Saaty’s nine scale ratings of pair-wise comparison
method are utilized as a locomotive tool to accommodate these complexities.
. Theoretical backgrounds . Supply chain performance measure-
ment, measures and its frameworks
. Research paradigm . Empirical analysis with implementa-
tion of the latest research development
. Research strategy and research ap-
proaches
. Qualitative and Quantitative research
. Data from ERP systems (Kronodoc,
JIRA), experiences, observations,
documents, discussions/interviews
. Research methods . Case study approach
. Balanced Scorecard concept (BSC)
. Analytic Hierarchy Process (AHP)
This case study research focuses on the framework for performance measure-
ment of the engineering supply chain in the case company.
Also, the research presents the establishment of the metrics and its modules for
SC performance measurement by the employing of the Analytic Hierarchy Pro-
cess (AHP) methodology, together with Balanced Scorecard (BSC) concept in
order to provide the case company with the managerial decision-making criteria.

13
TURKU UNIVERSITY OF APPLIED SCIENCES THESIS | Kyung-Yeol Chun
2 LITERATURE REVIEW
In order to benchmarking the relevant models to fit this research objectives, the
current literature reviews have been investigated on supply chain performance
measurement, the measures and metrics and the framework approaches, and
highlighted as follows.
It has been emphasized the necessities and importance of performance meas-
urement by claiming that, “You cannot manage what you cannot measure” (Sink
& Tuttle, 1989). In real-life business management viewpoint, if there are no
measurement data and there are no physical features of information, the man-
agement environment is in uncertainties, and a decision-making is very difficult
for decision makers as well as the process managers.
Also, Wouters (2009) claims that actual performance measurement supports:
the deployment of strategy, an enhancement of communication, and the moni-
toring of processes.
Supply chain performance measurement (SCPM) is the core components for
improvement of supply chain management (SCM). Therefore, SCPM system
should be developed in line with the strategy of SCM for fulfilment of customer
satisfaction through the most efficient utilization of the organizational resources.
In order to conduct the effective supply chain performance measurement, the
establishment of right performance measures and metrics is one of the crucial
issues because the performance objectives vary with the purpose of business
and its strategies. Furthermore, the performance of supply chain needs to be
analyzed and evaluated on the various aspects as a whole entity in continuous
changing circumstances.
Accordingly, the performance measures and metrics need to be measurable,
non-bias and non-interconnected in association with many other relevant fea-
tures. For example, it is evident that supply chain performance measures need
to be balanced with the financial against the non-financial aspects.
14
TURKU UNIVERSITY OF APPLIED SCIENCES THESIS | Kyung-Yeol Chun
2.1 Supply Chain Performance Measurement (SCPM)
From the business operational perspective, the core purpose of performance
measurement system is “a process of quantifying the efficiency and/or effec-
tiveness of action” (Neely et al., 1995).
Moullin (2002) also defines it as “the process of evaluating how the organiza-
tions are managed well and how the values are delivered for customers and
other stakeholders.”
From the modern business management perspective, the performance meas-
urement provides the necessary information of management feedback for pro-
cess managers as well as decision makers, and it takes a significant role in
monitoring performance, enhancing motivation, improving communication, and
diagnosing potential problems. Furthermore, performance measurement can
support the deployment of management strategies and facilitating the feedback
for the futuristic situation.
In addition, performance measurement supports in directing management atten-
tion, revising and updating company goals, and re-engineering business pro-
cesses accordingly. Therefore, the accurate supply chain performance meas-
urement is essential in the continuous improvement of supply chain manage-
ment (Chan 2003).
The major purposes of a performance measurement system are presented by
Gunasekaran & Kobu (2007) as follows;
- identify customer demands and requirements as well as capability, non-values in process, problems and improvement opportunities
- provide better understanding of processes
- enable monitoring and controlling the achievements
- facilitate the more communication and collaboration
- support feedback for decision-making
15
TURKU UNIVERSITY OF APPLIED SCIENCES THESIS | Kyung-Yeol Chun
It is very hard to elaborate common measures and metrics for measuring total
supply chain performance effectively and precisely, and, therefore, the metrics
are usually to be established independently for each business unit organization.
The features of multi-dimensional parameters and diversity of business objec-
tives emphasize the importance of performance measurement approaches such
as financial, non-financial, qualitative and quantitative. Also, the performance
measures and metrics including plan, resource, time, cost, quality, flexibility,
reliability, agility with the operational processes and activities are relevant to the
approach of performance measurement.
SC performance measurement system is a performance measurement model
which is based on mutually agreed goals, measures, measurement methodolo-
gy that specify procedures, responsibilities and accountability of supply chains,
and the criteria of the measurement system together with supply chains.
(Holmberg 2000)
A performance measurement is defined as the feedback on operations which
are dedicated to customer satisfaction, company strategy and business objec-
tives. Also, it asserts that performance measurement motivates the need for
improvement in operational processes that are referred to as the critical paths in
performance measurement. (Bhagwat and Sharma, 2007)
The importance of performance measurement systems is summarized by Gun-
asekaran et al. (2004) as follows;
- Driving organizational activities to achieve higher performance with the mon-
itored outcomes by identifying the improvement area.
- Providing a basis of evaluation and criteria of decision-making for actions at
all the levels of strategic, tactical and operational function.
- Facilitating feedbacks on process tracking, diagnosis of problems and identi-
fication of potential opportunities for improvement through the internal and/or
external communications.
16
TURKU UNIVERSITY OF APPLIED SCIENCES THESIS | Kyung-Yeol Chun
The futuristic research topics on supply chain performance measurement are
the actual implementation in business performance management, proactive per-
formance measurement of supply chain, measurement approach in intangible
and tangible metrics, dynamic measurement systems, and flexibility of meas-
urement systems across the industries (Neely, 2005).
2.2 Measures and Metrics of Supply Chain Performances
According to Neely et al. (1995), the primary purpose of a performance meas-
urement is to quantify the efficiency and effectiveness of activities of organiza-
tion, and the performances of activities can be evaluated and analysed by ask-
ing following questions;
- What performance measures are used?
- What purpose are they used?
- How much do they cost?
- What benefit do they provide?
It is noted that the performance measures and metrics can provide with more
open and transparent communication in the organization, and they lead to a
cooperative working environment, and hence, resulting into the improved organ-
izational performance (Gunasekaran and Kobu, 2007). However, designing,
implementation, and execution of a set of performance measures are to be en-
sured continuous updating of the system (Beamon, 1998; Bourne et al., 2000).
In the literature review, there are several highlighted the contemporary perfor-
mance measurement issues as follows. (Shepherd and Gunter, 2006)
- the influencing measures of the successful implementation of performance
measurement systems (Bourne et al., 2000)
- the forces of shaping the evolution of performance measurement systems
(Kennerley and Neely, 2003; Waggoner et al., 1999)
17
TURKU UNIVERSITY OF APPLIED SCIENCES THESIS | Kyung-Yeol Chun
- Sustainable performance measurement systems to aligned with dynamic
environments and changing strategies (Bourne et al., 2000; Kennerley and
Neely, 2003).
There are a few literatures which deal with the practical performance measures
and metrics for supply chain performance measurement (Gunasekaran and
Kobu, 2007). Moreover, there is little evidence of systematic empirical research
on the implementation of performance measurement systems (Bourne et al.,
2000; Neely et al., 2000; Nudurupati et al., 2011). However, there are a limited
number of empirical researches on the implementation of dynamic performance
measurement systems (Bourne et al., 2000). Therefore, implementation and
updating of performance measurement systems have not received keen atten-
tion for many years (Bourne et al., 2000; Kennerley and Neely, 2003; Nuduru-
pati et al., 2011)
The fundamental characteristics and requirements of proper performance
measurement and metrics have been presented and elaborated with the follow-
ing topics of performance measurement metrics including, (Gunasekaran et al.
2004; Gopal and Thakkar, 2012);
- Identification of the key performance indicators (KPIs).
- Reflection of the balance between financial and non-financial measures.
- Linkage of the strategic, tactical and operational levels of decision-making
and control.
- Classification basis of the push, pull, and push-pull supply chains.
- Mathematically valid features of metrics and measures.
- Allowance in setting targets, aggregation & disaggregation, prioritisation,
weighting and integration.
- Tailoring of the complex supply chain networks.
- Simple and easy for use in the form of ratios.
- Responding to the rapid changes.
- Handling of collaborations, partnerships, agility and flexibility.
- Defining of business excellences.

18
TURKU UNIVERSITY OF APPLIED SCIENCES THESIS | Kyung-Yeol Chun
- Adopting of a proactive approach, rapid response and continuous improve-
ment.
- Fitting of the functions for all levels.
- Being coherent and transparent
The establishing and implementing a performance measurement system to
meet all these requirements is a challenging task, and requiring comprehensive
considerations on business processes, technical and organisational and mana-
gerial issues. These challenges grow to more complexity by increased demands
for measuring partnership, collaboration, agility, and business excellence re-
quirements in the modern business environment (Akyuz and Erkan, 2010).
Hence, the efficiency is a measure on how the company’s resources are utilized
economically with the condition of a given level of customer satisfaction, it is
essential to develop the effective measures for the efficient performance meas-
urement system. However, monitoring and measurement of performance of the
supply chains have become increasingly complex task (Cai et al., 2009).
In order to develop a performance measurement and measures, it needs to fo-
cus on what and how the measures are implied, and how to analyse the
measures appropriately. Moreover, the performance measures differ from con-
texts to contexts that are resulting into complexity since they are involved with
the multi-dimensional characteristics.
Furthermore, the composition of measures of the performance measurement
system in supply chain is different in relation to the customer’s requirements
and objectives of a supply chain. Moreover, it is important to keep developing
and improving the performance measures of supply chain with the continuous
updating and benchmarking to the current rapid changing business environ-
ment.
The selection and implementation of the right measures of supply chain perfor-
mance is a critical topic for management because it is needed for decision
makers to evaluate supply chain performance on various aspects with the multi-
19
TURKU UNIVERSITY OF APPLIED SCIENCES THESIS | Kyung-Yeol Chun
dimensional criteria. Moreover, the selection of the right performance also
measures enhancing the clear communicating strategy and encouraging its im-
plementation (Agami et al., 2012).
Researchers have developed the supply chain performance measures in the
various perceptions and approached as follows (Gopal and Thakkar, 2012);
- Qualitative or quantitative (Beamon, 1999; Chan, 2003);
- Cost and non-cost (Gunasekaran et al., 2001);
- Quality, cost, resource utilization, flexibility, Innovativeness (Chan, 2003);
- Resources, outputs and flexibility (Beamon, 1999);
- Input, output and composite measures (Chan and Qi, 2003);
- Strategic, operational or tactical approach (Gunasekaran et al., 2001);
- Supply chain operations reference (SCOR) model (SCC);
- Key performance measures and metrics (Gunasekaran and Kobu, 2007);
- Scorecards approach (Brewer and Speh, 2000);
- Financial and non-financial approach (Gunasekaran et al., 2004)
According to Gopal (2012), the researchers have focused on specific areas of
the perspective analysis on the supply chain performance including;
- collaboration and trust,
- integration,
- product variety,
- partnership,
- organizational structures,
- collaboration,
- information technology,
- system perspective,
- environmental,
- agile,
- risk
From the above highlighted points, it can be concluded that researchers have
perceived supply chain performance from various perspectives. The research-
20
TURKU UNIVERSITY OF APPLIED SCIENCES THESIS | Kyung-Yeol Chun
ers’ perspective is a unique view of what supply chain management (SCM) ob-
jectives are about. Researchers’ perspective can be described in terms of the
perceived nature of the supply chain (Otto and Kotzab, 2003).
Shepherd and Günther (2006) present taxonomy of measures of supply chain
performance as follows.
- Measures are categorized as supply chain actions: plan, source, make, de-
liver and return.
- Measures also recognized as the perspectives: cost, time, quality, flexibility
or innovativeness approach.
- Measures are divided into two characteristics: quantitative and qualitative
measures.
Gunasekaran et al. (2004) focus on classification of various supply chain
measures based on supply chain activities with respect to levels of an organiza-
tion (strategic, operational and tactical) to address the authority and responsibil-
ity of management at appropriate level.
Thakkar et al. (2009) present the essential features of the performance metrics
for identification of SC performance measurement:
- measurement system should have the capability to capture the essence of
organizational performance
- measurement system should ensure an appropriate assignment of metrics
to the areas where they would be most appropriate
- measurement system should allow the minimum deviations between the or-
ganizational goals and measurement goals
- measures and metrics should provide an adequate balance between finan-
cial and non-financial perspectives
- measures and metrics should support the decision-makings at the various
level of strategic, tactical, and operation.
21
TURKU UNIVERSITY OF APPLIED SCIENCES THESIS | Kyung-Yeol Chun
However, recent literature review points out that many of performance
measures and metrics are lacking in strategy alignment, balanced approach
and system implementation. Moreover, they have difficulty in identifying the
most relevant metrics systematically. Also, they state that current SC perfor-
mance measurement systems do not provide definite inter-relationship among
the various individual performance measures and metrics. (Akyuz and Erkan
2010, Cai et al. 2009)
In today’s trends of successful business excellences of supply chain, collabora-
tion, agility and flexibility are among the critical success criteria, but the current
supply chain performance management still appears to have a difficulty in
measuring the degree of collaboration, agility and flexibility (Akyuz and Erkan,
2010).
In order to achieve the effective performance management, it is vital to select
the right performance metrics and measures. Moreover, the evaluation of the
performance measurements is the key to the success because the performance
measures and metrics in supply chain are involved with the complexity of multi-
dimensional characteristics. In this view, Analytical hierarchy process (AHP) is a
proven effective methodology for evaluation of performance measures and met-
rics by prioritizing the attributes and linking to the objectives in supply chain.
AHP facilitates with the decision makers best suits for their decision-making in
daily business operations. (Bhagwat and Sharma, 2007)
AHP is a common tool for solving multi-criteria decision-making problems. AHP
provides a framework for involving tangible and intangible as well as qualitative
and quantitative approach. AHP provides versatility and power in structuring
and analyzing a complex multi-attribute decision-making problem, by giving
means of quantifying judgmental consistency. (Chan et al., 2003a; Korpela et
al., 2001)
22
TURKU UNIVERSITY OF APPLIED SCIENCES THESIS | Kyung-Yeol Chun
2.3 Supply Chain Performance Measurement System Approach
Supply Chain Management (SCM) and its performance measurement are an
effective business perception and strategy that keep continuous attention from
researchers and business entrepreneurs to achieve the business objectives
with the customer satisfaction. Performance measurement of supply chain facili-
tates supply chain to strategically manage and systematically achieve the goal
of objectives. Therefore, the performance measurement provides the motivation
and driving force for performance improvement in pursuit of supply chain excel-
lence.
The current literature review identifies that an effective SC performance meas-
urement system should be characterized by Akyuz and Erkan (2010):
- Covers necessary aspects and processes of a supply chain
- Allows for evaluation under different operating environment
- Features measurable for evaluation
- Compatible with goals and strategy
Upon historical literature review on the type of SC performance measurement
system, the financial performance measurement systems are traditionally refer-
ring as measures and methods for measuring supply chain performance. There-
fore, the systems are mainly focused on financial features, and hence there
were much criticisms on the effectiveness of performance measurement, and
there has been presented on the importance of strategic non-financial
measures.
The performance metrics are further categorized as financial measures or non-
financial measures. Such measures and metrics are interrelated together with
the hierarchical mechanism of supply chain performance measurement and
mapped with the performance measures into the organizational goals.
Gunasekaran et al. (2004) classified measures as strategic, tactical and opera-
tional level measurement. The main perception is that how to assign measures
and where they can be best fit at the appropriate management level.
23
TURKU UNIVERSITY OF APPLIED SCIENCES THESIS | Kyung-Yeol Chun
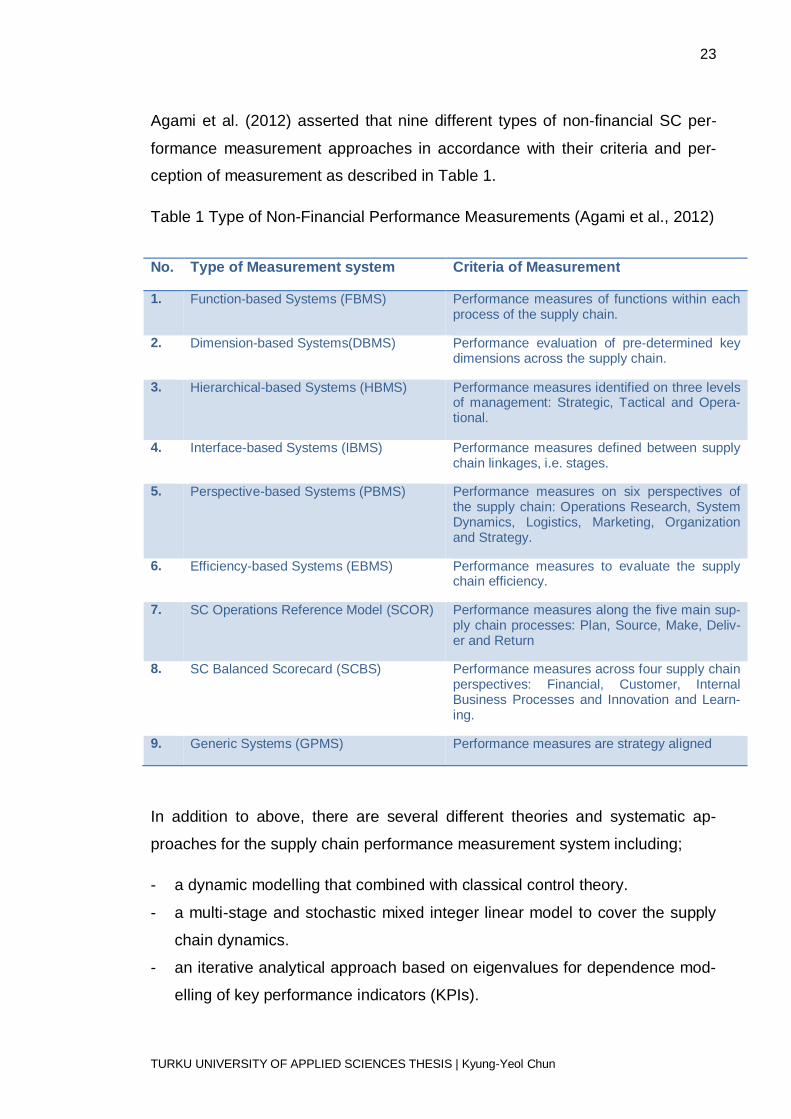
Agami et al. (2012) asserted that nine different types of non-financial SC per-
formance measurement approaches in accordance with their criteria and per-
ception of measurement as described in Table 1.
Table 1 Type of Non-Financial Performance Measurements (Agami et al., 2012)
No. Type of Measurement system Criteria of Measurement
1. Function-based Systems (FBMS) Performance measures of functions within each process of the supply chain.
2. Dimension-based Systems(DBMS) Performance evaluation of pre-determined key dimensions across the supply chain.
3. Hierarchical-based Systems (HBMS) Performance measures identified on three levels of management: Strategic, Tactical and Opera-tional.
4. Interface-based Systems (IBMS) Performance measures defined between supply chain linkages, i.e. stages.
5. Perspective-based Systems (PBMS) Performance measures on six perspectives of the supply chain: Operations Research, System Dynamics, Logistics, Marketing, Organization and Strategy.
6. Efficiency-based Systems (EBMS) Performance measures to evaluate the supply chain efficiency.
7. SC Operations Reference Model (SCOR) Performance measures along the five main sup-ply chain processes: Plan, Source, Make, Deliv-er and Return
8. SC Balanced Scorecard (SCBS) Performance measures across four supply chain perspectives: Financial, Customer, Internal Business Processes and Innovation and Learn-ing.
9. Generic Systems (GPMS) Performance measures are strategy aligned
In addition to above, there are several different theories and systematic ap-
proaches for the supply chain performance measurement system including;
- a dynamic modelling that combined with classical control theory.
- a multi-stage and stochastic mixed integer linear model to cover the supply
chain dynamics.
- an iterative analytical approach based on eigenvalues for dependence mod-
elling of key performance indicators (KPIs).
24
TURKU UNIVERSITY OF APPLIED SCIENCES THESIS | Kyung-Yeol Chun
- a stepwise regression to analyze the dependency of measures.
- an analytical hierarchy process (AHP) approach for prioritizing weight of
metrics.
- a simulation-based experimental approach of ERP-based supply chain per-
formance measurement.
2.3.1 Supply Chain Performance Metrics Framework
Gunasekaran et al. (2004) asserts that the metrics for supply chain performance
measurement framework are to be selected to cover all level of the processes.
Top management focuses strategic and tactical measures for managerial deci-
sions, but lower management and workers need operational measures for daily
activities. And, therefore, a framework should include the metrics of SC perfor-
mance as follows;
- Measures for planning: order entry method, order lead-time, planned pro-
cess cycle time.
- Measures for purpose: strategic level measures, tactical level measures,
operational level measures.
- Measures for production: master production schedule, capacity utilization,
accuracy of forecasting techniques.
- Measures for delivery performance: total distribution cost, delivery lead-time.
- Measures for customer services: flexibility, customer query time.
- Measures for logistics: cost of assets, ROI, information processing cost.
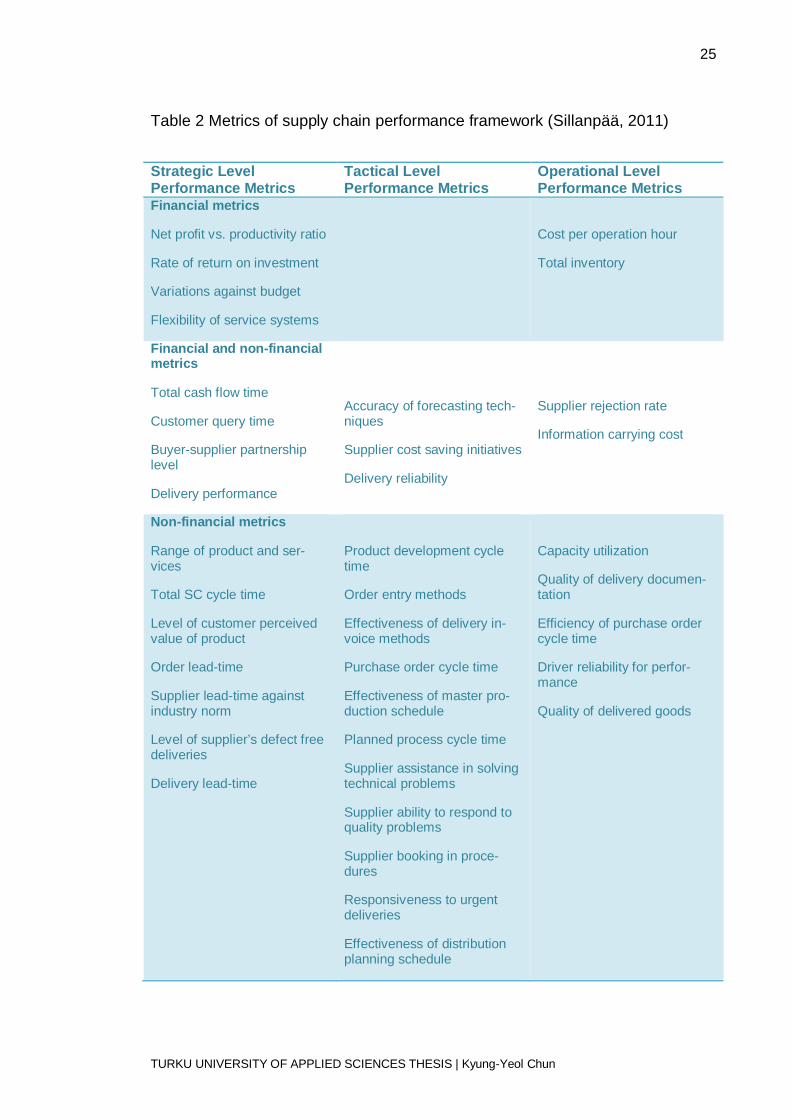
According to Sillanpää (2011), performance metrics of supply chain perfor-
mance measurement framework have been identified into two categories of fi-
nancial or non-financial in association with the three management levels of stra-
tegic, tactical and operational as shown in Table 2. It provides the more physical
perception of the performance measurement framework.
25
TURKU UNIVERSITY OF APPLIED SCIENCES THESIS | Kyung-Yeol Chun
Table 2 Metrics of supply chain performance framework (Sillanpää, 2011)
Strategic Level Performance Metrics
Tactical Level Performance Metrics
Operational Level Performance Metrics
Financial metrics
Net profit vs. productivity ratio
Rate of return on investment
Variations against budget
Flexibility of service systems
Cost per operation hour
Total inventory
Financial and non-financial metrics
Total cash flow time
Customer query time
Buyer-supplier partnership level
Delivery performance
Accuracy of forecasting tech-niques
Supplier cost saving initiatives
Delivery reliability
Supplier rejection rate
Information carrying cost
Non-financial metrics
Range of product and ser-vices
Total SC cycle time
Level of customer perceived value of product
Order lead-time
Supplier lead-time against industry norm
Level of supplier’s defect free deliveries
Delivery lead-time
Product development cycle time
Order entry methods
Effectiveness of delivery in-voice methods
Purchase order cycle time
Effectiveness of master pro-duction schedule
Planned process cycle time
Supplier assistance in solving technical problems
Supplier ability to respond to quality problems
Supplier booking in proce-dures
Responsiveness to urgent deliveries
Effectiveness of distribution planning schedule
Capacity utilization
Quality of delivery documen-tation
Efficiency of purchase order cycle time
Driver reliability for perfor-mance
Quality of delivered goods

26
TURKU UNIVERSITY OF APPLIED SCIENCES THESIS | Kyung-Yeol Chun
2.3.2 Supply Chain Balanced Score Card (BSC) Framework
The basic idea of Balanced Score Card has been claimed by Kaplan and Nor-
ton (1992) who realized that the tendency of performance measurement are too
much focused on financial performance measures, and raised the issues with
following arguments that;
The performance measurement system and performance measures are affect-
ing in various aspects on the operational perception of managers and behaviour
of employees in the organization, and therefore, the traditional financial perfor-
mance measures cannot give the holistic feature of the organizational perfor-
mance.
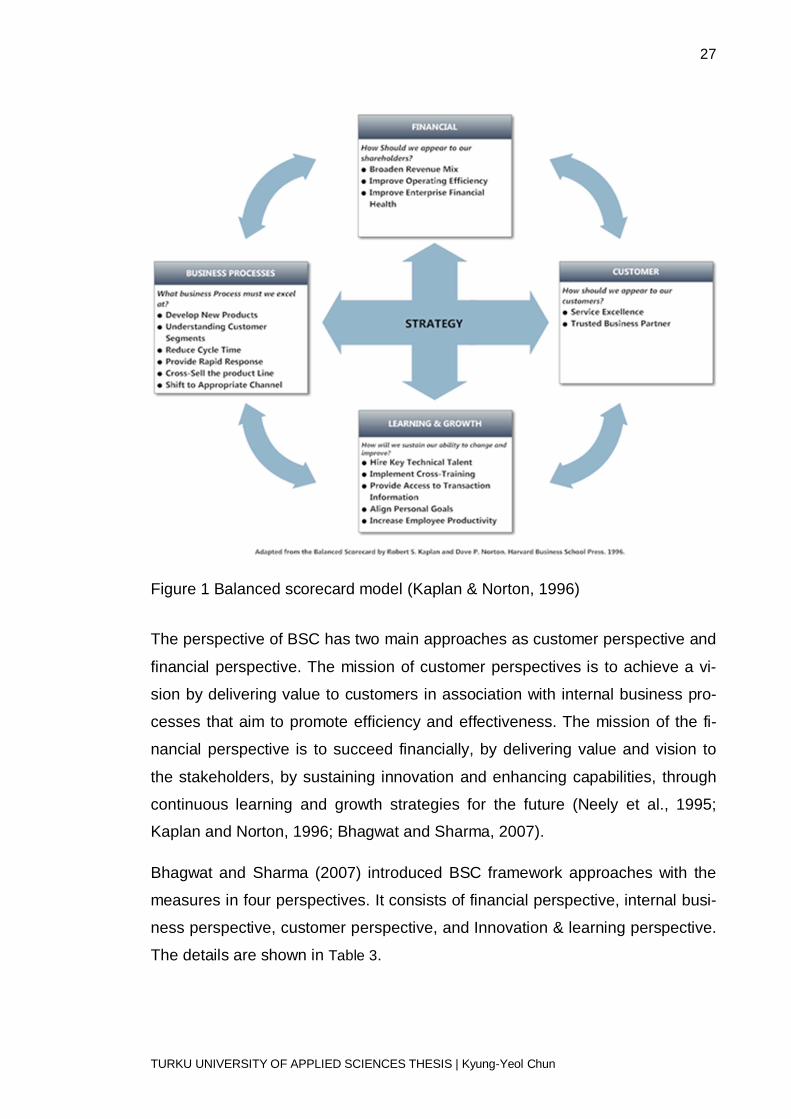
Kaplan and Norton (1992) presented that the managers should establish a stra-
tegic balanced scorecard system with four perspectives of financial, business
process, customer, and growth as shown in Figure 1.
Moreover, they emphasized that the goals and measures of each score cards’
perception are to be met with following questions.
- Financial perspective : How should we appear to shareholders?
- Business process perspective : What process must we excel at?
- Learning & growth perspective : How shall we sustain our core strength?
- Customer perspective : How should we appear to our customers?
27
TURKU UNIVERSITY OF APPLIED SCIENCES THESIS | Kyung-Yeol Chun
Figure 1 Balanced scorecard model (Kaplan & Norton, 1996)
The perspective of BSC has two main approaches as customer perspective and
financial perspective. The mission of customer perspectives is to achieve a vi-
sion by delivering value to customers in association with internal business pro-
cesses that aim to promote efficiency and effectiveness. The mission of the fi-
nancial perspective is to succeed financially, by delivering value and vision to
the stakeholders, by sustaining innovation and enhancing capabilities, through
continuous learning and growth strategies for the future (Neely et al., 1995;
Kaplan and Norton, 1996; Bhagwat and Sharma, 2007).
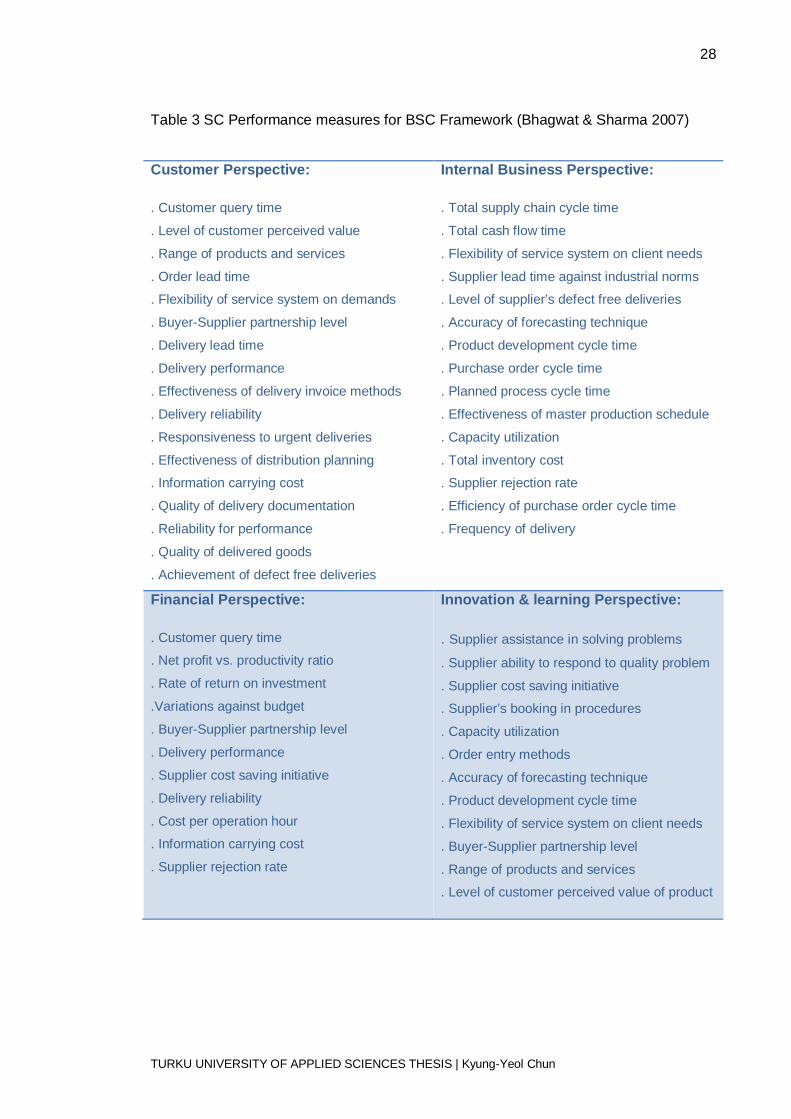
Bhagwat and Sharma (2007) introduced BSC framework approaches with the
measures in four perspectives. It consists of financial perspective, internal busi-
ness perspective, customer perspective, and Innovation & learning perspective.
The details are shown in Table 3.
28
TURKU UNIVERSITY OF APPLIED SCIENCES THESIS | Kyung-Yeol Chun
Table 3 SC Performance measures for BSC Framework (Bhagwat & Sharma 2007)
Customer Perspective:
. Customer query time
. Level of customer perceived value
. Range of products and services
. Order lead time
. Flexibility of service system on demands
. Buyer-Supplier partnership level
. Delivery lead time
. Delivery performance
. Effectiveness of delivery invoice methods
. Delivery reliability
. Responsiveness to urgent deliveries
. Effectiveness of distribution planning
. Information carrying cost
. Quality of delivery documentation
. Reliability for performance
. Quality of delivered goods
. Achievement of defect free deliveries
Internal Business Perspective:
. Total supply chain cycle time
. Total cash flow time
. Flexibility of service system on client needs
. Supplier lead time against industrial norms
. Level of supplier’s defect free deliveries
. Accuracy of forecasting technique
. Product development cycle time
. Purchase order cycle time
. Planned process cycle time
. Effectiveness of master production schedule
. Capacity utilization
. Total inventory cost
. Supplier rejection rate
. Efficiency of purchase order cycle time
. Frequency of delivery
Financial Perspective:
. Customer query time
. Net profit vs. productivity ratio
. Rate of return on investment
.Variations against budget
. Buyer-Supplier partnership level
. Delivery performance
. Supplier cost saving initiative
. Delivery reliability
. Cost per operation hour
. Information carrying cost
. Supplier rejection rate
Innovation & learning Perspective:
. Supplier assistance in solving problems
. Supplier ability to respond to quality problem
. Supplier cost saving initiative
. Supplier’s booking in procedures
. Capacity utilization
. Order entry methods
. Accuracy of forecasting technique
. Product development cycle time
. Flexibility of service system on client needs
. Buyer-Supplier partnership level
. Range of products and services
. Level of customer perceived value of product
29
TURKU UNIVERSITY OF APPLIED SCIENCES THESIS | Kyung-Yeol Chun
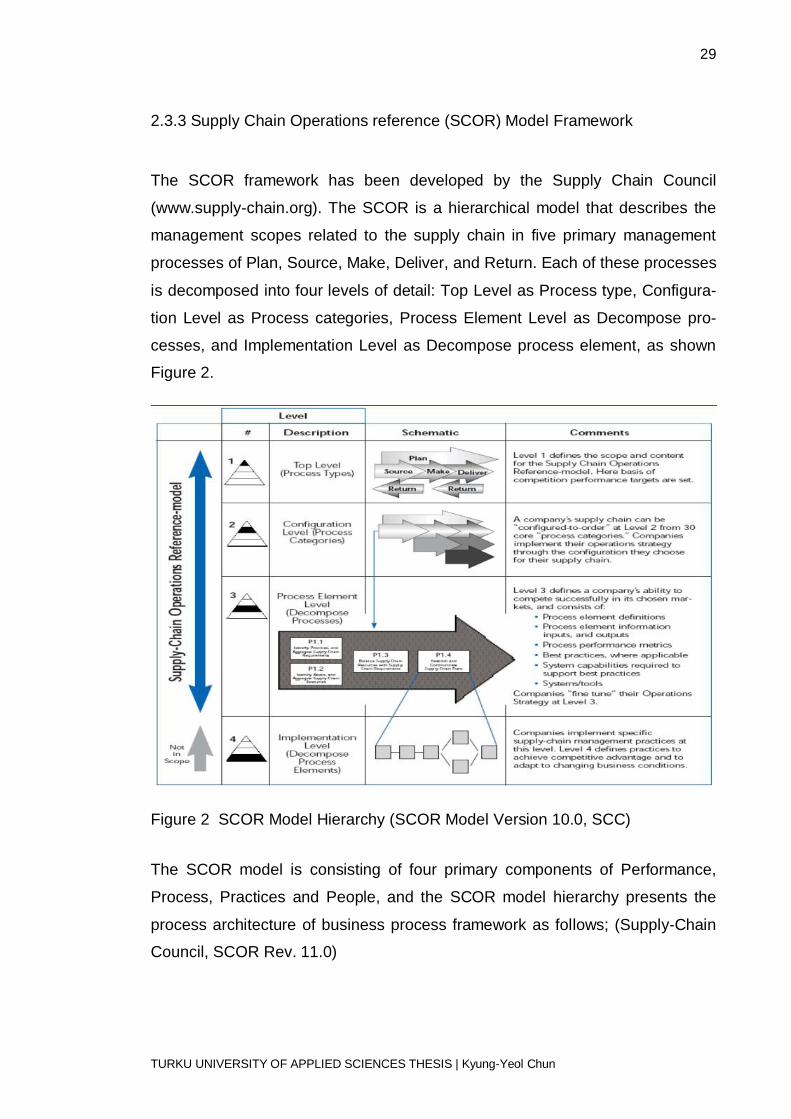
2.3.3 Supply Chain Operations reference (SCOR) Model Framework
The SCOR framework has been developed by the Supply Chain Council
(www.supply-chain.org). The SCOR is a hierarchical model that describes the
management scopes related to the supply chain in five primary management
processes of Plan, Source, Make, Deliver, and Return. Each of these processes
is decomposed into four levels of detail: Top Level as Process type, Configura-
tion Level as Process categories, Process Element Level as Decompose pro-
cesses, and Implementation Level as Decompose process element, as shown
Figure 2.
Figure 2 SCOR Model Hierarchy (SCOR Model Version 10.0, SCC)
The SCOR model is consisting of four primary components of Performance,
Process, Practices and People, and the SCOR model hierarchy presents the
process architecture of business process framework as follows; (Supply-Chain
Council, SCOR Rev. 11.0)

30
TURKU UNIVERSITY OF APPLIED SCIENCES THESIS | Kyung-Yeol Chun
- Performance: Composed with the standard metrics to describe process per-
formance and de ne strategic goals. This performance component decom-
posed into two elements by performance attributes and performance met-
rics. The performance attributes are a group of metrics to express the strat-
egy which includes reliability, responsibility, agility, costs, and assets. An at-
tribute itself cannot be measured, but it is used to set strategic direction.
Performance metrics measures the ability of the supply chain to achieve
these strategic attributes.
- Processes: Provides a set of pre-defined descriptions for activities most
companies perform to execute their supply chain effectively. The five pro-
cesses of Plan, Source, Make, Deliver and Return are adopted in SCOR
process model. Also, each process deploys three level processes to define
the span, categories, capabilities, and detailed activities.
- Practices: Consists of best practices organized by original objectives for im-
proving overall supply chain operational performance (SCOR), and Green
SCOR for improving the environmental footprint of the supply chain, and
Risk Management for mitigating the risks of an undesired event taking place,
limiting the impact of such an event and improving the ability to recover from
the event.
- People: Facilitates a standard for describing skills required to perform the
tasks and manage the supply chain processes. Skills are described by the
standard definition and association to other people aspects: Aptitudes, Ex-
periences, Trainings and Competency level.
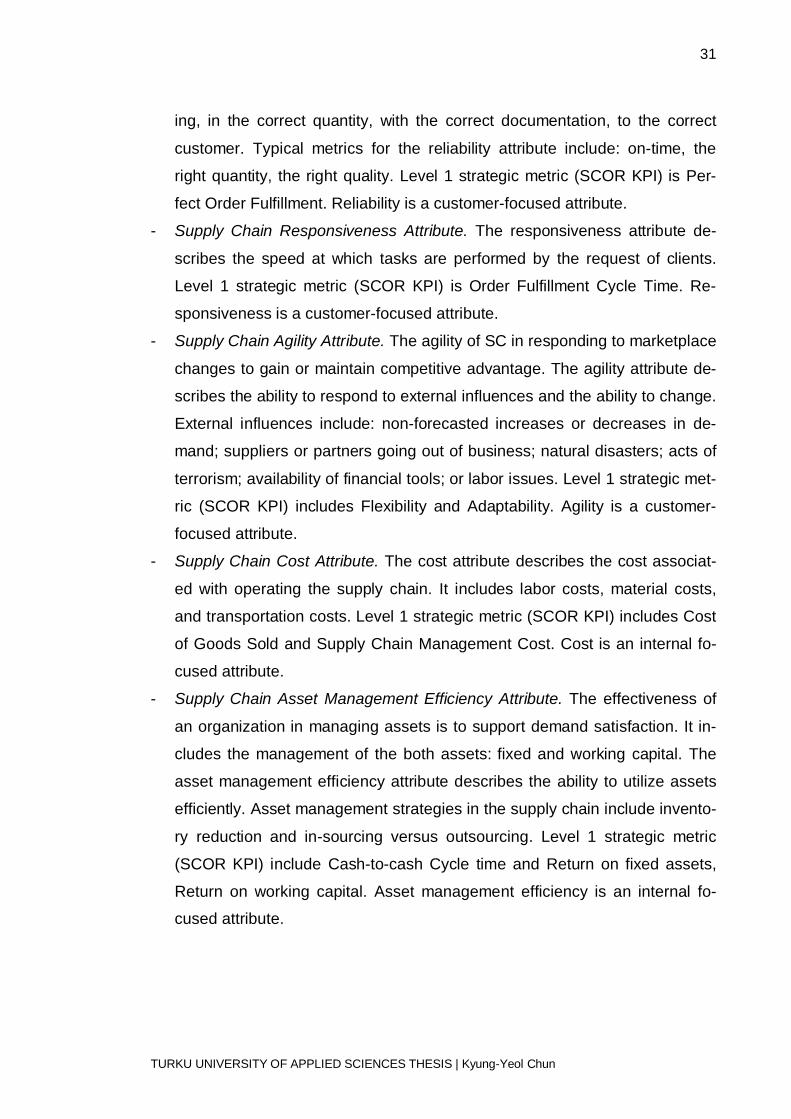
A performance attribute is a grouping of metrics used to express a strategy,
and the group is defined by five (5) performance attributes; Reliability, Respon-
siveness, Agility, Costs, Asset Management Efficiency as (Supply-Chain Coun-
cil, SCOR Rev. 11.0);
- Supply Chain Reliability Attribute. The Reliability attribute for supply chain
addresses the ability to perform tasks as expected. Reliability attribute is de-
fined the performance of the supply chain in delivering: the correct product,
to the correct place, at the correct time, in the correct condition and packag-
31
TURKU UNIVERSITY OF APPLIED SCIENCES THESIS | Kyung-Yeol Chun
ing, in the correct quantity, with the correct documentation, to the correct
customer. Typical metrics for the reliability attribute include: on-time, the
right quantity, the right quality. Level 1 strategic metric (SCOR KPI) is Per-
fect Order Fulfillment. Reliability is a customer-focused attribute.
- Supply Chain Responsiveness Attribute. The responsiveness attribute de-
scribes the speed at which tasks are performed by the request of clients.
Level 1 strategic metric (SCOR KPI) is Order Fulfillment Cycle Time. Re-
sponsiveness is a customer-focused attribute.
- Supply Chain Agility Attribute. The agility of SC in responding to marketplace
changes to gain or maintain competitive advantage. The agility attribute de-
scribes the ability to respond to external influences and the ability to change.
External influences include: non-forecasted increases or decreases in de-
mand; suppliers or partners going out of business; natural disasters; acts of
terrorism; availability of financial tools; or labor issues. Level 1 strategic met-
ric (SCOR KPI) includes Flexibility and Adaptability. Agility is a customer-
focused attribute.
- Supply Chain Cost Attribute. The cost attribute describes the cost associat-
ed with operating the supply chain. It includes labor costs, material costs,
and transportation costs. Level 1 strategic metric (SCOR KPI) includes Cost
of Goods Sold and Supply Chain Management Cost. Cost is an internal fo-
cused attribute.
- Supply Chain Asset Management Efficiency Attribute. The effectiveness of
an organization in managing assets is to support demand satisfaction. It in-
cludes the management of the both assets: fixed and working capital. The
asset management efficiency attribute describes the ability to utilize assets
efficiently. Asset management strategies in the supply chain include invento-
ry reduction and in-sourcing versus outsourcing. Level 1 strategic metric
(SCOR KPI) include Cash-to-cash Cycle time and Return on fixed assets,
Return on working capital. Asset management efficiency is an internal fo-
cused attribute.
32
TURKU UNIVERSITY OF APPLIED SCIENCES THESIS | Kyung-Yeol Chun
The SCOR metrics are diagnostic metrics and it measures the ability of the
supply chain to achieve these strategic attributes, while the individual metric
represents a standard for measurement of the performance of a process.
The SCOR model composed as three levels of predefined hierarchical metrics
structure which are referred to as decomposition through Level 1 to Level 3:
(Supply Chain Council 2010)
- Level 1 metrics: denote the diagnostics for the strategic feature of the supply
chain. These metrics are also known as key performance indicators (KPI).
- Level 2 metrics: provide the diagnostics for the level 1 metrics. The diagnos-
tic output serves to identify the root cause or causes of a performance gap
for a level 1 metric.
- Level 3 metrics: serve as diagnostics for level 2 metrics as the same con-
cept.
Theeranuphattana (2008) summarized the benefits for users by implementing
the SCOR model as follows:
- utilize and make benchmarking on the standard descriptions of management
processes for the supply chain
- define a framework with the predefined standard processes
- afford the structured hierarchical standard metrics to measure process per-
formance
- achieve the management practices that provide best performance
- apply the standard alignment to software features and functionalities.
The SCOR model does not include the quality measures (Theeranuphattana
and Tang 2008, Li et al. 2011). Also, the Supply Chain Council explains that the
SCOR Model is silent in the areas of human resources, training, and quality as-
surance (Supply-Chain Council 2010). However, Li et al. (2011) point out that
performance attributes of reliability and responsiveness are included in the per-
formance and process framework, and then it can also be considered as quality
measures.
33
TURKU UNIVERSITY OF APPLIED SCIENCES THESIS | Kyung-Yeol Chun
Summarizing the strengths of the SCOR model, it can be identified that its core
strength is the capability and availability of global implementation and adoption
of the comprehensive model structure with the support of IT development. The
Supply Chain Council has developed the SCOR model and it continues im-
provement in association with the various types of corporate members, aca-
demic institutions and other non-profit organizations. The SCOR model provides
a standardized method to evaluate the processes of the supply chain with an
enormous database of benchmarks from the member organizations.
As one of weak points of the SCOR model, the model consists of a huge num-
ber of metrics with complicated hierarchical processes. For effective implemen-
tation of the SCOR model for the dedicated supply chain, all of these metrics
and processes should be scrutinized to find the suitable ones, which capture
essence of the performance in the dedicated supply chain. The abundance of
metrics also requires a huge amount of input data, which in some cases does
not exist in the dedicated supply chains.
Despite above mentioned shortcomings and challenges, the SCOR model is
developing the continuous updating and desirable performance measurement
framework because SCOR model includes most of the business processes and
practices where a supply chain needed.
2.3.4 SCOR – BSC Framework
Thakkar et al (2009) presented an integrated performance measurement
framework for supply chain by using a set of qualitative and quantitative
measures. It integrates the well-known contributions of the balanced scorecard
(BSC) and the structured process of supply chain operation reference (SCOR)
model to provide a comprehensive performance measurement framework for
SMEs.The overall concept of approach and skeleton of the proposed SCOR-
BSC framework is shown in Figure 3.

34
TURKU UNIVERSITY OF APPLIED SCIENCES THESIS | Kyung-Yeol Chun
The integrated SCOR-BSC framework approach has been developed in order
to ensure the better effectiveness of performance measurement system on the
following grounds (Thakkar et al. 2009):
- Interrelationship and traceability: Balanced scorecard (BSC) approach does
not provide a mechanism for maintaining the relevance of defined measures,
while Supply chain operation reference (SCOR) model adopts a building
block approach and offers complete traceability.
- Process execution: BSC does not provide to link measures of top tactical
level, strategic scorecard level, and operational level, where it is potentially
making execution of strategy problematic. However, SCOR clearly defines
the type of process (planning, execution and enabling) and configures them
to suit the SC requirements.
- Customizing implementation: BSC does not provide benchmarking to specify
a customizing development process. SCOR model motivates to develop
customized software system.
The notable features and contribution of the SCOR-BSC framework in a field of
performance measurement are summarized as follows. (Thakkar et al., 2009).
- The framework includes both tangible and intangible performance measures.
The tangible measures of cost, time, capacity, productivity and utilization are
easy to collect the relevant data directly. The data of intangible measures
such as reliability, availability, and flexibility cannot be directly measured. In
order to measure these intangible performances, the measures need to be
transformed to other measurable performance indicators. For example, de-
livery flexibility can be measured by assessing in-time delivery rate and error
rate.
- Each of the metrics describes one critical dimension of performance of the
activity and process.
- An attempt to interlink the various issues for the complexity of supply chains.
- The framework has conceptualized the various decision areas of SCOR
model and included various metrics for category of BSC approach.

35
TURKU UNIVERSITY OF APPLIED SCIENCES THESIS | Kyung-Yeol Chun
- The framework defines physical inputs and output for implementation.
Figure 3 Skeleton of SCOR-BSC Framework for SMEs (Thakkar 2009)
2.3.5 Process-based Performance Measurement Approach
Chan and Qi (2003) propose a new approach with a process-based model to
analyze, manage the supply chain, and measure supply chain performance.
This approach implements seven steps of process decomposition. Moreover,
36
TURKU UNIVERSITY OF APPLIED SCIENCES THESIS | Kyung-Yeol Chun
the concept of performance of activity (POA) is presented to identify and to em-
ploy the performance measures and metrics.
For this purpose, process models are to be built from missions and particular
functions among the inter- and intra-organizations of supply chain. A process in
the supply chain is concerned about series of activities from original suppliers
and manufacturers, and the core business processes, which are of essential
importance to business objectives and strategies, are to be identified and con-
fined for this performance measurement approach.
The first task for this process-based performance measurement approach is to
identify and decompose the involved processes.
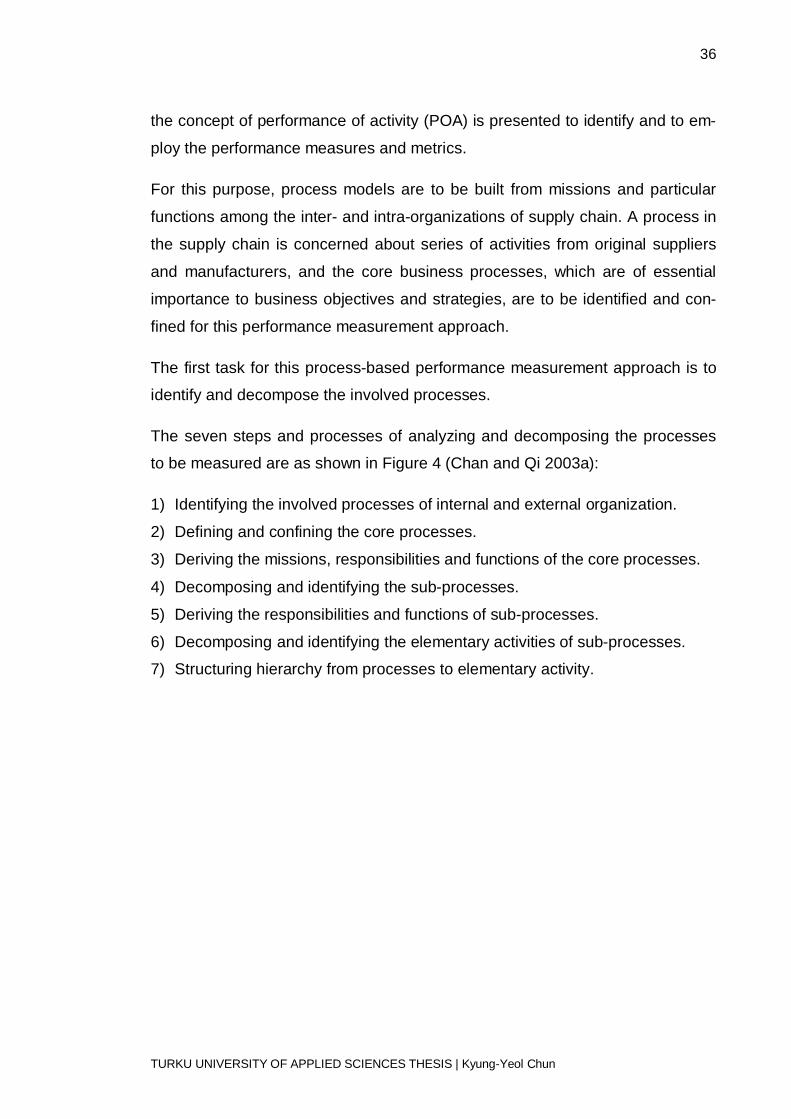
The seven steps and processes of analyzing and decomposing the processes
to be measured are as shown in Figure 4 (Chan and Qi 2003a):
1) Identifying the involved processes of internal and external organization.
2) Defining and confining the core processes.
3) Deriving the missions, responsibilities and functions of the core processes.
4) Decomposing and identifying the sub-processes.
5) Deriving the responsibilities and functions of sub-processes.
6) Decomposing and identifying the elementary activities of sub-processes.
7) Structuring hierarchy from processes to elementary activity.
37
TURKU UNIVERSITY OF APPLIED SCIENCES THESIS | Kyung-Yeol Chun
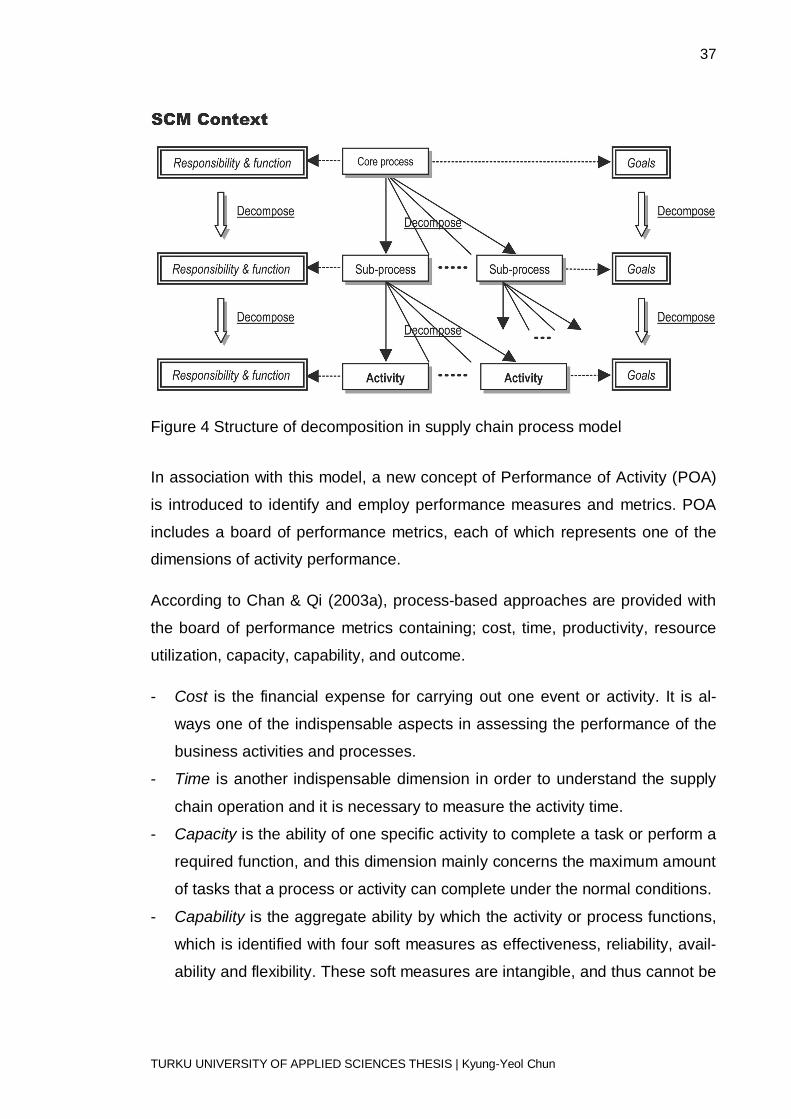
Figure 4 Structure of decomposition in supply chain process model
In association with this model, a new concept of Performance of Activity (POA)
is introduced to identify and employ performance measures and metrics. POA
includes a board of performance metrics, each of which represents one of the
dimensions of activity performance.
According to Chan & Qi (2003a), process-based approaches are provided with
the board of performance metrics containing; cost, time, productivity, resource
utilization, capacity, capability, and outcome.
- Cost is the financial expense for carrying out one event or activity. It is al-
ways one of the indispensable aspects in assessing the performance of the
business activities and processes.
- Time is another indispensable dimension in order to understand the supply
chain operation and it is necessary to measure the activity time.
- Capacity is the ability of one specific activity to complete a task or perform a
required function, and this dimension mainly concerns the maximum amount
of tasks that a process or activity can complete under the normal conditions.
- Capability is the aggregate ability by which the activity or process functions,
which is identified with four soft measures as effectiveness, reliability, avail-
ability and flexibility. These soft measures are intangible, and thus cannot be

38
TURKU UNIVERSITY OF APPLIED SCIENCES THESIS | Kyung-Yeol Chun
directly measured, and needs to be transformed to other measurable per-
formance indicators.
- Productivity is the rate at which one specific event or activity adds value at
the cost of resources, which is based on the ratio of the effective or useful
output to the total input such as capital, labor, materials and energy.
- Utilization means the utilizing rate of the resources to carry out one specific
activity, which reflects the ability of resource management and the effect of
strategies and planning.
- Outcome is the results or value added of one specific activity or event, which
may be a value added to the products and services.
Chan and Qi (2003) asserted that assessing process performance provides an
opportunity for examining the effectiveness of process management. Moreover,
the process-based measurement facilitates a great deal of supports in enhanc-
ing integration and improvement of the cross-organizational processes. The
main advantages of adopting process-based performance measurements are
highlighted as:
- To provide the opportunity of recognizing the problems in operations and
enabling of the corrective actions for the problems.
- To facilitate linking with the operational strategies, identifying success, and
testing the effect of strategies.
- To support the monitoring of the progress.
- To assist the direct management attention and resource allocation.
- To enhance communication of process objectives and position among the
processes involved in the supply chain, thus improving trust and common
understanding.
2.4 Challenges for Supply Chain Performance Measurement
It has been known that many business organizations could not succeed in man-
aging their supply chain performances to the maximum level because they have
had failed to develop the right performance measures and metrics. Moreover,
39
TURKU UNIVERSITY OF APPLIED SCIENCES THESIS | Kyung-Yeol Chun
they also found the difficulties to integrate and implement the system fully to
measure the performance of their supply chains effectively and efficiently.
(Gunasekaran et al., 2004).
Akyuz and Erkan (2010) have investigated and presented the major problems in
performance measurement as summarized below:
- Inconsistencies in performance measurement as well as in the selection of
the right performance measures and metrics.
- Representing a set of financial and non-financial measures in a balanced
framework. Approach of biased measures in a framework.
- Too many numbers of metrics make it difficult to identify the critical govern-
ing issues.
- Failure to link the strategy objectives and the measurement measures.
- Failure to balanced focus on financial metrics or operational ones.
- Too much inward looking insights.
The criticism about the failure to link with strategy and keeping biased focus on
financial metrics, there are three fundamental challenges of performance meas-
urement system in supply chain contexts (Gunasekaran et al. 2001, Sillanpää
2010).
- the lack of a balanced scorecard approach is integrating financial and non-
financial measures.
- the lack of a holistic feature to viewed as a whole entity in the measurement
system.
- the loss of the supply chain context which encourages local optimization.
Also, Lin and Li (2010) present four challenges for supply chain performance
measurement in the literature as follows.
- Majority of measures are focused on intra-organizational performance
measures that do not cover SC performance as a whole entity.
40
TURKU UNIVERSITY OF APPLIED SCIENCES THESIS | Kyung-Yeol Chun
- Less consideration in the effectiveness of measured values. The decision
makers need to find the real value of measures, to identify weak areas, to
take corrective countermeasures, and to keep continuous improvements.
- Less common metrics is developed for evaluating different processes on the
same scale. Different characteristics of associated processes cannot be
evaluated precisely without using the correct metrics.
- Less integration of human attributes such as cooperation, skill, communica-
tion, which have been claimed as the important dimensions of the SC per-
formance measurement model.
According to Akyuz and Erkan (2010), implementation of appropriate perfor-
mance measurement system to meet all these requirements and to suit the
specific organization is a challenging task because it is requiring a precise anal-
ysis of the business processes and operations in technical, organizational as
well as managerial issues. These challenges are more significant if it is required
to measure the qualitative performances such as a partnership, collaboration,
agility, and business excellence.
With all these challenging problems highlighted, there seems to be no global
common agreement on the right measures of the qualitative performance of
supply chain. Moreover, the supply chain performance measurement in qualita-
tive measures is very much fragmented.
As many of current performance measurement systems are missing on strategy
alignment, balanced approaches, and systematic implementation. Therefore,
they have the difficulties in identifying the most appropriate metrics systemati-
cally (Cai et al. 2009).
According to Cai et al. (2009), these performance measurement systems and
metrics do not provide a definite cause–effect relationship among hierarchical
individual KPIs since many measurement systems are static, and they lag the
trend.
It has been suggested from the researchers that the basic concept on qualita-
tive measures, process implementation, and business excellence, as well as the
41
TURKU UNIVERSITY OF APPLIED SCIENCES THESIS | Kyung-Yeol Chun
human attributes and organizational issues, are still the key considerations for
performance measurement system of future (Wouters, 2009).
It has been realized that one of the most challenging issues in supply chain
management is the uncertainty inside the processes and systems. Uncertainty
lead to inefficient processes and non-value added activities in planning, manag-
ing, processing, monitoring and controlling. Where there is more uncertainty in
the process, there exist more inefficiencies and non-value activities in the pro-
cess (Van der Vorst and Beulens, 2002).
2.5 Conclusion of Literature Review in view of Engineering SCPM
Performance measurement of the holistic processes of the supply chain is im-
portant for many reasons. Performance measurement provides information for
management and enables the decision makers identifying the success, and as-
sists in directing management attention, updating company goals, and re-
engineering business processes.
According Sillanpää (2010), three principal approaches for supply chain perfor-
mance measurement are presented as follows:
- Managerial approach
The components of SC managerial approach consist of strategic, tactical
and operational level. Therefore, the SC performance can be measured in
three different levels. Strategic level performance measures are essential for
needs of senior management. Tactical levels performance measures are
collecting feedback against targets for mid-management. Operational level
performance metrics requires information that is relevant to s management.
(Gunasekaran et al., 2004)
The performance measurement is categorized into SC activities and its
managerial approach. The SC performance activities are composed of plan,
source, make/assemble, and delivery.
42
TURKU UNIVERSITY OF APPLIED SCIENCES THESIS | Kyung-Yeol Chun
- Time based approaches
The three approaches of operational, tactical and strategic measurement are
of interest for time measurement of SC performance. Time provides the
same condition of measurement to every resource, every company, and
every production line. Moreover, it is still an accurate and effective measure
as the important source of competitive advantage. The performance meas-
urement of time-based approach is commonly used widely in the supply
chain performance measurement because time is stable and accurate in
measurement. In supply chain performance measurement, all management
levels are interested in time measurement such as lead-time, cycle time,
cash flow time, query time. (Sillanpää, 2010)
- Quantitative and qualitative measures
Chan (2003) presents SC performance measurement approach that consists
of qualitative and quantitative measures. Quantitative measures are identi-
fied with cost and resource utilization while qualitative measures are related
to quality, flexibility, visibility, trust and innovativeness.
Agami et al. (2011) suggests the future research directions on the performance
measurement system of supply chain for following perspectives:
- Dynamic and systematic framework development on both theoretical and
empirical approaches.
- Assessment and development of measures to fit strategic performance
- Development of a new maturity model supported by SCOR model to enable
benchmarking of performance measurement systems.
- Development of integration methodology to address the holistic performance
against the complex features of an engineering supply chain.
- Further elaboration from performance measurement to its implementation
and continuous improvement.
Information technology (IT) system is one of the most important infrastructures
in the engineering supply chain management because it can link the entire sup-
43
TURKU UNIVERSITY OF APPLIED SCIENCES THESIS | Kyung-Yeol Chun
ply chains together into a single integrated management unit. The use of sup-
porting IT system is vital for effective supply chain performance measurement
because the information technology system can support internal operations as
well as the collaboration between the supply chains by using advanced high-
technology network systems.
However, there also exist challenges on IT system for effective supporting of
performance measurement system in supply chain. The commercial CAD sys-
tems are commonly utilized in engineering supply chains and the database of
CAD system are normally shared among the supply chain networks for easy
access and exchange the modelling information. Problems through different
CAD systems and IT systems of supply chains can cause difficulties of transac-
tion of information, and further integration efforts are requested to share the
concurrent engineering information into the information flow lines. In viewpoint
of performance measurement of engineering supply chain, common information
systems as working tools is vital for achieving the effectiveness and efficiency of
supply chain management.
There are little relevant articles on performance measurement systems related
to engineering in the shipbuilding and offshore industry specifically. In general
terms, there are some articles on engineering in connection to manufacturing,
construction and research and development (R&D) environment (Chen, 2006).
Traditionally, engineering performance has been associated with time and cost
for service, and the production of design documents. Performance measure-
ments in engineering and design organization are very traditional, and no global
frameworks seem to be developed for this purpose. Also, it has been claimed
that the performance measures in engineering supply chain are fragmented,
and it is not easy to assess and measure the effect of the design and engineer-
ing process as a whole.
For the topic of a performance measurement in engineering supply chain, litera-
tures mostly focus on the processes and how to establish a performance meas-
urement system for the engineering supply chains. One of the most common
44
TURKU UNIVERSITY OF APPLIED SCIENCES THESIS | Kyung-Yeol Chun
measures to monitor the engineering performance is the amount of consumed
hours per document or per task or per service. However, these measures
emerge several identified weaknesses. For example, it is difficult to identify the
dedication and separation of the consumed hours among the current running
tasks and the corresponding documents to capture the correct data during the
several projects are processing in parallel (Georgy, 2005).
Some researchers claim that the importance of performance measurement is
overestimated in complex organizations because it is unable to reveal the light
problems if they are not supported by feedback, discussion and debate. This
debate contributes to the deficiency of research on performance measurement
for design and engineering supply chain in the context of complex products and
systems.
Recent performance measurement in engineering supply chain is mostly sub-
jective by the underlying processes of accumulated knowledge and experience
in the organization. They are not suitable to measure of performance as a basis
for improvement because the design and engineering processes are fragment-
ed in itself (Salter, 2003).
Because engineering and design services are largely based on intangible
knowledge-based processes that make them difficult to plan, manage measure
and improve. Performance measurement in engineering supply chain is domi-
nated by measurements that are easy to measure, and they are not what man-
agement considered critical for the design and engineering process (Johnsson,
2008).
As the highlighted challenges of the performance measurement in the design
and engineering supply chains, this case study research is focused more on the
performance of the production engineering process rather than the area of con-
cept development and feasibility engineering. This research approach minimiz-
es the highlighted deficiencies and opens the possibilities of further develop-
ment. Moreover, this case study research contributes to the possibilities to
overcome certain challenges in engineering supply chain performance meas-
45
TURKU UNIVERSITY OF APPLIED SCIENCES THESIS | Kyung-Yeol Chun
urement, with the proposed measurement framework of BSC+AHP module
concept approach.
46
TURKU UNIVERSITY OF APPLIED SCIENCES THESIS | Kyung-Yeol Chun
3 DEVELOPMENT OF PERFORMANCE MEASUREMENT FRAMEWORK FOR ENGINEERING SUPPLY CHAIN
This research case study pursues to improve the effectiveness of performance
measurement of the production engineering supply chain for the case Company
through systematic approach to supply chain performance measurement and
the corresponding managerial decision-making framework.
The methodology of performance measurement and their analysis is evaluated
by using multi-dimensional criteria decision-making tool of Analytic Hierarchy
Progress (AHP) of which purpose is to identify the relative priority weights for
each objective criterion.
The performance measurement criteria and measures and metrics are evaluat-
ed on the basis of the design coordinators’ experiences, observations and al-
ready existing data of the case company, while their relative priority weights are
calculated through AHP methodology. The performance measurement contexts
and the priority weights are to be discussed with the management for integra-
tion of the strategy and agreed with the supply chain networks for compliance
when the projects are started. The essential information of the literature review
of this thesis has been taken into account while structuring of the criteria and
metrics for the Analytical framework.
This analytical performance measurement framework contains the concept of
BSC approach in association with the selection of performance measurement
metrics and the analysis methodology is compiled on the basis of AHP theory.
The performance metrics of engineering supply chain has a complex and multi-
dimensional characteristics. In order to represent these features of the perfor-
mance measurement metrics, the concept of BSC Modules has been estab-
lished, and the performance metrics are transformed into the BSC module to
integrate the influences of each metrics thru AHP methodology.

47
TURKU UNIVERSITY OF APPLIED SCIENCES THESIS | Kyung-Yeol Chun
Finally, the solution proposal presents a framework of the decision-making crite-
ria with BSC modules for evaluating the performances of the engineering supply
chains continuously and dynamically.
3.1 Establishment of key metrics for SC Performance measurement
In this case study, key objective criteria is identified as a performance meas-
urement improvement in a production engineering supply chains. The key ob-
jective criteria of performance measurement have been established as the re-
sults of the literature review in association with the evaluation of the relevancies
to the engineering supply chain.
The case company outsources the most of detail design and engineering works
from the engineering supply chain network. Therefore, the performance of the
participating engineering supply chains affects the productivity of the case com-
pany significantly. Also, the management system of the case company affects
the performance of supply chains as well.
3.1.1 Metrics for order planning performance evaluation
- The service order entry method
The service order entry method determines the methods and extents to
which customer specifications and requirements are interpreted into infor-
mation agreed with the supply chains (Gunasekaran et al., 2001). Due to the
characteristic of engineering services that the order planning process usually
takes place when the service contracts are documented. It is important and
mandatory that the service order information should be passed down along
the supply chain, accurately, timely and effectively. Hence, the service order
entry method is vital as a metric of performance measurement of engineer-
ing supply chain.
- The service order lead-time (Total order cycle time)
48
TURKU UNIVERSITY OF APPLIED SCIENCES THESIS | Kyung-Yeol Chun
Service order lead-time identifies the periods between the time of receipt of
the order and the time of delivery of the finished products to the customer.
The savings in the order lead-time lead to improvements in service supply
chain response time, and improve the process efficiency. Therefore, order
lead-time takes a great importance in supply chain performance manage-
ment and it is an influencing performance measure and source of the com-
petitive process (Christopher, 1992).
- The service order path
The customer service order path defines a set of activities that need to de-
ploy the information of order to the organizational processes. By identifying
order path activities through the organizational process, the time spent in dif-
ferent processes and non-value adding activities can be identified. Then,
suitable steps of managerial actions can be taken to eliminate those activi-
ties of wastes in the process. A series of activities on planning order and the
identification of order steps and their processes can seriously affect the per-
formance of supply chain, and thus, it is vital as a metric of performance
measurement.
3.1.2 Metrics for managerial performance evaluation
In order to achieve the qualified services demanded by the customers, the cus-
tomers’ ability to link and to collaborate effectively and efficiently with supply
chains has become the issues of the supply chain management.
- Consideration on evaluation of supply chain performance
The performance of engineering supply chain is identified as the criteria of
productivity, quality, agility and customer satisfaction. Also, the performance
is measured and evaluated to fit with the strategic, operational and tactical
level. Moreover, the performance metrics needs to include the categories of
49
TURKU UNIVERSITY OF APPLIED SCIENCES THESIS | Kyung-Yeol Chun
financial, financial/non-financial, and non-financial, as the part of the im-
portant performance criteria.
• Strategic level measures include productivity, variation against budget,
total cash flow time, order lead-time, and delivery performance.
• Tactical level measures include accuracy of forecasting technique, sup-
plier cost saving initiative, delivery reliability, order entry method, effec-
tiveness of the master schedule, ability to respond to problems, respon-
siveness.
• Operational level measures include cost per operation unit, supplier re-
jection rate, capacity utilization, quality of delivery, and delivery reliability.
- Consideration on partnership in supply chain
Recently, a partnership between the buyer and supplier is the growing issue
in the supply chain. In this context, supply chain relationship management is
a vital part of supply chain performance evaluation. A partnership is a com-
prehensive approach to enhance the business cooperation as a business re-
lationship level, to improve coordination as a process level, and to increase
communication as information systems level, between the customers and its
supply chains. The partnership is realized with a direct and long-term rela-
tionship with mutual cooperative planning and collaborative problem solving
efforts. It is evident that those activities improve the effectiveness and effi-
ciency of supply chain in collaboration, quality, reliability, and innovation
simultaneously (Mettler and Rohner, 2009).
According the researchers, the criteria and parameters for evaluation of
partnership level in supply chain are summarized as (Thakkar et al., 2009);
- understanding on common business perspective and long-term growth
- confirming on productivity and delivery reliability
- sharing system and information
- sharing of risk and profit initiatives
- cooperation in innovation and growth
50
TURKU UNIVERSITY OF APPLIED SCIENCES THESIS | Kyung-Yeol Chun
- collaboration in problem solving efforts
3.1.3 Metrics for production performance evaluation
A production performance is the series of activities carried out by organizations
in supply chain, and their performance has a significant impact on production
cost, quality, delivery reliability, and competence of the customer. Also, the pro-
duction activities are the critical part of the total supply chain performance, and
in this context, the production performance is the essential part of the perfor-
mance and it needs to be measured and improved continuously.
Suitable metrics for the production level are recommended as follows:
- Product range of design and engineering
The manufacturers of a broad product range are likely to introduce new
products more slowly than the plants that have a narrow product range in
general. In viewpoint of value added per employee, speed and delivery reli-
ability, and total efficiency of the plants that can manufacture a wide range of
products are likely to have a less productivity. These phenomena clearly
present that the wide product range affects supply chain performance.
(Mapes et al., 1997). In this context, the same logic is evidently effective in
engineering supply chain performance. The engineering organization which
can produce wide range of engineering services should have sufficient
enough resources and facilities; otherwise, the added value per employee
will lead to less effective in performance than the strategically focused or-
ganization.
- Capacity utilization rates
According to Slack et al. (1995), resource capacity utilization affects the re-
sponsiveness and agility to customer demand through its impact on availa-
bility, lead-time and deliverability. In this context, it is evident that the rate of
participation resources by capacity of supply chain in planning and determin-

51
TURKU UNIVERSITY OF APPLIED SCIENCES THESIS | Kyung-Yeol Chun
ing of the activities is quite important parameter for the performance of sup-
ply chain.
- Effectiveness of scheduling techniques
A Planning and scheduling of order is defined the set of activities to allocate
the engineering resources to perform the tasks over a given time to achieve
the specific process objectives. Scheduling can have a significant impact on
capacity utilization, process performance and customer satisfaction. It de-
termines how the resources are to contribute effectively in the production
processes. The effectiveness of production schedule has an important im-
pact on production process in supply chain performance. A production
scheduling depends heavily on customer demands and performance of sup-
ply chain. In this context, the system and tools of the scheduling need to be
viewed in the viewpoint of supply chain performance (Little et al., 1995).
3.1.4 Metrics for progress performance evaluation
- Order fill rates
Turner and Bititci (1998) assert that the performance measuring approaches
lead to maintaining an internal control system and the reliability of order pro-
cesses eventually. Because of the importance of the uninterrupted perfor-
mance without any problems such as delay on delivery, unsatisfactory quali-
ty of the product and lack of fulfillment on requirements at the final delivery
stage, customers seek the confidence on the qualitative product with on-time
delivery to keep their production schedule successfully.
In the design and engineering service industries, the CAD system is a fun-
damental infrastructure for the engineering activities, and thus the sharing of
its database among the supply chains are essential for collaboration works.
The readiness percentage of production modelling in association with the
CAD system can provide tangible and reliable information on the perfor-
mance progress of the individual supply chain. In this context, the readiness
52
TURKU UNIVERSITY OF APPLIED SCIENCES THESIS | Kyung-Yeol Chun
and progress of modelling represent the order fill rates, and it is the vital part
of performance measurement and its evaluation.
- Earning rates (labor to cash cycle)
For a balanced approach against non-financial measures of order fill rates,
financial measures for the corresponding performance are earning perfor-
mance measures of supply chain. The earning rates are measured by the
variation of the budget, earned hours versus spent hours in production as
well as the frequency of issuing the invoices to convert the labor hours into
cash.
3.1.5 Metrics of delivery performance evaluation
The most important measure of delivery performance is on-time delivery. On-
time delivery support to determine how efficiently the delivery has met on
agreed time frame, and it is also a measure of customer service level (Stewart,
1995).
In engineering industries, the delivery of engineering product is completed by
uploading documents into the customer’s CAD system, and there are not physi-
cal logistic processes are involved such as location and vehicle speed.
- On time delivery
It is a measure the amount of finish goods or services delivered to custom-
ers on the right time, right place and right quality. This performance measure
helps to determine how efficiently the supply chains are keeping the cus-
tomer's expectation or predefined time frame.
The production master schedule defines the delivery date, time and condi-
tion with the preplanned agreement during the order stage. The gap be-
tween the actual result against the plan can be determined the delivery per-
formance, and the areas of discrepancy can be identified for further devel-
opment and improvement.
53
TURKU UNIVERSITY OF APPLIED SCIENCES THESIS | Kyung-Yeol Chun
- Delivery flexibility
In the field of design and engineering industry, there always exist the possi-
bilities of changes, and it leads to the change of processes or deliveries.
Moreover, the customers often request the delivery flexibility that can adapt
the changes due to the various environments for changing the design infor-
mation and the corresponding change orders. The various change environ-
ments refer to agility of supply chain in capturing a customer’s delivery re-
quirement. Flexibility and agility of delivery performance in supply chain evi-
dently influence the productivity of customer, and it is also selection criteria
in order process (Novich, 1990).
3.1.6 Metrics for quality service evaluation
The customer’s satisfaction is the most effective and successful strategy of the
supply chain and it refers to the metrics for quality service evaluation.
It has been emphasized that performance metrics must focus on customer sat-
isfaction in order to assess supply chain performance successfully with follow-
ing perspectives (van Hoek et al., 2001).
- Flexibility
Supply chain flexibility is identified as the ability to respond to the changes.
Flexibility of supply chain requires the ability to respond the changes without
increasing the customer’s operational cost and supply chain costs with no
delay in response time. The changes include the changes in requirements,
demand volume, prices, costs, conditions, or supply disruption. (Simchi-Levi,
2008)
- Responsiveness (Customer query time)
Responsiveness of supply chain is identified as the ability to respond proac-
tively within the required time scale to customer demand in order to keep the
competitive advantage. A rapid and accurate response to the customer’s
demands is essential for retaining customer’s satisfaction (Holweg, 2005).
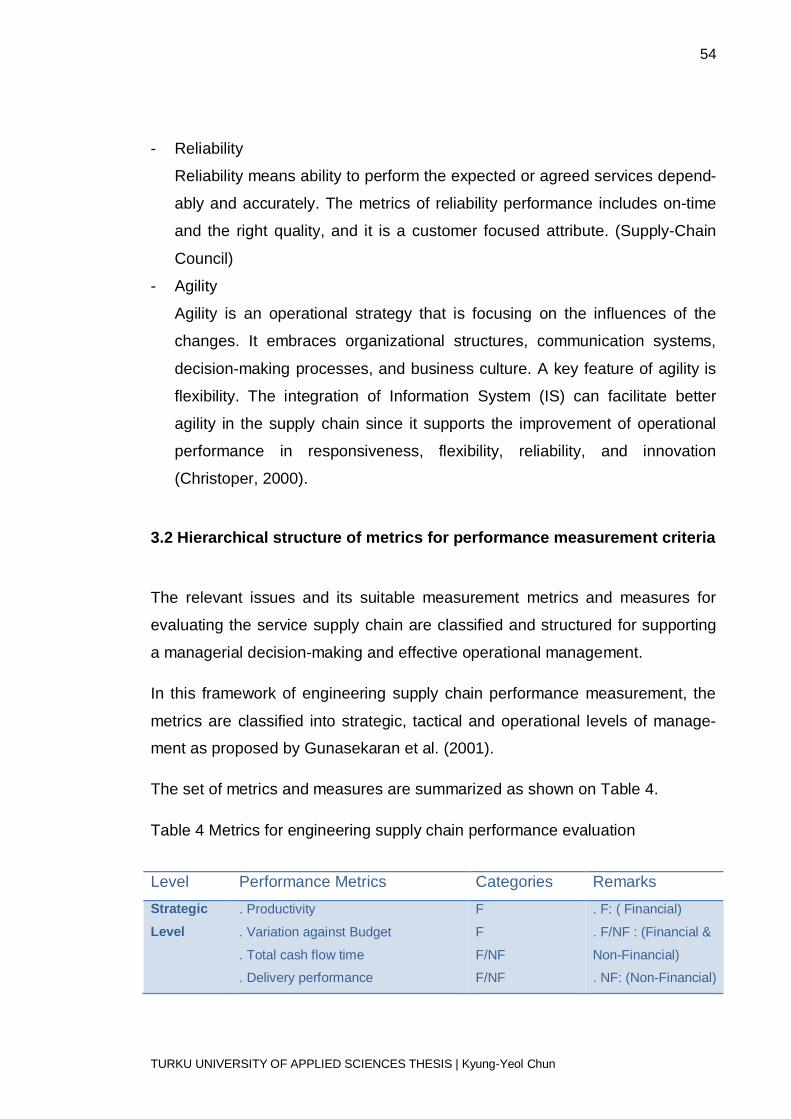
54
TURKU UNIVERSITY OF APPLIED SCIENCES THESIS | Kyung-Yeol Chun
- Reliability
Reliability means ability to perform the expected or agreed services depend-
ably and accurately. The metrics of reliability performance includes on-time
and the right quality, and it is a customer focused attribute. (Supply-Chain
Council)
- Agility
Agility is an operational strategy that is focusing on the influences of the
changes. It embraces organizational structures, communication systems,
decision-making processes, and business culture. A key feature of agility is
flexibility. The integration of Information System (IS) can facilitate better
agility in the supply chain since it supports the improvement of operational
performance in responsiveness, flexibility, reliability, and innovation
(Christoper, 2000).
3.2 Hierarchical structure of metrics for performance measurement criteria
The relevant issues and its suitable measurement metrics and measures for
evaluating the service supply chain are classified and structured for supporting
a managerial decision-making and effective operational management.
In this framework of engineering supply chain performance measurement, the
metrics are classified into strategic, tactical and operational levels of manage-
ment as proposed by Gunasekaran et al. (2001).
The set of metrics and measures are summarized as shown on Table 4.
Table 4 Metrics for engineering supply chain performance evaluation
Level Performance Metrics Categories Remarks Strategic Level
. Productivity
. Variation against Budget
. Total cash flow time
. Delivery performance
F
F
F/NF
F/NF
. F: ( Financial)
. F/NF : (Financial &
Non-Financial)
. NF: (Non-Financial)
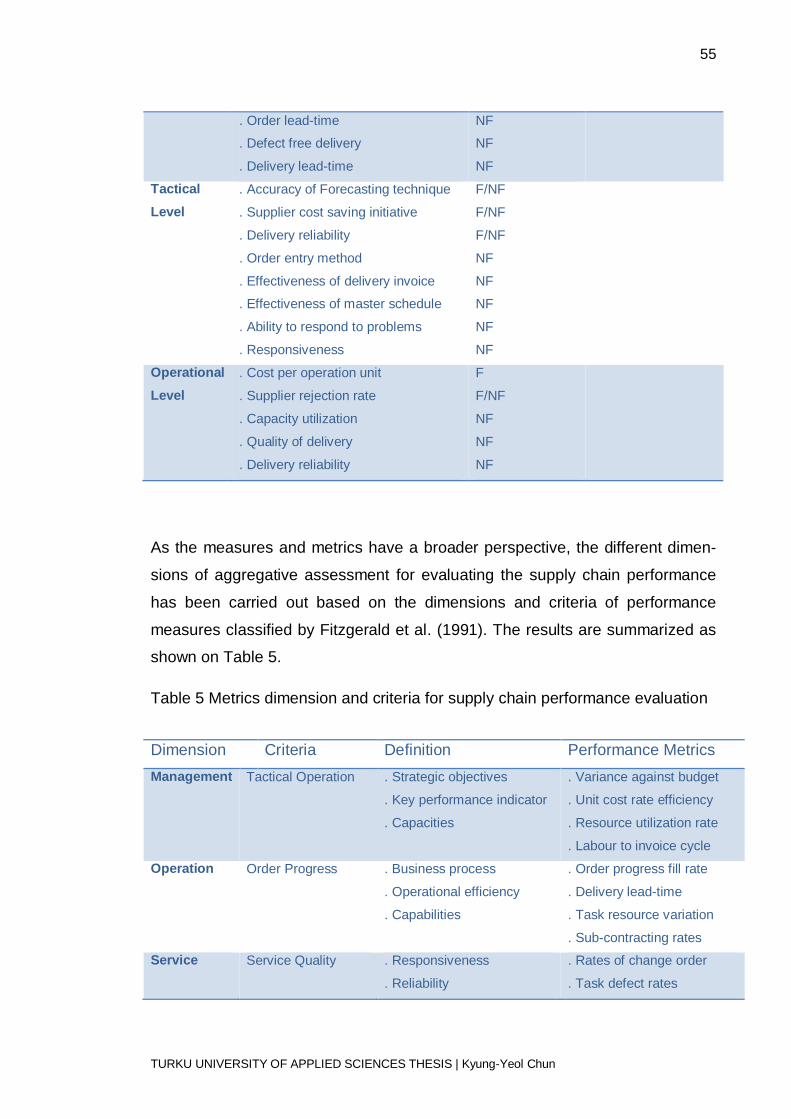
55
TURKU UNIVERSITY OF APPLIED SCIENCES THESIS | Kyung-Yeol Chun
. Order lead-time
. Defect free delivery
. Delivery lead-time
NF
NF
NF
Tactical Level
. Accuracy of Forecasting technique
. Supplier cost saving initiative
. Delivery reliability
. Order entry method
. Effectiveness of delivery invoice
. Effectiveness of master schedule
. Ability to respond to problems
. Responsiveness
F/NF
F/NF
F/NF
NF
NF
NF
NF
NF
Operational Level
. Cost per operation unit
. Supplier rejection rate
. Capacity utilization
. Quality of delivery
. Delivery reliability
F
F/NF
NF
NF
NF
As the measures and metrics have a broader perspective, the different dimen-
sions of aggregative assessment for evaluating the supply chain performance
has been carried out based on the dimensions and criteria of performance
measures classified by Fitzgerald et al. (1991). The results are summarized as
shown on Table 5.
Table 5 Metrics dimension and criteria for supply chain performance evaluation
Dimension Criteria Definition Performance Metrics Management Tactical Operation . Strategic objectives
. Key performance indicator
. Capacities
. Variance against budget
. Unit cost rate efficiency
. Resource utilization rate
. Labour to invoice cycle
Operation Order Progress . Business process
. Operational efficiency
. Capabilities
. Order progress fill rate
. Delivery lead-time
. Task resource variation
. Sub-contracting rates
Service Service Quality . Responsiveness
. Reliability
. Rates of change order
. Task defect rates
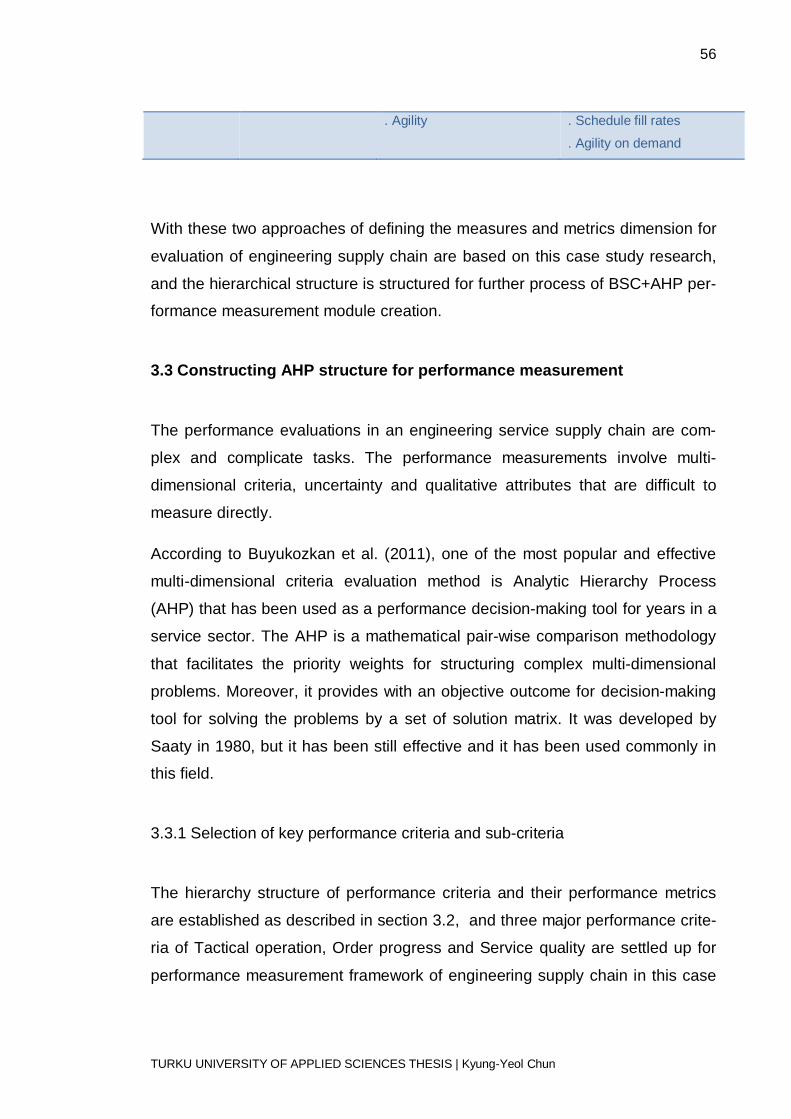
56
TURKU UNIVERSITY OF APPLIED SCIENCES THESIS | Kyung-Yeol Chun
. Agility . Schedule fill rates
. Agility on demand
With these two approaches of defining the measures and metrics dimension for
evaluation of engineering supply chain are based on this case study research,
and the hierarchical structure is structured for further process of BSC+AHP per-
formance measurement module creation.
3.3 Constructing AHP structure for performance measurement
The performance evaluations in an engineering service supply chain are com-
plex and complicate tasks. The performance measurements involve multi-
dimensional criteria, uncertainty and qualitative attributes that are difficult to
measure directly.
According to Buyukozkan et al. (2011), one of the most popular and effective
multi-dimensional criteria evaluation method is Analytic Hierarchy Process
(AHP) that has been used as a performance decision-making tool for years in a
service sector. The AHP is a mathematical pair-wise comparison methodology
that facilitates the priority weights for structuring complex multi-dimensional
problems. Moreover, it provides with an objective outcome for decision-making
tool for solving the problems by a set of solution matrix. It was developed by
Saaty in 1980, but it has been still effective and it has been used commonly in
this field.
3.3.1 Selection of key performance criteria and sub-criteria
The hierarchy structure of performance criteria and their performance metrics
are established as described in section 3.2, and three major performance crite-
ria of Tactical operation, Order progress and Service quality are settled up for
performance measurement framework of engineering supply chain in this case
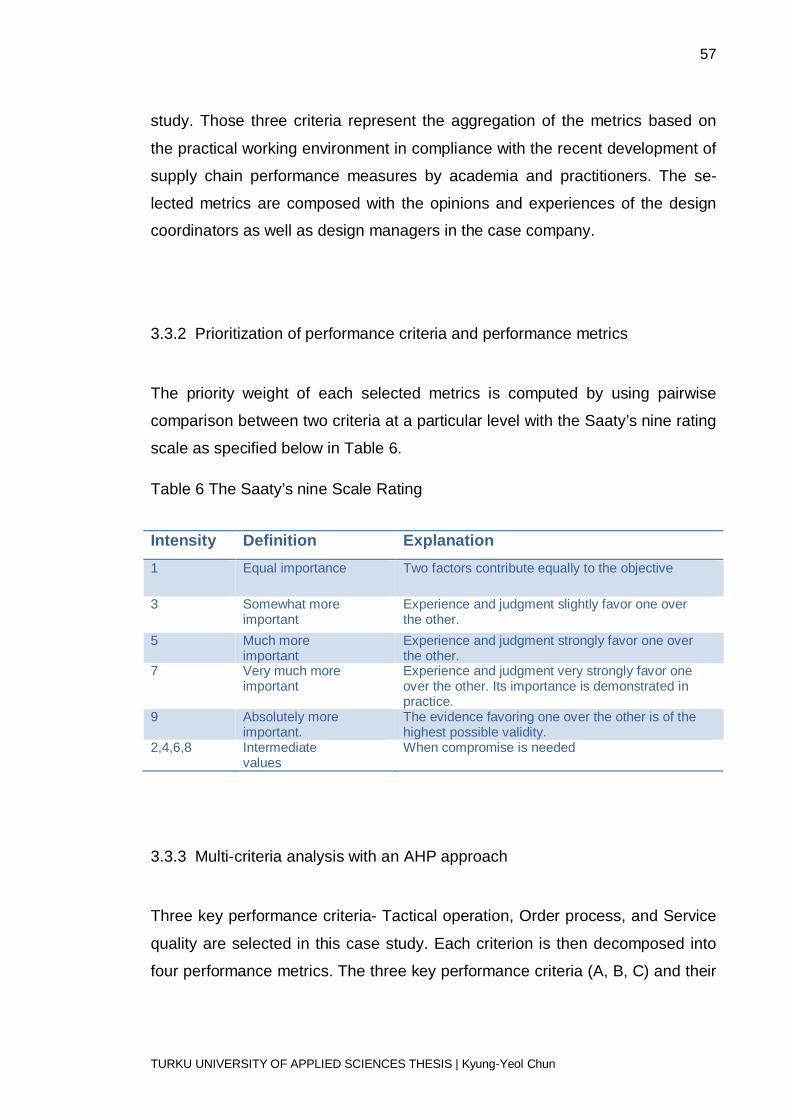
57
TURKU UNIVERSITY OF APPLIED SCIENCES THESIS | Kyung-Yeol Chun
study. Those three criteria represent the aggregation of the metrics based on
the practical working environment in compliance with the recent development of
supply chain performance measures by academia and practitioners. The se-
lected metrics are composed with the opinions and experiences of the design
coordinators as well as design managers in the case company.
3.3.2 Prioritization of performance criteria and performance metrics
The priority weight of each selected metrics is computed by using pairwise
comparison between two criteria at a particular level with the Saaty’s nine rating
scale as specified below in Table 6.
Table 6 The Saaty’s nine Scale Rating
Intensity Definition Explanation 1 Equal importance Two factors contribute equally to the objective
3 Somewhat more important
Experience and judgment slightly favor one over the other.
5 Much more important
Experience and judgment strongly favor one over the other.
7 Very much more important
Experience and judgment very strongly favor one over the other. Its importance is demonstrated in practice.
9 Absolutely more important.
The evidence favoring one over the other is of the highest possible validity.
2,4,6,8 Intermediate values
When compromise is needed
3.3.3 Multi-criteria analysis with an AHP approach
Three key performance criteria- Tactical operation, Order process, and Service
quality are selected in this case study. Each criterion is then decomposed into
four performance metrics. The three key performance criteria (A, B, C) and their
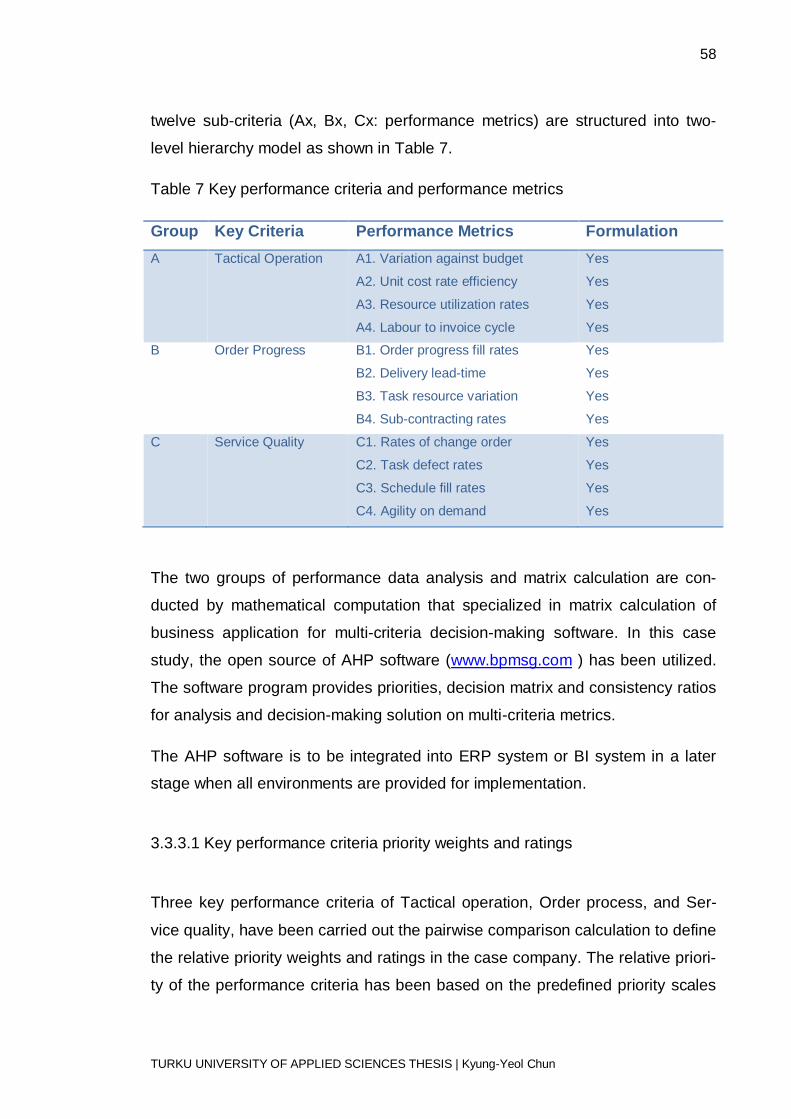
58
TURKU UNIVERSITY OF APPLIED SCIENCES THESIS | Kyung-Yeol Chun
twelve sub-criteria (Ax, Bx, Cx: performance metrics) are structured into two-
level hierarchy model as shown in Table 7.
Table 7 Key performance criteria and performance metrics
Group Key Criteria Performance Metrics Formulation A Tactical Operation A1. Variation against budget
A2. Unit cost rate efficiency
A3. Resource utilization rates
A4. Labour to invoice cycle
Yes
Yes
Yes
Yes
B Order Progress B1. Order progress fill rates
B2. Delivery lead-time
B3. Task resource variation
B4. Sub-contracting rates
Yes
Yes
Yes
Yes
C Service Quality C1. Rates of change order
C2. Task defect rates
C3. Schedule fill rates
C4. Agility on demand
Yes
Yes
Yes
Yes
The two groups of performance data analysis and matrix calculation are con-
ducted by mathematical computation that specialized in matrix calculation of
business application for multi-criteria decision-making software. In this case
study, the open source of AHP software (www.bpmsg.com ) has been utilized.
The software program provides priorities, decision matrix and consistency ratios
for analysis and decision-making solution on multi-criteria metrics.
The AHP software is to be integrated into ERP system or BI system in a later
stage when all environments are provided for implementation.
3.3.3.1 Key performance criteria priority weights and ratings
Three key performance criteria of Tactical operation, Order process, and Ser-
vice quality, have been carried out the pairwise comparison calculation to define
the relative priority weights and ratings in the case company. The relative priori-
ty of the performance criteria has been based on the predefined priority scales
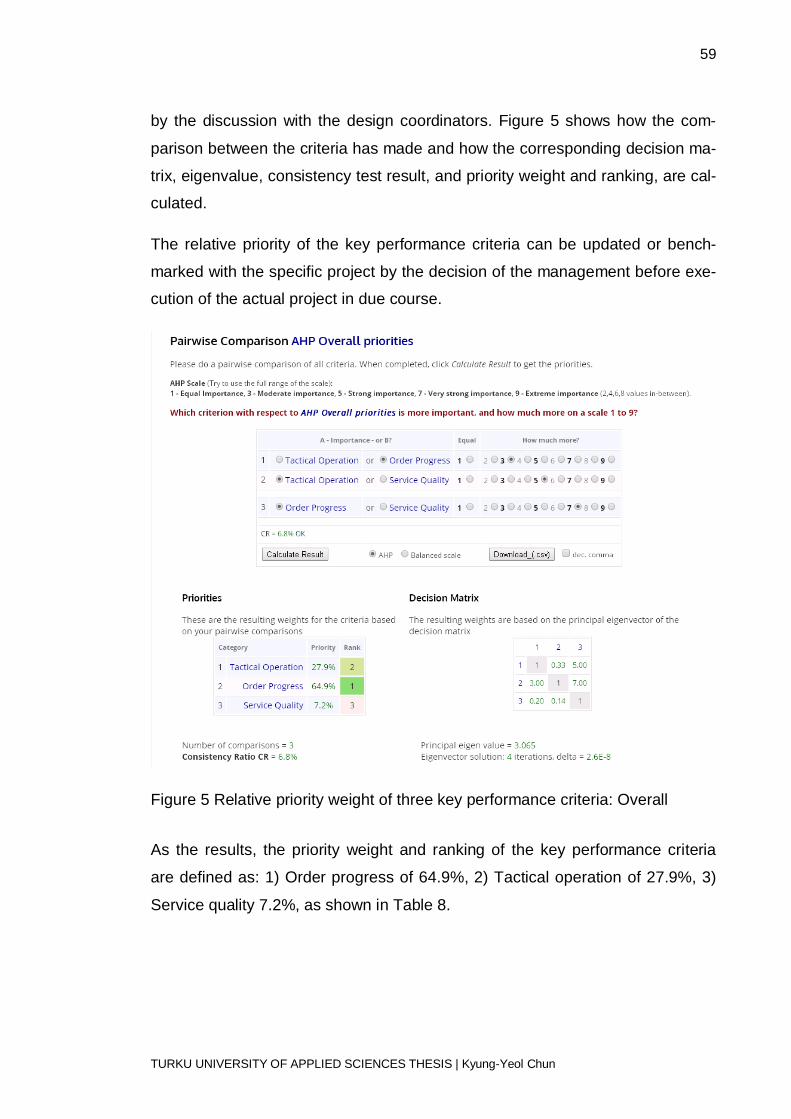
59
TURKU UNIVERSITY OF APPLIED SCIENCES THESIS | Kyung-Yeol Chun
by the discussion with the design coordinators. Figure 5 shows how the com-
parison between the criteria has made and how the corresponding decision ma-
trix, eigenvalue, consistency test result, and priority weight and ranking, are cal-
culated.
The relative priority of the key performance criteria can be updated or bench-
marked with the specific project by the decision of the management before exe-
cution of the actual project in due course.
Figure 5 Relative priority weight of three key performance criteria: Overall
As the results, the priority weight and ranking of the key performance criteria
are defined as: 1) Order progress of 64.9%, 2) Tactical operation of 27.9%, 3)
Service quality 7.2%, as shown in Table 8.
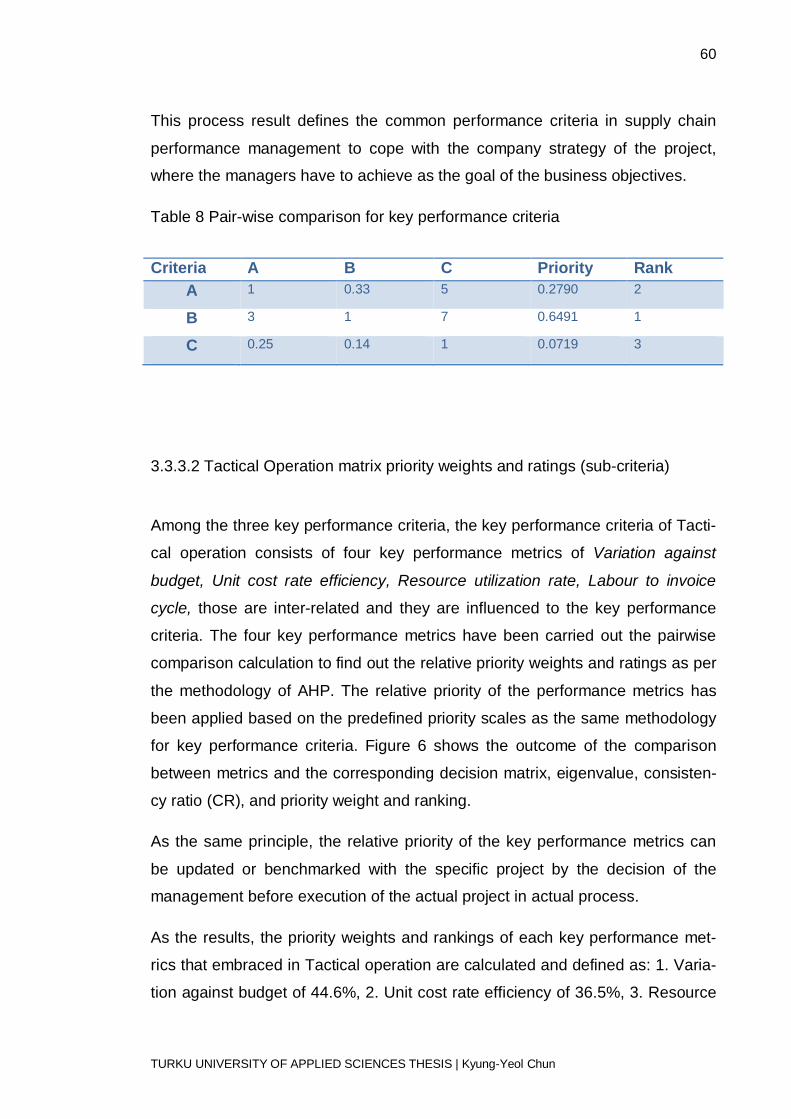
60
TURKU UNIVERSITY OF APPLIED SCIENCES THESIS | Kyung-Yeol Chun
This process result defines the common performance criteria in supply chain
performance management to cope with the company strategy of the project,
where the managers have to achieve as the goal of the business objectives.
Table 8 Pair-wise comparison for key performance criteria
Criteria A B C Priority Rank A 1 0.33 5 0.2790 2
B 3 1 7 0.6491 1
C 0.25 0.14 1 0.0719 3
3.3.3.2 Tactical Operation matrix priority weights and ratings (sub-criteria)
Among the three key performance criteria, the key performance criteria of Tacti-
cal operation consists of four key performance metrics of Variation against
budget, Unit cost rate efficiency, Resource utilization rate, Labour to invoice
cycle, those are inter-related and they are influenced to the key performance
criteria. The four key performance metrics have been carried out the pairwise
comparison calculation to find out the relative priority weights and ratings as per
the methodology of AHP. The relative priority of the performance metrics has
been applied based on the predefined priority scales as the same methodology
for key performance criteria. Figure 6 shows the outcome of the comparison
between metrics and the corresponding decision matrix, eigenvalue, consisten-
cy ratio (CR), and priority weight and ranking.
As the same principle, the relative priority of the key performance metrics can
be updated or benchmarked with the specific project by the decision of the
management before execution of the actual project in actual process.
As the results, the priority weights and rankings of each key performance met-
rics that embraced in Tactical operation are calculated and defined as: 1. Varia-
tion against budget of 44.6%, 2. Unit cost rate efficiency of 36.5%, 3. Resource

61
TURKU UNIVERSITY OF APPLIED SCIENCES THESIS | Kyung-Yeol Chun
utilization rate of 13.1%, and 4. Labour to invoice cycle of 5.8%, as shown in
Table 9 below.
This process result facilitates the common target of performance management
criteria for the managers (design coordinators in the case company) to cope
with the company strategy of the project, where the managers have to achieve
as the goal of the business objectives.
Figure 6 Relative priority weight of t performance “A”: Tactical Operation
Table 9 Pair-wise comparison for sub-attribute of Tactical Operation
Criteria A1 A2 A3 A4 Priority Rank
A1 1 2 3 5 0.4461 1
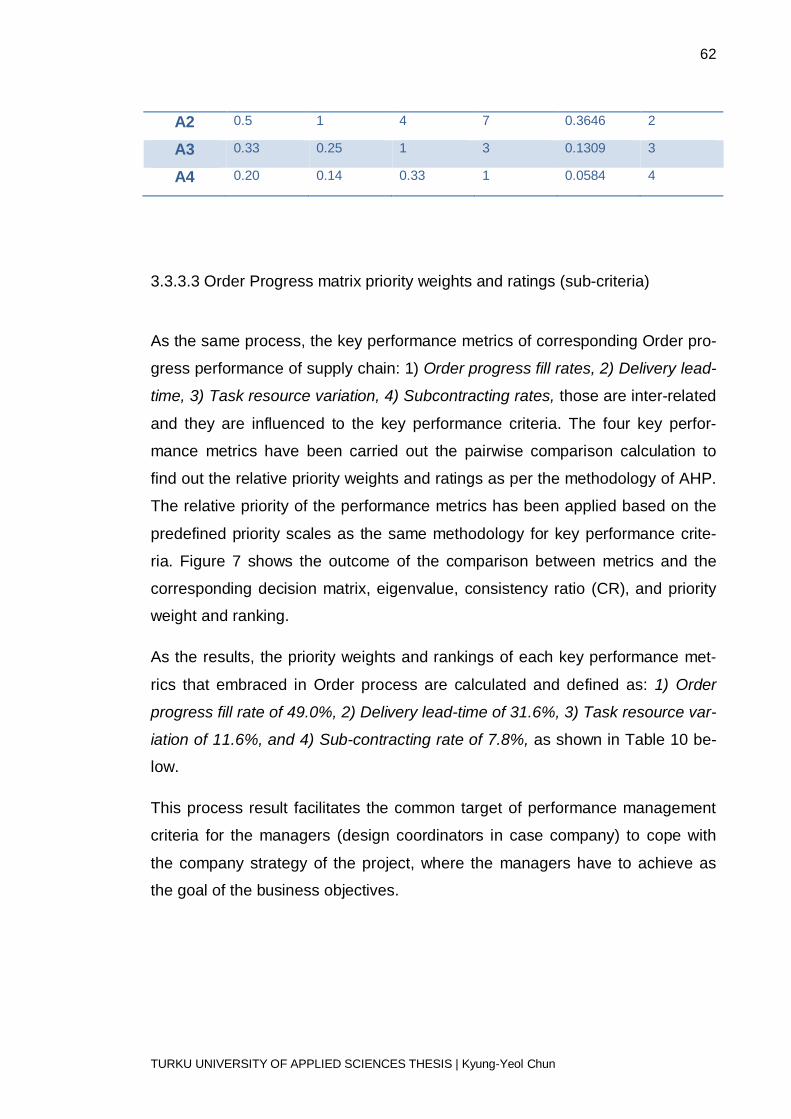
62
TURKU UNIVERSITY OF APPLIED SCIENCES THESIS | Kyung-Yeol Chun
A2 0.5 1 4 7 0.3646 2
A3 0.33 0.25 1 3 0.1309 3
A4 0.20 0.14 0.33 1 0.0584 4
3.3.3.3 Order Progress matrix priority weights and ratings (sub-criteria)
As the same process, the key performance metrics of corresponding Order pro-
gress performance of supply chain: 1) Order progress fill rates, 2) Delivery lead-
time, 3) Task resource variation, 4) Subcontracting rates, those are inter-related
and they are influenced to the key performance criteria. The four key perfor-
mance metrics have been carried out the pairwise comparison calculation to
find out the relative priority weights and ratings as per the methodology of AHP.
The relative priority of the performance metrics has been applied based on the
predefined priority scales as the same methodology for key performance crite-
ria. Figure 7 shows the outcome of the comparison between metrics and the
corresponding decision matrix, eigenvalue, consistency ratio (CR), and priority
weight and ranking.
As the results, the priority weights and rankings of each key performance met-
rics that embraced in Order process are calculated and defined as: 1) Order
progress fill rate of 49.0%, 2) Delivery lead-time of 31.6%, 3) Task resource var-
iation of 11.6%, and 4) Sub-contracting rate of 7.8%, as shown in Table 10 be-
low.
This process result facilitates the common target of performance management
criteria for the managers (design coordinators in case company) to cope with
the company strategy of the project, where the managers have to achieve as
the goal of the business objectives.
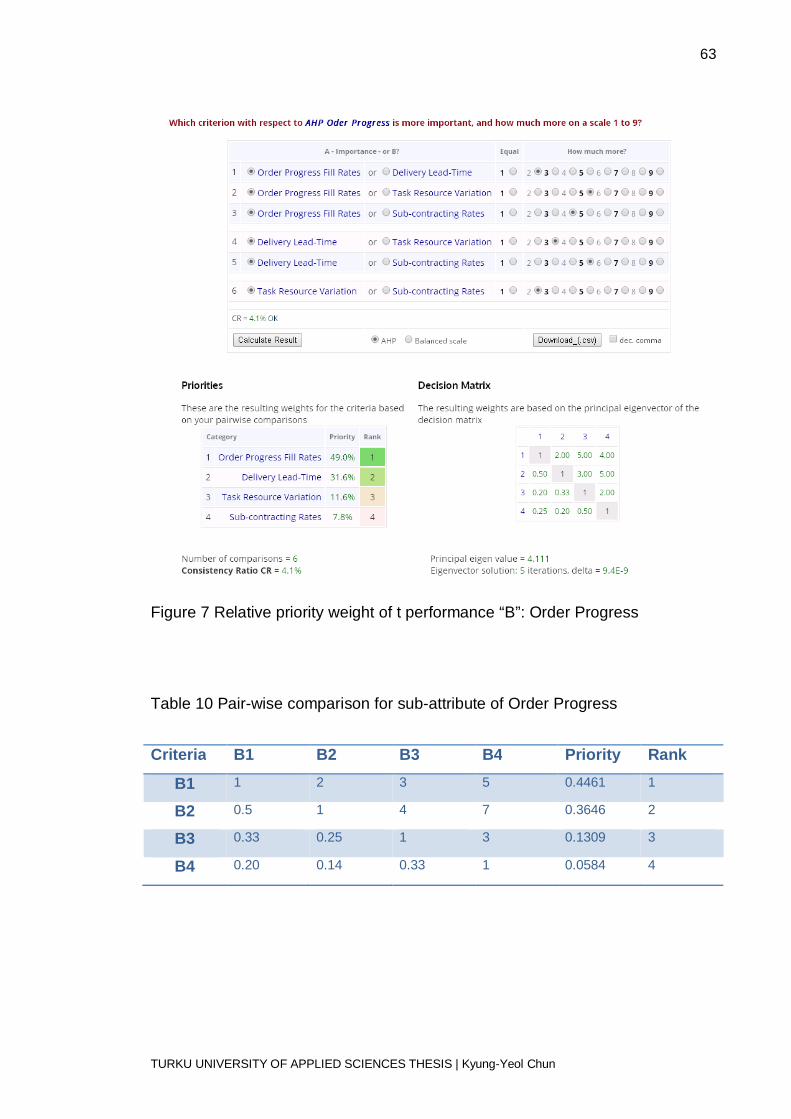
63
TURKU UNIVERSITY OF APPLIED SCIENCES THESIS | Kyung-Yeol Chun
Figure 7 Relative priority weight of t performance “B”: Order Progress
Table 10 Pair-wise comparison for sub-attribute of Order Progress
Criteria B1 B2 B3 B4 Priority Rank
B1 1 2 3 5 0.4461 1
B2 0.5 1 4 7 0.3646 2
B3 0.33 0.25 1 3 0.1309 3
B4 0.20 0.14 0.33 1 0.0584 4
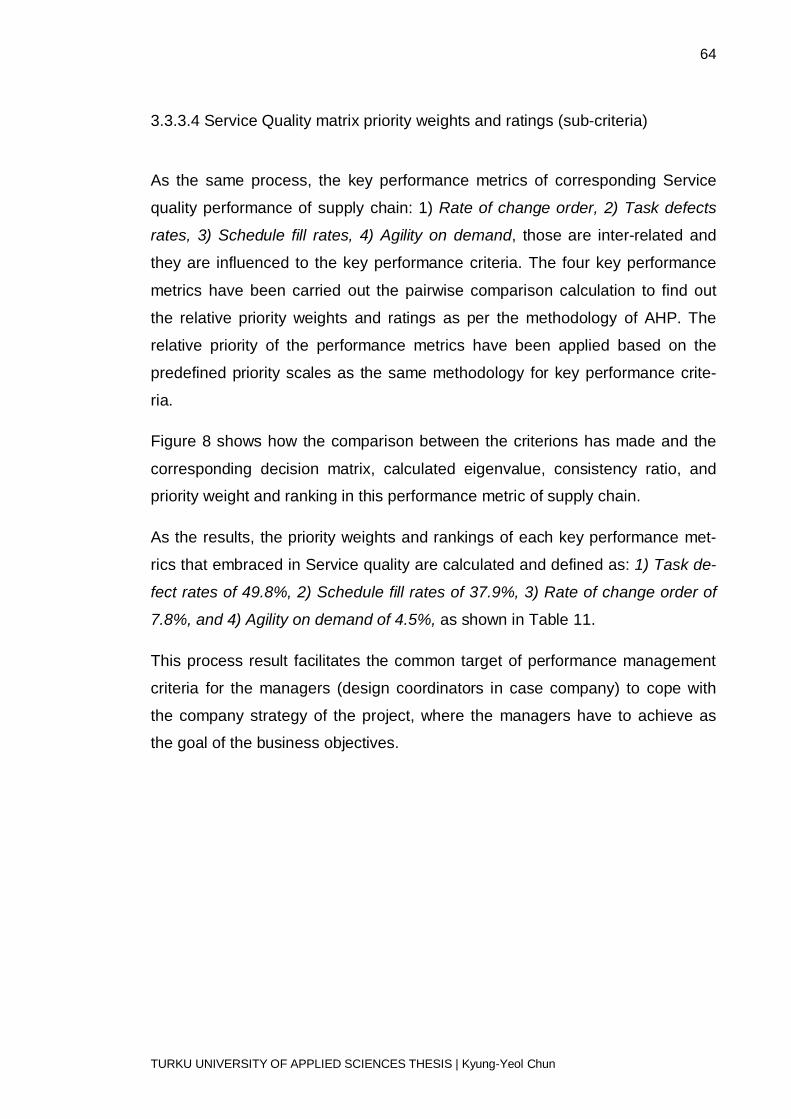
64
TURKU UNIVERSITY OF APPLIED SCIENCES THESIS | Kyung-Yeol Chun
3.3.3.4 Service Quality matrix priority weights and ratings (sub-criteria)
As the same process, the key performance metrics of corresponding Service
quality performance of supply chain: 1) Rate of change order, 2) Task defects
rates, 3) Schedule fill rates, 4) Agility on demand, those are inter-related and
they are influenced to the key performance criteria. The four key performance
metrics have been carried out the pairwise comparison calculation to find out
the relative priority weights and ratings as per the methodology of AHP. The
relative priority of the performance metrics have been applied based on the
predefined priority scales as the same methodology for key performance crite-
ria.
Figure 8 shows how the comparison between the criterions has made and the
corresponding decision matrix, calculated eigenvalue, consistency ratio, and
priority weight and ranking in this performance metric of supply chain.
As the results, the priority weights and rankings of each key performance met-
rics that embraced in Service quality are calculated and defined as: 1) Task de-
fect rates of 49.8%, 2) Schedule fill rates of 37.9%, 3) Rate of change order of
7.8%, and 4) Agility on demand of 4.5%, as shown in Table 11.
This process result facilitates the common target of performance management
criteria for the managers (design coordinators in case company) to cope with
the company strategy of the project, where the managers have to achieve as
the goal of the business objectives.
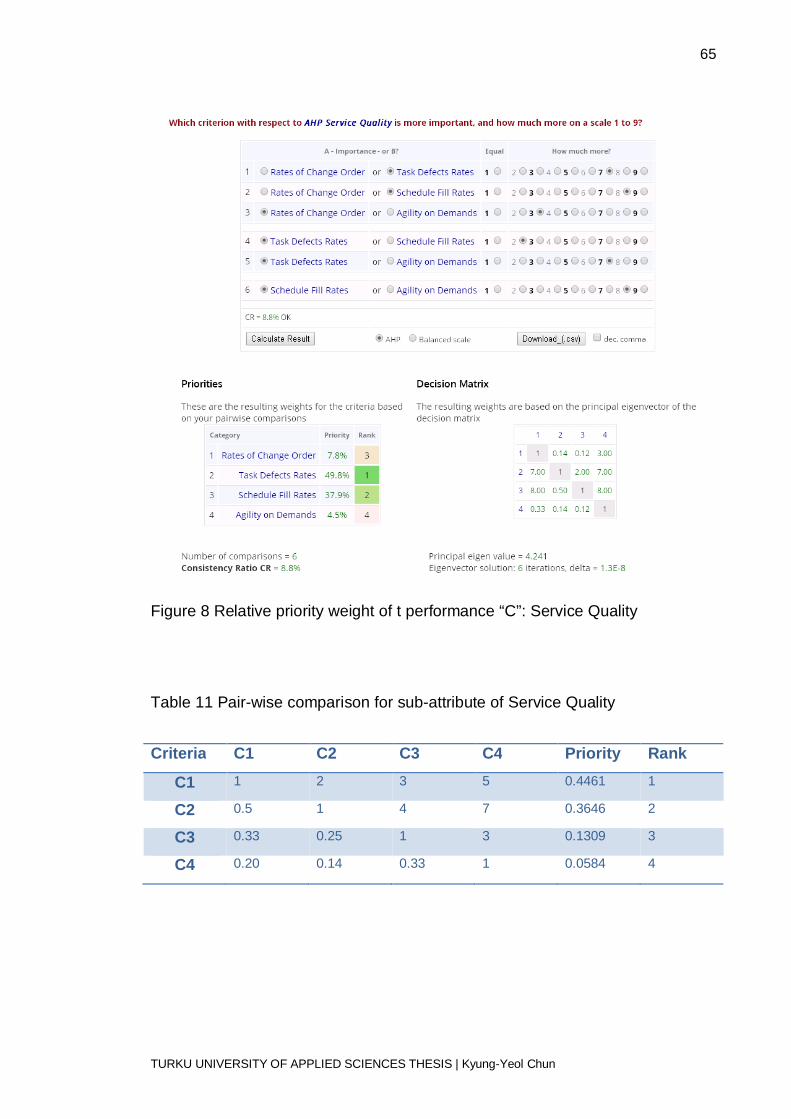
65
TURKU UNIVERSITY OF APPLIED SCIENCES THESIS | Kyung-Yeol Chun
Figure 8 Relative priority weight of t performance “C”: Service Quality
Table 11 Pair-wise comparison for sub-attribute of Service Quality
Criteria C1 C2 C3 C4 Priority Rank
C1 1 2 3 5 0.4461 1
C2 0.5 1 4 7 0.3646 2
C3 0.33 0.25 1 3 0.1309 3
C4 0.20 0.14 0.33 1 0.0584 4
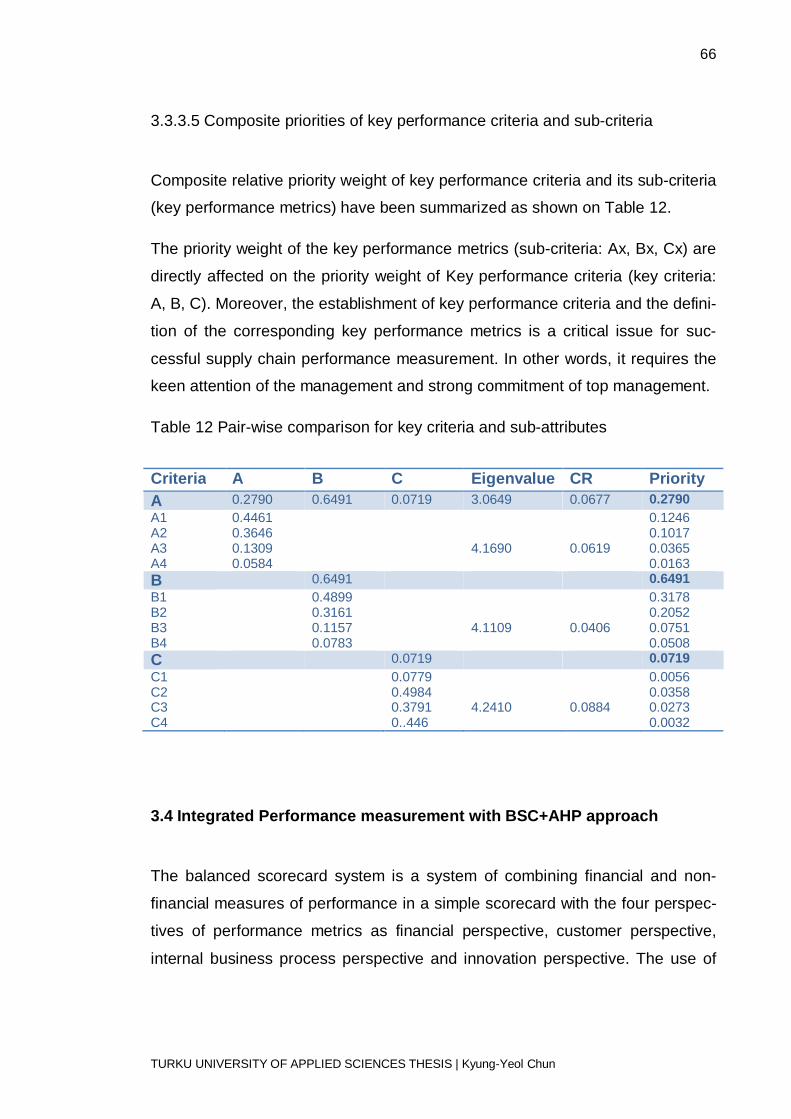
66
TURKU UNIVERSITY OF APPLIED SCIENCES THESIS | Kyung-Yeol Chun
3.3.3.5 Composite priorities of key performance criteria and sub-criteria
Composite relative priority weight of key performance criteria and its sub-criteria
(key performance metrics) have been summarized as shown on Table 12.
The priority weight of the key performance metrics (sub-criteria: Ax, Bx, Cx) are
directly affected on the priority weight of Key performance criteria (key criteria:
A, B, C). Moreover, the establishment of key performance criteria and the defini-
tion of the corresponding key performance metrics is a critical issue for suc-
cessful supply chain performance measurement. In other words, it requires the
keen attention of the management and strong commitment of top management.
Table 12 Pair-wise comparison for key criteria and sub-attributes
Criteria A B C Eigenvalue CR Priority A 0.2790 0.6491 0.0719 3.0649 0.0677 0.2790 A1 A2 A3 A4
0.4461 0.3646 0.1309 0.0584
4.1690
0.0619
0.1246 0.1017 0.0365 0.0163
B 0.6491 0.6491 B1 B2 B3 B4
0.4899 0.3161 0.1157 0.0783
4.1109
0.0406
0.3178 0.2052 0.0751 0.0508
C 0.0719 0.0719 C1 C2 C3 C4
0.0779 0.4984 0.3791 0..446
4.2410
0.0884
0.0056 0.0358 0.0273 0.0032
3.4 Integrated Performance measurement with BSC+AHP approach
The balanced scorecard system is a system of combining financial and non-
financial measures of performance in a simple scorecard with the four perspec-
tives of performance metrics as financial perspective, customer perspective,
internal business process perspective and innovation perspective. The use of

67
TURKU UNIVERSITY OF APPLIED SCIENCES THESIS | Kyung-Yeol Chun
the balanced scorecard improves managerial decision making by aligning per-
formance measures with the business objectives of goals and its strategies.
The balanced scorecard focuses on the business processes and outcomes, and
it is considered as a tool to support strategy formulation, implementation, and
communication. Moreover, it also supports in monitoring the performance and
facilitates information for managerial decision-making. In this context, the bal-
anced scorecard provides organizations with the improvement of an effective
performance management and the better implementation of the strategic objec-
tives.
Evidently, the performance measurement is vital for effective planning and con-
trol as well as efficient management of the organization. The balanced score-
card is a strategic planning and management system which is aligning the activ-
ities and strategies of the organization for their continuous improvement of op-
erational performance.
In this context, this case study research proposes an approach of the balanced
scorecard framework by implementation of AHP methodology to evaluate the
supply chain performance in their daily business performances. It has been de-
signed that the managers can take the benefits at all decision levels from a sys-
tematic framework based on the criteria and measures that have been prede-
fined and agreed in advance.
It is evident that the balanced scorecard system with the analytic hierarchy pro-
cess (AHP) approach has the following competitive advantages in performance
measurement of supply chain including:
- The BSC is a comprehensive system to understand the target of customers,
their requirements, the business processes, and the performance gaps.
- The BSC is capable of articulating the strategy implementation with the
business excellence that requires the qualitative objectives.
- The AHP provides logic for evaluating intangible and qualitative measures
that were difficult to deal with the traditional performance measurement sys-
tems.
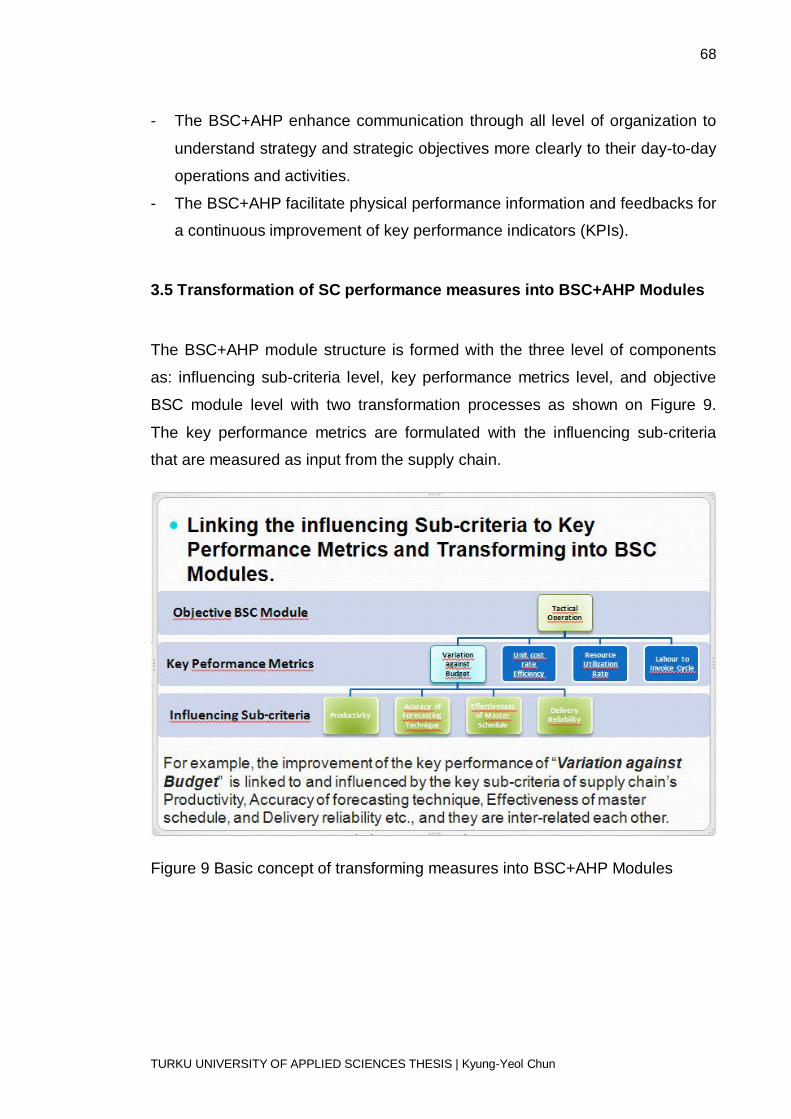
68
TURKU UNIVERSITY OF APPLIED SCIENCES THESIS | Kyung-Yeol Chun
- The BSC+AHP enhance communication through all level of organization to
understand strategy and strategic objectives more clearly to their day-to-day
operations and activities.
- The BSC+AHP facilitate physical performance information and feedbacks for
a continuous improvement of key performance indicators (KPIs).
3.5 Transformation of SC performance measures into BSC+AHP Modules
The BSC+AHP module structure is formed with the three level of components
as: influencing sub-criteria level, key performance metrics level, and objective
BSC module level with two transformation processes as shown on Figure 9.
The key performance metrics are formulated with the influencing sub-criteria
that are measured as input from the supply chain.
Figure 9 Basic concept of transforming measures into BSC+AHP Modules
69
TURKU UNIVERSITY OF APPLIED SCIENCES THESIS | Kyung-Yeol Chun
The formulations of each objective BSC+AHP modules are defined as follows.
3.5.1 Formulation of Tactical Operation- [BSC-SCPM-TO Module: “A”]
A1. Variation against Budget(= Spent Hours/Budget Hours)
A2. Unit Cost Rate Efficiency(= Invoiced €/Spent Hours)
A3. Resource Utilization Rate(=Spent Hours /No. of Engineers )
A4. Labour to Invoice Cycle(=Actual Invoice €/Planned Invoice €)
The Tactical operation module is derived from the key performance metrics of
strategic objectives and organizational capacities which are linked or interrelat-
ed to the relevant influencing sub-criteria.
This module is mainly related to the performance of strategic management of
the supply chain with the focusing on the financial performances.
3.5.2 Formulation of Order Process- [BSC-SCPM-OP Module: “B”]
B1. Order Progress Fill rate (=Actual POC %/Planned POC %)
B2. Delivery Lead-Time (=Remained Hours/Available Hours)
B3. Task Resource variation (=Working Engineers/Planned Engineers)
B4. Subcontracting Rate (=Subcontracting Hours/Total Hours)
*Subcontracting Hours;(2nd Layer: Kf=0.7, 3rd Layer: Kf=0.5)/Total
Hours)
The Order Progress module is derived from the key performance metrics of
business process objectives, operational efficiencies, and capabilities that are
linked or interrelated to the relevant influencing sub-criteria.
This module represents a performance of the organizational business process
in supply chain with the focusing on the productivities and efficiencies of opera-
tional performances.
70
TURKU UNIVERSITY OF APPLIED SCIENCES THESIS | Kyung-Yeol Chun
3.5.3 Formulation of Service Quality- [BSC-SCPM-SQ Module: “C”]
C1. Fill Rate of Change Order (= Approved Hours/Requested Hours)
C2. Task Defect Rates (= Current Changes/Previous Changes)
*Number of Changes/Comments/Remarks in association with the
change management system of the case company ‘JIRA System’
C3. Schedule Fill Rates (=Delayed / Planned Documents)
C4. Agility on Demand variation (=Scale 1 to 10)
*Client Response Time. *Information Sharing Management.
*Capability of Solving Technical/Commercial Problem.
The Service Quality module is derived from the key performance metrics of re-
sponsiveness, reliability, and agility which are linked or interrelated to the rele-
vant influencing sub-criteria.
This module represents a performance of the organizational capabilities and
partnership management in supply chain. This module is focusing on the busi-
ness competitiveness as the perception of customer satisfaction.
3.6 Development of integrated BSC+AHP Modules
The key performance metrics have been developed with an assignment of the
relevant priority weight to represent overall performance level of supply chain.
The outcomes are transformed to balanced scorecard modules to display the
holistic feature of the supply chain performance in the form of key performance
indicators (KPIs).
The structure of the key performance criteria and corresponding key perfor-
mance metric are defined respectively in the subsection 3.3.3.1, 3.3.3.2,
3.3.3.3, and 3.3.3.4.
Each objective module has the key criteria and sub-criteria of the specific per-
formance measures, and they are formulated mathematically to figure out the
influences on the specific performance. The details of performance metrics for-
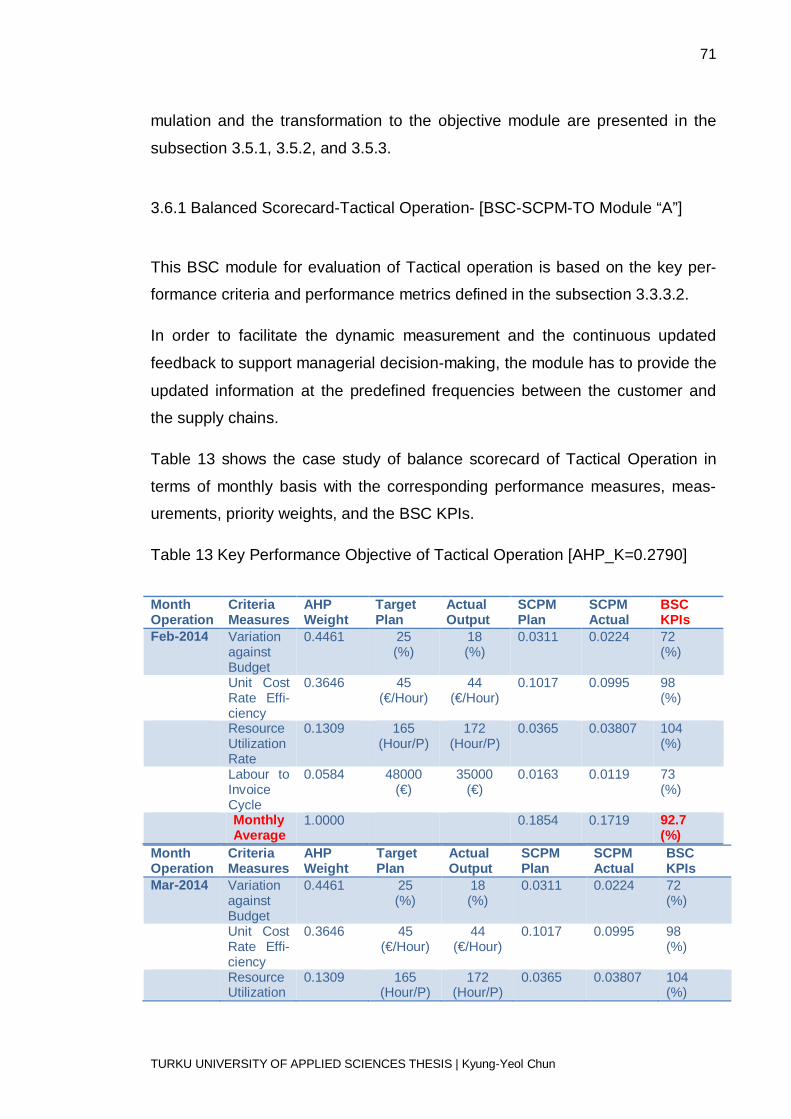
71
TURKU UNIVERSITY OF APPLIED SCIENCES THESIS | Kyung-Yeol Chun
mulation and the transformation to the objective module are presented in the
subsection 3.5.1, 3.5.2, and 3.5.3.
3.6.1 Balanced Scorecard-Tactical Operation- [BSC-SCPM-TO Module “A”]
This BSC module for evaluation of Tactical operation is based on the key per-
formance criteria and performance metrics defined in the subsection 3.3.3.2.
In order to facilitate the dynamic measurement and the continuous updated
feedback to support managerial decision-making, the module has to provide the
updated information at the predefined frequencies between the customer and
the supply chains.
Table 13 shows the case study of balance scorecard of Tactical Operation in
terms of monthly basis with the corresponding performance measures, meas-
urements, priority weights, and the BSC KPIs.
Table 13 Key Performance Objective of Tactical Operation [AHP_K=0.2790]
Month Operation
Criteria Measures
AHP Weight
Target Plan
Actual Output
SCPM Plan
SCPM Actual
BSC KPIs
Feb-2014 Variation against Budget
0.4461 25 (%)
18 (%)
0.0311 0.0224 72 (%)
Unit Cost Rate Effi-ciency
0.3646 45 (€/Hour)
44 (€/Hour)
0.1017 0.0995 98 (%)
Resource Utilization Rate
0.1309 165 (Hour/P)
172 (Hour/P)
0.0365 0.03807 104 (%)
Labour to Invoice Cycle
0.0584 48000 (€)
35000 (€)
0.0163 0.0119 73 (%)
Monthly Average
1.0000 0.1854 0.1719 92.7 (%)
Month Operation
Criteria Measures
AHP Weight
Target Plan
Actual Output
SCPM Plan
SCPM Actual
BSC KPIs
Mar-2014 Variation against Budget
0.4461 25 (%)
18 (%)
0.0311 0.0224 72 (%)
Unit Cost Rate Effi-ciency
0.3646 45 (€/Hour)
44 (€/Hour)
0.1017 0.0995 98 (%)
Resource Utilization
0.1309 165 (Hour/P)
172 (Hour/P)
0.0365 0.03807 104 (%)
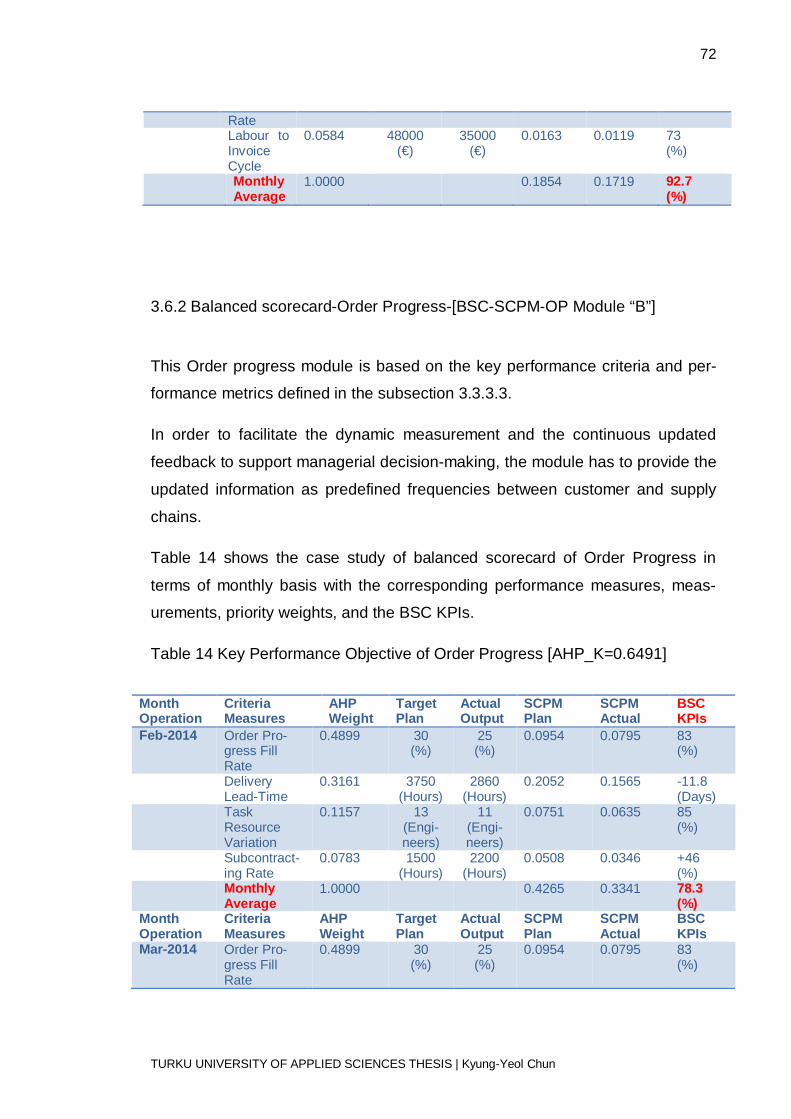
72
TURKU UNIVERSITY OF APPLIED SCIENCES THESIS | Kyung-Yeol Chun
Rate Labour to
Invoice Cycle
0.0584 48000 (€)
35000 (€)
0.0163 0.0119 73 (%)
Monthly Average
1.0000 0.1854 0.1719 92.7 (%)
3.6.2 Balanced scorecard-Order Progress-[BSC-SCPM-OP Module “B”]
This Order progress module is based on the key performance criteria and per-
formance metrics defined in the subsection 3.3.3.3.
In order to facilitate the dynamic measurement and the continuous updated
feedback to support managerial decision-making, the module has to provide the
updated information as predefined frequencies between customer and supply
chains.
Table 14 shows the case study of balanced scorecard of Order Progress in
terms of monthly basis with the corresponding performance measures, meas-
urements, priority weights, and the BSC KPIs.
Table 14 Key Performance Objective of Order Progress [AHP_K=0.6491]
Month Operation
Criteria Measures
AHP Weight
Target Plan
Actual Output
SCPM Plan
SCPM Actual
BSC KPIs
Feb-2014 Order Pro-gress Fill Rate
0.4899 30 (%)
25 (%)
0.0954 0.0795 83 (%)
Delivery Lead-Time
0.3161 3750 (Hours)
2860 (Hours)
0.2052 0.1565 -11.8 (Days)
Task Resource Variation
0.1157 13 (Engi-neers)
11 (Engi-neers)
0.0751 0.0635 85 (%)
Subcontract-ing Rate
0.0783 1500 (Hours)
2200 (Hours)
0.0508 0.0346 +46 (%)
Monthly Average
1.0000 0.4265 0.3341 78.3 (%)
Month Operation
Criteria Measures
AHP Weight
Target Plan
Actual Output
SCPM Plan
SCPM Actual
BSC KPIs
Mar-2014 Order Pro-gress Fill Rate
0.4899 30 (%)
25 (%)
0.0954 0.0795 83 (%)
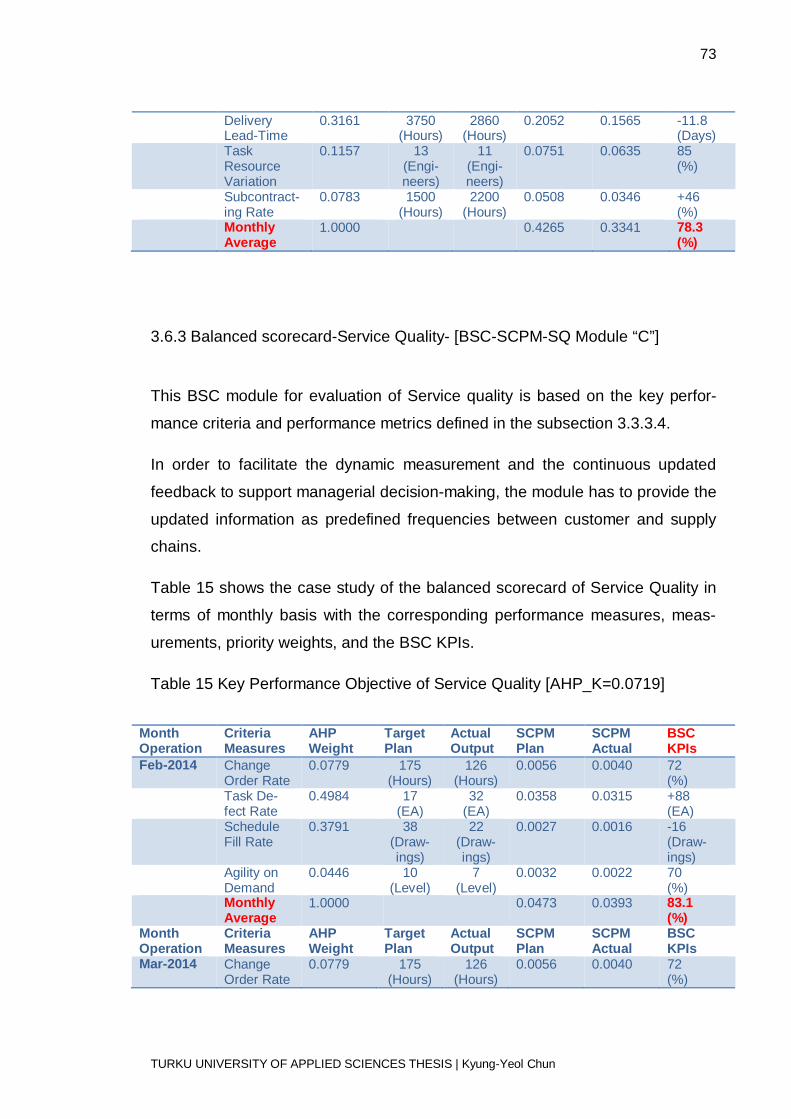
73
TURKU UNIVERSITY OF APPLIED SCIENCES THESIS | Kyung-Yeol Chun
Delivery Lead-Time
0.3161 3750 (Hours)
2860 (Hours)
0.2052 0.1565 -11.8 (Days)
Task Resource Variation
0.1157 13 (Engi-neers)
11 (Engi-neers)
0.0751 0.0635 85 (%)
Subcontract-ing Rate
0.0783 1500 (Hours)
2200 (Hours)
0.0508 0.0346 +46 (%)
Monthly Average
1.0000 0.4265 0.3341 78.3 (%)
3.6.3 Balanced scorecard-Service Quality- [BSC-SCPM-SQ Module “C”]
This BSC module for evaluation of Service quality is based on the key perfor-
mance criteria and performance metrics defined in the subsection 3.3.3.4.
In order to facilitate the dynamic measurement and the continuous updated
feedback to support managerial decision-making, the module has to provide the
updated information as predefined frequencies between customer and supply
chains.
Table 15 shows the case study of the balanced scorecard of Service Quality in
terms of monthly basis with the corresponding performance measures, meas-
urements, priority weights, and the BSC KPIs.
Table 15 Key Performance Objective of Service Quality [AHP_K=0.0719]
Month Operation
Criteria Measures
AHP Weight
Target Plan
Actual Output
SCPM Plan
SCPM Actual
BSC KPIs
Feb-2014 Change Order Rate
0.0779 175 (Hours)
126 (Hours)
0.0056 0.0040 72 (%)
Task De-fect Rate
0.4984 17 (EA)
32 (EA)
0.0358 0.0315 +88 (EA)
Schedule Fill Rate
0.3791 38 (Draw-ings)
22 (Draw-ings)
0.0027 0.0016 -16 (Draw-ings)
Agility on Demand
0.0446 10 (Level)
7 (Level)
0.0032 0.0022 70 (%)
Monthly Average
1.0000 0.0473 0.0393 83.1 (%)
Month Operation
Criteria Measures
AHP Weight
Target Plan
Actual Output
SCPM Plan
SCPM Actual
BSC KPIs
Mar-2014 Change Order Rate
0.0779 175 (Hours)
126 (Hours)
0.0056 0.0040 72 (%)
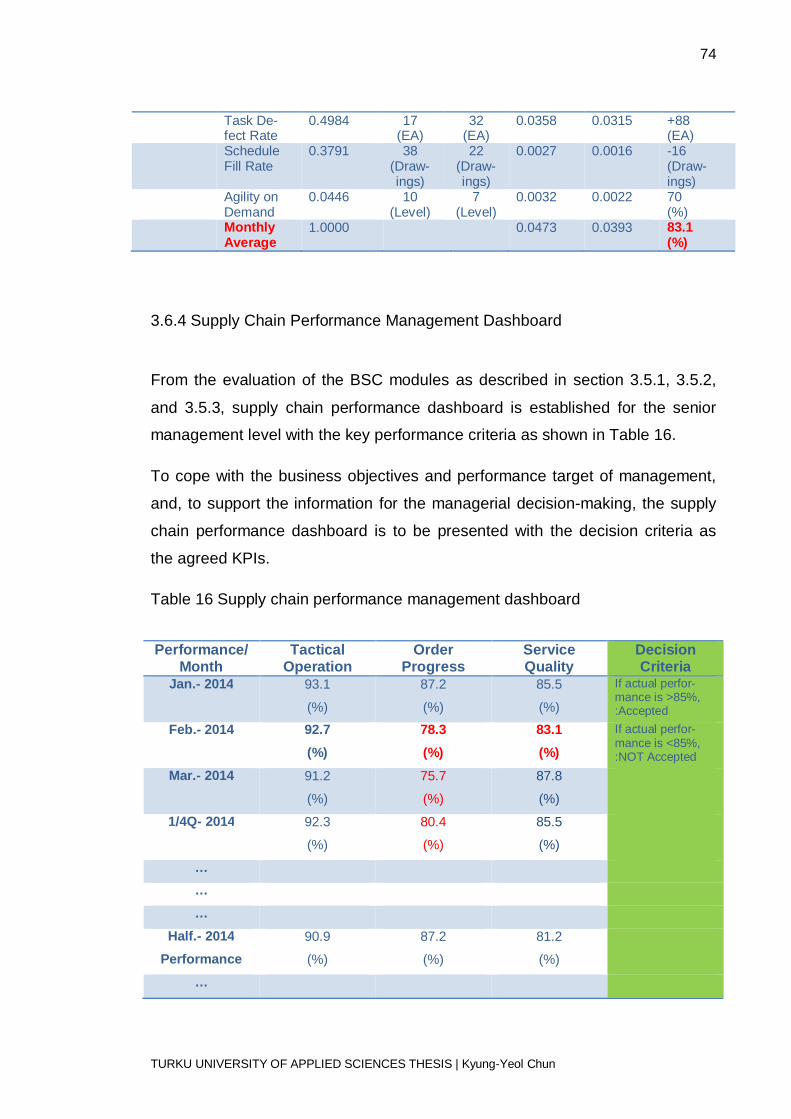
74
TURKU UNIVERSITY OF APPLIED SCIENCES THESIS | Kyung-Yeol Chun
Task De-fect Rate
0.4984 17 (EA)
32 (EA)
0.0358 0.0315 +88 (EA)
Schedule Fill Rate
0.3791 38 (Draw-ings)
22 (Draw-ings)
0.0027 0.0016 -16 (Draw-ings)
Agility on Demand
0.0446 10 (Level)
7 (Level)
0.0032 0.0022 70 (%)
Monthly Average
1.0000 0.0473 0.0393 83.1 (%)
3.6.4 Supply Chain Performance Management Dashboard
From the evaluation of the BSC modules as described in section 3.5.1, 3.5.2,
and 3.5.3, supply chain performance dashboard is established for the senior
management level with the key performance criteria as shown in Table 16.
To cope with the business objectives and performance target of management,
and, to support the information for the managerial decision-making, the supply
chain performance dashboard is to be presented with the decision criteria as
the agreed KPIs.
Table 16 Supply chain performance management dashboard
Performance/ Month
Tactical Operation
Order Progress
Service Quality
Decision Criteria
Jan.- 2014 93.1
(%)
87.2
(%)
85.5
(%)
If actual perfor-mance is >85%, :Accepted
Feb.- 2014 92.7 (%)
78.3 (%)
83.1 (%)
If actual perfor-mance is <85%, :NOT Accepted
Mar.- 2014 91.2
(%)
75.7
(%)
87.8
(%)
1/4Q- 2014 92.3
(%)
80.4
(%)
85.5
(%)
…
…
…
Half.- 2014 Performance
90.9
(%)
87.2
(%)
81.2
(%)
…
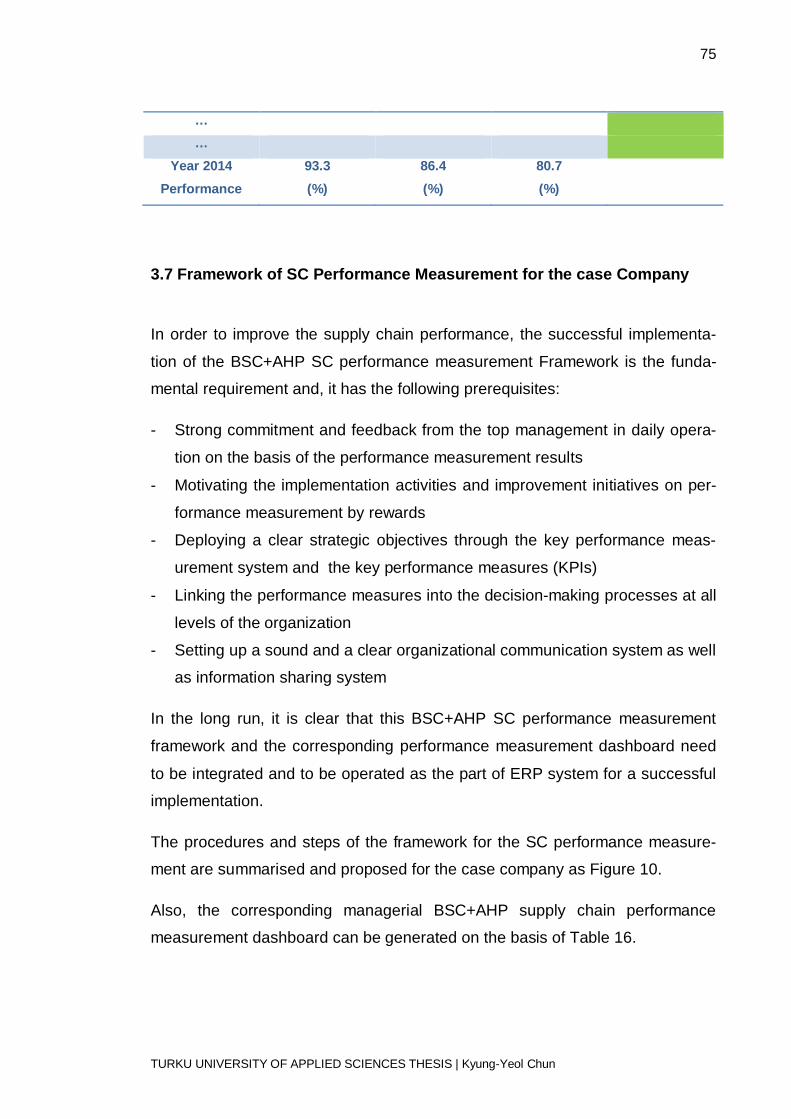
75
TURKU UNIVERSITY OF APPLIED SCIENCES THESIS | Kyung-Yeol Chun
…
…
Year 2014 Performance
93.3 (%)
86.4 (%)
80.7 (%)
3.7 Framework of SC Performance Measurement for the case Company
In order to improve the supply chain performance, the successful implementa-
tion of the BSC+AHP SC performance measurement Framework is the funda-
mental requirement and, it has the following prerequisites:
- Strong commitment and feedback from the top management in daily opera-
tion on the basis of the performance measurement results
- Motivating the implementation activities and improvement initiatives on per-
formance measurement by rewards
- Deploying a clear strategic objectives through the key performance meas-
urement system and the key performance measures (KPIs)
- Linking the performance measures into the decision-making processes at all
levels of the organization
- Setting up a sound and a clear organizational communication system as well
as information sharing system
In the long run, it is clear that this BSC+AHP SC performance measurement
framework and the corresponding performance measurement dashboard need
to be integrated and to be operated as the part of ERP system for a successful
implementation.
The procedures and steps of the framework for the SC performance measure-
ment are summarised and proposed for the case company as Figure 10.
Also, the corresponding managerial BSC+AHP supply chain performance
measurement dashboard can be generated on the basis of Table 16.
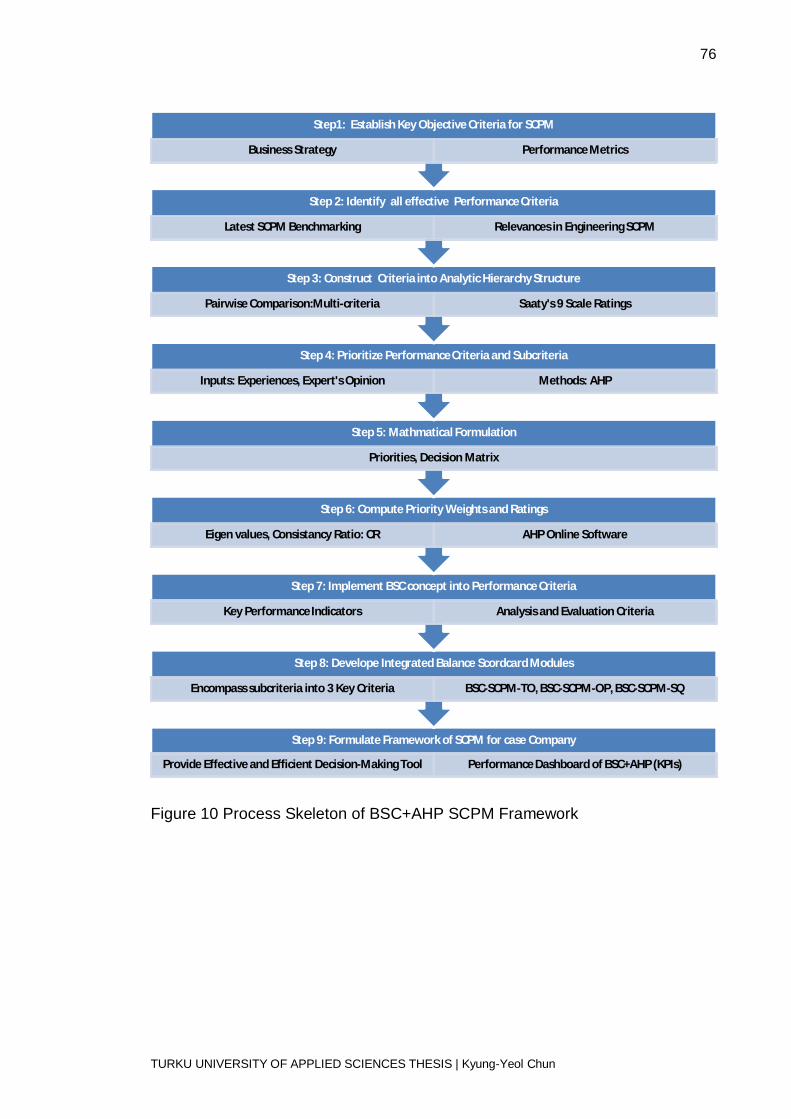
76
TURKU UNIVERSITY OF APPLIED SCIENCES THESIS | Kyung-Yeol Chun
Figure 10 Process Skeleton of BSC+AHP SCPM Framework
Step 9: Formulate Framework of SCPM for case Company
Provide Effective and Efficient Decision-Making Tool Performance Dashboard of BSC+AHP (KPIs)
Step 8: Develope Integrated Balance Scordcard Modules
Encompass subcriteria into 3 Key Criteria BSC-SCPM-TO, BSC-SCPM-OP, BSC-SCPM-SQ
Step 7: Implement BSC concept into Performance Criteria
Key Performance Indicators Analysis and Evaluation Criteria
Step 6: Compute Priority Weights and Ratings
Eigen values, Consistancy Ratio: CR AHP Online Software
Step 5: Mathmatical Formulation
Priorities, Decision Matrix
Step 4: Prioritize Performance Criteria and Subcriteria
Inputs: Experiences, Expert's Opinion Methods: AHP
Step 3: Construct Criteria into Analytic Hierarchy Structure
Pairwise Comparison:Multi-criteria Saaty's 9 Scale Ratings
Step 2: Identify all effective Performance Criteria
Latest SCPM Benchmarking Relevances in Engineering SCPM
Step1: Establish Key Objective Criteria for SCPM
Business Strategy Performance Metrics

77
TURKU UNIVERSITY OF APPLIED SCIENCES THESIS | Kyung-Yeol Chun
4 CONCLUSION AND DISCUSSION
4.1 Research Conclusion
In order to achieve the improved performance in the engineering supply chain
management, it has been highlighted the importance of the supply chain per-
formance measurement and the challenges of engineering supply chain perfor-
mance measurement. The research on efficient and effective performance
measurement of engineering service supply chain leads to complexity and
fragment issues, and it is becoming a critical topic for both practitioners and ac-
ademics.
With the recent literature reviews, it has been scrutinized the performance
measures and metrics that suit the engineering service supply chain perfor-
mance. Moreover, a new perspective of performance measurement approaches
are developed on how engineering service supply chain processes and perfor-
mances could be measured, monitored, analyzed and evaluated during the
whole progressing periods, to enable the dynamic and progressive manage-
ment of supply chains.
The three research questions and related research tasks are elaborated and
cleared as follows.
Task1. What indicators can represent the performance progress of the engi-
neering supply chain effectively?
1) Scrutinized the effective performance measurement approaches and the
appropriate performance measures and metrics for engineering supply
chain based on the expertise of case company
2) Structured in hierarchy of the metrics and measures in association with
the key performance objectives and criteria to fit AHP analysis.
3) Established three key performance modules to fit BSC+AHP approach in
order to represent the performance of the engineering supply chain. The
78
TURKU UNIVERSITY OF APPLIED SCIENCES THESIS | Kyung-Yeol Chun
established key performance modules are BSC-SCPM-TO, BSC-SCPM-
OP, and BSC-SCPM-SQ.
The measures and metrics are to be agreed within the internal organization
to reflect the strategy of business objectives, and the measurements with the
measures are to be agreed with the supply chains during the contract stage.
Task2. How can the performance indicators of the engineering supply chain be
measured with what measures and metrics?
1) Three key performance modules (BSC-SCPM-TO, BSC-SCPM-OP, and
BSC-SCPM-SQ) have been created to realize BSC+AHP approach as
the representing performance indicators of the engineering supply chain.
2) The key performance metric of each BSC+AHP module has been de-
fined the formulation on how to measure and evaluate the influences with
the priority weights that are mathematically determined by pair-wise
comparison method by Saaty’s nine scale ratings.
Analytic Hierarchy Process (AHP) makes this approach possible to integrate
the multi-dimensional characteristics of performance metrics. The perfor-
mance metrics are transformed to the representative key performance mod-
ules with the priority weights to identify the influences.
Task3. How can the measured performance metrics of the engineering supply
chain be analyzed and utilized to provide as managerial decision-making tool?
1) Three key performance modules (BSC-SCPM-TO, BSC-SCPM-OP, and
BSC-SCPM-SQ) are measured and analyzed with the predefined and
agreed decision criteria.
2) Matrix calculation and data analysis are conducted by a mathematical
software specialized in business application. In this case study, the open
source of AHP software in www.bpmsg.com has been utilized. The soft-
ware output provides priorities, decision matrix and consistency ratios.
79
TURKU UNIVERSITY OF APPLIED SCIENCES THESIS | Kyung-Yeol Chun
The AHP calculation and analysis software is well known and readily availa-
ble for business application. It can be applicable with standalone software,
but it is recommended to incorporate with ERP system as IT system of the
company.
Nowadays, the engineering service industry is characterized by continuous ex-
tension in supply chain outsourcing due to the globalization strategy and tech-
nological advancements. Therefore, implementation of effective performance
measurement in the engineering supply chain emerges an essential tool to cope
with these challenges.
In this context, the performance measurement of global engineering service
supply chain is one of the critical topics for improvement of supply chain per-
formance and managerial competitiveness.
This research contributes to the managerial insights as well as the theoretical
implementation in the following aspects.
(1) This research provides managerial implication with the physical measures
and measurement solution by linking the BSC perception and AHP method-
ology to articulate the measures and metrics for managers to assess the
supply chain processes and to evaluate the performance in a systematic
way of approach. The proposed SC performance measurement framework
facilitates the managers with the effective and efficient measurement system
as a common decision-making tool to align the objectives of company strat-
egy. The system motivates the common perception of goal, sound commu-
nication and transparent evaluation criteria for all management level as well
as the managers of supply chains.
(2) This research employs the methodological approach by transforming the
sub-criteria, key criteria and object module into the hierarchy of AHP model.
Three BSC+AHP modules are established for the most proper representa-
tion of the relevant key performances of the dedicated supply chains by for-
mulating and integrating the multi-dimensional characteristics into each
80
TURKU UNIVERSITY OF APPLIED SCIENCES THESIS | Kyung-Yeol Chun
BSC+AHP module. The performance metrics are inter-related and influ-
enced each other, and they are eventually affected to the specific perfor-
mances with the different level of weights. Therefore, the approach of this
case study by identifying, formulating, integrating of performance criteria,
and transforming of the performance metrics into the BSC+AHP module en-
ables to articulate the supply chain performance more systematically.
(3) This research will devote to motivate researchers and practitioners to devel-
op further in this area. This framework of performance measurement for en-
gineering supply chain will be beneficial to researchers and corporate man-
agers in identifying the opportunities for improvements in engineering supply
chain performance.
Performance measurement in engineering supply chain is not much developed
and implemented in the actual business environments. Thus, this research is
unique in some extent and contributes to the engineering service industry, spe-
cifically to the case company.
4.2 Future Research
Supply chain performances measurement and its measures and metrics claim
the different issues in the individual organization and also in the specific indus-
tries. It is not feasible to apply a common supply chain performance measure-
ment and measures in the other specific business organization without suitable
modification of the framework to suit the dedicated business organization.
Therefore, one of remaining issues for future research would be to carry out an
empirical case study research that examines this research framework to the
other category of engineering organization such as basic design or concept de-
sign level. By this empirical research approach, the BSC+AHP modules and SC
performance measurement framework could be further developed for the per-
formance measurement of the engineering supply chains.
81
TURKU UNIVERSITY OF APPLIED SCIENCES THESIS | Kyung-Yeol Chun
As a further research, the validity of this framework needs to be examined in
other service industries. Moreover, development of the new measures and new
framework for evaluating the performance of the engineering supply chain as a
whole entity requires a creative effort for both academic researchers and practi-
tioners.
Further in-depth research also can be suggested on the development of evalua-
tion approaches for the measures and metrics of the engineering supply chain,
that includes uncertainty, agility, reliability, responsiveness, sustainability, or-
ganizational culture, and human resource attributes.
82
TURKU UNIVERSITY OF APPLIED SCIENCES THESIS | Kyung-Yeol Chun
REFERENCES
Agami, N.,Saleh, M.,Rasmy, M. (2012). “Supply Chain Performance Measurement Approaches:
Review and Classification”, Journal of Organizational Management Studies,
Article ID 872753, 2012(2012), 1-20.
Akyuz, G. A. & Erkan, T. E. (2010). “Supply Chain Performance Measurement: A Literature
Review”, International Journal of Production Research, 48(17), 5137-5155.
Beamon, B. M. & Ware, T. M. (1998). “A Process Quality Model for the Analysis, Improvement
and Control of Supply Chain Systems”, Journal of Logistics Information
Management, 11(2), 105-113.
Beamon, B. M. (1999). ”Measuring Supply Chain Performance”, International Journal of
Operations & Production Management, 19(3), 275-292.
Bhagwat, R. & Sharma, M. K. (2007). “Performance Measurement of Supply Chain
Management: A Balanced Scorecard Approach”, Journal of Computers and
Industrial Engineering, 53(1), 43-62.
Bititci, U.S., Cavalieri, S. and von Cieminski, G. (2005). “Dynamics of Performance
Measurement System”, International Journal of Operations & Production Man-
agement, 20(6), 692-704.
Bititci, U.S., Turner, T., Begemann, C. (2000), “Implementation of performance
measurement systems: private and public sectors”, Production Planning and
Control, 16(2), 99-100.
Bourne, M., Mills, J., Wilcox, M., Neely, A. & Platts, K. (2000). "Designing, Implementing and
Updating Performance Measurement Systems”, International Journal of
Operations & Productions Management, 20(7), 754-771.
Bourne, M., Neely, A., Platts, K. & Mills, J. (2002). “The Success and Failure of Performance
Measurement Initiatives: Perceptions of Participating Managers”, International
Journal of Operations & Productions Management, 22(11), 1288-1310.
Buyuközkan, G., Cifci, G., Guleryuz, S.(2011). “Strategic Analysis of Healthcare Service Quality
using Fuzzy AHP Methodology”, Expert Systems with Applications, 38(8), 9407-
9424.
Cai, J., Liu, X., Xiao, Z. & Liu, J. (2009). “Improving Supply Chain Performance Management: A
Systematic Approach to Analyzing Iterative KPI Accomplishment”, Decision
Support Systems, 46(2), 512-521.
Chan, F. T. S. (2003). “Performance Measurement in a Supply Chain”, International Journal of
Advanced Manufacturing Technology, 21, 534-548.
Chan F. T. S. & Qi H. J. (2003). “Feasibility of performance measurement system for supply
chain: A process-based approach and measures”, Integrated Manufacturing
Systems, 14(3), 179-190.
83
TURKU UNIVERSITY OF APPLIED SCIENCES THESIS | Kyung-Yeol Chun
Chen, I. J. & Paulraj, A. (2004). “Understanding Supply Chain Management: Critical Research
and a Theoretical Framework”, International Journal of Production Research,
42(1),131-163.
Chen, I.J., Paulraj, A., Lado, A. (2004a). “Strategic Purchasing, Supply Management and Firm
Performance”, Journal of Operations Management, 22(5), 505-523.
Chen, C.C. (2006). “The Establishment of Project-oriented and Cost-based NPD Performance
Evaluation”, Human Systems Management, 25(3), 185
Christopher, M., (1992). Logistics and Supply Chain Management. Pitman Publishing, London
Christopher, M., (2000). “The Agile Supply Chain: Competing in Volatile Markets”, Industrial
Marketing Management, 29(1), 37-44.
De Toni, A., and Tonchia, S. (2001). “Performance Measurement Systems”, International
Journal of Operations & Production Management, 21(1/2), 46-70.
Eccles, R.G. (1991). “The Performance Measurement Manifesto”, Harvard Business Review,
January-February, 131-137.
Fitzgerald, L., Johnston, R., Brignall, T. J., Silvestro, R. and Voss, C., (1991). Performance
Measurement in Service Businesses, C.I.M.A., London.
Fynes, B., Voss, C. & de Búrca, S. (2005). “The Impact of Supply Chain Relationship Dynamics
on Manufacturing Performance”, International Journal of Operations and
Production Management. 25(1), 6-19.
Ghauri, Pervez & Gronhaug, Kjell (2004). Research Methods in Business Studies. A Practical
Guide. Prentice Hall. Third edition.
Georgy, M.E. (2005). “Engineering Performance in the US Industrial Construction Sector”, Cost
Engineering, 47(1), 27
Gopal and J. Thakkar (2012). “A review on supply chain performance measures and
metrics: 2000-2011”, International Journal of Productivity & Performance
Management, 61(5), 518-547.
Gunasekaran, A., Patel, C. & Tirtiroglu, E. (2001). “Performance Measures and Metrics in a
Supply Chain Environment”, International Journal of Operations & Production
Management, 21(1/2), 71–87.
Gunasekaran, A., Patel, C. & McGaughey, R. E. (2004). “A Framework for Supply Chain
Performance Measurement”, International Journal of Production Economics,
87(3), 333-347.
Gunasekaran, A., Williams, H. J. & McGaughey, R. E. (2005). “Performance Measurement and
Costing System in New Enterprise”, Journal of Technology and innovation, 25(5),
523–533.
Gunasekaran, A. & Kobu, B. (2007). “Performance Measures and Metrics in Logistics and
Supply Chain Management: A Review of Recent Literature (1995–2004) for
Research and Applications”, International Journal of Production Research,
45(12), 2819-2840.
84
TURKU UNIVERSITY OF APPLIED SCIENCES THESIS | Kyung-Yeol Chun
Ho, C., (2007). “Measuring system performance of an ERP-based supply chain”, International
Journal of Production Research, 45(6), 1255-1277.
Holmberg S. (2000). "A systems perspective on supply chain measurements", International
Journal of Physical Distribution & Logistics Management, 30(10), 847-868
Holweg, M. (2005). “An Investigation into Supplier Responsiveness: Empirical Evidence from
the Automotive Industry”, 16(1), 96-119.
Johnsson, S. (2008). “PMEX-A Performance Measurement Evaluation Matrix for the
development of Complex Products and Systems”, Management of Engineering &
Technology, PICMET 08 – Portland International Conference.
Kaplan, R. S. & Norton, D. P. (1992). “The Balanced Scorecard -Measures that Drive
Performance”, Harvard Business Review, 70(January-February), 71-79.
Kaplan R.S., Norton D.P. (1996). “Linking the balanced scorecard to strategy”, California
management review, 39(1), 53-79.
Klenke,K. (2008). Qualitative Research in the Study of Leadership, Emerald Group Publishing.
Korpela, J., Lehmusvaara, A., & Tuominen, M. (2001). ”An analytic approach to supply chain
Development”, International Journal of Production Economics, 71(1-3), 145-155.
Lin, L.C. & Li T.S. (2010) “An integrated framework for supply chain performance measurement
using six-sigma metrics”, Software Quality Journal, 18(3), 387-406.
Little, D., Kenworthy, J., Jarvis, P., Porter, K. (1995). “Scheduling across the Supply Chain”,
Logistics Information Management, 8(1), 42-48.
Mapes, J., New, C., Szwejczewski, M., (1997). “Performance Trade-offs in Manufacturing
Plants”, International Journal of Operations & Production Management, 17(10),
1020-1033.
Mettler, T. and Rohner, P. (200). “Supplier Relationship Management: A Case Study in the
Context of Health Care”, Journal of Theoretical and Applied Electronic Com-
merce Research, 4(3), 58-71.
Moullin, M. (2007), “Performance measurement definitions: Linking performance measurement
and organizational excellence”, International Journal of Health Care Quality
Assurance, 20(3), 181-183.
Neely A., Mills J., Platts K., Gregory M. Richards H. (1994). “Realizing strategy through
Measurement”, International Journal of Operations & Production Management,
14(3), 140-152.
Neely A., Gregory M., Platts K. (1995). “Performance measurement system design: A literature
review and research agenda”, International Journal of Operations & Production
Management, 15(4) 80-116.
Neely A., Mills J., Platts K., Richards H., Gregory M., Bourne M., Kennerley M., (2000).
"Performance measurement system design: developing and testing a
process-based approach", International Journal of Operations and Production
Management, 20(10), 1119-1145

85
TURKU UNIVERSITY OF APPLIED SCIENCES THESIS | Kyung-Yeol Chun
Neely, A. (2005). “The Evolution of Performance Measurement Research: Development in the
Last Decade and a Research Agenda for the Next”, International Journal of
Operations & Production Management, 25(12), 1264-1277.
Novinch, N., (1990). “Distribution Strategy: Are You Thinking Small Enough?”, Slogan
Management Review, 32(1), 71-77.
Nudurupati, S.S., Bititci, U.S., Kumar, V. and Chan, F.T.S. (2011). “State of the art literature
review on performance measurement”, Computers and Industrial Engineering,
60(2), 279-290.
Otto, A. and Kotzab, H. (2003). “Does supply chain management really pay? Six perspectives to
measure the performance of managing a supply chain”, European Journal of
Operational Research, 144(2), 306-320.
Saaty, T.L., (1983). “Priority Setting in Complex Problems”, IEEE Transactions on Engineering
Management, 30(3), 140-155.
Salter, A. (2003). “Innovation and Performance in Engineering Design”, Construction
Management and Economics, 21(6), 573.
Sharma, M. K. and Bhagwat, R. (2007). “An Integrated BSC-AHP Approach for Supply Chain
Management Evaluation”, Journal of Measuring Business Excellence, 11(3),
57-68.
Shepherd, C. and Gunter, H. (2006). “Measuring supply chain performance: current research
and future directions”, International Journal of Productivity and Performance
Management, 55(3/4), 242-258.
Sillanpää, I. (2010). “Supply chain performance measurement in the manufacturing industry.
A single case study research to develop a supply chain performance
measurement framework”, University of Oulu. Acta Univ. Oul. C 374, 2010.
Simchi-levi, D.,Kaminsky P., Simchi-Levi, E. (2008). Designing and Managing the Supply Chain:
concepts, strategies, and case studies. McGraw-Hill/Irwin, Boston.
Slack, N., Chambers, S., Harland, C., Harrison, A., Johnston, R. (1995). Operations
Management. Pitman Publishing, London.
Sink, D.S. and Tuttle, T.C. (1989). Planning and Measurement in Your Organization of the
Future, Ch. 5, Industrial Engineering and Management Press, Norcross, USA,
170-184.
Stewart, G. (1995). “Supply Chain Performance Benchmarking Study Reveals keys to Supply
Chain Excellence”, Logistics Information Management, 8(2), 38-44.
Supply-Chain Council. (2010). Supply-chain operations reference-model. Overview – Version
10.0., available at: www.supply-chain.org , accessed: 08/02/2014
Thakkar J., Kanda A., Deshmukh S.G. (2009). “Supply chain performance measurement
framework for small and medium scale enterprises”, Benchmarking, 16(5),
702-723.
Theeranuphattana, A., and Tang, J.C.S. (2008). ”A conceptual model of performance
86
TURKU UNIVERSITY OF APPLIED SCIENCES THESIS | Kyung-Yeol Chun
measurement for supply chains: Alternative considerations”, Journal of
Manufacturing Technology Management, 19(1), 125-148.
Turner, T.J. and Bititci, U.S. (1998). ``Maintaining reliability of business processes'', Strategic
Management of the Manufacturing Value Chain, Kluwer Academic, Dordrecht,
169-176.
Van der Vorst, J.G.A.J., Beulens, A.J.M. (2002). "Identifying sources of uncertainty to generate
supply chain redesign strategies", International Journal of Physical Distribution &
Logistics Management, 32(6), 409-430.
Van Hoek, R.I., Harrison, A., Christopher, M. (2001). “Measuring Agile Capabilities in the Supply
Chain”, International Journal of Operations & Production Management, 21(1/2),
126-147.
Wouters, M. (2009). “A developmental approach to performance measures - Results from a
longitudinal case study”, European Management Journal, 27(1), 64-78.