performance of drained and undrained flexible … report.pdfdrained and undrained flexible pavement...
TRANSCRIPT
DRAFT
Performance of Drained and Undrained Flexible Pavement
Structures under Wet Conditions
Accelerated Test Data
Test Section 545–Undrained
Prepared for:
California Department of Transportation
by:
Manuel O. Bejarano, John T. Harvey, Abdikarim Ali, David Mahama, Dave Hung, and Pitipat Preedonant
December 2001 Revision 2004
Pavement Research Center Institute of Transportation Studies University of California at Berkeley

ii
TABLE OF CONTENTS
Table of Contents........................................................................................................................... iii
List of Figures ................................................................................................................................. v
List of Tables ................................................................................................................................ vii
Executive Summary ........................................................................................................................ 1
1.0 Introduction......................................................................................................................... 5
1.1 Objectives ....................................................................................................................... 5
1.2 Organization of Report ................................................................................................... 6
2.0 Test Program....................................................................................................................... 7
2.1 Test Section Layout ........................................................................................................ 7
2.2 Environmental Conditions .............................................................................................. 7
2.3 Instrumentation ............................................................................................................... 8
2.4 Test Program................................................................................................................... 9
2.4.1 Heavy Vehicle Simulator Trafficking......................................................................... 9
2.4.2 Data Collection ......................................................................................................... 12
3.0 Summary of Test Data ...................................................................................................... 13
3.1 Temperature and Moisture Condition Data .................................................................. 13
3.1.1 Temperature .............................................................................................................. 13
3.1.2 Rainfall...................................................................................................................... 14
3.1.3 Moisture Content Data.............................................................................................. 14
3.2 Permanent Deformation ................................................................................................ 17
3.2.1 Surface Rutting Measured with the Laser Profilometer ........................................... 17
3.2.2 In-depth Permanent Deformation ............................................................................. 21
3.2.3 Comparison with Section 544................................................................................... 21
iii

3.3 Elastic Deflections ........................................................................................................ 24
3.3.1 Surface Deflection Data............................................................................................ 24
3.3.2 In-Depth Pavement Deflections................................................................................ 25
3.3.3 Comparison of Performance with That of Section 544 ............................................ 30
3.3.4 Back-calculated Moduli from In-depth Elastic Deflections ..................................... 31
3.4 Crack Length Progression............................................................................................. 33
3.5 Falling Weight Deflectometer (FWD) Testing ............................................................. 36
3.5.1 FWD Normalized Deflections .................................................................................. 37
3.5.2 Back-calculated Moduli from FWD Deflections...................................................... 39
3.6 Forensic Activities ........................................................................................................ 42
3.6.1 Air-Void Contents from Extracted Cores ................................................................. 42
3.6.2 Bonding Between Layers.......................................................................................... 44
3.6.3 Dynamic Cone Penetrometer (DCP) Data ................................................................ 44
3.6.4 Trench Data............................................................................................................... 47
4.0 Performance Evaluation and Mechanistic Analysis ......................................................... 53
4.1 Pavement Responses..................................................................................................... 53
4.2 Fatigue Analyses........................................................................................................... 54
5.0 Summary and Conclusions ............................................................................................... 57
5.1 Summary ....................................................................................................................... 57
5.2 Conclusions................................................................................................................... 58
5.3 Recommendations......................................................................................................... 59
6.0 References......................................................................................................................... 61
iv
LIST OF FIGURES
Figure 1. Test section layout and instrumentation. ......................................................................... 8
Figure 2. Location of MDDs and thermocouples in Section 545. ................................................ 10
Figure 3. Section 545 test program schedule. ............................................................................... 11
Figure 4. Average air and in-pavement temperatures during trafficking of Section 545. ............ 14
Figure 5. Monthly precipitation for Richmond weather station. .................................................. 15
Figure 6. Average volumetric moisture contents for the aggregate base and subbase obtained
with hydroprobes and TDRs. ................................................................................................ 15
Figure 7. Average volumetric moisture contents for the subgrade obtained with the hydroprobe.
............................................................................................................................................... 16
Figure 8. Average maximum rut depth. ........................................................................................ 18
Figure 9. Section 545 surface profile at various stages of HVS trafficking. ................................ 20
Figure 10. In-depth permanent deformations in Section 545 near Station 7. ............................... 22
Figure 11. Permanent deformation within pavement lyaers in Section 545 near Station 7.......... 22
Figure 12. Comparison of permanent deformations on Sections 544 ad 545............................... 23
Figure 13. Average RSD deflections for Section 545................................................................... 24
Figure 14. RSD at the end of testing, 741,922 load applications.................................................. 25
Figure 15. In-depth elastic deflections resulting from 40-kN test load, MDD 7. ......................... 26
Figure 16. In-depth elastic deflections resulting from 80-kN test load, MDD 7. ......................... 26
Figure 17. In-depth elastic deflections resulting from 100-kN test load, MDD 7. ....................... 27
Figure 18. Layer elastic deflections resulting from 40-kN test load............................................. 28
Figure 19. Layer elastic deflections resulting from 80-kN test load............................................. 29
Figure 20. Layer elastic deflections resulting from 100-kN test load........................................... 29
v
Figure 21. Comparative performance of Sections 545 and 544, elastic deflections versus HVS
load applications; 40-kN test load......................................................................................... 30
Figure 22. Layer moduli back-calculated from MDD deflections for Section 545. ..................... 32
Figure 23. Layer moduli back-calculated from MDD deflections for Section 544. ..................... 32
Figure 24. Surface crack schematics for Section 545. .................................................................. 34
Figure 25. Contour plot of cracking density on Section 545 at the
completion of HVS trafficking. ............................................................................................ 35
Figure 26. Comparison of crack length progression in Sections 545 and 544 together with
corresponding RSD measured deflections as a function of HVS load repetitions. .............. 36
Figure 27. FWD deflections normalized to a 40-kN load for Stages 1, 2, and 4.......................... 38
Figure 28. Back-calculated asphalt concrete moduli. ................................................................... 40
Figure 29. Back-calculated aggregate base/subbase moduli......................................................... 40
Figure 30. Back-calculated subgrade moduli................................................................................ 41
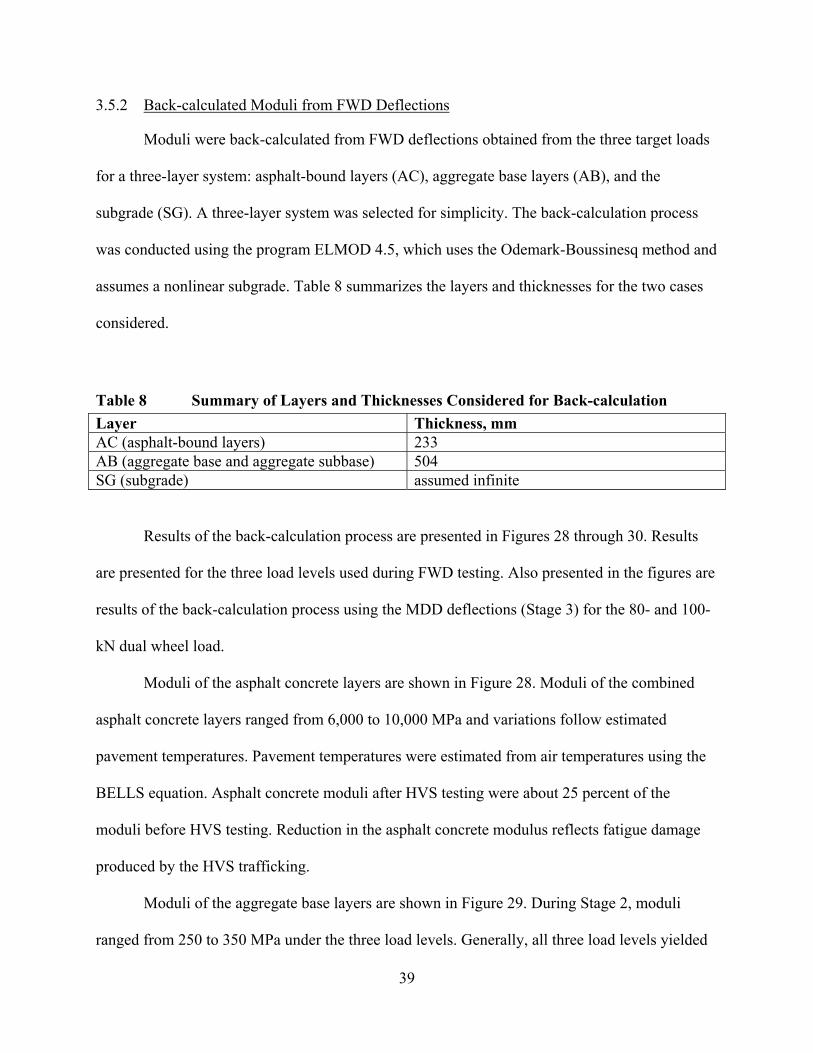
Figure 31 Layout of forensic measurements for Section 545. ...................................................... 43
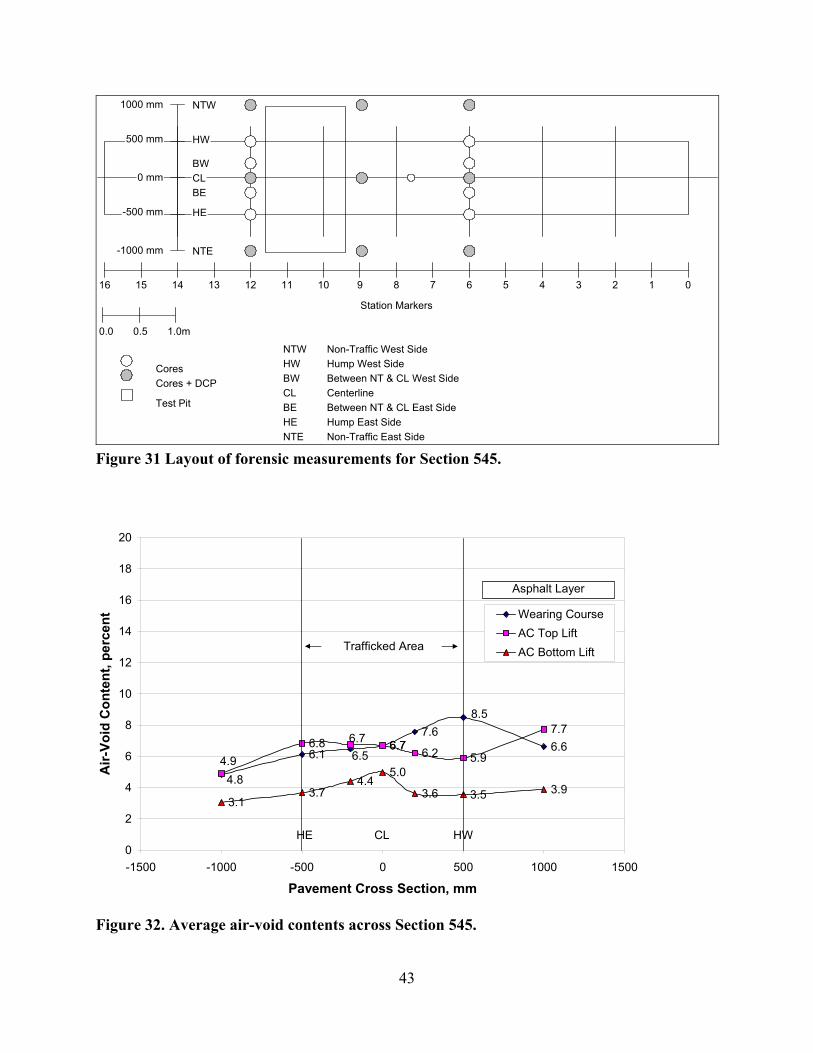
Figure 32. Average air-void contents across Section 545............................................................. 43
Figure 33. DCP results for Section 545, Station 6........................................................................ 45
Figure 34. DCP results for Section 545, Station 9........................................................................ 45
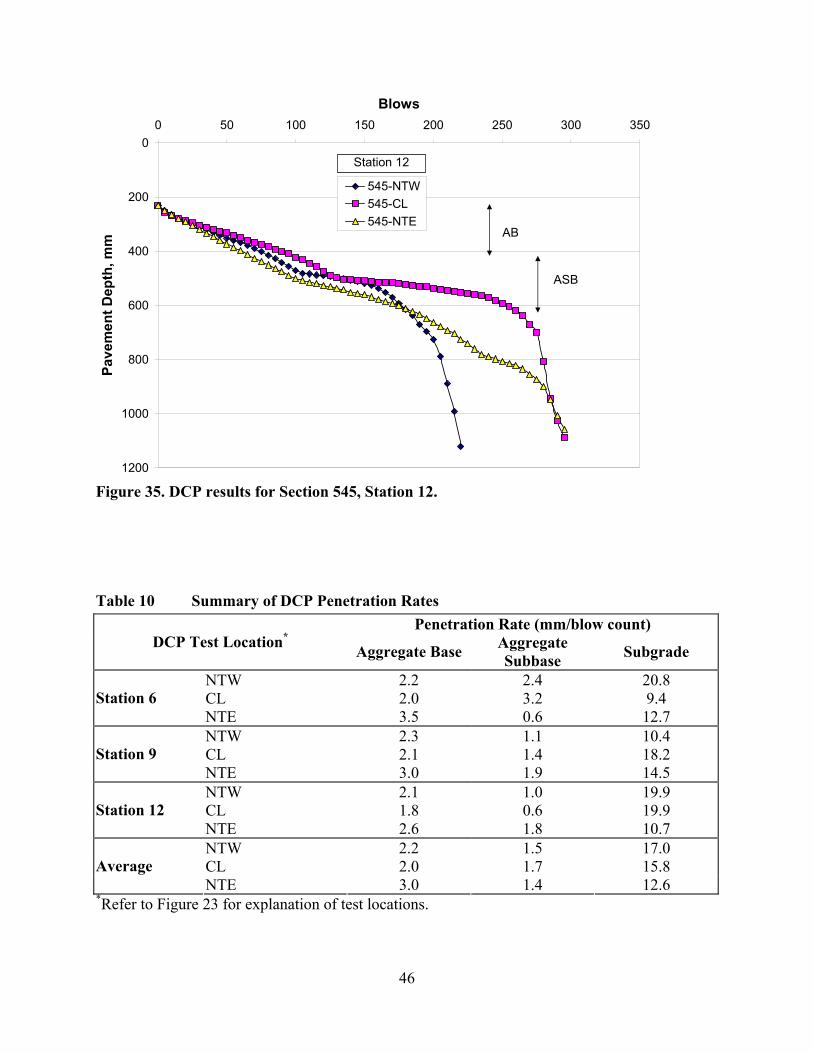
Figure 35. DCP results for Section 545, Station 12...................................................................... 46
Figure 36. Trench data, south face of trench at Station 12, Section 545. ..................................... 48
Figure 37. Trench data, north face of trench at Station 9, Section 545. ....................................... 49
Figure 38. Measured layer thicknesses in test pit. ........................................................................ 50
Figure 39. Methodology followed in the fatigue analysis system to determine ESALs............... 55
vi

LIST OF TABLES
Table 1 Pavement Layer Thicknesses for Test 545 ................................................................. 7
Table 2 Applied Trafficking Loads in Section 545................................................................ 12
Table 3 Data Collection Program........................................................................................... 12
Table 4 Average Rate of Rutting in Section 545 ................................................................... 18
Table 5 Contribution in Percent of Pavement Component to Surface Rutting...................... 21
Table 6 Contribution in Percent to Surface Elastic Deflection of Pavement Components.... 28
Table 7 Normalized Deflections (D0) in Section 545. ........................................................... 37
Table 8 Summary of Layers and Thicknesses Considered for Back-calculation .................. 39
Table 9 Summary of Air-Void Contents for Section 545 ...................................................... 44
Table 10 Summary of DCP Penetration Rates......................................................................... 46
Table 11 Comparison of Layer Thicknesses across Section 545............................................. 47
Table 12 Summary of Pavement Structures for Analysis ........................................................ 54
Table 13 Summary of Pavement Responses under 40-kN Load ............................................. 54
Table 14 Summary of Calculation of ESALs using the UCB Fatigue Analysis System......... 56
vii

viii

EXECUTIVE SUMMARY
This report is the third in a series that describes the results of accelerated pavement
testing conducted on full-scale pavements at the Richmond Field Station (RFS). The report
contains a summary of the results and associated analyses of a pavement section composed of
three lifts of asphalt concrete and an untreated aggregate base layer on top of a prepared
subgrade. The pavement section is termed an undrained pavement because it does not include an
ATPB layer between the asphalt concrete layers and the untreated aggregate base. The pavement
structure was designated Section 545. The tests on this test section have been performed as part
of the Goal 5 Accelerated Test Program for the evaluation of drained and undrained pavements
under conditions of water infiltration.
The main objective of the test program is:
• To develop data to quantitatively compare and evaluate the performance of reduced
thickness asphalt rubber hot mix (ARHM) and full thickness of dense graded asphalt
concrete (DGAC) mix on wearing courses for pavement structures with wet base
conditions.
Other objectives are:
• To quantify elastic moduli of the pavement layers;
• To quantify the stress dependence of the pavement layers;
• To determine the mechanics of failure of the pavement structure;
• To evaluate the effectiveness of non-destructive and partially destructive methods for
assessing pavement structural condition.
1

HVS testing was begun in April 2001 and was completed in August 2001 after the
application of more than 742,000 load repetitions. At the end of the test, the pavement section
had 9 mm of surface rutting and a surface crack density of 2.4 m of cracks per square meter.
Chapter 2 describes the test program for Section 545. Design and as-constructed
thicknesses for the pavement components were as follows:
Layer Design Thickness
As-Built Thickness
Dense graded asphalt concrete wearing course 75 mm 90 mm Dense graded asphalt concrete 148 mm 143 mm Aggregate base 182 mm 259 mm Aggregate subbase 215 mm 206-280 mm The test program was conducted in four stages. Stage 1 was intended to establish the
initial structural condition of the section under conditions of no water infiltration. Stage 2 was
intended to establish the initial structural condition of the section under water infiltration. Stage 3
was HVS trafficking under conditions of water infiltration. Stage 4 was intended to establish the
structural condition of the section after HVS trafficking.
Data collection for Stages 1, 2, and 4 were based on the deflections obtained from the
falling weight deflectometer (FWD) deflections and moisture content measurements. Stage 4
included some destructive and partially-destructive tests to verify results obtained during Stage
3.
Data collection for Stage 3 followed a schedule of the number of HVS load repetitions
and the appearance of any pavement deterioration. Loading was applied by dual radial tires
inflated to a pressure of 720 kPa and consisted of the following:
Load Number of Repetitions 40 kN 147,000 80 kN 117,600 100 kN 477,310
2
Lateral wander of the wheels was over the one-meter width of the test section.
At the termination of loading, surface rutting and fatigue cracking were visible
throughout the test section.
Measures of pavement responses were obtained with Multi-Depth Deflectometers
(MDDs), the Road Surface Deflectometer (RSD), and the laser profilometer. Fatigue cracking
was monitored using digital photography and a digital image analysis procedure. Thermocouples
were used to measure air and pavement temperatures at various depths in the asphalt concrete.
To maintain a constant temperature of approximately 20ºC, a temperature control cabinet was
utilized. Chapter 3 summarizes the data obtained during the course of loading and associated
analyses.
Rutting data indicates that Section 545 performed slightly better than Section 544.
Differences seem to be due to performance of the asphalt concrete and aggregate base layers.
Air-void content data indicated a significant reduction in the air-void content (increase in
density) of the ARHM layer in Section 544. In contrast, no significant reduction in air-void
content was observed for the DGAC layer in Section 545. Moduli of the AC layers were higher
for Section 545 (6,000 to 10,000 MPa) than for Section 544 (5,000 to 7,500 MPa). Moduli of the
aggregate base were lower for Section 545 than for Section 544.
3

4
1.0 INTRODUCTION
This report presents the data for the accelerated pavement testing (APT) program
conducted on Heavy Vehicle Simulator (HVS) test Section 545. This section is part of the
accelerated test program described in the test plan for CAL/APT Goal 5, “Performance of
Drained and Undrained Flexible Pavement Structures under Wet Conditions.”(1) Reference (1)
provides detailed information on the Goal 5 APT program.
Section 545 (like Section 544) was tested to evaluate the performance of a typical
California “undrained” pavement section under wet conditions and to compare its performance
with that of Section 543 (a “drained” pavement section) in the same condition. Caltrans defines
an “undrained” pavement section as a conventional flexible pavement that does not have a
permeable layer between the asphalt concrete and the aggregate base. This, as noted in
References (1, 2) contrasts with a “drained” pavement section, which is a conventional flexible
pavement that includes a 75-mm layer of asphalt treated permeable base (ATPB) between the
asphalt concrete and aggregate base connected to a drainage system at the shoulder. Reference
(1) describes the purpose of the ATPB layer.
Wet conditions for Section 545 were intended to simulate approximate surface infiltration
rates that would occur along the north coast climate region of California (2) during a wet month
for a badly cracked asphalt concrete layer. Because the surface course of Section 545 was
initially uncracked, water was introduced through small holes drilled through the asphalt
concrete and into the aggregate base.
1.1 Objectives
The main objective of this test program was to measure and compare the long-term
performance of undrained structures with ARHM-GG and DGAC wearing courses under wet
5
conditions. Other objectives included the following:
• Determine the failure mechanism of the pavement section;
• Quantify elastic moduli of the various pavement layers using deflections obtained
from a slow moving wheel and from the falling weight deflectometer (FWD);
• Evaluate the effectiveness of non-destructive and partially destructive methods for
assessing the pavement structural condition; these methods included:
· Ground Penetrating Radar (GPR) and nuclear hydroprobes to measure water
content, and
· FWD to estimate moduli of the pavement layers.
This report, together with similar reports for each of the other two test sections (543 and
544), an earlier published laboratory report (1), special associated reports, and a summary report
comprise the documentation of the results for the Goal 5 program.
The sequence of HVS testing of the three Goal 5 test sections was: 1) Section 543
(drained), 2) Section 544 (undrained), and 3) Section 545 (undrained).
1.2 Organization of Report
Chapter 2 contains a description of the test program for Section 545, including loading
sequence, instrumentation , and data collection scheme. Chapter 3 presents a summary and
analysis of the data collected during the test. Analyses include back-calculated moduli from
deflection tests and their effectiveness to establish structural condition. Chapter 4 presents
mechanistic analyses of Section 545 to evaluate the performance and compare its performance to
that of the other undrained section (Section 544). Chapter 5 contains a summary of the results
and conclusions.
6
2.0 TEST PROGRAM
This section describes the test section layout, environmental conditions encountered
during the test, instrumentation used to collect data, and the test program.
2.1 Test Section Layout
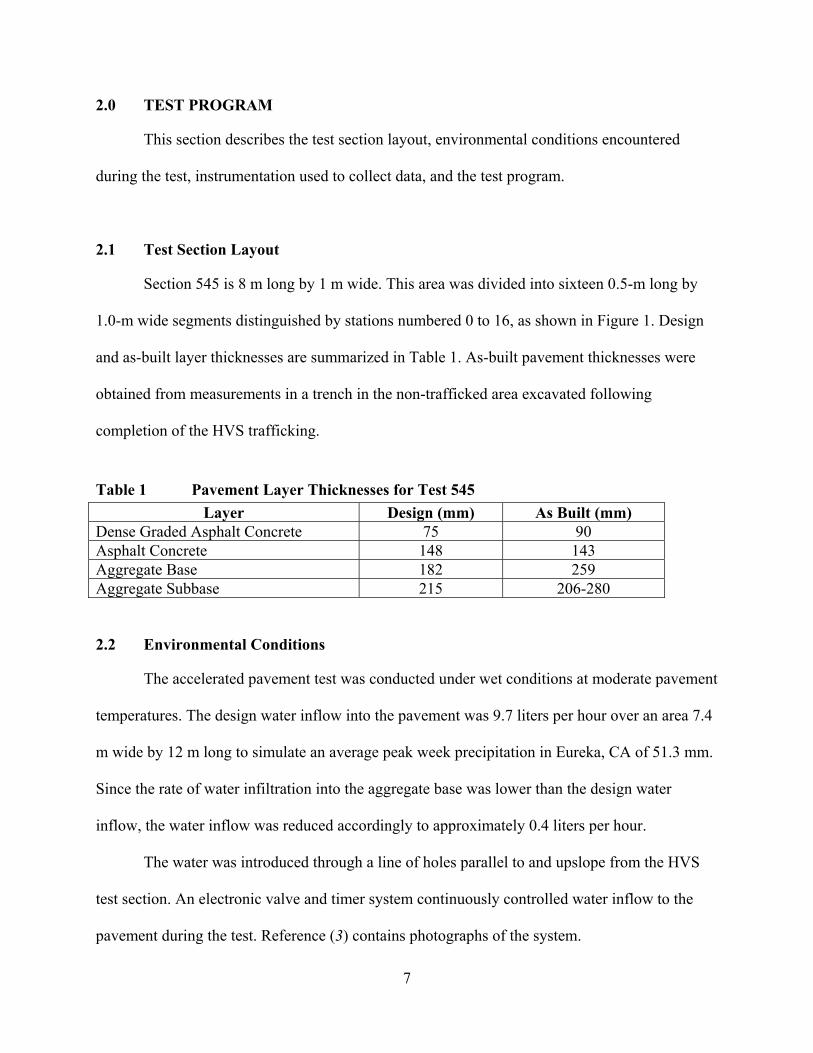
Section 545 is 8 m long by 1 m wide. This area was divided into sixteen 0.5-m long by
1.0-m wide segments distinguished by stations numbered 0 to 16, as shown in Figure 1. Design
and as-built layer thicknesses are summarized in Table 1. As-built pavement thicknesses were
obtained from measurements in a trench in the non-trafficked area excavated following
completion of the HVS trafficking.
Table 1 Pavement Layer Thicknesses for Test 545
Layer Design (mm) As Built (mm) Dense Graded Asphalt Concrete 75 90 Asphalt Concrete 148 143 Aggregate Base 182 259 Aggregate Subbase 215 206-280
2.2 Environmental Conditions
The accelerated pavement test was conducted under wet conditions at moderate pavement
temperatures. The design water inflow into the pavement was 9.7 liters per hour over an area 7.4
m wide by 12 m long to simulate an average peak week precipitation in Eureka, CA of 51.3 mm.
Since the rate of water infiltration into the aggregate base was lower than the design water
inflow, the water inflow was reduced accordingly to approximately 0.4 liters per hour.
The water was introduced through a line of holes parallel to and upslope from the HVS
test section. An electronic valve and timer system continuously controlled water inflow to the
pavement during the test. Reference (3) contains photographs of the system.
7

Figure 1. Test section layout and instrumentation.
The target pavement temperature at a pavement depth of 50 mm was 20ºC ± 2 °C. In
contrast to Sections 543 and 544, Section 545 did not utilize a temperature control box during
testing. If pavement temperatures were not within the specified range, HVS testing was stopped
until the temperature was back within the desired range.
2.3 Instrumentation
The instrumentation used in Section 545 included 1) Multi-Depth Deflectometers (MDD)
to measure deflections and permanent deformations at various depths in the pavement section, 2)
laser profilometer to monitor surface rutting, 3) Road Surface Deflectometer (RSD) to measure
surface deflections, 4) thermocouples to monitor pavement temperatures, and 5) Time Domain
Reflectometers (TDR) to monitor moisture content in the unbound layers.
8

Figure 2 shows the vertical location of MDDs and thermocouples in Section 545. Figure
1 shows the section layout and location of RSD, MDD, and laser profilometer measurements.
Reference (4) contains a complete description of the instrumentation used for this study.
2.4 Test Program
Evaluation of the test section performance was accomplished in four stages (Figure 3).
• Stage 1: Testing and evaluation of the pavement section prior to water infiltration.
Water measurements and FWD testing were conducted to establish initial conditions
and structural capacity.
• Stage 2: Testing and evaluation of pavement section during water infiltration. Water
measurements and FWD testing were conducted to establish conditions and structural
capacity prior to HVS testing.
• Stage 3: HVS testing with water infiltration of the pavement. During loading, the
pavement section was monitored using the instrumentation noted in Section 2.3.
• Stage 4: Evaluation of the pavement section at the conclusion of HVS trafficking by
means of FWD testing, trenching, and sampling of the pavement materials. Trenching
and sampling of the materials were conducted simultaneously with the forensic
activities on Section 544.
2.4.1 Heavy Vehicle Simulator Trafficking
For trafficking of Section 545, the HVS was equipped with dual truck tires, representing
one-half of a single axle. Load was applied through two Goodyear radial tires (G159 11R 22.5)
inflated to a pressure of 720 kPa. Three load levels were used; Table 2 summarizes the loading
sequence.
9

90 mm
0 mm
747 mm
233 mm
492 mm
Dense GradedAsphalt Concrete
Dense GradedAsphalt Concrete
Aggregate Base
Aggregate Subbase
Subgrade
MDD Thermocouples
100 mm
Scale
0 mm 0 mm50 mm75 mm
108 mm
235 mm
174 mm220 mm
498 mm
600 mm
Figure 2. Location of MDDs and thermocouples in Section 545.
10

Figure 3. Section 545 test program schedule.
11

Table 2 Applied Trafficking Loads in Section 545 Trafficking Load (kN) HVS Repetitions
40 0 to 147,000 80 147,000 to 264,612 100 264,612 to 741,922
The test wheel trafficked the entire length of the 8-m test section. Lateral wander over the
1-m width of the test section was programmed to simulate traffic wander on a typical highway
lane. Pavement performance was evaluated for the 6 m × 1 m area between reference points 2
and 14 in which the HVS wheel speed is constant. The 1-m2 areas at both ends of the trafficked
area (Stations 0–2 and 14–16) serve as “turnaround zones” in which the test wheel decelerates,
accelerates, and changes direction (Figure 1).
2.4.2 Data Collection
Table 3 summarizes the data collection sequence for Section 545.
Table 3 Data Collection Program Load
Applications Laser
Profilometer Multi-Depth
Deflectometer Road Surface Deflectometer
Crack Monitoring
10 X 40 kN 40 kN 15000 X 40 kN 40 kN 50000 X 40 kN 40 kN 90000 X 40 kN 40 kN 116000 X 40 kN 40 kN 147000 X 40 kN 40 kN 187767 X 40, 80 kN 40, 80 kN 216000 X 40 kN 40 kN 249000 X 40, 80 kN 40, 80 kN 264612 X 40 kN 40 kN 300000 X 40 kN 40 kN 323314 X 40, 80 kN 40, 80 kN 383692 X 40 kN 40 kN 427000 X 40 kN 40 kN X 482000 X 40, 80, 100 kN 40, 80, 100 kN 517000 X 40 kN 40 kN X 551663 X 40, 80, 100 kN 40, 80, 100 kN X 741922 X 40, 80, 100 kN 40, 80, 100 kN X
12

3.0 SUMMARY OF TEST DATA
This chapter provides a summary of the test data collected for the four stages of testing.
The data include:
• Stage 1 and 2: Temperature, water content, and FWD data.
• Stage 3: Temperature, water content, permanent deformation, elastic deflection, and
crack measurements.
• Stage 4: FWD and forensic data.
3.1 Temperature and Moisture Condition Data
Temperature and moisture condition data were obtained throughout testing of Section
545. The following sections summarize these data.
3.1.1 Temperature
Figure 4 shows daily average air temperatures in building 280 at the University of
California Berkeley Richmond Field station where the HVS was located, and daily average
pavement temperatures at several depths. The daily average temperatures were calculated from
hourly temperatures recorded during testing. The average air temperature at the test section was
19ºC with a standard deviation of 2.2°C. As noted earlier, Section 545 was tested without the
temperature control box.
Asphalt concrete temperatures were recorded at various depths in the asphalt concrete
layers as seen in Figure 4. Asphalt concrete temperatures were fairly uniform and varied slightly
with air temperature on the test section. In general, average temperatures in the asphalt concrete
layers were slightly higher than the average air temperatures (19.5ºC versus 19.0ºC).
13

10
15
20
25
04/1
6/01
04/2
3/01
04/3
0/01
05/0
7/01
05/1
4/01
05/2
1/01
05/2
8/01
06/0
4/01
06/1
1/01
06/1
8/01
06/2
5/01
07/0
2/01
07/0
9/01
Date
Tem
pera
ture
, ºC
Air 0 mm50 mm 75 mm108 mm 174 mm235 mm
Figure 4. Average air and in-pavement temperatures during trafficking of Section 545.
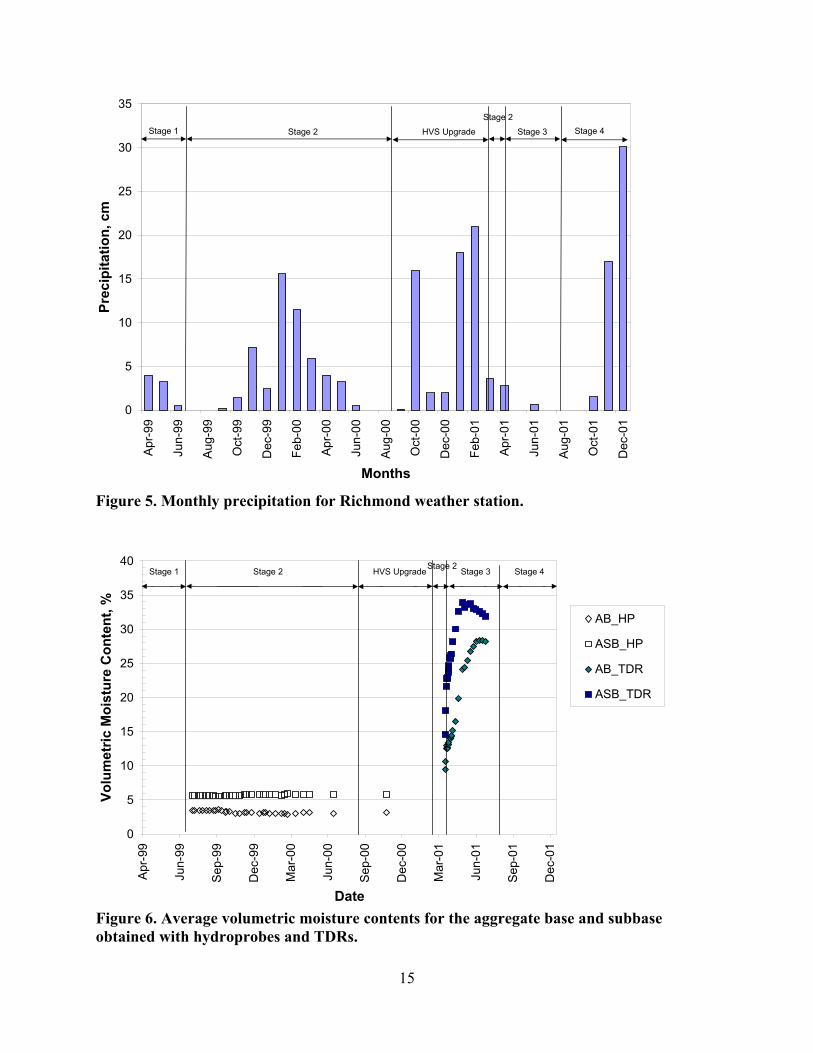
3.1.2 Rainfall
Figure 5 shows average monthly rainfall data from the National Weather Service weather
station in Richmond, CA during the four stages of testing.
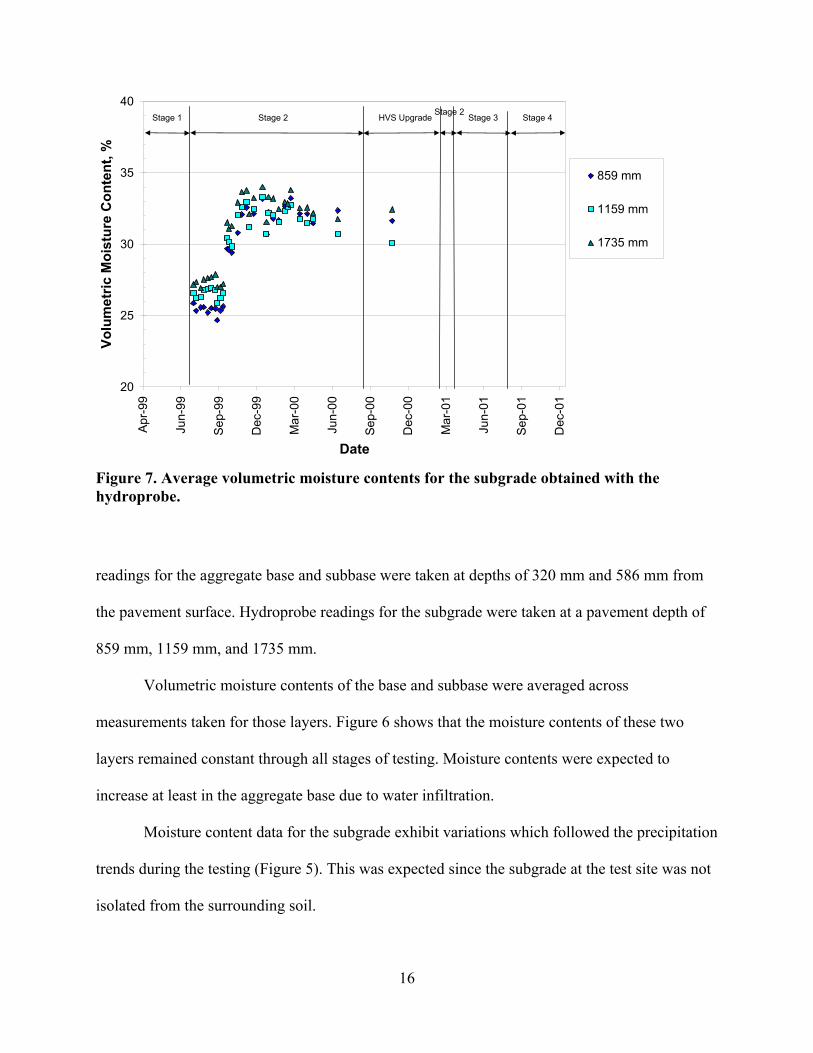
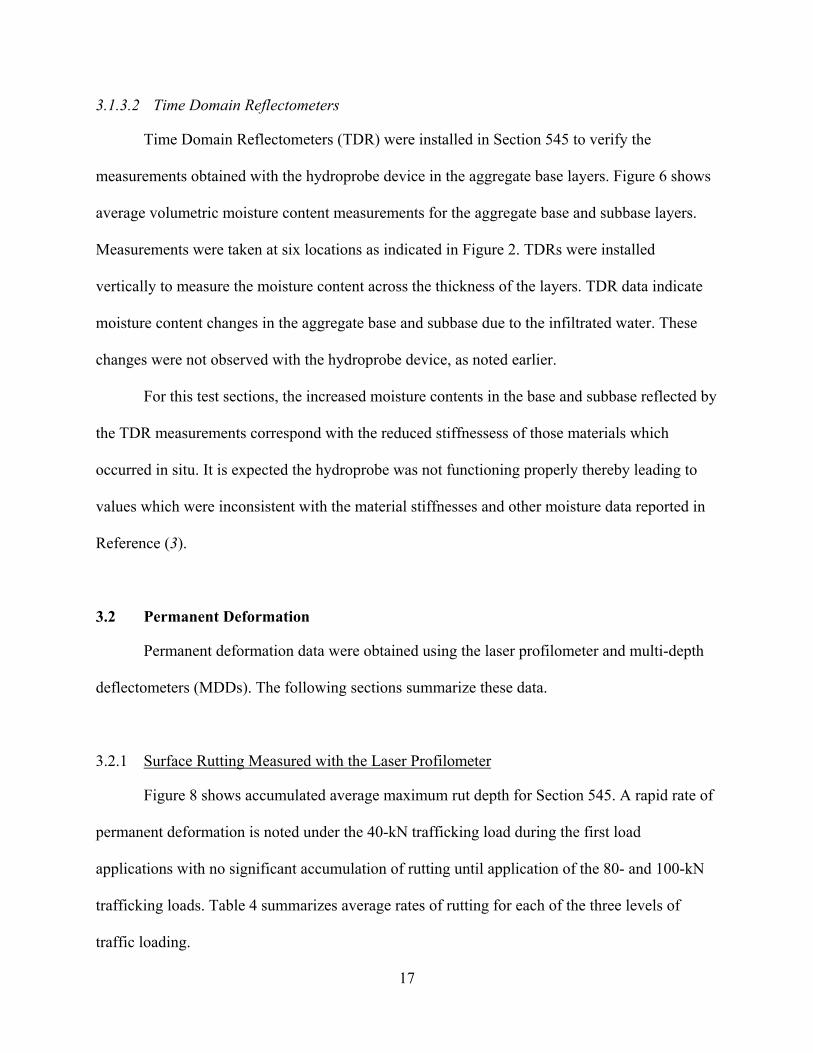
3.1.3 Moisture Content Data
Moisture contents were measured using hydrorobes and Time Domain Reflectometers.
Data obtained with both types of equipment are summarized in the following sections.
3.1.3.1 Hydroprobes
Figures 6 and 7 illustrate average volumetric moisture contents for the aggregate base,
subbase, and subgrade materials obtained by using a hydroprobe test device. Hydroprobe
14
0
5
10
15
20
25
30
35
Apr
-99
Jun-
99
Aug
-99
Oct
-99
Dec
-99
Feb-
00
Apr
-00
Jun-
00
Aug
-00
Oct
-00
Dec
-00
Feb-
01
Apr
-01
Jun-
01
Aug
-01
Oct
-01
Dec
-01
Months
Prec
ipita
tion,
cm
Stage 1 Stage 2 Stage 3 Stage 4Stage 2
HVS Upgrade
Figure 5. Monthly precipitation for Richmond weather station.
0
5
10
15
20
25
30
35
40
Apr
-99
Jun-
99
Sep
-99
Dec
-99
Mar
-00
Jun-
00
Sep
-00
Dec
-00
Mar
-01
Jun-
01
Sep
-01
Dec
-01
Date
Volu
met
ric M
oist
ure
Con
tent
, %
AB_HP
ASB_HP
AB_TDR
ASB_TDR
Stage 1 Stage 2 Stage 3 Stage 4Stage 2HVS Upgrade
Figure 6. Average volumetric moisture contents for the aggregate base and subbase obtained with hydroprobes and TDRs.
15
20
25
30
35
40
Apr-
99
Jun-
99
Sep-
99
Dec
-99
Mar
-00
Jun-
00
Sep-
00
Dec
-00
Mar
-01
Jun-
01
Sep-
01
Dec
-01
Date
Volu
met
ric M
oist
ure
Con
tent
, %
859 mm
1159 mm
1735 mm
Stage 1 Stage 2 Stage 3 Stage 4Stage 2
HVS Upgrade
Figure 7. Average volumetric moisture contents for the subgrade obtained with the hydroprobe.
readings for the aggregate base and subbase were taken at depths of 320 mm and 586 mm from
the pavement surface. Hydroprobe readings for the subgrade were taken at a pavement depth of
859 mm, 1159 mm, and 1735 mm.
Volumetric moisture contents of the base and subbase were averaged across
measurements taken for those layers. Figure 6 shows that the moisture contents of these two
layers remained constant through all stages of testing. Moisture contents were expected to
increase at least in the aggregate base due to water infiltration.
Moisture content data for the subgrade exhibit variations which followed the precipitation
trends during the testing (Figure 5). This was expected since the subgrade at the test site was not
isolated from the surrounding soil.
16
3.1.3.2 Time Domain Reflectometers
Time Domain Reflectometers (TDR) were installed in Section 545 to verify the
measurements obtained with the hydroprobe device in the aggregate base layers. Figure 6 shows
average volumetric moisture content measurements for the aggregate base and subbase layers.
Measurements were taken at six locations as indicated in Figure 2. TDRs were installed
vertically to measure the moisture content across the thickness of the layers. TDR data indicate
moisture content changes in the aggregate base and subbase due to the infiltrated water. These
changes were not observed with the hydroprobe device, as noted earlier.
For this test sections, the increased moisture contents in the base and subbase reflected by
the TDR measurements correspond with the reduced stiffnessess of those materials which
occurred in situ. It is expected the hydroprobe was not functioning properly thereby leading to
values which were inconsistent with the material stiffnesses and other moisture data reported in
Reference (3).
3.2 Permanent Deformation
Permanent deformation data were obtained using the laser profilometer and multi-depth
deflectometers (MDDs). The following sections summarize these data.
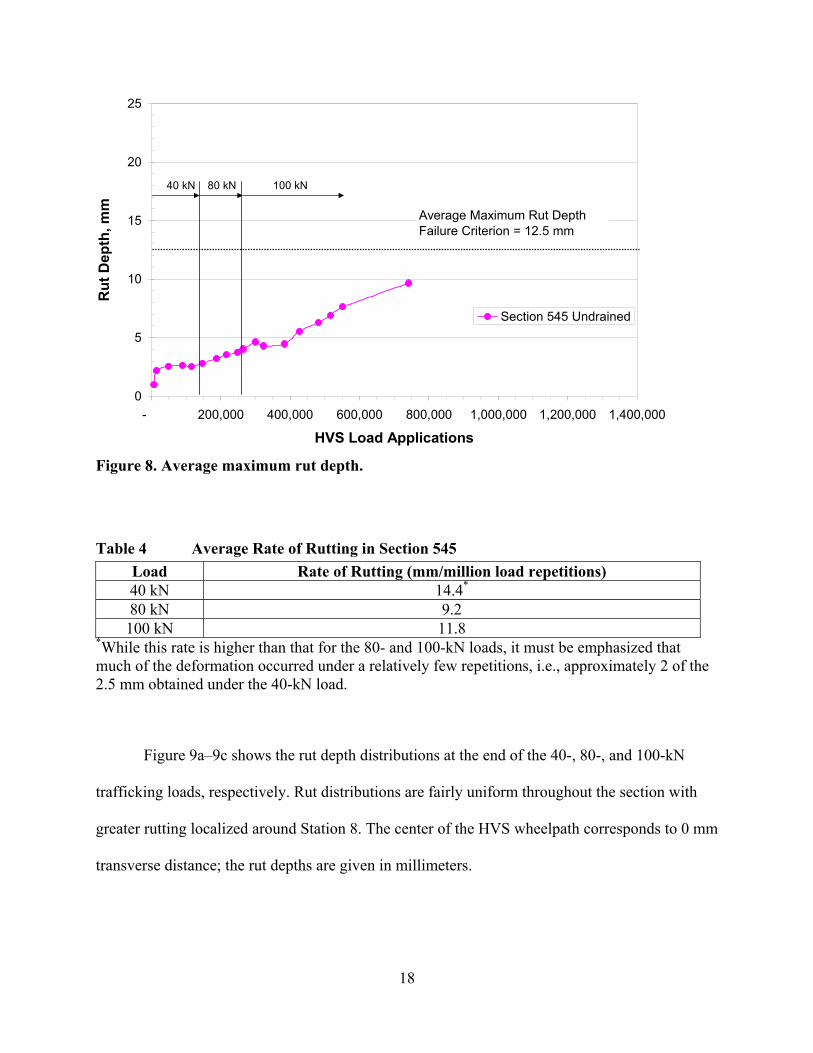
3.2.1 Surface Rutting Measured with the Laser Profilometer
Figure 8 shows accumulated average maximum rut depth for Section 545. A rapid rate of
permanent deformation is noted under the 40-kN trafficking load during the first load
applications with no significant accumulation of rutting until application of the 80- and 100-kN
trafficking loads. Table 4 summarizes average rates of rutting for each of the three levels of
traffic loading.
17
0
5
10
15
20
25
- 200,000 400,000 600,000 800,000 1,000,000 1,200,000 1,400,000
HVS Load Applications
Rut
Dep
th, m
m
Section 545 Undrained
40 kN 80 kN 100 kN
Average Maximum Rut Depth Failure Criterion = 12.5 mm
Figure 8. Average maximum rut depth.
Table 4 Average Rate of Rutting in Section 545 Load Rate of Rutting (mm/million load repetitions) 40 kN 14.4*
80 kN 9.2 100 kN 11.8
*While this rate is higher than that for the 80- and 100-kN loads, it must be emphasized that much of the deformation occurred under a relatively few repetitions, i.e., approximately 2 of the 2.5 mm obtained under the 40-kN load.
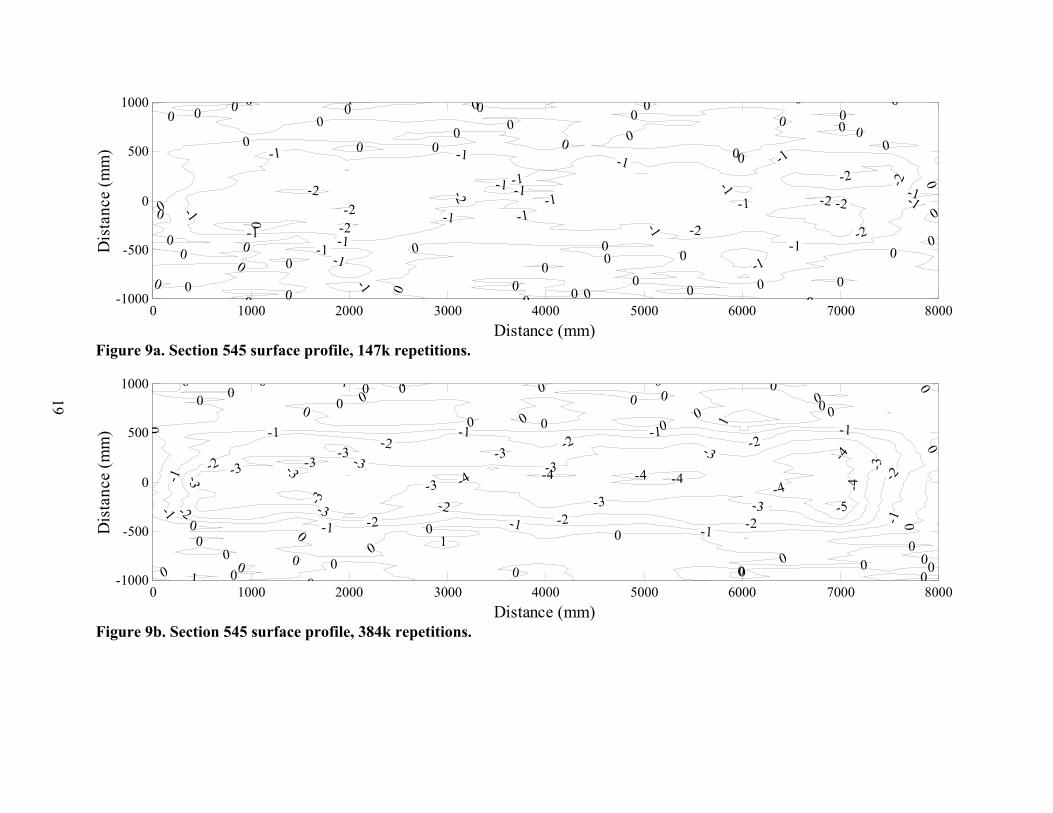
Figure 9a–9c shows the rut depth distributions at the end of the 40-, 80-, and 100-kN
trafficking loads, respectively. Rut distributions are fairly uniform throughout the section with
greater rutting localized around Station 8. The center of the HVS wheelpath corresponds to 0 mm
transverse distance; the rut depths are given in millimeters.
18
0 1000 2000-1000
-500
0
500
1000D
ista
nce
(mm
)0 00 0
00
00
00
00 0 00
0
0
0 0
00
0
0
1
-1
-1
-1-1
-1-1
-1
-2-2
-2
Figure 9a. Section 545 surface profile, 147k repeti
0 1000 2000-1000
-500
0
500
1000
-3
-3
-3
-3-3 -3
-3
-3
-3
-2-2
-2
-2
Dis
tanc
e (m
m)
1
-1
-1
-1
-1
0 0
00
00
0
0 00
0
00
0
0
00
00
0
00 1
1
Figure 9b. Section 545 surface profile, 384k repeti
19
3000 4000 5000 6000 7000 8000Distance (mm)
0 0
00
0
00
0 0
0
0
0
0
0
00
0
0
0000 00
000 0
0
0
000
0
-1
-1-1-1
-1 -1 -1
-1
-1
-1
-1
-1
-1-1 -1-1
-2 -2
-2
-2
-2
-2
-2
tions.
3000 4000 5000 6000 7000 8000Distance (mm)
-5
-4
-4 -4
-4 -4-4 -4
-3 -3
-3
-3-3
-3
-2 -2
-2
-2-2
-2-1 -1
-1
-1-1-1
0
0 0
0
0
0 00
00
0
00
000 0
0
0
0 0
0
0
0 0
0
1
1
tions.

0 1000 2000-1000
-500
0
500
1000
-8
-6
-6
-6
-4
-4-4
-2
-2
-2-2
Dis
tanc
e (m
m)
0 0
0
0
00
0
0
00
00
0
0
0
0
00
00
0
22
2
2
2
44
Figure 9c. Section 545 surface profile, 742k repetit
20
Figure 9. Section 545 surface profile at various sta
3000 4000 5000 6000 7000 8000Distance (mm)
-12-10
-10-10 -10
-8-8-8
-8-8
-8
-6 -6
-6
-6-6
-4 -4 -4
-4-4
-2 -2
-2
-2-2
0 0 0 0
00
0
0
0
0
0
0
00
00
0
0
0
0
0 0
0 0
ions.
ges of HVS trafficking.

3.2.2 In-depth Permanent Deformation
Figure 10 shows the permanent deformation recorded at various depths in the test section
using the MDDs installed near Station 7 (refer to Figure 1 for instrument depths). The
deformation data at the subgrade level are not presented because the two MDD modules installed
at those depths did not function properly.
The rapid increase in permanent deformation with load applications is evident for all the
layers under the 80- and 100-kN load.
Figure 11 summarizes the development of permanent deformation in each layer. Note
that it was not possible to separate permanent deformation occurring in the subbase and
subgrade. Table 5 summarizes the average contributions of the asphalt concrete, aggregate base,
and aggregate subbase/subgrade to permanent deformation during loading. These contributions
are based on MDD data illustrated in Figure 10. Of particular importance is the proportionate
increase in permanent deformation in the untreated aggregate base, which can be attributed to the
increase in stress in this layer and its reduced stiffness due to increase moisture content.
Table 5 Contribution in Percent of Pavement Component to Surface Rutting Stage of Testing Based on Trafficking Loads Pavement Component 40 kN 80 kN 100 kN
Asphalt Layers 43 48 16 Aggregate Base 44 40 74 Aggregate Subbase and Subgrade 13 11 10
3.2.3 Comparison with Section 544
Sections 545 and 544 were tested under similar conditions. That is, both contained
untreated bases (undrained) which were saturated prior to testing, as described in Section 2 of
this report. The difference between the two sections was in the type of overlay. Section 544
21

0
5
10
15
20
25
- 200,000 400,000 600,000 800,000 1,000,000 1,200,000 1,400,000
HVS Load Applications
Perm
anen
t Def
orm
atio
n, m
m
0 mm, Surface
220 mm, Aggregate Base
498 mm, Aggregate Subbase
MDD Depth
40 kN 80 kN 100 kN
Figure 10. In-depth permanent deformations in Section 545 near Station 7.
0
2
4
6
8
10
12
14
16
18
20
- 200,000 400,000 600,000 800,000 1,000,000 1,200,000 1,400,000
HVS Load Applications
Perm
anen
t Def
orm
atio
n, m
m
Asphalt Concrete Layers
Aggregate Base
Aggregate Subbase + Subgrade
Pavement Layer
40 kN 80 kN 100 kN
Figure 11. Permanent deformation within pavement lyaers in Section 545 near Station 7.
22

contained a 51-mm thick ARHM-GG surface course whereas Section 545 was surfaced with a
90-mm thick conventional DGAC mix. Figure 12 contains a summary of the permanent
deformations occurring in the AC surface layers, the untreated base, and the subbase/subgrade
combination for both test sections.
In Figure 12, it will be noted that permanent deformations contributed by the
subbase/subgrade combination are similar for the two sections. However, the permanent
deformation in the AC layer is higher in Section 544 than Section 545 while the reverse is true
for the saturated untreated base courses under the 100-kN loading. This difference suggests that
the local stresses in the base of Section 545 were likely higher and/or the base stiffness was less
as compared to the base for Section 544. Comparisons of the elastic deformations for the two
base courses to support such a hypothesis, as discussed in Section 3.3
0
5
10
15
20
25
- 200,000 400,000 600,000 800,000 1,000,000 1,200,000 1,400,000
HVS Applications
Perm
anen
t Def
orm
atio
n, m
m
544 Surface (ARHM)544 Aggregate Base544 Aggregate Subbase545 Surface (DGAC)545 Aggregate Base545 Aggregate Subbase
Lower AC
Higher AC
Lower AB Higher AB
Figure 12. Comparison of permanent deformations on Sections 544 ad 545.
23

3.3 Elastic Deflections
Elastic deflections in the pavement sections were measured with the Road Surface
Deflectometer (RSD) and MDDs. Surface and in-depth deflection data presented in the following
sections are peak values obtained from the deflection basins.
3.3.1 Surface Deflection Data
Surface elastic deflections were monitored using the RSD along the section centerline at
Stations 4, 6, 8, 10, and 12 under the 40-, 80-, and 100-kN test loads. Figure 13 shows average
deflection data for the three test loads. Considering the measurements with the 40-kN load in this
figure, it will be noted that the elastic deflections increased with successive load applications
with significant increases as the trafficking load was increased from 40 kN to 80 kN and then to
0
500
1000
1500
2000
2500
- 200,000 400,000 600,000 800,000 1,000,000 1,200,000 1,400,000
HVS Load Applications
Elas
tic D
efle
ctio
n, m
× 1
0-6
40 kN
80 kN
100 kN
Test Load
40 kN 80 kN 100 kN
Figure 13. Average RSD deflections for Section 545.
24
100 kN. These measurements suggest that cracking developed in the asphalt concrete with
damage developing progressively with increased repetitions.
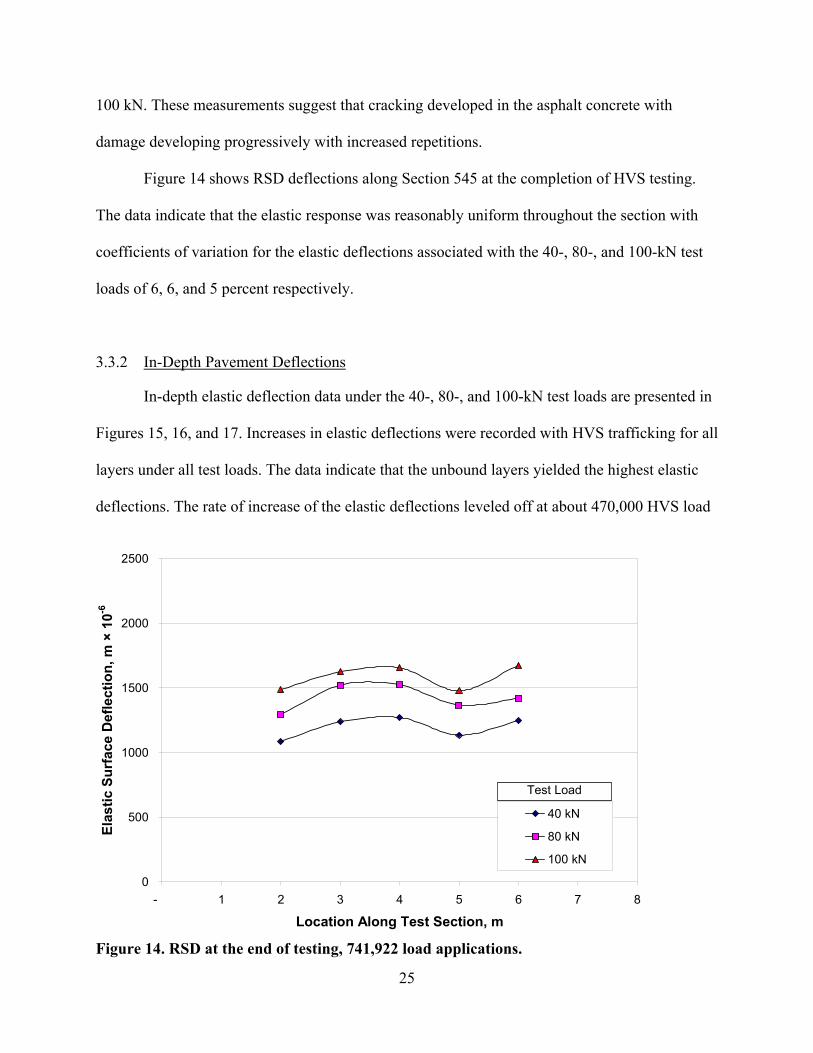
Figure 14 shows RSD deflections along Section 545 at the completion of HVS testing.
The data indicate that the elastic response was reasonably uniform throughout the section with
coefficients of variation for the elastic deflections associated with the 40-, 80-, and 100-kN test
loads of 6, 6, and 5 percent respectively.
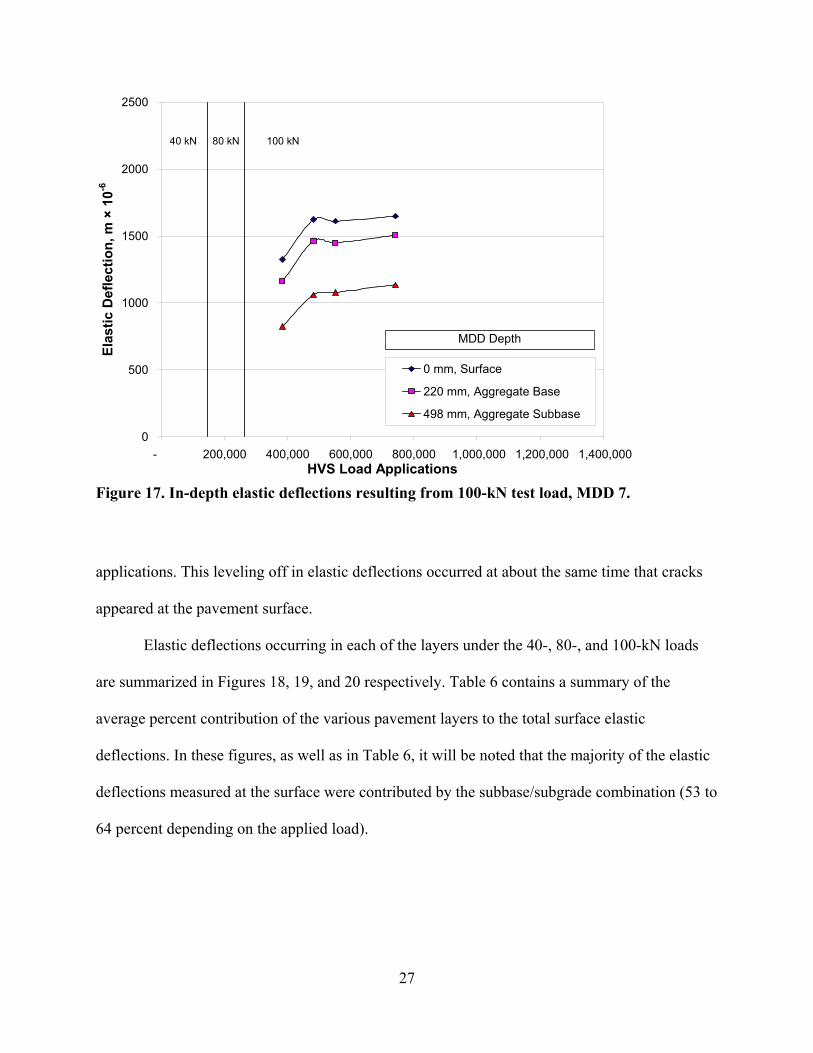
3.3.2 In-Depth Pavement Deflections
In-depth elastic deflection data under the 40-, 80-, and 100-kN test loads are presented in
Figures 15, 16, and 17. Increases in elastic deflections were recorded with HVS trafficking for all
layers under all test loads. The data indicate that the unbound layers yielded the highest elastic
deflections. The rate of increase of the elastic deflections leveled off at about 470,000 HVS load
0
500
1000
1500
2000
2500
- 1 2 3 4 5 6 7 8
Location Along Test Section, m
Elas
tic S
urfa
ce D
efle
ctio
n, m
× 1
0-6
40 kN
80 kN
100 kN
Test Load
Figure 14. RSD at the end of testing, 741,922 load applications.
25

0
500
1000
1500
2000
2500
- 200,000 400,000 600,000 800,000 1,000,000 1,200,000 1,400,000HVS Load Applications
Elas
tic D
efle
ctio
n, m
× 1
0-6
0 mm, Surface
220 mm, Aggregate Base
498 mm, Aggregate Subbase
MDD Depth 40 kN 80 kN 100 kN
Figure 15. In-depth elastic deflections resulting from 40-kN test load, MDD 7.
0
500
1000
1500
2000
2500
- 200,000 400,000 600,000 800,000 1,000,000 1,200,000 1,400,000HVS Load Applications
Elas
tic D
efle
ctio
n, m
× 1
0-6
0 mm, Surface
220 mm, Aggregate Base
498 mm, Aggregate Subbase
MDD Depth
40 kN 80 kN 100 kN
Figure 16. In-depth elastic deflections resulting from 80-kN test load, MDD 7.
26
0
500
1000
1500
2000
2500
- 200,000 400,000 600,000 800,000 1,000,000 1,200,000 1,400,000HVS Load Applications
Elas
tic D
efle
ctio
n, m
× 1
0-6
0 mm, Surface
220 mm, Aggregate Base
498 mm, Aggregate Subbase
MDD Depth
40 kN 80 kN 100 kN
Figure 17. In-depth elastic deflections resulting from 100-kN test load, MDD 7.
applications. This leveling off in elastic deflections occurred at about the same time that cracks
appeared at the pavement surface.
Elastic deflections occurring in each of the layers under the 40-, 80-, and 100-kN loads
are summarized in Figures 18, 19, and 20 respectively. Table 6 contains a summary of the
average percent contribution of the various pavement layers to the total surface elastic
deflections. In these figures, as well as in Table 6, it will be noted that the majority of the elastic
deflections measured at the surface were contributed by the subbase/subgrade combination (53 to
64 percent depending on the applied load).
27
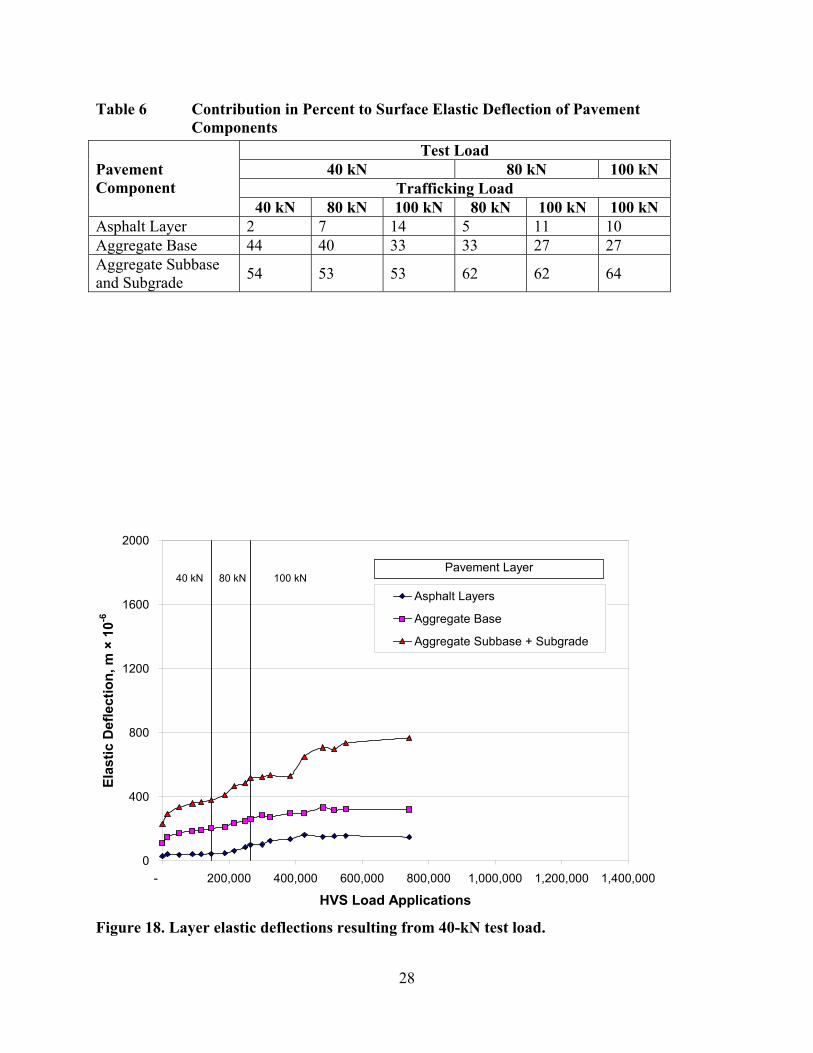
Table 6 Contribution in Percent to Surface Elastic Deflection of Pavement Components
Test Load 40 kN 80 kN 100 kN
Trafficking Load Pavement Component
40 kN 80 kN 100 kN 80 kN 100 kN 100 kN Asphalt Layer 2 7 14 5 11 10 Aggregate Base 44 40 33 33 27 27 Aggregate Subbase and Subgrade 54 53 53 62 62 64
0
400
800
1200
1600
2000
- 200,000 400,000 600,000 800,000 1,000,000 1,200,000 1,400,000
HVS Load Applications
Elas
tic D
efle
ctio
n, m
× 1
0-6
Asphalt Layers
Aggregate Base
Aggregate Subbase + Subgrade
Pavement Layer 40 kN 80 kN 100 kN
Figure 18. Layer elastic deflections resulting from 40-kN test load.
28

0
400
800
1200
1600
2000
- 200,000 400,000 600,000 800,000 1,000,000 1,200,000 1,400,000
HVS Load Applications
Elas
tic D
efle
ctio
n, m
× 1
0-6
Asphalt Layers
Aggregate Base
Aggregate Subbase + Subgrade
Pavement Layer 40 kN 80 kN 100 kN
Figure 19. Layer elastic deflections resulting from 80-kN test load.
0
400
800
1200
1600
2000
- 200,000 400,000 600,000 800,000 1,000,000 1,200,000 1,400,000HVS Load Applications
Elas
tic D
efle
ctio
n, m
× 1
0-6
Asphalt Layers
Aggregate Base
Aggregate Subbase + Subgrade
Pavement Layer 40 kN 80 kN 100 kN
Figure 20. Layer elastic deflections resulting from 100-kN test load.
29
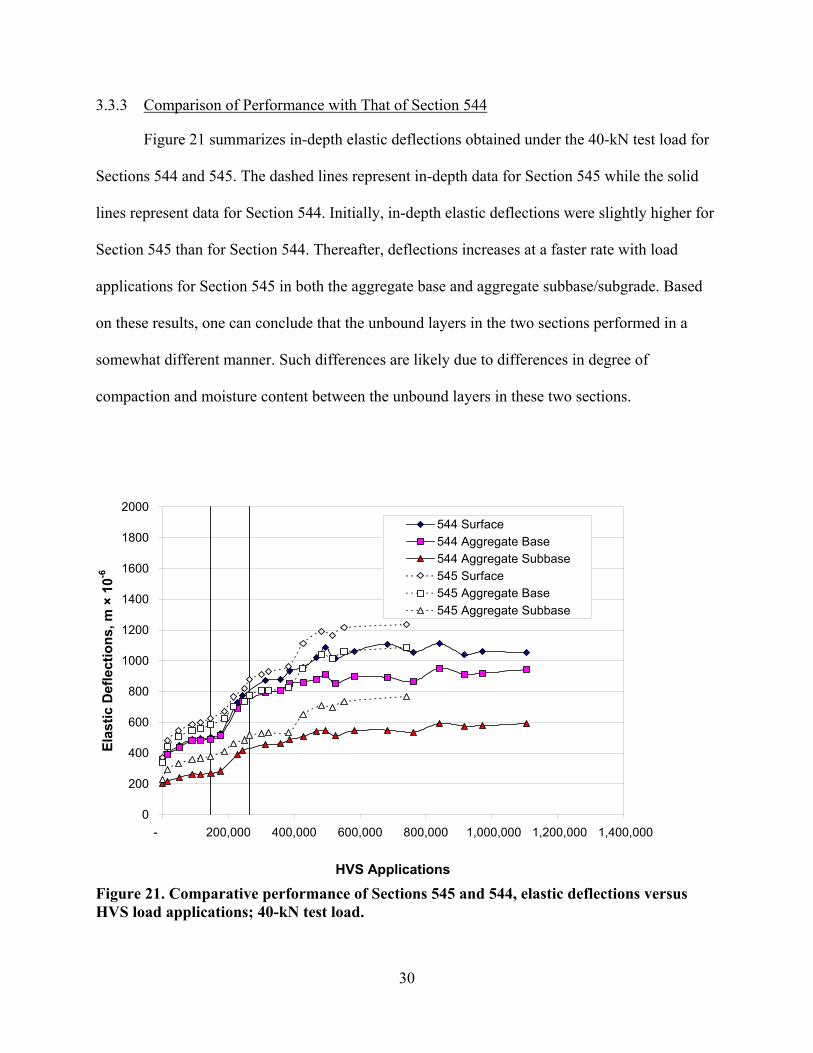
3.3.3 Comparison of Performance with That of Section 544
Figure 21 summarizes in-depth elastic deflections obtained under the 40-kN test load for
Sections 544 and 545. The dashed lines represent in-depth data for Section 545 while the solid
lines represent data for Section 544. Initially, in-depth elastic deflections were slightly higher for
Section 545 than for Section 544. Thereafter, deflections increases at a faster rate with load
applications for Section 545 in both the aggregate base and aggregate subbase/subgrade. Based
on these results, one can conclude that the unbound layers in the two sections performed in a
somewhat different manner. Such differences are likely due to differences in degree of
compaction and moisture content between the unbound layers in these two sections.
0
200
400
600
800
1000
1200
1400
1600
1800
2000
- 200,000 400,000 600,000 800,000 1,000,000 1,200,000 1,400,000
HVS Applications
Elas
tic D
efle
ctio
ns, m
× 1
0-6
544 Surface544 Aggregate Base544 Aggregate Subbase545 Surface545 Aggregate Base545 Aggregate Subbase
Figure 21. Comparative performance of Sections 545 and 544, elastic deflections versus HVS load applications; 40-kN test load.
30
3.3.4 Back-calculated Moduli from In-depth Elastic Deflections
Moduli of the pavement layers were back-calculated from the in-depth elastic deflections
measured with the MDDs. Calculated deflections for the same positions were determined using
the Odemark-Boussinesq method for a four-layer system (asphalt-bound layers, aggregate base
layer, aggregate subbase, and subgrade). A non-linear subgrade was assumed. The error
(difference of the square of the measured and calculated deflections) was minimized by changing
the modulus of the layers).
Figure 22 summarizes the back-calculated moduli from the MDD data obtained for the
80- and 100-kN test load. Back-calculated moduli for the 40-kN test load yielded spurious results
and have not been included. As shown in Figure 22, the modulus of the asphalt-bound layers
with decreases from about 2000 MPa to 800 MPa over the course of HVS trafficking. The
reduction is likely due to fatigue cracking as evidenced by the cracks present on the pavement
(discussed in Section 3.4). As discussed earlier, significant damage occurred in the asphalt
concrete under the 80- and 100-kN test loads. For the untreated layers, the back-calculated
moduli of the aggregate subbase were slightly higher than those of the aggregate base and
subgrade. The low moduli in the untreated aggregate base likely resulted from increase in the
moisture content. For the subgrade, back-calculated moduli exhibited little variation throughout
the applications of the 100-kN load. It will be noted that the moduli of the subgrade were similar
to those of the aggregate base. These values likely result from the complex stress states as well as
the nonlinear response characteristics of the untreated materials.
Figure 23 shows the back-calculated moduli for the pavement layers of Section 544.
Comparisons of moduli for Sections 545 (Figure 22) and 544 (Figure 23) indicate some
differences in layer moduli. The moduli for the asphalt-bound layers were lower in Section 544
than in Section 545 due in large measure to the thinner (51 mm) and less stiff asphalt rubber hot
31

1926
1102 1033
602
1157858 797
4046 41
5147 5262
145 133 131
62
112
5243
6858 55
130
56 63 56
10
100
1000
10000
- 100,000 200,000 300,000 400,000 500,000 600,000
HVS Load Applications
Mod
ulus
(E),
MPa
E Asphalt ConcreteE Aggregate BaseE Aggregate SubbaseE subgrade
Figure 22. Layer moduli back-calculated from MDD deflections for Section 545.
8441061
744671 650 733 658 592 581 517 515
62 59 6258 6652
62 68 75 77 8583
45
6858 57 54 53 52
43 4740
72
10
100
1000
10000
- 200,000 400,000 600,000 800,000 1,000,000 1,200,000
HVS Load Applications
Mod
ulus
(E),
MPa
E Asphalt ConcreteE Aggregate BaseE Aggregate SubbaseE Subgrade
Figure 23. Layer moduli back-calculated from MDD deflections for Section 544.
32

mix surface layer. Moduli of the aggregate base in Section 545 were somewhat lower than those
for Section 544 while the moduli of the aggregate subbase for Section 545 were larger than those
for the Section 544 subbase. These may results from differences in compaction and moisture
content in the unbound layers of the two sections. It will be noted that the subgrade moduli were
about the same for both sections.
3.4 Crack Length Progression
Figure 24 shows cracks detected during HVS trafficking after 517,000 and 728,000 load
applications. The observed cracks were predominantly transverse hairline cracks and were
sometimes difficult to detect visually. The widest crack widths were approximately 0.2 mm.
These hairline cracks did not spall or increase significantly in width during HVS trafficking.
Lack of crack deterioration is attributed to the protected environment of the test section and to
lack of fines intruding into the cracks.
Variation in the severity of cracking along the test section at the completion of the HVS
trafficking is shown in Figure 25. The largest intensity of cracking occurred in the vicinity of
Station 6 (200 cm along the test section).
Figure 26 shows increase of surface crack accumulation with load applications for both
Sections 544 and 545. The first cracks appeared at about the same level of trafficking (500,000
load applications) even though Section 544 had a thinner wearing course than Section 545. By
the time the first cracks appeared, surface elastic deflections leveled off in Section 544 but
continued to increase at a slower rate in Section 545. In Section 544 [as noted in Reference (3)],
the leveling off in deflections occurred soon after the 100-kN loading started, suggesting that
crack propagation had started. In Section 545 (with the thicker asphalt concrete surface layer)
while crack propagation was occurring, the crack density at the surface was not as high as that
33

Section 545517000 Repetitions
0
100
200
300
400
500
600
0 50 1
cm across section
cm a
long
sec
tion
00
Section 545728288 Repetitions
0
100
200
300
400
500
600
0 50 1
cm across section
cm a
long
sec
tion
00
Figure 24. Surface crack schematics for Section 545.
34

5 15 25 35 45 55 65 75 85 9525
75
125
175
225
275
325
375
425
475
525
575
Position acrosssection (cm)
Position along section (cm)
545RF, 728288 Repetitions: Crack Distribution
7.5-10
5-7.5
2.5-5
0-2.5
Figure 25. Contour plot of cracking density on Section 545 at the completion of HVS trafficking.
35

0
1
2
3
4
5
6
7
- 200,000 400,000 600,000 800,000 1,000,000 1,200,000 1,400,000
HVS Load Applications
Cra
ck D
ensi
ty, m
/m2
0
200
400
600
800
1000
1200
1400
RSD
Surface Deflection, m
icrons
Section 544 ARHMSection 545 DGACRSD 40 kN 544RSD 40 kN 545
Figure 26. Comparison of crack length progression in Sections 545 and 544 together with corresponding RSD measured deflections as a function of HVS load repetitions.
observed in Section 544, indicating comparatively less damage at approximately 730,000
repetitions. Had trafficking continued, deflections in Section 545 would have reached a constant
value with a crack density similar to that exhibited in Section 544.
3.5 Falling Weight Deflectometer (FWD) Testing
FWD testing was conducted on Section 545 to evaluate the structural integrity of the
pavement and to estimate moduli of the layers from the measured deflections. FWD testing was
conducted along the centerline of the pavement at 1-foot intervals. Three load levels (20, 40, and
60 kN) were applied to assess non-linearities in the pavement response. Loads were applied to
36

the pavement by a 300-mm diameter plate. FWD data were collected during Stages 1, 2, and 4
(FWD data was not collected during Stage 3 because the FWD does not fit beneath the HVS).
3.5.1 FWD Normalized Deflections
Figure 27 summarizes FWD elastic deflections measured under the load plate. These
deflections have been moralized to a 40-kN load (termed D0) for the three test stages during
which the FWD testing was conducted. The figure shows that D1 deflections showed no
significant variation in D0 deflections occurred between Stage 1 (no water infiltration) and Stage
2 (water infiltration). However, a significant increase in deflections was observed during Stage 4.
Table 7 summarizes average normalized deflections obtained during the three periods of FWD
testing. It will be noted that in Stage 4 (after HVS testing), deflections were more than three
times those measured during Stages 1 and 2.
Table 7 Normalized Deflections (D0) in Section 545.
Stage Test Date Average Deflections, m × 10-6
Standard Deviation, m × 10-6
Average Temperature, ºC
1 May ‘99 126.2 6.0 25.8 July'99 127.5 11.5 19.0 Aug'99 132.6 11.7 19.8 Sept'99 136.8 13.8 20.2 Oct'99 138.4 14.5 22.0 Nov'99 130.1 14.0 18.8 Feb'00 116.9 8.8 12.5 Mar'00 119.2 7.1 18.0 June'00 142.9 9.2 23.0 Oct'00 129.9 8.7 18.0
2
Oct'00 137.8 11.0 16.0 4 July'01 446.4 34.7 20.0
37

0
100
200
300
400
500
600
0 2 4
Def
lect
ion,
m ×
10-6
Stage 1 May'99 @26C Stage 2 JuStage 2 Oct'99 @22C Stage 2 NoStage 2 June'00 @23C Stage 2 Oc
38
Figure 27. FWD deflections normalized to a 40-kN
6 8 10 12 14 16
Station Number
ly'99 @19C Stage 2 Aug'99 @20C Stage 2 Sep'99 @20Cv'99 @19C Stage 2 Feb'00 @12.5C Stage 2 Mar'00 @18Ct'00 @18C Stage 2 Oct'00 @16C Stage 4 July'01 @ 20C
load for Stages 1, 2, and 4.
3.5.2 Back-calculated Moduli from FWD Deflections
Moduli were back-calculated from FWD deflections obtained from the three target loads
for a three-layer system: asphalt-bound layers (AC), aggregate base layers (AB), and the
subgrade (SG). A three-layer system was selected for simplicity. The back-calculation process
was conducted using the program ELMOD 4.5, which uses the Odemark-Boussinesq method and
assumes a nonlinear subgrade. Table 8 summarizes the layers and thicknesses for the two cases
considered.
Table 8 Summary of Layers and Thicknesses Considered for Back-calculation Layer Thickness, mm AC (asphalt-bound layers) 233 AB (aggregate base and aggregate subbase) 504 SG (subgrade) assumed infinite
Results of the back-calculation process are presented in Figures 28 through 30. Results
are presented for the three load levels used during FWD testing. Also presented in the figures are
results of the back-calculation process using the MDD deflections (Stage 3) for the 80- and 100-
kN dual wheel load.
Moduli of the asphalt concrete layers are shown in Figure 28. Moduli of the combined
asphalt concrete layers ranged from 6,000 to 10,000 MPa and variations follow estimated
pavement temperatures. Pavement temperatures were estimated from air temperatures using the
BELLS equation. Asphalt concrete moduli after HVS testing were about 25 percent of the
moduli before HVS testing. Reduction in the asphalt concrete modulus reflects fatigue damage
produced by the HVS trafficking.
Moduli of the aggregate base layers are shown in Figure 29. During Stage 2, moduli
ranged from 250 to 350 MPa under the three load levels. Generally, all three load levels yielded
39

0
2000
4000
6000
8000
10000
12000
14000
16000
18000
20000
Mar-99 May-99 Aug-99 Nov-99 Feb-00 May-00 Aug-00 Nov-00 Feb-01 May-01 Aug-01 Nov-01
Date
Bac
kcal
cula
ted
Mod
ulus
, MPa
0
5
10
15
20
25
30
Asphalt C
oncrete Temperature, ºC
AC_1 AC_2 AC_3 AC_MDD ACTemp
Stage 1 Stage 2 Stage 3 Stage 4
Figure 28. Back-calculated asphalt concrete moduli.
0
100
200
300
400
500
600
700
800
Mar-99 May-99 Aug-99 Nov-99 Feb-00 May-00 Aug-00 Nov-00 Feb-01 May-01 Aug-01 Nov-01
Date
Bac
kcal
cula
ted
Mod
ulus
, MPa
AB_1 AB_2 AB_3 AB_MDD ASB_MDD
Stage 1 Stage 2 Stage 3 Stage 4
Figure 29. Back-calculated aggregate base/subbase moduli.
40

0
100
200
300
400
500
Mar-99 May-99 Aug-99 Nov-99 Feb-00 May-00 Aug-00 Nov-00 Feb-01 May-01 Aug-01 Nov-01
Date
Bac
kcal
cula
ted
Mod
ulus
, MPa
5
10
15
20
25
30
35
40
45
Subgrade Moisture C
ontent, Percent
SG_1 SG_2 SG_3 SG_MDD Volumetric Moisture Content
Stage 1 Stage 2 Stage 3 Stage 4
Figure 30. Back-calculated subgrade moduli.
similar values for the modulus. Aggregate base moduli after HVS trafficking dropped to values
between 100 and 175 MPa. The reduction is likely due to an increase in moisture content caused
by the infiltrated water, and by a change in stress state resulting from asphalt concrete damage.
Moduli and volumetric moisture contents of the subgrade layer are shown in Figure 30
for the four stages of testing. Subgrade moduli ranged from 200 to 260 MPa before testing with
higher modulus associated with higher load. The subgrade modulus dropped down to 125-150
MPa after HVS testing.
Back-calculated moduli from in-depth MDD deflections (Stage 3) are also presented in
the figures for comparison with the FWD results at the end of HVS testing (Stage 4). Back-
calculated moduli using both methods were similar for the asphalt concrete and aggregate base
layers. Moduli of the asphalt concrete back-calculated from MDD deflections were lower than
41

those back-calculated from FWD deflections. The results were expected since the rate of load
application was lower under the MDD than for FWD testing.
Back-calculated moduli for the subgrade using the MDDs were about 50 percent of those
obtained from calculations. This difference is likely related to the method used to estimate
moduli from the MDD deflection data. Since the MDD at the subgrade level was not working,
the back-calculation process did not include these data but adjusted the modulus of the subgrade
based on the deflection data of the upper layers. Nevertheless, back-calculated subgrade moduli
obtained for Sections 545 and 544 yielded similar values to those shown in Figure 30.
Differences in the moduli of the subgrade back-calculated from MDD and FWD deflections are
probably due to other factors such as rate of loading effects and stress state differences.
3.6 Forensic Activities
Forensic activities included core extraction, dynamic cone penetrometer testing, and
trenching of the test section for direct observation of deformations in the pavement structure.
Figure 31 shows a layout of the locations where forensic information was obtained.
3.6.1 Air-Void Contents from Extracted Cores
Figure 32 summarizes air-void content data for all the bound layers. No significant
reductions in air-void content were observed along the centerline of the test section.
Table 9 summarizes average air-void contents in the bound layers along three distinct
regions of the test section: 1) centerline; 2) “hump areas,” which are the zones of uplifted
material at the edges of the trafficked area; and 3) non-trafficked areas (see Figure 31 for
locations).
42
CoresCores + DCP
Test Pit
16 15 14 13 12 11 10 9 8 7 6 5 4 3 2 1 0
Station Markers
0.0 0.5 1.0m
1000 mm
500 mm
0 mm
-500 mm
-1000 mm
NTW
NTE
HW
HE
CLBW
BE
NTW
NTE
HW
HE
CLBW
BE
Non-Traffic West Side
Non-Traffic East Side
Hump West Side
Hump East Side
CenterlineBetween NT & CL West Side
Between NT & CL East Side
Figure 31 Layout of forensic measurements for Section 545.
6.16.7
7.66.66.8 6.7 6.2 5.9
7.7
3.13.7
4.45.0
3.6 3.5 3.9
8.5
6.5
4.8
6.7
4.9
0
2
4
6
8
10
12
14
16
18
20
-1500 -1000 -500 0 500 1000 1500
Pavement Cross Section, mm
Air-
Void
Con
tent
, per
cent Wearing Course
AC Top LiftAC Bottom Lift
HE HWCL
Asphalt Layer
Trafficked Area
Figure 32. Average air-void contents across Section 545.
43

3.6.2 Bonding Between Layers
The degree of bonding between asphalt layers is an important contributor to the
performance of an asphalt concrete layer. A strong bond between the layers will provide a longer
pavement life. At the conclusion of HVS loading, Section 545 exhibited no bond between the
asphalt layers in the trafficked areas, including the overlay and the existing pavement. This
differs from the results of the Goal 3 test in a similar section. It is conjectured that the higher
deflections in this test under the 80- and 100-kN loads resulting from the weakened base
contributed to this debonding, even though a tack coat had been applied at the time of
construction of the overlay.
Table 9 Summary of Air-Void Contents for Section 545 Air-Void Content in Region, Percent
Asphalt Layers Trafficked Area Hump Areas Non-Trafficked
Areas DGAC Wearing Course 6.7 7.3 5.7
Asphalt Concrete, Top Lift 6.7 6.4 6.3 Asphalt Concrete, Bottom Lift 5.0 3.6 3.5
3.6.3 Dynamic Cone Penetrometer (DCP) Data
Figures 33–35 present Dynamic Cone Penetrometer (DCP) data for Section 545 (Figure
31 shows DCP test locations). The DCP plan allows for comparison of the penetration rates of
the unbound layers in the non-trafficked and trafficked areas.
Table 10 summarizes DCP penetration rates for the aggregate base, aggregate subbase,
and subgrade. In general, the data indicate lower penetration rates for the aggregate subbase,
followed by the aggregate base, and the subgrade. Lower penetration rates indicate higher
resistance to shear. Accordingly, the aggregate subbase would be expected to have higher
resistance to shear than the aggregate base. For the aggregate base, somewhat lower penetration
44

0
200
400
600
800
1000
1200
0 50 100 150 200 250 300 350
BlowsPa
vem
ent D
epth
, mm
545-NTW545-CL545-NTE
Station 6
AB
ASB
Figure 33. DCP results for Section 545, Station 6.
0
200
400
600
800
1000
1200
0 50 100 150 200 250 300 350
Blows
Pave
men
t Dep
th, m
m
545-NTW545-CL545-NTE
Station 9
AB
ASB
Figure 34. DCP results for Section 545, Station 9.
45
0
200
400
600
800
1000
1200
0 50 100 150 200 250 300 350
BlowsPa
vem
ent D
epth
, mm
545-NTW545-CL545-NTE
Station 12
AB
ASB
Figure 35. DCP results for Section 545, Station 12.
Table 10 Summary of DCP Penetration Rates Penetration Rate (mm/blow count)
DCP Test Location* Aggregate Base Aggregate
Subbase Subgrade
NTW 2.2 2.4 20.8 CL 2.0 3.2 9.4 Station 6 NTE 3.5 0.6 12.7 NTW 2.3 1.1 10.4 CL 2.1 1.4 18.2 Station 9 NTE 3.0 1.9 14.5 NTW 2.1 1.0 19.9 CL 1.8 0.6 19.9 Station 12 NTE 2.6 1.8 10.7 NTW 2.2 1.5 17.0 CL 2.0 1.7 15.8 Average NTE 3.0 1.4 12.6
*Refer to Figure 23 for explanation of test locations.
46

rates were obtained for the centerline than in the non-trafficked areas; this difference can be
attributed to increased density produced by HVS trafficking.
The result of DCP tests in the subbase as compared to those for the base are in line with
the modulus values calculated from the MDD deflections (Figure 22).
3.6.4 Trench Data
After the completion of HVS trafficking, a transverse test pit was excavated in order to
enable direct observation of the pavement layers. Measurements from the trench were used to
estimate thickness and rutting in the pavement layers. Figures 36 and 37 show profile data at the
interface of each layer at the completion of HVS trafficking. During the data collection process,
it was difficult to establish the boundary between the asphalt concrete and the aggregate base due
to roughness at the interface of the two layers. The profiles show that the subbase thickness
varied considerably across the section. Differences in subbase thickness were anticipated and
reported in previous CAL/APT reports (4–8).
Table 11 summarizes average layer thicknesses at various locations across the both faces
of the test pit; the results are plotted in Figure 38.
Table 11 Comparison of Layer Thicknesses across Section 545 Thickness (mm) of Pavement Layer
DGAC Wearing Course DGAC Lift 1 DGAC Lift 2 Aggregate Base Aggregate
Subbase Location*
St. 9 St. 12 St. 9 St. 12 St. 9 St. 12 St. 9 St. 12 St. 9 St. 12 NT-W 90 87 60 62 86 84 260 258 204 209 H-W 92 91 59 61 87 84 249 260 218 213 B-W 91 91 59 60 83 83 251 252 229 236 CL 90 88 60 60 83 82 240 258 249 260 B-E 91 90 61 61 82 79 252 260 247 271 H-E 92 91 61 62 81 80 271 255 262 295 NT-E 90 90 63 62 77 79 260 260 260 300 *Refer to Figure 31 for explanation of pavement locations.
47

0
50
100
150
200
250
300
350
400
450
500
550
600
650
700
750
800
850
900
100
200
300
400
500
600
Dep
th, m
m
DGAC Overlay
DGAC Upper Layer
Subgrade
Aggregate Subbase
Aggregate Base
DGAC Upper Layer
48
Figure 36. Trench data, south face of trench at St
700
800
900
1000
1100
1200
1300
1400
1500
1600
1700
1800
Distance, mm
Trafficked Area
ation 12, Section 545.

0
50
100
150
200
250
300
350
400
450
500
550
600
650
700
750
800
850
900
100
200
300
400
500
600
Dep
th, m
m
DGAC Overlay
DGAC Upper Layer
Subgrade
Aggregate Subbase
Aggregate Base
DGAC Lower Layer
49
Figure 37. Trench data, north face of trench at St
700
800
900
1000
1100
1200
1300
1400
1500
1600
1700
1800
Distance, mm
Trafficked Area
ation 9, Section 545.

0
10
20
30
40
50
60
70
80
90
DGAC Top Layer AC Top Lift AC Bottom Lift
Pavement Layer
Laye
r Thi
ckne
ss, m
m NTWHWBWCLBEHENTEAverage
Figure 38a. Asphalt-bound layers.
0
50
100
150
200
250
300
350
Aggregate Base Aggregate Subbase
Pavement Layer
Laye
r Thi
ckne
ss, m
m NTWHWBWCLBEHENTEAverage
Figure 38b. Untreated aggregate layers. Figure 38. Measured layer thicknesses in test pit.
50

With this variability occurring before trafficking, it was difficult to establish the level of
rutting of the individual layers. In addition, measurement variability and roughness at the layer
interfaces made it difficult to determine the level of rutting in each individual layer from the
thickness measurements, particularly in the unbound layers.
Based on the information provided by the MDDs and air-void content data, little rutting
occurred in the DGAC layer since no significant variation in air-void content was observed.
Based on the MDD data, a total of 2 mm of rutting was measured for the asphalt concrete layers.
Due to variability in asphalt concrete thickness in the test pit, the MDD measurements could not
be verified. From the same MDD data, 7 mm of rutting was measured in the aggregate base. This
also could not be verified using the test pit data.
51

52

4.0 PERFORMANCE EVALUATION AND MECHANISTIC ANALYSIS
At the end of HVS testing, Section 545 was subjected to 147,000 applications of the 40-
kN load, 117,000 applications of the 80-kN load, and 477,000 applications of the 100-kN load.
The number of applied loads were converted to equivalent 80-kN single axle loads (ESALs)
using a load equivalency exponent of 4.2 per Caltrans procedures, which results in a total of 21.3
million ESALs. The number of ESALs to failure as defined in the test program for surface
rutting (12.5 mm) and cracking (2.5 m/m2) were 73.3 and 21.3 million, respectively. Like
Section 544, Section 545 failed by fatigue cracking. The rutting failure level was not reached
during testing, thus the 37.3 million ESALs is only an estimate.
Results of this test provided the opportunity to compare the performance of the 90-mm
DGAC overlay with the 50-mm ARHM-GG overlay of Section 544 under saturated base
conditions. Failure in fatigue occurred at about 14.3 million ESALs for Section 544, somewhat
less than the 21.3 million ESALs for Section 545.
To compare the performance of Section 544 and 545, mechanistic analyses were
performed on the response of the two sections to 40- and 100-kN single wheel loads.
4.1 Pavement Responses
Pavement responses considered for analysis included the tensile strain on the underside of
the asphalt concrete layer and the vertical compressive strain at the surface of the unbound
layers. Table 12 summarizes the pavement thicknesses and layer moduli for the two sections.
The layer moduli selected were average back-calculated moduli obtained from FWD testing.
53

Table 12 Summary of Pavement Structures for Analysis Test Section Layer Thickness, mm Moduli before HVS testing, MPa
AC 200 5900 AB 532 338 544 SG 195 AC 233 7480 AB 504 308 545 SG 216
Table 13 summarizes the calculated responses under 40- and 100-kN wheel loads on dual
tires for the two cases considered. These responses suggest that Section 545 should perform
slightly better than Section 544 as indicated by lower tensile strains and lower stresses at the
surface of the aggregate base for Section 545.
Table 13 Summary of Pavement Responses under 40-kN Load
Section 544 Section 545 Pavement Response 40 kN 100 kN 40 kN 100 kN Tensile Strain Bottom of AC, µstrain 67 146 45 105 Vertical Stress Top of AB, kPa 65 148 40 94 Vertical Stress Top of SG, kPa 27 58 25 54
4.2 Fatigue Analyses
The fatigue analysis and design system used in this report is presented Figure 39 and
discussed in Reference (9).
For this particular analysis, a design reliability of 50 percent was assumed, obtaining a
reliability multiplier of 1.0. The laboratory fatigue life equation for the mixes used in the
simulation is:
εln14248.4106663.09295.21ln −−−= AVN (1)
where: N = the number of repetitions to failure obtained from laboratory fatigue beam
tests tested under strain control, AV = the percent air-void content of the mix, and ε = the tensile strain at the bottom of the asphalt concrete.
54
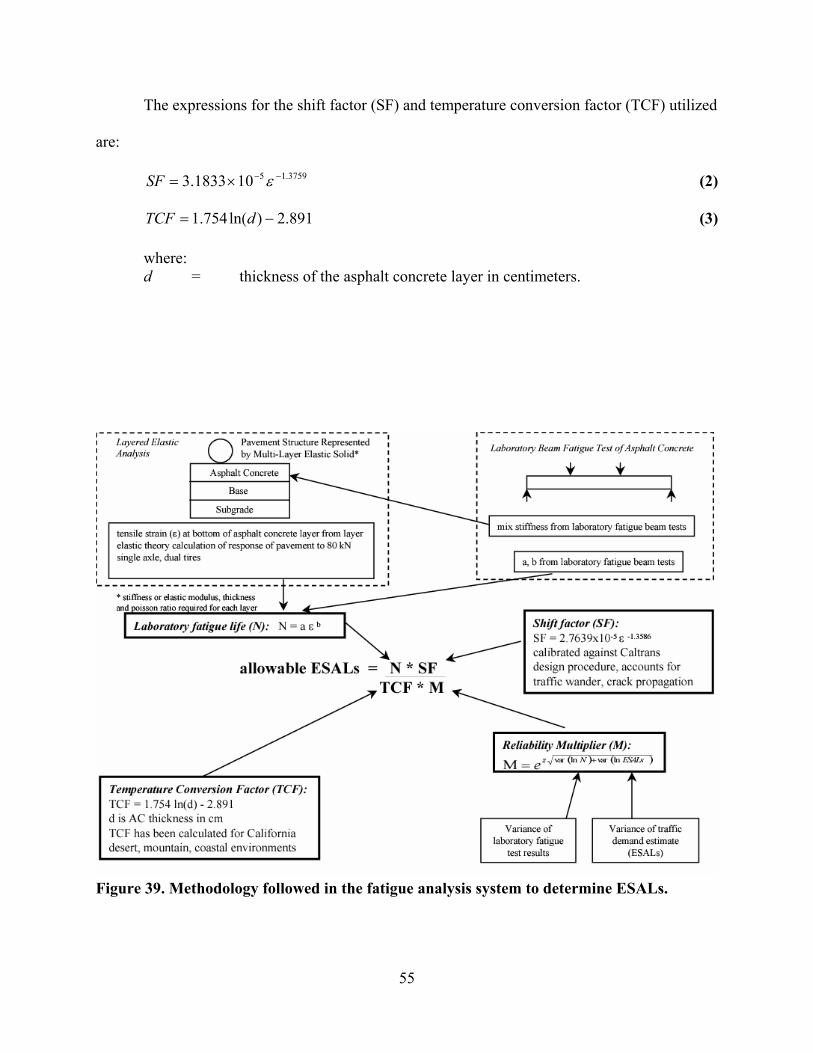
The expressions for the shift factor (SF) and temperature conversion factor (TCF) utilized
are:
(2) 3759.15101833.3 −−×= εSF
(3) 891.2)ln(754.1 −= dTCF
where: d = thickness of the asphalt concrete layer in centimeters.
Figure 39. Methodology followed in the fatigue analysis system to determine ESALs.
55

The results of the simulation process are summarized in Table 14.
Table 14 Summary of Calculation of ESALs using the UCB Fatigue Analysis System Case µStrain AV, % ln N N, millions SF tAC, cm TCF M ESALs, millionsSection 544, 40 kN 67 4.6 17.40 35.9 17.6 20.0 2.36 1 267
Section 544, 100 kN 146 4.6 14.17 1.4 6.0 20.0 2.36 1 3.6
Section 545, 40 kN 50 4.6 18.61 120.7 26.3 23.3 2.63 1 1,209
Section 545, 100kN 105 4.6 15.54 5.6 9.5 23.3 2.63 1 20.1
The results of the simulation suggest that Section 545 should have at least 4 times the
fatigue life of that of Section 544. However, the HVS testing indicated that the fatigue life of
Section 545 was only about 1.5 times longer than that of Section 544. This difference between
the simulation and the actual performance may result from some differences in the characteristics
of the materials used as well as assumptions about thicknesses and moduli of the asphalt bound
layers. For example, it was assumed that the asphalt layers of both sections consisted of the same
AR-4000 DGAC mix. While this is true for Section 545, the upper 50 mm of the asphalt-bound
layer of Section 544 consisted of an ARHM-GG mix with somewhat different fatigue
characteristics.
Thus, while the results of the simulation do not produce a one-to-one correspondence, the
HVS results support the current Caltrans practice of using an overlay thickness of ARHM-GG of
one-half that for a DGAC overlay, even for the saturated base conditions.
56

5.0 SUMMARY AND CONCLUSIONS
5.1 Summary
This report presents the results of accelerated pavement testing and associated activities
of Section 545 under the Goal 5 research project. Section 545 is a flexible pavement that does
not include the 75-mm layer of ATPB between the asphalt concrete and the aggregate base layers
and was designated as an undrained section. This report includes the analysis for the four stages
of testing considered in the Goal 5 test plan for Section 545. Results of the accelerated pavement
testing provided data to measure and compare the performance of two undrained structures with
ARHM-GG and DGAC wearing courses under wet conditions.
The test program for Section 545 was begun in April 2001 and was completed in August
2001. Under HVS testing, 742,000 total repetitions were applied to the section consisting of
147,000 repetitions under the 40-kN dual wheel load, 117,000 repetitions under the 80-kN load,
and 477,000 repetitions under the 100-kN load. The section was trafficked under conditions of
wet base which was accomplished using a water infiltration system. The wet base condition
simulated precipitation for an average peak week of 51.3 mm typical of the environment of
Eureka, CA.
Section 545 failed in fatigue after being subjected to 21 million ESALs (based on the
Caltrans load equivalency exponent of 4.2). When tested with the untreated base in the wet
condition. The performance of Section 545 (DGAC overlay) was slightly better than that of
Section 544 (ARHM-GG overlay)—21 million versus 14 million ESALs to failure. This
difference was most likely caused by the differences in thickness and stiffness of the two overlay
materials.
57

Because of the increased moisture content in the untreated base, pavement deflections in
Section 545 were significantly larger than those for the comparable sections tested in the dry
condition. Whereas for tests with the base in the dry condition, there was no debonding of the
overlay from the existing pavement, debonding was observed in the overlay in Section 545 even
though a tack coat had been applied. This debonding likely occurred when the 80- and 100-kN
loads were applied.
5.2 Conclusions
Results of the test on Section 545 and associated response and performance analyses
suggest the following conclusions:
1. Section 545, tested in the wet base condition, failed in fatigue after being subjected to
an equivalent loading of 21 million ESALs. Even though the stiffness of the base was
reduced due to the increase moisture content, it was estimated that it would require an
additional 16 million ESALs to reach the limiting rut depth of 13 mm.
2. While the bond between the two lifts of DGAC in the initial pavement was weak due
to the lack of a tack coat (10), one had been applied prior to placing the DGAC
overlay. In spite of this, because of the increased deflections due to the 80- and 100-
kN loads, debonding was also observed between the overlay and the existing
pavement. The likelihood of deflections being as large as observed in Section 545 if
the existing layers had been well bonded would have been reduced considerably.
Thus, even with the weakened base condition, the analyses (presented in Section 4)
suggest that a substantially larger number of ESALs could have been applied. This
reinforces an earlier recommendation that tack coast should be applied between all
lifts in asphalt concrete construction (11).
58

3. The use of mechanistic analysis, as discussed in Section 4, provides reasonable
measures of comparative performance of different pavement materials and continues
to emphasize the importance of its use in the design of new and rehabilitated
pavements, e.g., comparison of the performance of Sections 545 and 544.
4. Results of the FWD testing provided reasonable results for the impacts of increased
moisture content in the stiffness of the untreated materials in both Sections 545 and
544. These results most definitely support the continued use of data obtained from
FWD testing being conducted as a part of PPRC seasonal monitoring program.
5. FWD testing was effective in establishing the structural condition of the pavement
sections during all stages of testing. Changes in the modulus of the layers due to
moisture content changes and trafficking were effectively determined by the device.
The slight differences in performance seem to be correlated to differences in layer
moduli in the asphalt concrete and aggregate base layers.
5.3 Recommendations
1. Better compaction in the ARHM layer can greatly increase the performance of this
layer.
59

60

6.0 REFERENCES
1. Harvey, J., M.O. Bejarano, A. Ali. Test Plan for Goal 5: Performance of Drained and Undrained Flexible Pavement Structures under Wet Conditions. Pavement Research Center, Cal/APT Program, Institute of Transportation Studies, University of California, Berkeley.
2. Harvey, J., Chong, A., Roesler, J. Climate Regions for Mechanistic-Empirical Pavement Design in California and Expected Effects on Performance. Draft report prepared for California Department of Transportation. Pavement Research Center, CAL/APT Program, Institute of Transportation Studies, University of California, Berkeley. June 2000.
3. Bejarano, M.O., J.T. Harvey, A. Ali, D. Mahama, D. Hung, and P. Preedonant. Performance of Drained and Undrained Flexible Pavement Structures under Wet Conditions, Accelerated Test Data Test Section 544—Undrained. Report prepared for the California Department of Transportation. Pavement Research Center, Institute of Transportation Studies, University of California at Berkeley. Revision December 2004.
4. Harvey, J. T., L. du Plessis, F. Long, S. Shatnawi, C. Scheffy, B-W. Tsai, I. Guada, D. Hung, N. Coetzee, M. Reimer, and C. L. Monismith. Initial CAL/APT Program: Site Information, Test Pavement Construction, Pavement Materials Characterizations, Initial CAL/APT Test Results, and Performance Estimates. Report prepared for the California Department of Transportation. Report No. RTA-65W485-3. Pavement Research Center, CAL/APT Program, Institute of Transportation Studies, University of California, Berkeley, June 1996, 305 pp.
5. Harvey, John T., Louw du Plessis, Fenella Long, John A. Deacon, Irwin Guada, David Hung, Clark Scheffy. CAL/APT Program: Test Results from Accelerated Pavement Test on Pavement Structure Containing Asphalt Treated Permeable Base (ATPB) Section 500RF. Report No. RTA-65W485-3. Report Prepared for California Department of Transportation. Pavement Research Center, CAL/APT Program, Institute of Transportation Studies, University of California, Berkeley. June 1997.
6. Harvey, J., J. Prozzi, J. Deacon, D. Hung, I. Guada, L. du Plessis, F. Long, and C. Scheffy. CAL/APT Program: Test Results from Accelerated Pavement Test on Pavement Structure Containing Aggregate Base (AB)--Section 501RF. Report prepared for the California Department of Transportation. Pavement Research Center, CAL/APT Program, Institute of Transportation Studies, University of California, Berkeley. Draft submitted September 1997. Final submitted April 1999.
7. Harvey, J., I. Guada, C. Scheffy, L. Louw, J Prozzi, and D. Hung. CAL/APT Program: Test Results from Accelerated Pavement Test on Pavement Structure Containing Asphalt Treated Permeable Base--Section 502CT. Draft report submitted to California Department of Transportation. Pavement Research Center, CAL/APT Program, Institute of Transportation Studies, University of California, Berkeley. February 1998.
8. Harvey, J., D. Hung, J. Prozzi, L. Louw, C. Scheffy, and I. Guada. CAL/APT Program: Test Results from Accelerated Pavement Test on Pavement Structure Containing Untreated Aggregate Base--Section 503RF. Draft report submitted to California Department of
61

62
Transportation. Pavement Research Center, CAL/APT Program, Institute of Transportation Studies, University of California, Berkeley. December 1997.
9. Manuel O. Bejarano, John T. Harvey, Abdikarim Ali, Mark Russo, David Mahama, Dave Hung, and Pitipat Preedonant. Performance of Drained and Undrained Flexible Pavement Structures under Wet Conditions Test Data from Accelerated Pavement Test Section 543-Drained. Draft report prepared for the California Department of Transportation. Pavement Research Center, Institute of Transportation Studies, University of California Berkeley, University of California Davis. February 2004.
10. Harvey, J., M. O. Bejarano, A. Fantoni, A. Heath, and H. C. Shin. Performance of Caltrans Asphalt Concrete and Asphalt-Rubber Hot Mix Overlays at Moderate Temperatures – Accelerated Pavement Testing Evaluation. Draft report submitted to California Department of Transportation. Pavement Research Center, CAL/APT Program, Institute of Transportation Studies, University of California, Berkeley. July 2000.
11. Harvey, J.T., J. Roesler, N.F. Coetzee, and C.L. Monismith. Caltrans Accelerated Pavement Test (CAL/APT) Program Summary Report Six-Year Period 1994-2000. Report prepared for the California Department of Transportation. Pavement Research Center, Institute of Transportation Studies, University of California Berkeley. June 2000.