performance of socially responsible indices during market...
TRANSCRIPT

PERFORMANCE OF SOCIALLY RESPONSIBLE INDICES
DURING MARKET CRISIS IN NORTH AMERICA AND EUROPE
by
Pei-Hsuan (Sabrina) Tsai
Bachelor, Simon Fraser University, 2004
and
Hao (Victoria) Yu
Bachelor, Qingdao University, 2013
PROJECT SUBMITTED IN PARTIAL FULFILLMENT OF
THE REQUIREMENTS FOR THE DEGREE OF
MASTER OF SCIENCE IN FINANCE
In the Master of Science in Finance Program
of the
Faculty
of
Business Administration
SIMON FRASER UNIVERSITY
Fall 2015
All rights reserved. However, in accordance with the Copyright Act of Canada, this work
may be reproduced, without authorization, under the conditions for Fair Dealing.
Therefore, limited reproduction of this work for the purposes of private study, research,
criticism, review and news reporting is likely to be in accordance with the law,
particularly if cited appropriately.

ii
Approval
Name: Pei-Hsuan (Sabrina) Tsai Hao (Victoria) Yu
Degree: Master of Science in Finance
Title of Project: Performance of Socially Responsible Indices during
Market Crisis in North America and Europe
Supervisory Committee:
Senior Supervisor
Professor Peter Klein
Second Reader
Associate Professor Jijun Niu
Date Approved:

iii
Abstract
This paper investigates whether socially responsible investment indices in the
United States, Canada, the Eurozone and the United Kingdom provide downside protection
during market crisis when compared to their respective market indices. Socially
responsible investment indices in US and Canada perform similarly to their market indices
during market crisis periods between 2000 and 2014, offering neither downside protection
nor excess return in overall market conditions. In Eurozone, the socially responsible
investment index we selected performs worse than their market index during both the
Financial Crisis and the Euro Crisis but not during the Tech Bubble. In the United
Kingdom, socially responsible investment index underperforms its respective market index
during all crisis periods, including the Tech Bubble, Financial Crisis and the Euro Crisis
but outperforms during non-crisis periods. Overall, we do not find that SRI indices offer
downmarket protection in North America and Europe.
Keywords: Social Responsible Investment; ESG, ethical investing, SRI; SRI Index; Performance
Comparison; CAPM; Fama French Three Factors Model; Carhart Four Factors Model; Alpha;
Non-Crisis; market crisis, downside protection

iv
Acknowledgements
Foremost, we would like to thank our Senior Supervisor, Dr. Peter Klein, for his
guidance and support in our graduation research project. With our existing interest in
responsible investments, Dr. Klein further heightened our understanding of socially
responsible investment in his lectures. Socially responsible investment has been a
controversial topic for us and for the investment industry. From him, we learned how to
think critically when reviewing research papers and gained exposure to how to industry
professional approach investment management. We are very grateful that we are able to
learn from such an amazing professor who has broad achievement in many professional
fields. We would like to thank Dr. Jijun Nui for agreeing to be our Second Reader. Dr. Nui
is an accomplished researcher who has given us valuable feedback on our project. We
would like to express gratitude to Dr. Robert Grauer, a leading researcher in portfolio
management. We learned the development of the portfolio theory and the CAPM and
Fama-French Three Factor test which serves as the technical backbone of our paper. We
are also grateful for Dr. Derek Yee’s teaching which gave us the CFA “Gold Standard”
approach to portfolio management. We also would like to thank Dr. Jan Simon who further
strengthened our understanding of ethics which is the philosophy behind socially
responsible investments.
It is been an incredible experience studying at the Beedie School of Business at
Simon Fraser University. We thank all the staff at Beedie School of Business for making
our educational experience a success. We feel as if we have been transformed over the last
16 months from something dull and rough around the edges to something that is ready to
make positive contributions to society.

v
Table of Contents
Approval ......................................................................................................................................... ii
Abstract ......................................................................................................................................... iii
Acknowledgements ....................................................................................................................... iv
Table of Contents ............................................................................................................................v
1: Introduction ................................................................................................................................1
2: Literature Review and Hypothesis Development ....................................................................5
2.1 Literature Review ...................................................................................................................5
2.2 Hypothesis Development ........................................................................................................8
3: Data and Methods ......................................................................................................................9
3.1 SRI and Market Indices ..........................................................................................................9
3.1.1 United States of America .................................................................................................9
3.1.2 Canada ...........................................................................................................................10
3.1.3 Eurozone (Europe ex. UK) ............................................................................................11
3.1.4 United Kingdom ............................................................................................................12
3.2 Crisis Periods ........................................................................................................................14
3.3 Performance Evaluation Model ............................................................................................16
4: Performance..............................................................................................................................19
4.1 Replication of Nofsinger and Varma’s (2014) Results .........................................................19
4.2 Our Results ...........................................................................................................................20
5: Summary ...................................................................................................................................26
References .....................................................................................................................................27
Appendix .......................................................................................................................................29

1
1: Introduction
Socially responsible investments (SRI) have been growing steadily since its origin
in the Religious Society of Friends (Quakers), a faith-based community, in the 1700’s. At
the time, the investment philosophy behind SRI was to refrain from investing in companies
whose business “harm your neighbours”. Companies like tobacco manufacturers are
consider sinful and avoided. Poor labour practice such as not providing workers with
proper protection when carrying out dangerous activities is considered unethical by SRI
funds. In the modern day, SRI values have extended to environmental protection and
corporate governance. There is a growing awareness that environmentally and socially
sustainable practices are necessary to ensure investors continue to generate sustainable
returns over a long time horizon such as in the case for pension funds or over a perpetual
horizon as in the case of endowment funds. And shareholder advocacy and activism can
play an important part of SRI through proxy voting and corporate engagement on
environmental, social and governance (ESG) issues. As a reflection of this growing
awareness, by 2005 asset owners around the world created the United Nations-supported
Principles of Responsible Investment (UNPRI) to take ESG issues into account when
making investment decisions. The idea is that ESG risks such as water scarcity, human
rights violation and management structure have material impacts on investment returns and
investment managers need to consider these factors in order to fulfil their fiduciary duty.

2
There are several SRI strategies:
1) Negative Screening: This investment strategy avoids investing in companies
with low ESG ratings, including companies involved in controversies and lawsuits. A
stricter version of negative screening is the product-related exclusionary screen. This
traditional approach screens out certain industries from the investor’s investment universe.
Typical examples are sin stocks like tobacco and weapon manufacturers. Concerns over
climate change have led environmentally-conscious investors to screen out fossil fuel
companies. The advantage of this approach is that it allows the investor to divest from
companies which do not coincide with the investor’s particular ethical value or risk
management framework. The disadvantage is that the investor is at the risk of receiving
lower returns by limiting his/her investable universe for diversification, particularly
regarding to potentially high return sin stocks. However, most research on SRI funds or
indices using product-related exclusionary screen has shown this is untrue.
2) Positive screening/Best-in-Class: This investment approach favours companies
with high ESG ratings and does not screen out any particular industries. The advantage is
that the investor is able to express his/her ESG views without limiting his/her investable
universe. Some argue that by selecting high ESG-rated companies, the investor will receive
excess return. It has been found that investors receive positive alpha from high ESG-rated
companies during the period 1992-2004 (Borgers et al. 2013) but the positive alpha has
been disappearing post-2004 (Derwall et al., 2011; Guenster 2012; Bebchuk et al. 2013).
Borgers et al. (2013) attribute the positive alpha to pricing errors resulting from the lack of
attention for stakeholder issues pre-2004. The positive alpha disappears as investors started
to consider stakeholder issues when setting return expectations post-2004.

3
The disadvantage of positive-screening is that if the investor has a strong ethical
view or risk attitude against a particular industry in its entirety, the investor cannot
completely eliminate the industry from the portfolio.
3) Shareholder Advocacy:
Shareholder advocacy aims to actively influence the behaviour of corporations
through proxy voting and corporate engagement on ESG issues and other types of
shareholder interest. Nofsinger and Varma (2013) found that funds that are active in
shareholder advocacy significantly outperform conventional funds in crisis periods. The
advantage of shareholder advocacy is that shareholders are more in touch with the
management and have more influence on corporate activities. The disadvantage is that
shareholder advocacy is costly both in time and resources. Progress is not always
guaranteed.
Between 2004 and 2015, the assets under management according to UNPRI
principles have increased from US$4 trillion to US$59 trillion1 or at 28% CAGR. During
the financial crisis between 2007 and 2009, assets under management underwent a high
growth period, growing at 30% from 2007-2008 and 38% from 2008-2009. The reason
behind it is that the financial crisis exposed serious governance issues and investors needed
to pay strong attention on governance issues to manage risk.
To determine whether SRI strategies provide investors more protection by
considering ESG risks, we compare SRI indices in North American and Europe with their
market benchmarks in both market crisis and non-crisis periods.
1 The $59 trillion figure comes from the UNPRI Fact Sheet, 2015. Detailed assets under management are
also available at www.unpri.org/news/pri-fact-sheet/

4
This paper is organized as follows: Literature review examining the arguments for
and against SRI investments. Hypothesis Development proposes that managing ESG risks
can provide investors better downmarket protection in market crises. Data and Methods
describes the indices selected, methodology for identifying crisis periods and evaluation
models used. Performance presents results from evaluation models. Finally, Summary
concludes our major findings.

5
2: Literature Review and Hypothesis Development
2.1 Literature Review
There is a long-standing view within the investment community that socially
responsible investments underperform their conventional counterparts because socially
responsible investments restricts the investable universe for diversification and excludes
many profitable defensive stocks such as alcohol and tobacco. Research from Fabozzi and
Oliphant (2008) showed that a portfolio sin stocks outperforms common benchmarks in
terms of both magnitude and frequency between 1970 and 2007. Hong and Kacperczyk
(2009) concluded the outperformance of sin stocks is the result of large institutional
investors shunning such type of investments. However, when sin stocks are eliminated
from SRI indices or funds, most empirical research have found that there is no significant
difference in return between SRI funds (indices) and their conventional funds (indices).
Supporters of SRI argue that socially responsible behaviour of corporations can
better manage ESG risks. Oikonomou (2012) discovers that socially responsible behaviour
of corporations is weakly negatively related to systematic risk while irresponsible
behaviour is strongly positively related to systematic risk. For this reason, Cox (2004,
2001) discovered that long-term institutional investors like pension plans and life insurance
companies favour firms with strong corporate social performance. Certain ESG factors
such as high employee satisfaction has been linked with positive abnormal returns
(Edmans, 2011) while poor corporate governance is associate with negative abnormal
returns between 1990 and 2003 (Bebchuk et al., 2009). A follow-up study by Bebchuk et
al. (2013) discovered a learning effect for corporate governance and diminishing positive

6
abnormal returns from good corporate governance. Such finding is supported by Guenster
(2012) and Derwall et al. (2011).
Most research found SRI funds do not perform differently from conventional funds
(Hamilton et al., 1993; Reyes and Grieb 1998; Goldreyer and Diltzl., 1999; Statman, 2000;
Shank et al., 2005., Kreander, Gray, Power, and Sinclair (2005), Bauer, Koedijk, and Otten
(2005), and Utz and Wimmer (2014)). Other papers such as Sauer (1997), Statman (2000),
Schröder (2004), Statman (2006), and Lee and Faff (2012) do not find SRI indices to
perform different from conventional indices.
Statman (2000) found no difference between the performance of Domini Social
Index, an index consisting of SRI stocks, and the S&P 500 Index over 1990-1998. In
addition, his study shows that SRI mutual funds performed worse than the Domini Social
Index and the S&P 500 but no worse than conventional mutual funds. Bello (2005) found
that, in spite of ESG screening, SRI funds are not significantly different from conventional
funds in terms of characteristics of assets held and diversification attributes. He found that
the effect of diversification on investment performance is not different between the two
groups where both SRI funds and conventional funds underperformed the Domini 400
Social Index and S&P 500 from 1994-2001. Statman’s conclusion is consistent with the
findings of Renneboog et al (2007) which demonstrates that SRI funds in many European,
North-American and Asia-Pacific countries strongly underperform domestic benchmark
portfolios but do not underperform their conventional funds in most cases.
To explain why so few studies are able to establish a link between alpha’s and SRI,
Galema, Plantinga and Scholtens (2008) attribute it to the fact that socially responsible

7
investing impacts on stock returns by lowering the book-to-market ratio and not by
generating positive alphas.
Due to the wide range of conclusions on SRI investments, it is necessary to examine
the performance of SRI funds in more detail by separating performance according to
market conditions. To investigate whether strong ESG factors within SRI funds protect
investors during market/economic crisis, Nofsinger and Varma (2013) tested the
performance of US SRI funds against style-matching conventional funds during market
crisis periods and non-market crisis periods. The study found that SRI funds outperform
during periods of market crisis but at the cost of underperformance during non-crisis
periods. Hence, the overall performance between SRI funds and conventional funds is not
significant different. SRI funds’ asymmetric return pattern is derived from funds using
positive ESG screening techniques. A similar study on SRI funds in France confirmed that
SRI funds significantly underperforms characteristics-matched conventional funds during
non-crisis periods (Leite and Cortez, 2015). In contrast, Leite and Cortez found that French
SRI funds only match the performance of their peers during market downturns, which is
different from Nofsinger and Varma (2013)’s results in the US. Leite and Cortez (2015)
show that SRI funds underperform conventional funds during non-crisis period as the result
of negative ESG screening utilized by SRI funds. Funds that only use positive screens
perform similarly to conventional funds through different market conditions (Leite and
Cortez, 2015).

8
2.2 Hypothesis Development
Looking back in history, the Tech Bubble in 2000 and Financial Crisis in 2007 were
the result of excessive risk-taking by corporations and investors.
Both the Tech Bubble in 2000 and Financial Crisis in 2007 affected market systems
globally. Tech Bubble was caused by the over-valuation of the Technology sector and the
Financial Crisis was caused by over-valuation of the financial sector. Similar to the
Financial Crisis, climate change is a risk that is also global and “off-balance sheet”, with
particular concern to the valuation of the Energy sector. The dilemma is that in order to
manage climate change risk, energy companies cannot burn their fossil fuels reserves,
rendering these energy assets worthless to investors, and potentially causing another bubble
in the market.
Since largest market crises were caused by excessive-risk taking, we hypothesize
that by managing overall ESG risks, SRI investors can better protect themselves in market
crisis. We draw inspiration from the paper published by Nofsinger and Varma (2013). The
paper argues that SRI mutual funds in the US outperform their characteristics-matched
conventional funds during periods of market crisis at the cost of underperforming their
matching conventional funds during non-crisis periods. Hence, investors seeking downside
protection would benefit from SRI funds during downmarket, especially in SRI funds using
positive screening techniques or active in shareholder advocacy. Our extension to their
paper is that we expands their geographical coverage to analyse SRI indices in the US as
well as in Canada, Eurozone and UK to determine whether SRI indices outperform the
market benchmark consistently in different developed markets around the globe.

9
3: Data and Methods
3.1 SRI and Market Indices
We look at SRI and market indices’ performances in major developed markets
globally, namely US, Canada, Eurozone (Europe ex UK) and UK during the period
between 2000 and 2014. Within this period, we identify 2-3 market crisis periods,
depending on the geographic location. The data we used to analyze is monthly total return
with net dividend of different indices downloaded from Bloomberg. We calculate monthly
logarithmic returns and the performance of SRI and market indices are shown in Appendix
A.
3.1.1 United States of America
MSCI KLD 400 Social Index (KLD400) represents the SRI index and MSCI USA
IMI Index (MSCI USA) is the corresponding market index, comprised of 2495 stocks or
99% of float-adjusted market capitalization in the US. The market capitalization-weighted
KLD400 consists of 400 companies with outstanding/positive ESG ratings according to
MSCI and uses product-related/exclusionary screens. KLD400 uses:
Product-related exclusionary screen: military weapons, nuclear power, tobacco,
alcohol, gambling, GMO and adult entertainment
Positive ESG screen: companies must have an MSCI ESG Rating above 'BB'
and an Impact Monitor Score greater than 2 to be eligible
Characteristics of the KLD400 and the MSCI USA indices are shown in Table
3.1.1. The KLD400 has less negative skewness and lower kurtosis than the market index

10
from 2000 to 2014. Therefore, KLD400 appears to offer better downside protection than
the market index at the cost of lower risk-adjusted returns.
Table 3.1.1 Statistics of MSCI KLD 400 Social Index and MSCI USA IMI Index (Mar 2000-Dec 2014)
USA Arithmetic
Mean Return
Standard
Deviation of
Returns
Skewness of
Returns
Kurtosis of
Returns Sharpe ratio
KLD400 0.81% 15.60% -2.17 3.24 0.07
MSCI USA 1.11% 16.10% -2.90 5.24 0.13
All numbers presented are annualized. The average return of the KLD400 SRI index is slightly smaller
than the one of market index. The standard deviation of SRI index, 15.60%, shows that the SRI index is less
volatile than the market index. Negative skewness means that both SRI and market indices have frequent
positive returns and a few extreme losses, consistent with the occurrence of market crises. However,
KLD400 offers better downside protection than the MSCI USA. The kurtosis for MSCI USA is higher than
the kurtosis for KLD400, showing the MSCI USA has more chance for extreme outcomes in both upside
and downside.
3.1.2 Canada
We use the Jantzi Social Index (JSI) as the SRI index. The S&P/TSX 60 is selected
as the market indices. JSI is a market capitalization-weighted index modeled on the
S&P/TSX 60, a large cap index structured to reflect the sector weights of the S&P/TSX.
JSI comprises of 60 Canadian large capitalization companies after applying a set of
product-related exclusionary screen and negative ESG screen. Types of screening by
Jantzi:
Product-related exclusionary screen: military contracting, nuclear power and
tobacco
Negative ESG screen: companies involved in significant controversies are
excluded
According to the statistics shown in Table 3.1.2, the JSI and the S&P/TSX 60 have
almost identical performance and risks characteristics between 2001 and 2014.

11
Table 3.1.2 Statistics of Jantzi Social Index and S&P/TSX 60 Index (Jun 2001-Dec 2014)
Canada Arithmetic
Mean Return
Standard
Deviation of
Returns
Skewness of
Returns
Kurtosis of
Returns Sharpe ratio
JSI 1.97% 13.91% -3.78 11.02 0.39
S&P/TSX 60 1.96% 13.71% -3.78 11.02 0.39
All numbers presented are annualized. These two indices have similar returns and similar standard
deviation. Both indices have similar negative skewness or similar downside risk in market crises. Both of
them have fat tails proven by the extremely high kurtosis. The similar Sharpe ratios of these indices means
they generate same amount of return with each unit of risk.
3.1.3 Eurozone (Europe ex. UK)
EURO STOXX Sustainability (EURO Sustainability) market capitalization-
weighted index is used as the SRI index for Eurozone2. EURO Sustainability consists of
221 companies in the Eurozone countries that are leaders in terms of long-term
environmental, social and governance criteria according to Bank J. Safra Sarasin’s
Sustainability matrix (Figure 3.1.1). The corresponding market index is the EURO
STOXX, representing 291 large, mid and small cap stocks in the Euro zone. The type of
screening by EURO Sustainability:
Positive ESG screen: All companies with a positive sustainability rating will be
included in the index. A rating is defined as positive, if the combination of the
company and the sector rating result in a shaded matrix field of the Sarasin
Sustainability Matrix
2 From 12 Eurozone countries: Austria, Belgium, Finland, France, Germany, Greece, Ireland, Italy,
Luxembourg, the Netherlands, Portugal and Spain.

12
Figure 3.1.1 Sustainability Matrix
Source: SustainableInvestment.org
In Table 3.1.3, the EURO Sustainability index has a slightly higher kurtosis than
the EURO STOXX market index. Investors should avoid investing in the EURO
Sustainability index due to its negative Sharpe ratio of the whole period.
Table 3.1.3 Statistics of EURO STOXX Sustainability Index and EURO STOXX Index (Nov 2001-Dec 2014)
Eurozone Arithmetic
Mean
Return
Standard
Deviation
of
Returns
Skewness
of Returns
Kurtosis of
Returns Sharpe ratio
EURO Sustainability 0.17% 19.48% -3.03 7.52 -0.04
EURO STOXX 1.18% 18.43% -3.14 6.83 0.15
All numbers presented are annualized. The average return of EURO STOXX SRI Index has lower return
but higher deviation, resulting in a negative risk-adjusted return and lower Sharpe ratio than the market
index. Both indices have the similar downside risk as seen in the negative skewness. Both of them have
high fat tail risk in the kurtosis, with the EURO STOXX SRI index more prone to extremely outcomes.
3.1.4 United Kingdom
FTSE4GOODUK (FTSE4GOOD) is selected as the SRI index for UK and FTSE
All-Share (ASX) index is selected as the market index. FTSE4GOOD comprises of 232
stocks selected based on positive FTSE ESG ratings and removed based on negative ESG

13
ratings. FTSE All-Share represents 643 companies listed on the London Stock Exchange,
capturing 98% of UK’s market capitalization. FTSE4GOOD employs:
Product-related exclusionary screen: Weapon systems, controversial weapons
and tobacco. Nuclear power and infant formula companies must meet 95% of
sector specific criteria to be included
Positive ESG screen: FTSE ESG rating of 3.3 or above will be added to the
index
Negative ESG screen with engagement period: Companies with FTSE ESG
rating below 2.5 will be informed and deleted from FTSE4GOOD if their ESG
rating is not improved during the subsequent 12 months. Companies with zero
score in their high exposure ESG theme will be excluded
Controversy monitoring: companies with significant controversies will not be
included
As seen in Table 3.1.4, the FTSE4GOOD has less negative skewness and lower
kurtosis. The FTSE4GOOD index appears to offer some downside protection at the cost of
lower risk-adjusted returns.
Table 3.1.4 Statistics of FTSE4GOODUK Index and FTSE All-Share Index (Jul 2001-Dec 2014)
UK Arithmetic
Mean Return
Standard
Deviation of
Returns
Skewness of
Returns
Kurtosis of
Returns Sharpe ratio
FTSE4GOOD 0.57% 14.34% -2.54 3.07 0.04
ASX 1.54% 14.55% -3.01 4.56 0.27
All numbers presented are annualized. The average return of FTSE4GOODUK SRI Index is smaller than
the FTSE All-Share Index. But the volatilities of these two indices are very similar. FTSE4GOODUK index
has less downside risk than the ASX due to less negative skewness. The market index has higher fat tail risk
than the FTSE4FOOD UK SRI index.

14
3.2 Crisis Periods
In order to investigate whether the performance of SRI and market indices in
different countries show similar patterns across market crisis and non-crisis periods, we
identify market crisis periods occurring between 2000-2014 for four major developed
markets: US, Canada, Eurozone and UK.
Pagan and Sossounov (2003) stated that if prices keep declining for a substantial
period after the previous peak, the peak point is a starting point showing that the stock
market turns to a bear state from a bull. We identify the crisis periods by using the theories
and approaches of Pagan and Sossounov (2003). They determine the initial turning points
by selecting peaks or bottoms, which are the highest or lowest value compared to the
surrounding points in a window of eight months. Specifically, if (Pt − 8,…, Pt − 1 < Pt >
Pt + 1,…, Pt + 8), the location of Pt can be considered as one peak, where Pt represents the
price of stock index in month t. Similarly, the location of Pt can be regarded as one trough,
as long as (Pt − 8, …, Pt − 1> Pt <Pt + 1, …, Pt + 8).
In order to identify the crisis periods in selected developed markets, we decide to
use the four market indices we mentioned earlier as benchmarks. By calculating the change
of points of these market indices, we choose those periods when the changes are higher
than 10 percent and identify three crisis periods for the stock markets in Canada, Eurozone
and United Kingdom, and two crisis periods for US. The periods of crisis and the difference
of market indices points are demonstrated in Table 3.2.1.

15
Table 3.2.1 Crisis Periods in USA, Canada, Europe and UK between 2000 and 2014
Country Market Index Crisis Start Date End Date Change in
Market Index
USA
MSCI USA IMI Index
Technology
Bubble
2000/03 2002/09 -46.06%
[938.93] [506.45]
Financial Crisis
2007/10 2009/02 -52.27%
[1010.66] [482.39]
CANADA
The S&P/Toronto Stock
Exchange 60 Index
Technology
Bubble
2000/08 2002/09 -49.78%
[687.08] [345.06]
Financial Crisis 2007/10 2009/02 -42.32%
[848.82] [489.56]
Natural Gas
Crisis
2011/02 2012/05 -19.28%
[813.28] [656.5]
EUROZONE
EURO STOXX Index
Technology
Bubble
2000/02 2003/03 -59.64%
[444.35] [179.32]
Financial Crisis
2007/05 2009/02 -58.05%
[439.24] [184.27]
Euro Crisis
2011/04 2012/05 -27.06%
[293.2] [213.87]
UK
FTSE All-Share Index
Technology
Bubble
2000/08 2003/03 -45.89%
[3207.99] [1735.72]
Financial Crisis
2007/05 2009/02 -43.88%
[3438.7] [1929.75]
Euro Crisis
2011/04 2012/05 -12.30%
[3155.03] [2767.09]
The points of market indices are presented in brackets.
Each developed market has experienced the same global market crisis such as the
Tech Bubble and the Financial Crisis but other market crisis are geographically specific to
that particular developed market. According to Table 3.2.1, in the US, based on the trends
of the MSCI USA Index, we characterize two crisis periods: one from March 2000 to
September 2002 and another from October 2007 to February 2009. For Canadian stock
market, there are one more crisis periods with different time span: August 2000 to
September 2002, October 2007 to February 2009, February 2011 to May 2012. In both
Eurozone and UK, three periods of crisis are identified through analysing the downtrends

16
of stock market indices: February 2000 (August 2000 in UK) to March 2003, May 2007 to
February 2009, and April 2011 to May 2012.
Due to the burst of Tech Bubble, the first crisis period started in 2000 among the
four markets, and the second crisis period was triggered by global financial crisis happened
during 2007-2008. The third crisis was the euro sovereign debt crisis in Eurzone, which
had negative effects on UK as well. However, the third one in Canada was impacted by the
sharp decline of natural gas prices.
3.3 Performance Evaluation Model
To evaluate the performance of SRI and matched market indices, we use three
different factor models to do the regression: Capital Asset Pricing Model (CAPM), Fama
and French (1993) three factors model, and Carhart (1997) four factors model.
Using the monthly time series prices with net dividends among crisis and non-crisis
periods (2000-2014), we calculate the alpha parameters and compare the performance of
SRI indices with market indices to observe the trends and patterns. We estimate the alphas
for the CAPM in different market states, crisis and non-crisis, by using the following
regression:
𝑅𝑡 − 𝑅𝑓,𝑡 = 𝛼𝑁𝐶𝐷𝑁𝐶,𝑡 + 𝛼𝐶𝐷𝐶,𝑡 + 𝛽1(𝑅𝑚,𝑡 − 𝑅𝑓,𝑡) + 𝜀𝑡
where 𝑅𝑡 represents the total returns with net dividends of the SRI over period t,
𝑅𝑓,𝑡 is the risk free rate (30-day Treasury bill rate) during the same period, 𝛼𝑁𝐶 represents
the monthly alpha parameter of regression during non-crisis periods, 𝛼𝐶 is the monthly

17
alpha in crisis periods, 𝐷𝑁𝐶,𝑡3is the dummy variable and the value is 1 if time t is identified
as non-crisis periods and 0 otherwise, 𝐷𝐶,𝑡 is the dummy variable that equals to 1 when
time t is defined as crisis periods and 0 otherwise, 𝛽1 is the systematic risk, 𝑅𝑚,𝑡 refers the
total returns with net dividend of the four market indices we chose to be benchmarks, 𝜀𝑡
measures the residual. Extending the CAPM with two more factors, we have the Fama
French three factors model:
𝑅𝑡 − 𝑅𝑓,𝑡 = 𝛼𝑁𝐶𝐷𝑁𝐶,𝑡 + 𝛼𝐶𝐷𝐶,𝑡 + 𝛽1(𝑅𝑚,𝑡 − 𝑅𝑓,𝑡) + 𝛽2𝑆𝑀𝐵𝑡 + 𝛽3𝐻𝑀𝐿𝑡 + 𝜀𝑡
where 𝛽2 and 𝛽3 are the loadings on the small minus big (SMB) and high minus
low (HML) factors, respectively. Last but not least, we use Carhart four factors model
(1997) to evaluate crisis and non-crisis alphas:
𝑅𝑡 − 𝑅𝑓,𝑡 = 𝛼𝑁𝐶𝐷𝑁𝐶,𝑡 + 𝛼𝐶𝐷𝐶,𝑡 + 𝛽1(𝑅𝑚,𝑡 − 𝑅𝑓,𝑡) + 𝛽2𝑆𝑀𝐵𝑡 + 𝛽3𝐻𝑀𝐿𝑡 + 𝛽4𝑊𝑀𝐿𝑡 + 𝜀𝑡
where 𝛽4 is the coefficient on the winners minus losers (WML) factor. The data for
𝑅𝑓,𝑡, 𝑆𝑀𝐵𝑇, 𝐻𝑀𝐿𝑡 and 𝑊𝑀𝐿𝑡 are downloaded from Kenneth French’s (2015) website and
all regressions in this paper are done with confidence level of 95 percent.
Because we examine the performance of those indices across various countries and
areas, we decide to use country-specific factors obtained from Kenneth French’s (2015)
website, which have less pricing error and can explain the time-series variation in portfolio
3 Since Nofsinger and Varma (2013) used two dummy variables, we decided to replicate their regression
models with two dummy variables, in order to explain the models more clearly. We also tested the models
with one dummy variable and received the same results.

18
stock returns more accurately, according to Griffin’s (2002) theory. Specifically, for the
US, we used Fama French US factors and, for Canada, we use Fama French North America
factors and, for Europe and United Kingdom, we use Fama French European factors4
instead.
4 Including Austria, Belgium, Denmark, Finland, France, Germany, Greece, Ireland, Italy, the Netherlands,
Norway, Portugal, Spain, Sweden, Switzerland, and the United Kingdom.

19
4: Performance
4.1 Replication of Nofsinger and Varma’s (2014) Results
Above all, in order to check the accuracy of our model, we replicate the method
Nofsinger and Varma (2014) used to investigate the relationship between SRI index, MSCI
KLD 400 Social Index, and benchmark, S&P 500 Index, during 2000-2012 by using three
asset pricing models: CAPM, Fama and French (1993) three factors model, and Carhart
(1997) four factors model. The data for 𝑅𝑓,𝑡 , 𝑆𝑀𝐵𝑇 , 𝐻𝑀𝐿𝑡 and 𝑊𝑀𝐿𝑡 are downloaded
from Kenneth French’s (2015) website and is based on U.S. research returns data. Average
returns and alpha parameters estimated from the three models for this period (2000-2012)
are demonstrated in Table 4.1.1 and all of them shown are annualized.
Table 4.1.1 Performance of KLD400 SRI index vs S&P500 market indices
KLD400 Whole Period Non Crisis Crisis
SRI Market SRI Market SRI Market
Average Return -1.57% -1.29% 9.12% 9.49% -9.86% -9.91%
Excess Return -0.28% -0.37% 0.05%
CAPM Alpha -0.30% [0.70] -0.47% [0.77] 0.04% [0.97]
FF3 Alpha -0.49% [0.53] -0.61% [0.54] 0.47% [0.74]
Carhart 4 Alpha -0.49% [0.53] -0.63% [0.55] 0.41% [0.78]
Replication of Nofsinger and Varma (2013) SRI fund and conventional fund returns. All estimates are
annualized. None of the alphas is statistically significant (p-values at the 5% significance level), indicating
no difference between SRI index returns and market index performance in non-market crisis or crisis periods.
P values are demonstrated in the brackets.
The KLD 400 SRI index has an annualized average return of -1.57% during the
whole period, 9.12% during non-crisis period and -9.86% during crisis period. All of the
average returns are very similar to the ones of benchmark. The annualized alpha estimates
of this SRI index calculated by three models are negative and not significantly different

20
from 0 during the period from 2000 to 2012. During the non-crisis periods, the SRI index
provided excess return of -0.37% and 0.05% during crisis period. However, all alphas
estimated by these three models are nearly or not statistically significant at 95% confidence
level. In conclusion, the results we received are very similar to the reference paper.
However, due to the fact we chose to use indices, the difference between the KLD 400 SRI
index and market is less pronounced than the difference between SRI funds and
conventional funds shown in the reference paper. We find that the KLD400 SRI index
shows little difference compared to market index during two economic conditions
(outperform during crisis and underperform otherwise), but not significantly different from
zero.
4.2 Our Results
By utilizing the same method but with country-specific Fama French factors
instead, we estimate alphas and average returns of our selection of four SRI indices. All
results reported in Table 4.2.1 are monthly.
In the US, it is found that the KLD400 SRI index offers the same performance as
the MSCI USA market index during market crisis and non-market crisis periods between
2000 and 2014. None of alphas for KLD400 are significant yet KLD400 has lower Sharpe
ratio than the MSCI USA market index in all periods. Investors will do just as well in
market crisis with MSCI USA market index and receive a relatively higher risk-adjusted
return. The KLD400 index comprises of 400 stocks versus 2495 stocks in the MSCI USA.
Despite being much less diversified then the market, KLD400’s product-related exclusion
and positive screening strategies are able to match the market index in terms for
performance but not on a risk-adjusted basis.
21
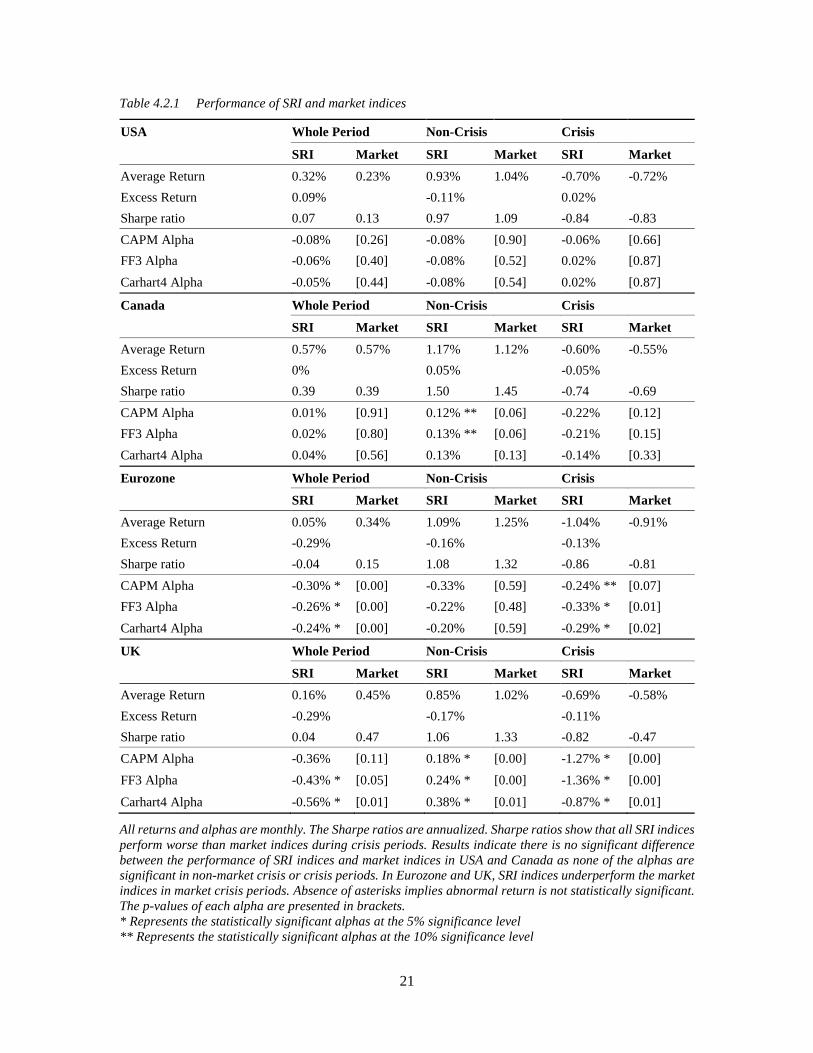
Table 4.2.1 Performance of SRI and market indices
USA Whole Period Non-Crisis Crisis
SRI Market SRI Market SRI Market
Average Return 0.32% 0.23% 0.93% 1.04% -0.70% -0.72%
Excess Return 0.09% -0.11% 0.02%
Sharpe ratio 0.07 0.13 0.97 1.09 -0.84 -0.83
CAPM Alpha -0.08% [0.26] -0.08% [0.90] -0.06% [0.66]
FF3 Alpha -0.06% [0.40] -0.08% [0.52] 0.02% [0.87]
Carhart4 Alpha -0.05% [0.44] -0.08% [0.54] 0.02% [0.87]
Canada Whole Period Non-Crisis Crisis
SRI Market SRI Market SRI Market
Average Return 0.57% 0.57% 1.17% 1.12% -0.60% -0.55%
Excess Return 0% 0.05% -0.05%
Sharpe ratio 0.39 0.39 1.50 1.45 -0.74 -0.69
CAPM Alpha 0.01% [0.91] 0.12% ** [0.06] -0.22% [0.12]
FF3 Alpha 0.02% [0.80] 0.13% ** [0.06] -0.21% [0.15]
Carhart4 Alpha 0.04% [0.56] 0.13% [0.13] -0.14% [0.33]
Eurozone Whole Period Non-Crisis Crisis
SRI Market SRI Market SRI Market
Average Return 0.05% 0.34% 1.09% 1.25% -1.04% -0.91%
Excess Return -0.29% -0.16% -0.13%
Sharpe ratio -0.04 0.15 1.08 1.32 -0.86 -0.81
CAPM Alpha -0.30% * [0.00] -0.33% [0.59] -0.24% ** [0.07]
FF3 Alpha -0.26% * [0.00] -0.22% [0.48] -0.33% * [0.01]
Carhart4 Alpha -0.24% * [0.00] -0.20% [0.59] -0.29% * [0.02]
UK Whole Period Non-Crisis Crisis
SRI Market SRI Market SRI Market
Average Return 0.16% 0.45% 0.85% 1.02% -0.69% -0.58%
Excess Return -0.29% -0.17% -0.11%
Sharpe ratio 0.04 0.47 1.06 1.33 -0.82 -0.47
CAPM Alpha -0.36% [0.11] 0.18% * [0.00] -1.27% * [0.00]
FF3 Alpha -0.43% * [0.05] 0.24% * [0.00] -1.36% * [0.00]
Carhart4 Alpha -0.56% * [0.01] 0.38% * [0.01] -0.87% * [0.01]
All returns and alphas are monthly. The Sharpe ratios are annualized. Sharpe ratios show that all SRI indices
perform worse than market indices during crisis periods. Results indicate there is no significant difference
between the performance of SRI indices and market indices in USA and Canada as none of the alphas are
significant in non-market crisis or crisis periods. In Eurozone and UK, SRI indices underperform the market
indices in market crisis periods. Absence of asterisks implies abnormal return is not statistically significant.
The p-values of each alpha are presented in brackets.
* Represents the statistically significant alphas at the 5% significance level
** Represents the statistically significant alphas at the 10% significance level

22
In Canada, we find that the JSI performs similarly to the S&P/TSX 60 market index
during market crisis but significantly outperforms the S&P/TSX 60 during non-market
crisis between 2000 and 2014. Since the Sharpe ratio for JSI is smaller than the Sharpe
ratio of the S&P/TSX 60 in crisis periods, investors should not rely on the JSI for crisis
protection. The product-related exclusions and negative screening techniques employed by
the JSI does not offer investors more protection during market crisis. During non-crisis
periods, JSI is a superior choice because it does offer better performance than the market
on a risk-adjusted basis. On a side note, since the JSI and the S&P/TSX 60 both consist of
60 largest companies in Canada, we think that large cap bias that exists within the
S&P/TSX 60 will be neutralized by the SML factor in the FF3 model. In addition, we
compare JSI with S&P/TSX Composite as the broad market index and receive similar
results as using S&P/TSX 60 as the market index.
In the Eurozone, the EURO Sustainability index significantly underperforms the
EURO STOXX market index by 0.13% per month during market crisis, more specifically
during the Financial Crisis and the Euro Crisis but not the Tech Bubble. Overall, the EURO
Sustainability index significantly underperforms the market index by 0.29% per month
between 2000 and 2014. The two indices are invested in 200+ companies, offering a fair
comparison. The positive screening techniques (Bank J. Safra Sarasin’s Sustainability
matrix) utilized by EURO STOXX Sustainability index has a negative impact on
performance in market crisis. Investors in the Eurozone are worse off in downmarket by
buying the EURO STOXX Sustainability index.
Finally, in the UK, the FTSE4Good significantly underperforms the FTSE All-
Share market index by 0.11% per month during market crisis periods but has a positive

23
alpha during non-crisis periods between 2000 and 2014. FTSE4Good index utilizes the
most screening techniques, including product-related exclusion, negative screening with
corporate engagement and positive screening. Its SRI strategy appears to harm returns in
market crisis but improves return in non-crisis periods. However, it should be mentioned
that there are only 232 companies in the FTSE4Good index and 643 companies in the FTSE
All-Share index. The FTSE All-Shares index is invested in nearly three times more
companies than the FTSE4Good index. Hence, it is not surprising that FTSE4Good index
underperforms the market index on a risk-adjusted basis considering it is much less
diversified than it market benchmark. Consequently, FTSE4GOOD investors are worse off
in downmarket.
To further explore the performance of SRI indices during poor economic
conditions, we examine their performance independently for each crisis period in different
markets.
Table 4.2.2 reports the alpha of each crisis period in North American markets and
none of them shows statistically significant difference between the SRI and market indices.
For the US, monthly average returns for both SRI and market indices very similar in Tech
Bubble and Financial Crisis, indicating the KLD500 index does not offer downmarket
protection in either type of crisis.
In Canada, the monthly average returns for both SRI and market indices are also
similar in the Tech Bubble and Financial Crisis but the JSI had 3.52% excess return per
month during the Natural Gas Crisis. Although, in Canada, the alphas are positive but
insignificant, investing in the SRI index provides relatively higher return than the market
index during only the Natural Gas Crisis.

24
Table 4.2.2 Performance of SRI and market indices in North America
USA Technology Bubble Financial Crisis
SRI Market SRI Market
Average Return -1.79% -1.80% -4.03% -4.25%
Excess Return 0.01% 0.22%
CAPM Alpha -0.13% [0.67] -0.16% [0.58]
FF3 Alpha -0.10% [0.76] -0.25% [0.43]
Carhart4 Alpha -0.13% [0.68] -0.21% [0.53]
Canada Technology Bubble Financial Crisis Natural Gas Crisis
SRI Market SRI Market SRI Market
Average Return -2.03% -1.78% -3.15% -2.80% -0.73% -4.25%
Excess Return -0.25% -0.35% 3.52%
CAPM Alpha -0.28% [0.23] -0.50% [0.26] 0.12% [0.60]
FF3 Alpha -0.02% [0.94] -0.61% [0.24] 0.27% [0.23]
Carhart4 Alpha -0.03% [0.87] -0.57% [0.29] 0.34% [0.17]
Results show that there is no significant difference between the performance of SRI indices and market indices
in North America during any crisis period. The p-values of each alpha are presented in brackets.
According to Table 4.2.3, the EURO Sustainability index shows no significant
difference from the market in the Tech Bubble but underperforms during the Financial
Crisis and Euro Crisis. It shows that the EURO Sustainability index is sensitive to financial-
related crisis as both the Financial Crisis and Euro Crisis are of financial nature.
In the UK, the FTSE4GOOD index significantly underperform the market index in
all three type of market crisis with the worse occurred in the Financial Crisis. In particular,
the CAPM alpha is negative for all three types of crisis, indicating the stringent screening
methods used by FTSE4GOOD has an adverse systematic impact on returns in all three
types of market crisis.

25
Table 4.2.3 Performance of SRI and market indices in Europe
Eurozone Technology Bubble Financial Crisis Euro Crisis
SRI Market SRI Market SRI Market
Average Return -3.12% -2.63% -3.71% -3.52% -2.07% -1.56%
Excess Return -0.50% -0.19 % -0.51%
CAPM Alpha 0.04% [0.83] -0.42% [0.14] -0.63% * [0.03]
FF3 Alpha 0.28% [0.23] -0.58% * [0.04] -0.11% [0.80]
Carhart4 Alpha 0.28% [0.25] -0.56% * [0.06] -0.31% [0.52]
UK Technology Bubble Financial Crisis Euro Crisis
SRI Market SRI Market SRI Market
Average Return -2.17% -1.89% -2.56% -2.19% -0.64% -0.42%
Excess Return -0.28% -0.37% -0.22%
CAPM Alpha -2.28% * [0.07] -0.48% * [0.01] -0.24% * [0.05]
FF3 Alpha -0.83% [0.58] -0.54% * [0.00] -0.03% [0.90]
Carhart4 Alpha -0.57% [0.60] -0.50% * [0.00] 0.06% [0.72]
Results indicate that, during technology bubble, the SRI indices perform similarly to market indices with non-
statistically significant alphas. During financial crisis, the SRI underperform the benchmarks in both
Eurozone and United Kingdom. And the SRI indices have no significant different with the market indices
during Euro crisis period. The p-values of each alpha are presented in brackets.
* Represents the statistically significant alphas at the 5% significance level

26
5: Summary
To summarize, the performance of SRI indices in various developed markets vary
between 2000 and 2014. In Canada, the Jantzi SRI index performs similarly to its well-
matched market index of similar Sharpe ratios but does not offer extra protection in down
markets. In the US, the KLD400 SRI index, with a slightly lower Sharpe ratio, performs
similarly to a much more diversified broad market index, but the KLD400 SRI index does
not offer extra protection in down markets. The story is different for developed markets in
Europe. In the Eurozone, the EURO STOXX Sustainability index has a worse Sharpe ratio
than its market index and significantly underperforms the market index overall by 0.29%
per month, magnifying negative return in the Financial Crisis and Euro Crisis. In the UK,
the FTSE4Good index has a worse Sharpe ratio than its broad market index and
underperforms the index by 0.29% per month overall and magnify negative return in all
crisis periods. Our results show that SRI indices, with a range of screening methods, do not
offer down market protection in North America and Europe. Furthermore, the SRI index
underperforms its market benchmark in the Eurozone during both types of financially-
related downmarket, the Financial Crisis and the Euro Crisis. The SRI index in UK
underperforms its market benchmark in all three crises. Therefore, we do not find that the
SRI indices we selected offer downmarket protection in North America and Europe.

27
References
Adler, Timothy, Kritzman, Mark (2008). The cost of socially responsible investing. Journal of Portfolio
Management, 35 (1), 52-56.
Adrian R. Pagan & Kirill A. Sossounov (2003). A simple framework for analysing bull and bear markets.
Journal of Applied Econometrics, 18(1), 23-46.
Bauer, R., K. Koedijk, and R. Otten (2005). International evidence on ethical mutual fund performance and
investment style, Journal of Banking and Finance, 29, 1751-1767.
Becchetti, L., Ciciretti, R., Dalò, A., & Herzel, S. (2015). Socially responsible and conventional investment
funds: Performance comparison and the global financial crisis. Applied Economics, 47(25), 2541-2562.
Bebchuk, L. A., A. Cohen, and A. Ferrell, (2009). What matters in corporate governance, Review of
Financial Studies, 22 (2), 783–827.
Bello, Z., (2005). Socially responsible investing and portfolio diversification, Journal of Financial
Research, 18(1), 41-57.
Borgers, A., J. Derwall, K. Koedijk, and J. ter Horst, (2013), Stakeholder relations and stock returns: on
errors in investors’ expectations and learning, Journal of Empirical Finance, 22, 159-175.
Carhart, Mark M. (1997). On persistence of mutual fund performance. Journal of Finance, 52, 57-82.
Cox, P., S. Brammer, A. Millington, (2008). An empirical examination of institutional investor preferences
for corporate social performance, Journal of Business Ethics, 52: 27-43.
Cox, P., P.A. Wicks, (2011). Institutional interest in corporate responsibility: portfolio evidence and ethical
explanation, Journal of Business Ethics, 103: 143–165.
Derwall, J., K. Koedijk, J. Ter Horst, (2011). A tale of value-driven and profit seeking investors, Journal of
Banking & Finance, 35, 2137-2147.
Edmans, A. (2011). Does the stock market fully value intangibles? Employee Satisfaction and Equity
Prices, Journal of Financial Economics, 101 (3), 621-640.
Elizabeth F. GoldreyerJ. David Diltz, (1999). The performance of socially responsible mutual funds:
incorporating sociopolitical information in portfolio selection, Managerial Finance, 25 (1), 23-36.
Eugene F. Fama, Kenneth R. French (1993). Common risk factors in the returns on stocks and bonds.
Journal of Financial Economics, 33, 3-56.
Eugene F. Fama, Kenneth R. French (2004). The Capital Asset Pricing Model: Theory and Evidence.
Journal of Economic Perspectives, 18(325), 46.
Fabozzi, F.J., K.C. Ma, and B.J. Oliphant (2008). Sin Stock Returns. Journal of Portfolio Management, 35
(1), 82-94.
Girard, Eric, Rahman, Hamid, Stone, Brett (2007). Socially responsible investments: goody-two-shoes or
bad to the bone? Journal of Investing, 16 (1), 96-110
Guenster, N., K. Baker, and J.R. Nofsinger, (2012). Performance implications of SR investing: past versus
future, Socially Responsible Finance and Investing, John Wiley & Sons Inc.

28
Hamilton, S., J. Jo, and M. Statman (1993), Doing well while doing good? The investment performance of
socially responsible mutual funds, Financial Analysts Journal, 49 (6), 62-67
Hong, H., and Marcin, Kacperczyk (2009) The Price of sin: The effects of social norms on markets.
Journal of Financial Economics, 93 (1), 15-36
John M. Griffin (2002). Are the Fama and French factors global or country specific? The Review of
Financial Studies, 15(3), 783-803.
John Nofsinger, Abhishek Varma (2014). Socially Responsible Funds and Market Crises, Journal of
Banking & Finance, 48, 180-193.
Kreander, G., D.M. Power, and C.D. Sinclair (2005). Evaluating the Performance of Ethical and Non-
ethical Funds: A Matched Pair Analysis, Journal of Business Finance & Accounting, 32 (7/8), 1465-1493.
Lee, J., Yen, P., & Chan, K. C. (2013). Market states and disposition effect: Evidence from Taiwan mutual
fund investors. Applied Economics, 45(10), 1331-1342.
Oikonomou, I., C. Brooks, and S. Pavelin (2012). The impact of corporate social performance on financial
risk and utility: a longitudinal analysis, Financial Management, 41 (2), 483-515.
Galema, R., A. Plantinga, B. Scholtens (2008). The stocks at stake: Return and risk in socially responsible
investment, Journal of Banking and Finance, 32 (12), 2646-2654
Renneboog, L., J. ter Horst, and C. Zhang (2008). The price of ethics and stakeholder governance: the
performance of socially responsible mutual funds, Journal of Corporate Finance, 14 (3), 302-328.
Reyes, M.G., and Terrance Grieb (1998). The external performance of socially-responsible mutual funds,
American Business Review. 16(1), 1-7.
Sauer, D. (1997). Evidence from the Domini 400 social index and Domini equity mutual fund, Review of
Financial Economics, 6(2), 137-149.
Schröder (2004). The performance of socially responsible investments: Investments funds and indices,
Swiss Society for Financial Market Research, 18(2), 122-142.
Shank, T., D. Manullang, and R. Hill (2005). Doing well while doing good revisited: a study of socially
responsible firms’ short-term versus long-term performance, Managerial Finance, 31 (8), 33-46.
Statman, M. (2000). Socially Responsible Mutual Funds, Financial Analysts Journal, 56(3), 30-39.
Statman, M. (2006). Socially Responsible Indexes, the Journal of Portfolio Management, 32(3), 100-109.
Utz and Wimmer (2014). Tri-criterion inverse portfolio optimization with application to socially
responsible mutual fund, European Journal of Operational Research, 234 (2), 491-498.

29
Appendix
Appendix A SRI Indices Performance & Market Indices Performance
In order to visually inspect data, we download monthly prices with net dividend of
four SRI indices and four market indices from Bloomberg and calculate monthly
logarithmic return by using the formula: Monthly logarithmic return = ln(𝑝𝑡
𝑝𝑡−1). Then
we plot the monthly returns of SRI index (Shown by red dots) and market index (Shown
by blue lines) for each market in order to compare their trends. According to the figures
demonstrated in the following pages, overall, the SRI index in each market has a very
similar performance with the market index.

Figure 1 United States of America: KLD 400 & MXUSIM (The SRI index has a very similar trend with the market index.)
-20.00%
-15.00%
-10.00%
-5.00%
0.00%
5.00%
10.00%
15.00%
Month
ly R
eturn
MXUSIM KLD400

Figure 2 Canada: JSI & SPTSX60 (The SRI index has a very similar trend with the market index.)
-20.00%
-15.00%
-10.00%
-5.00%
0.00%
5.00%
10.00%
15.00%
Month
ly R
eturn
SPTSX60 JSI

Figure 3 Europe: SUTE & SXXE (The SRI index has a very similar trend with the market index.)
-25.00%
-20.00%
-15.00%
-10.00%
-5.00%
0.00%
5.00%
10.00%
15.00%
20.00%
Month
ly R
eturn
SXXE SUTE

Figure 4 United Kingdom: 4GUK & ASX (The SRI index has a very similar trend with the market index.)
-20.00%
-15.00%
-10.00%
-5.00%
0.00%
5.00%
10.00%
15.00%
Month
ly R
eturn
ASX 4GUK