towards efficient and socially responsible...
TRANSCRIPT
Towards Efficient and
Socially Responsible Indices
1
Noël Amenc
Professor of Finance, EDHEC Business School
Director, EDHEC-Risk Institute
Chairman, EDHEC-Risk Indices & Benchmarks
Eric Shirbini
Business Development Director Europe, EDHEC-Risk Institute
January 12, 2012 - 10 Fleet Place, London

� Since 2001, EDHEC Business School has, via EDHEC-RiskInstitute, implemented an ambitious research approachreconciling academic excellence and business relevance.
� This ambition has been translated in the recruitment ofworld-class permanent faculty for our European (Nice,London), Asian (Singapore) and US (NYC) campuses, with
EDHEC-Risk Institute: Reconciling Academic Excellence and Industry Relevance
London), Asian (Singapore) and US (NYC) campuses, withrecent hires including Professors Raman Uppal, GiuseppeBertola, Ekkehart Boehmer and Frank Fabozzi.
� This ambition has also manifested itself in a desire toengage in dialogue and interaction with the industry, notablythrough our research distribution policy (more than 750,000recipients of our monthly EDHEC-Risk research newsletter),conferences (EDHEC Days Europe, Asia and North-America) aswell as executive training conferences and seminars.
2

• Our research focuses on six strategic research programs,including programmes on
– Asset Liability Management
– Alternative Diversification
– Use of Derivatives in Portfolio Management
– Performance Analysis
– Operational Risks
Indices & Benchmarks Research Program
– Operational Risks
– Indices & Benchmarks.
• The “Indices & Benchmarks” research program has beenaddressing the question of benchmark construction in bothtraditional and alternative investments since 2001.
• The research effort is led by a team of academicians withrecognized expertise in this field with notably professors RenéGarcia, Abraham Lioui, Lionel Martellini, Stoyan Stoyanov andRaman Uppal.
3

About EDHEC-Risk Indices & Benchmarks
• EDHEC-Risk Institute makes important public contributions to the advancement of finance research and the improvement of industry practices.
• While providing little insights about alpha generation, the Institute’s research suggests that academic methods of risk management and portfolio construction are a key source of value-added in investment management.
• The insights drawn from this research have led to a series of indices and benchmarks that provide more efficient and more academic solutions to investors’ needs than the currently available products on the market.
• In order to clearly identify this activity and distinguish it from the fundamental research activities, EDHEC-Risk Indices & Benchmarks has been created as a spin-off, which aims to be one of the leading beta designers for the investment industry.
4
• Summary of SRI Funds Performance
• Improving Diversification
• Empirical Test
• FTSE EDHEC-Risk Efficient Eurobloc ERAFP SRI Large Cap Index
• Conclusions
5
Summary of SRI Funds PerformanceHistorical performance of SRI funds
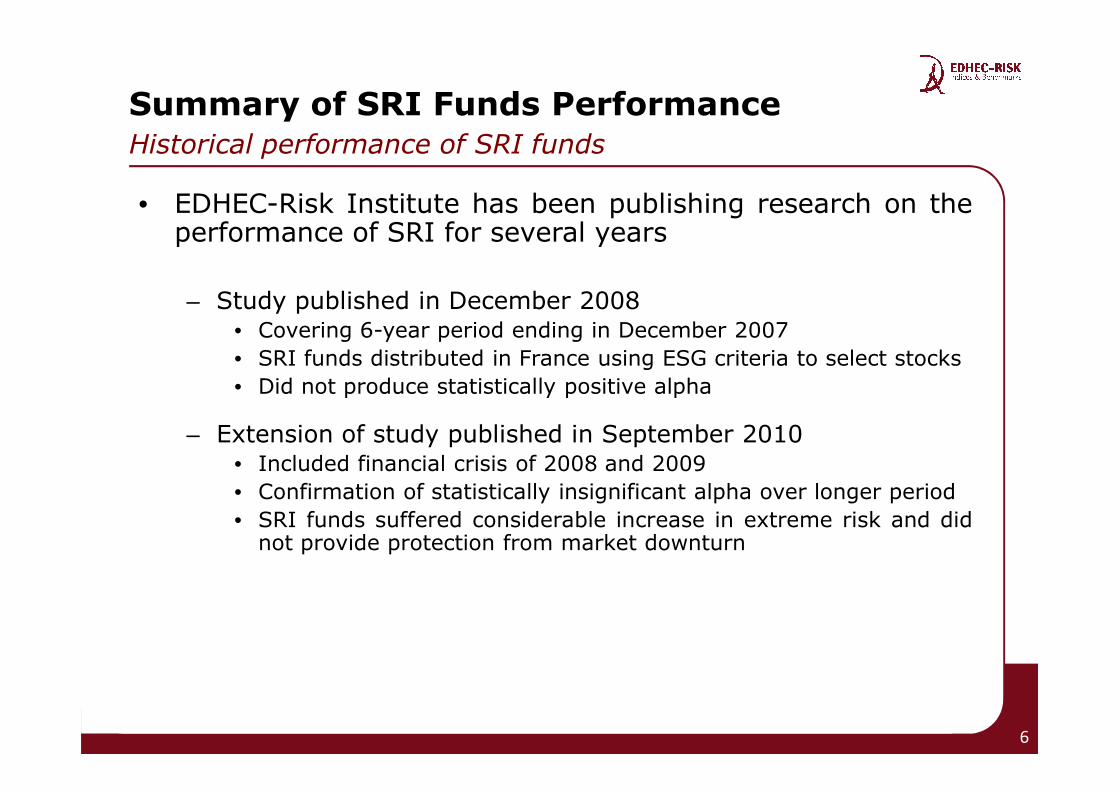
• EDHEC-Risk Institute has been publishing research on theperformance of SRI for several years
– Study published in December 2008• Covering 6-year period ending in December 2007
• SRI funds distributed in France using ESG criteria to select stocks
• Did not produce statistically positive alpha• Did not produce statistically positive alpha
– Extension of study published in September 2010• Included financial crisis of 2008 and 2009
• Confirmation of statistically insignificant alpha over longer period
• SRI funds suffered considerable increase in extreme risk and didnot provide protection from market downturn
6

Summary of SRI Funds PerformanceMarket perception of SRI funds
• Two views on the relative performance of SRI fundscompared to non-SRI
– SRI screens reduce the investment universe leading to
• poor diversification (Barnett and Salomon 2006),
• efficiency loss akin to an investment constraint (Adler and Kritzman 200)
• industry and style biases (Rudd 1981, Kurtz 1997, DiBartolomeo• industry and style biases (Rudd 1981, Kurtz 1997, DiBartolomeoand Krutz 1999)
– SRI proponents argue extra-financial aspects have a beneficial impact on long-term performance even though they are hard to define and quantify
• How can we reconcile these two views?
7
Summary of SRI Funds PerformanceBetter understanding of performance
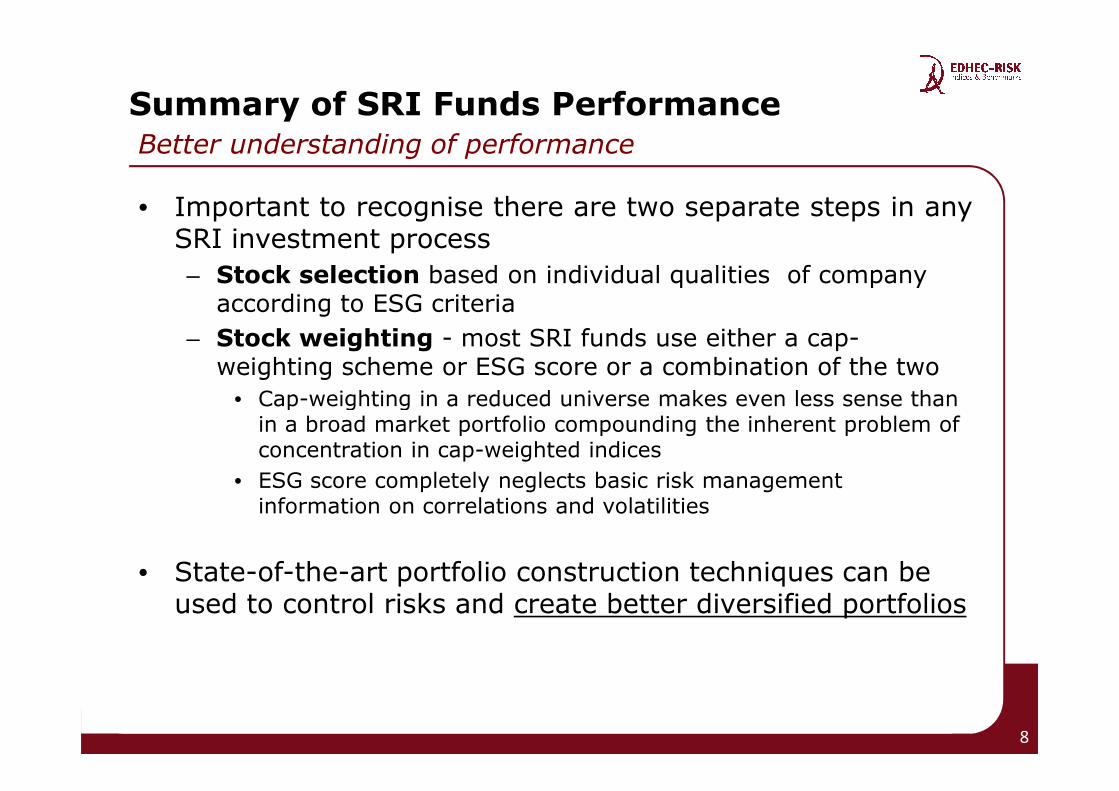
• Important to recognise there are two separate steps in anySRI investment process
– Stock selection based on individual qualities of company according to ESG criteria
– Stock weighting - most SRI funds use either a cap-weighting scheme or ESG score or a combination of the two
• Cap-weighting in a reduced universe makes even less sense than • Cap-weighting in a reduced universe makes even less sense than in a broad market portfolio compounding the inherent problem of concentration in cap-weighted indices
• ESG score completely neglects basic risk management information on correlations and volatilities
• State-of-the-art portfolio construction techniques can be used to control risks and create better diversified portfolios
8
• Summary of SRI Funds Performance
• Improving Diversification
• Empirical Tests
• The FTSE EDHEC-Risk Efficient Eurobloc ERAFP SRI Large Cap Index
• Conclusions
9

Improving DiversificationRehabilitating the Tangency Portfolio
ExpectedReturn
True Tangency Portfolio
●
●
●●
10
Volatility
The true tangency portfolio is a function of the (unknown) true parameter values
Implementable proxies depend on estimated parameter values
●
● Cap-weighted index
● wMSR = f µi,σ i,ρij( )
wMSR = f µi,σ i, ρij( )
Improving Diversification
Estimating Risk Parameters
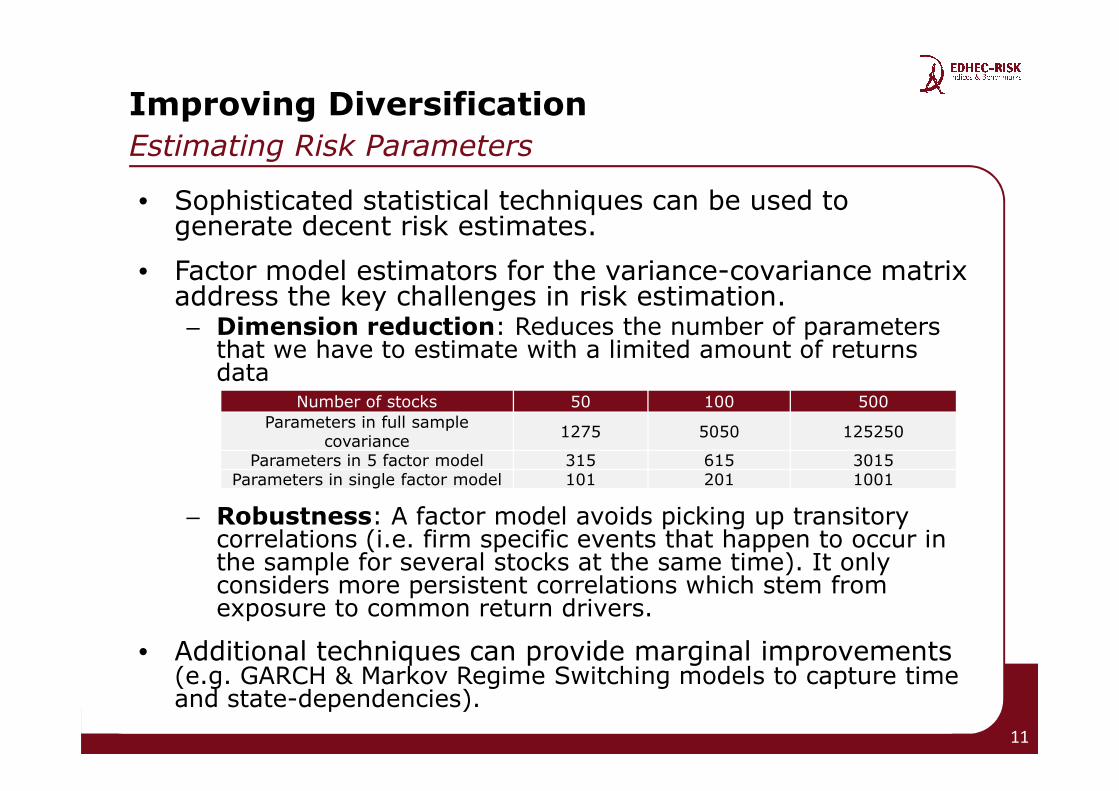
• Sophisticated statistical techniques can be used to generate decent risk estimates.
• Factor model estimators for the variance-covariance matrix address the key challenges in risk estimation.– Dimension reduction: Reduces the number of parameters
that we have to estimate with a limited amount of returns data
Number of stocks 50 100 500
– Robustness: A factor model avoids picking up transitory correlations (i.e. firm specific events that happen to occur in the sample for several stocks at the same time). It only considers more persistent correlations which stem from exposure to common return drivers.
• Additional techniques can provide marginal improvements (e.g. GARCH & Markov Regime Switching models to capture time and state-dependencies).
11
Number of stocks 50 100 500
Parameters in full sample covariance
1275 5050 125250
Parameters in 5 factor model 315 615 3015Parameters in single factor model 101 201 1001
Improving Diversification Estimating Risk Parameters (continued)
• One can chose between two types of factor models:
– Explicit factors
• Advantage: intuitive grasp of factors
• Drawback: Factor selection risk; the model will be mis-specified since we do not know the true factors.
– Implicit factors: “Let the data talk”:
• Advantage: Avoids taking a view on which factors matter.• Advantage: Avoids taking a view on which factors matter.
• Drawback: One may recover factors that don’t matter (sample risk).
• EDHEC-Risk Efficient Index approach:
– PCA summarises the maximum amount of information contained in the data with a set of uncorrelated implicit factors (linear combinations of the stocks’ returns).
– For robustness, we limit the number of factors using an optimal choice criterion.
12

Expected
Return
Maximum Sharpe
Ratio (MSR) Portfolio
Global Minimum
Improving DiversificationGlobal Minimum Variance Portfolio (GMV)
Volatility
●
Global Minimum
Variance (GMV)
Portfolio
●
13
Improving Diversification
Global Minimum Variance (GMV)
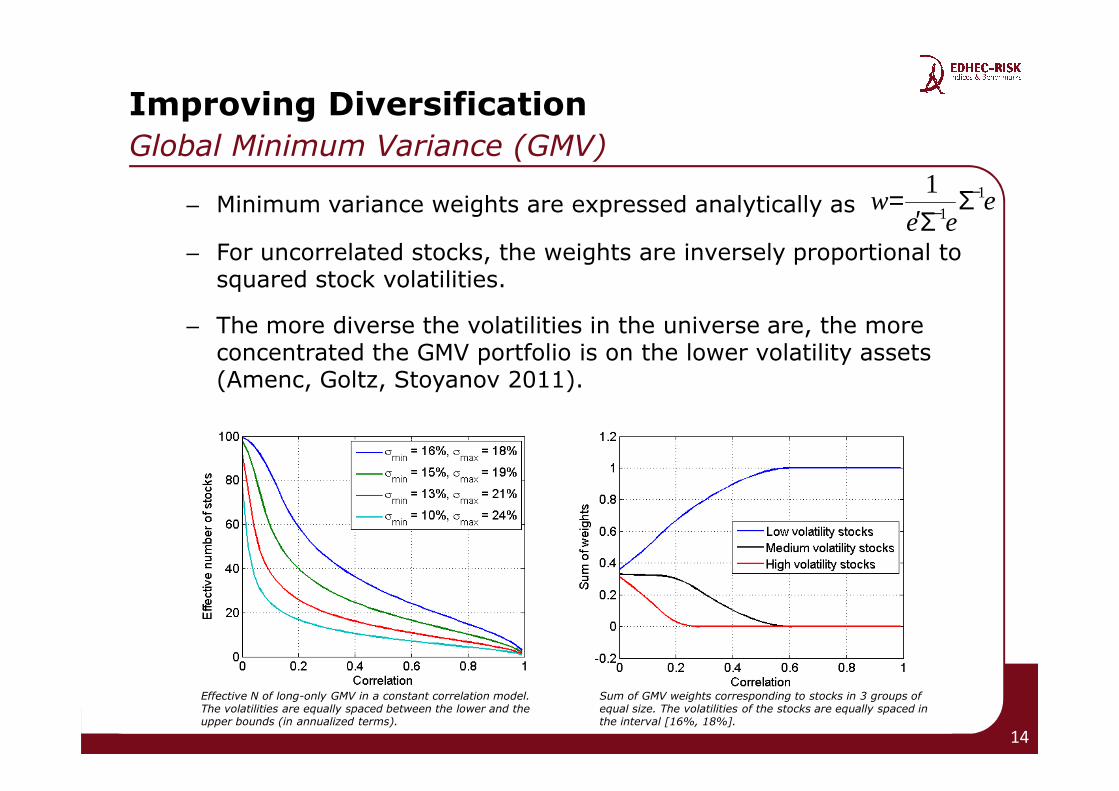
– Minimum variance weights are expressed analytically as
– For uncorrelated stocks, the weights are inversely proportional to squared stock volatilities.
– The more diverse the volatilities in the universe are, the more concentrated the GMV portfolio is on the lower volatility assets (Amenc, Goltz, Stoyanov 2011).
eee
w 11
1 −− Σ
Σ′=
14
Effective N of long-only GMV in a constant correlation model. The volatilities are equally spaced between the lower and the upper bounds (in annualized terms).
Sum of GMV weights corresponding to stocks in 3 groups of equal size. The volatilities of the stocks are equally spaced in the interval [16%, 18%].

Improving DiversificationDiversification with Efficient Indices
• Global minimum variance portfolios are concentrated in low risk assets. Diversification can be improved and concentration can be avoided by changing the objective function.
• Efficient Indices maximise the Sharpe ratio where low risk stocks are penalised by assuming a low expected return. The penalty on the expected returns side counterbalances the attractiveness of low risk stocks.attractiveness of low risk stocks.
• The penalty function for low risk stocks (i.e. the optimisationinput for expected returns) requires estimating differences in risk between stocks.
• We parsimoniously distinguish between groups of stocks rather than between each pair of individual stocks.
• We form groups (deciles) by stocks’ total semi-deviation, a simple measure of downside risk.
15
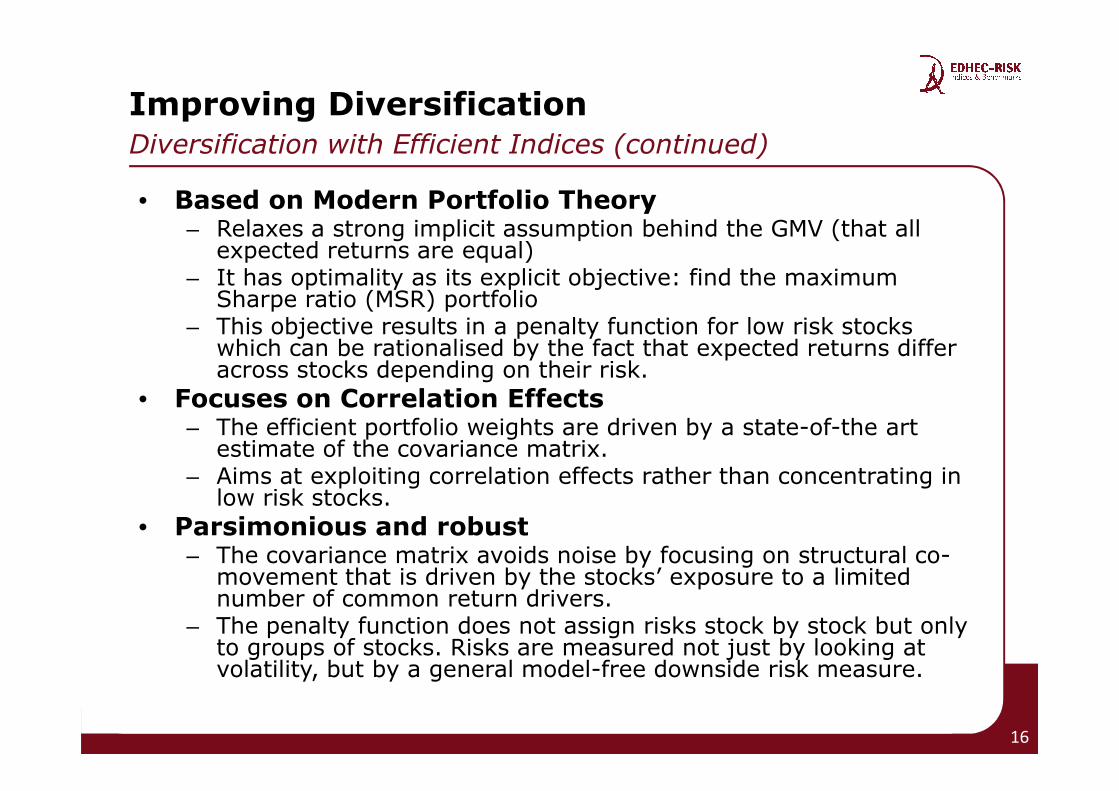
Improving DiversificationDiversification with Efficient Indices (continued)
• Based on Modern Portfolio Theory– Relaxes a strong implicit assumption behind the GMV (that all
expected returns are equal)– It has optimality as its explicit objective: find the maximum
Sharpe ratio (MSR) portfolio– This objective results in a penalty function for low risk stocks
which can be rationalised by the fact that expected returns differ across stocks depending on their risk.
• Focuses on Correlation Effects• Focuses on Correlation Effects– The efficient portfolio weights are driven by a state-of-the art
estimate of the covariance matrix.– Aims at exploiting correlation effects rather than concentrating in
low risk stocks.
• Parsimonious and robust– The covariance matrix avoids noise by focusing on structural co-
movement that is driven by the stocks’ exposure to a limited number of common return drivers.
– The penalty function does not assign risks stock by stock but only to groups of stocks. Risks are measured not just by looking at volatility, but by a general model-free downside risk measure.
16
• Summary of SRI Funds Performance
• Improving Diversification
• Empirical Tests
• The FTSE EDHEC-Risk Efficient Eurobloc ERAFP SRI Large Cap Index
• Conclusion
17
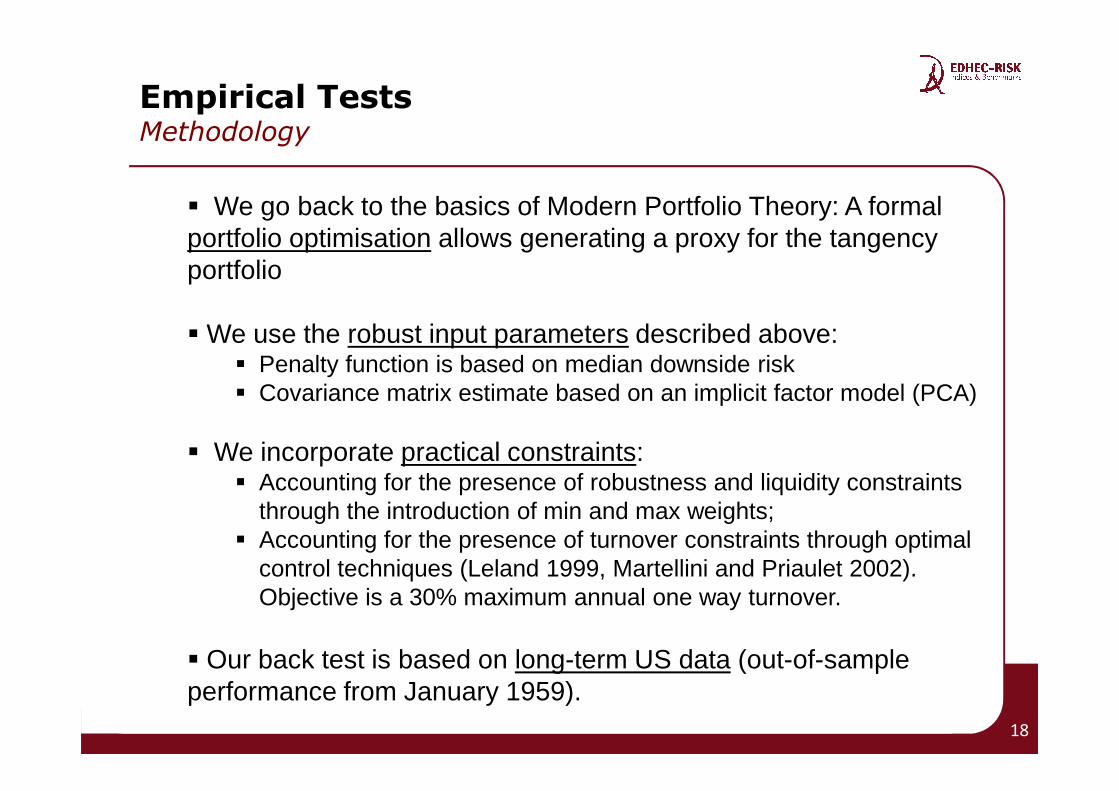
Empirical TestsMethodology
� We go back to the basics of Modern Portfolio Theory: A formal portfolio optimisation allows generating a proxy for the tangency portfolio
� We use the robust input parameters described above:� Penalty function is based on median downside risk� Covariance matrix estimate based on an implicit factor model (PCA)� Covariance matrix estimate based on an implicit factor model (PCA)
� We incorporate practical constraints:� Accounting for the presence of robustness and liquidity constraints
through the introduction of min and max weights;� Accounting for the presence of turnover constraints through optimal
control techniques (Leland 1999, Martellini and Priaulet 2002). Objective is a 30% maximum annual one way turnover.
� Our back test is based on long-term US data (out-of-sample performance from January 1959).
18
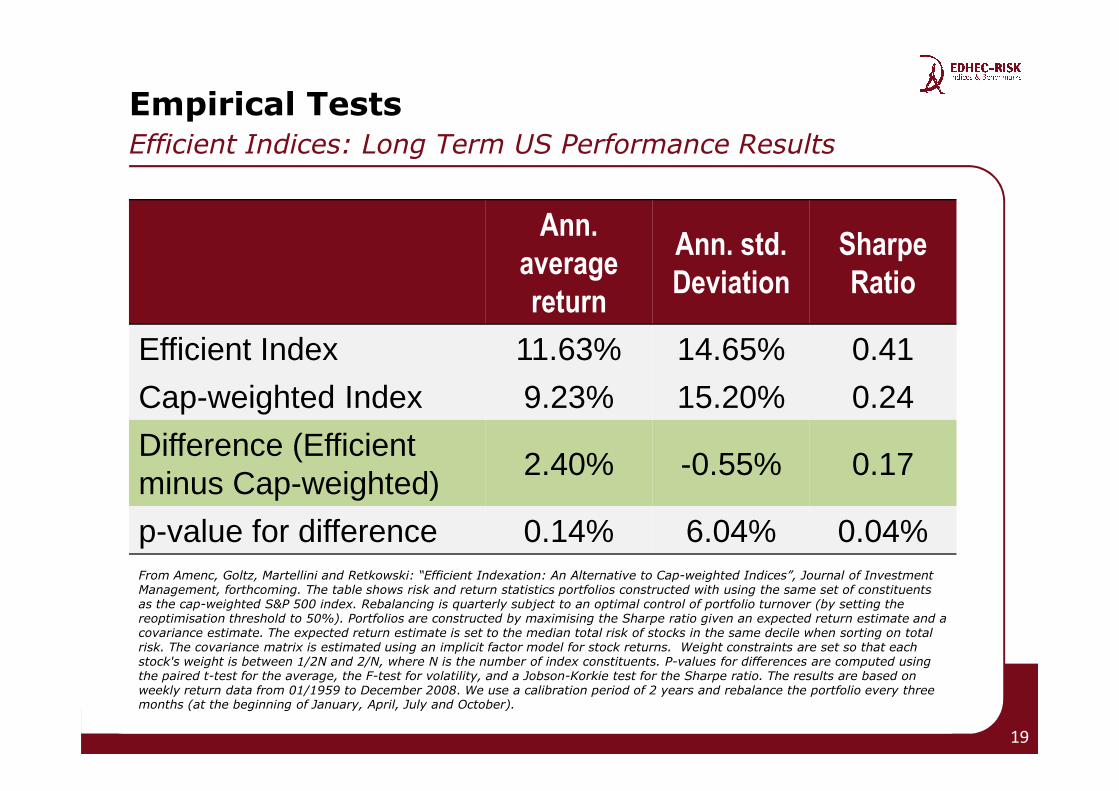
Empirical TestsEfficient Indices: Long Term US Performance Results
Ann.
average
return
Ann. std.
Deviation
Sharpe
Ratio
Efficient Index 11.63% 14.65% 0.41
Cap-weighted Index 9.23% 15.20% 0.24
19
Cap-weighted Index 9.23% 15.20% 0.24
Difference (Efficient minus Cap-weighted)
2.40% -0.55% 0.17
p-value for difference 0.14% 6.04% 0.04%From Amenc, Goltz, Martellini and Retkowski: “Efficient Indexation: An Alternative to Cap-weighted Indices”, Journal of Investment Management, forthcoming. The table shows risk and return statistics portfolios constructed with using the same set of constituents as the cap-weighted S&P 500 index. Rebalancing is quarterly subject to an optimal control of portfolio turnover (by setting the reoptimisation threshold to 50%). Portfolios are constructed by maximising the Sharpe ratio given an expected return estimate and a covariance estimate. The expected return estimate is set to the median total risk of stocks in the same decile when sorting on total risk. The covariance matrix is estimated using an implicit factor model for stock returns. Weight constraints are set so that each stock's weight is between 1/2N and 2/N, where N is the number of index constituents. P-values for differences are computed usingthe paired t-test for the average, the F-test for volatility, and a Jobson-Korkie test for the Sharpe ratio. The results are based on weekly return data from 01/1959 to December 2008. We use a calibration period of 2 years and rebalance the portfolio every three months (at the beginning of January, April, July and October).
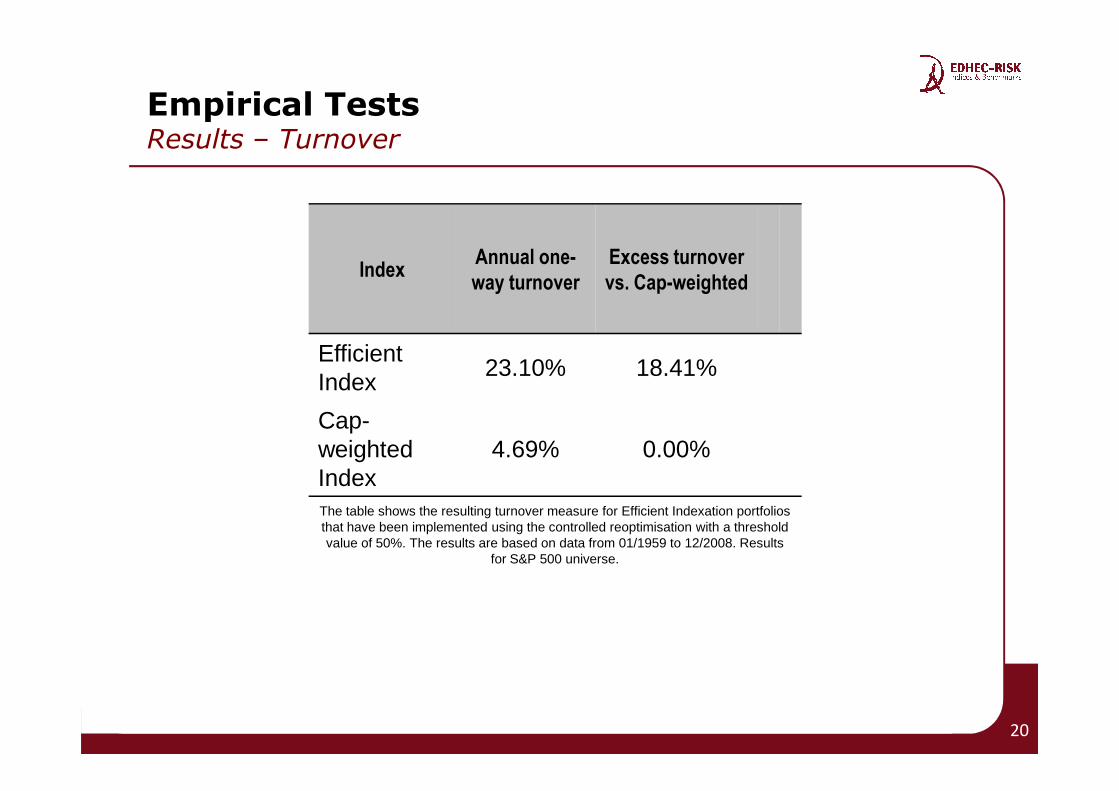
Empirical TestsResults – Turnover
IndexAnnual one-
way turnover
Excess turnover
vs. Cap-weighted
Efficient Index
23.10% 18.41%
Cap-weighted Index
4.69% 0.00%
The table shows the resulting turnover measure for Efficient Indexation portfolios that have been implemented using the controlled reoptimisation with a threshold value of 50%. The results are based on data from 01/1959 to 12/2008. Results
for S&P 500 universe.
20

• Summary of SRI Funds Performance
• Improving Diversification
• Empirical Tests
• The FTSE EDHEC-Risk Efficient Eurobloc ERAFP SRI Large Cap Index
• Conclusion
21
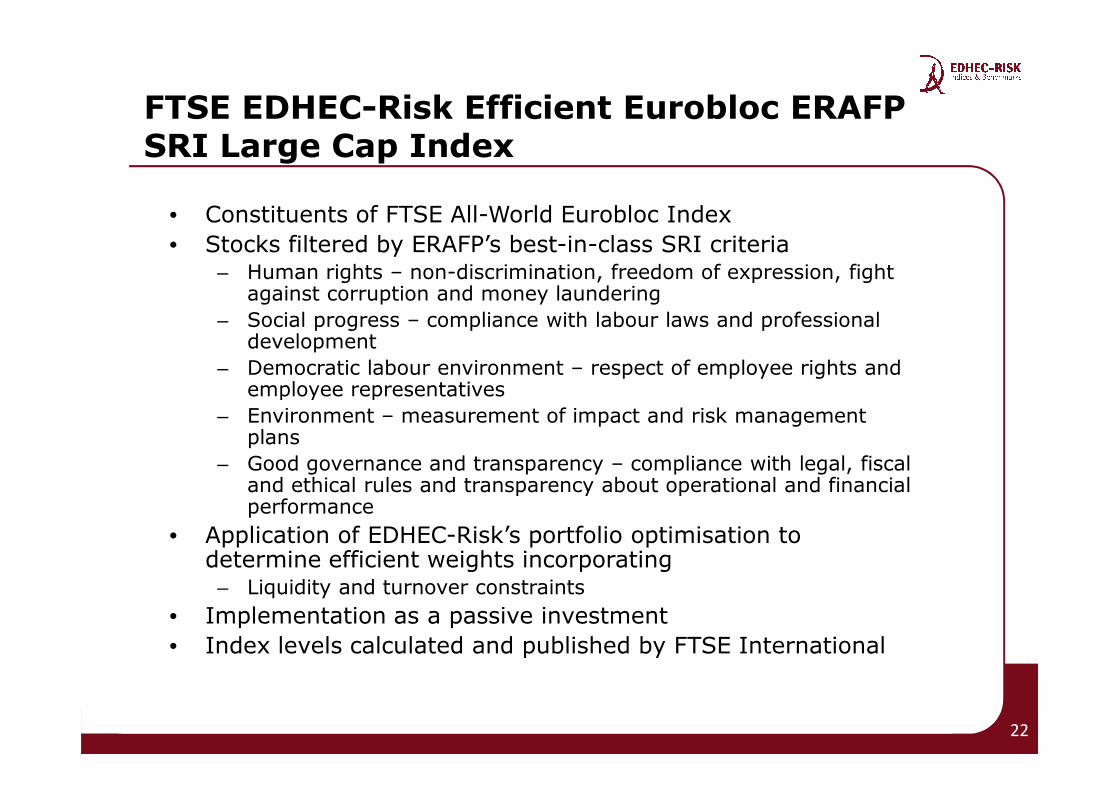
FTSE EDHEC-Risk Efficient Eurobloc ERAFP SRI Large Cap Index
• Constituents of FTSE All-World Eurobloc Index
• Stocks filtered by ERAFP’s best-in-class SRI criteria– Human rights – non-discrimination, freedom of expression, fight
against corruption and money laundering
– Social progress – compliance with labour laws and professional development
– Democratic labour environment – respect of employee rights and employee representativesemployee representatives
– Environment – measurement of impact and risk management plans
– Good governance and transparency – compliance with legal, fiscal and ethical rules and transparency about operational and financial performance
• Application of EDHEC-Risk’s portfolio optimisation to determine efficient weights incorporating
– Liquidity and turnover constraints
• Implementation as a passive investment
• Index levels calculated and published by FTSE International
22
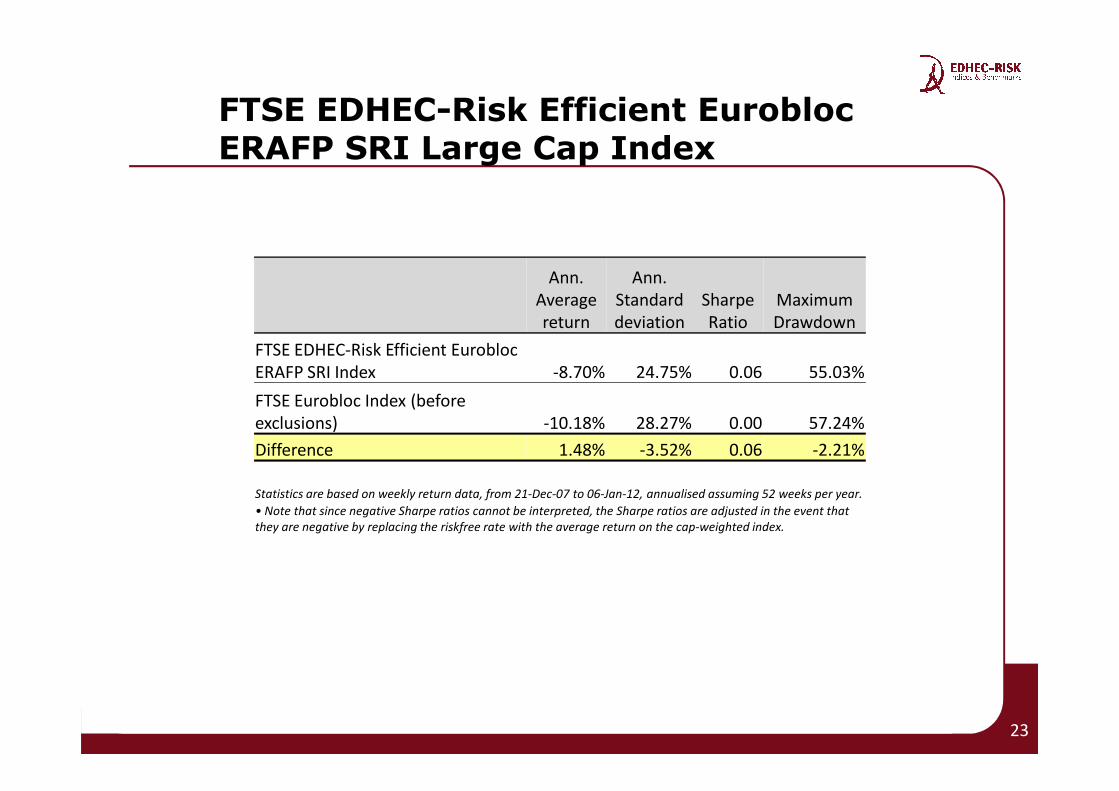
FTSE EDHEC-Risk Efficient EuroblocERAFP SRI Large Cap Index
Ann.
Average
return
Ann.
Standard
deviation
Sharpe
Ratio
Maximum
Drawdown
FTSE EDHEC-Risk Efficient Eurobloc
ERAFP SRI Index -8.70% 24.75% 0.06 55.03%
FTSE Eurobloc Index (before
23
FTSE Eurobloc Index (before
exclusions) -10.18% 28.27% 0.00 57.24%
Difference 1.48% -3.52% 0.06 -2.21%
Statistics are based on weekly return data, from 21-Dec-07 to 06-Jan-12, annualised assuming 52 weeks per year.
• Note that since negative Sharpe ratios cannot be interpreted, the Sharpe ratios are adjusted in the event that
they are negative by replacing the riskfree rate with the average return on the cap-weighted index.
• Summary of SRI Funds Performance
• Improving Diversification
• Empirical Tests
• The FTSE EDHEC-Risk Efficient Eurobloc ERAFP SRI Large Cap Index
• Conclusions
24
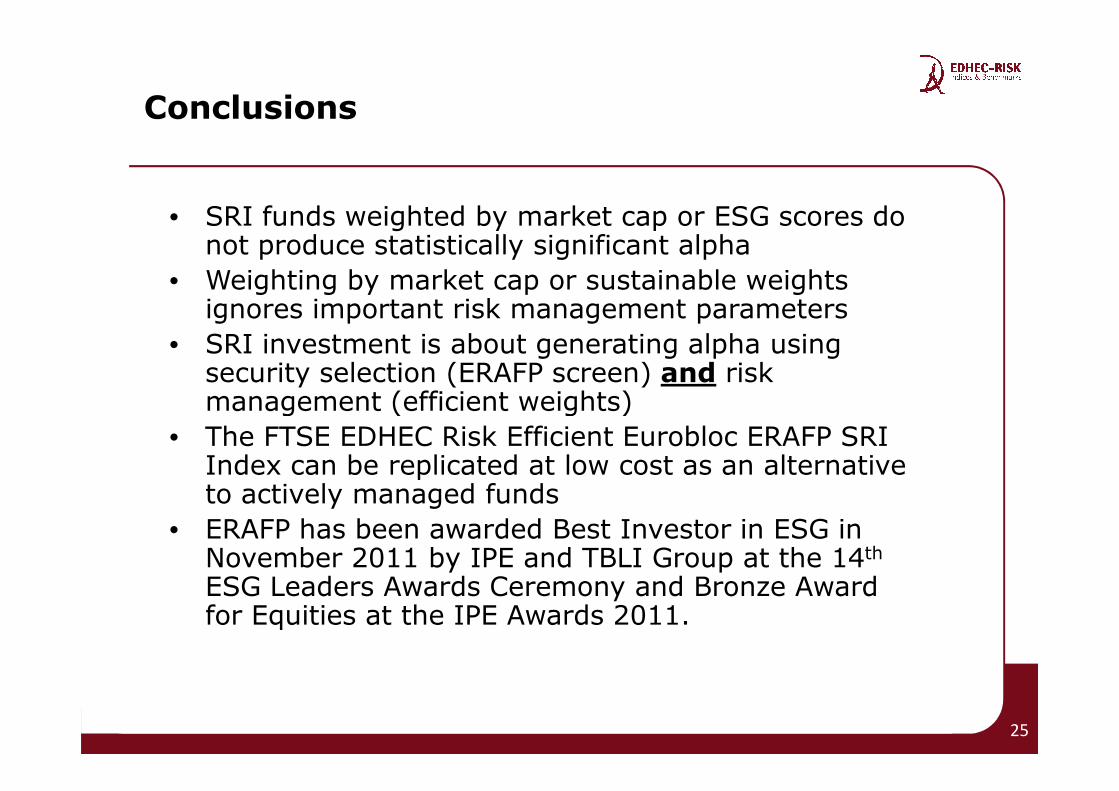
Conclusions
• SRI funds weighted by market cap or ESG scores do not produce statistically significant alpha
• Weighting by market cap or sustainable weights ignores important risk management parameters
• SRI investment is about generating alpha using security selection (ERAFP screen) and risk management (efficient weights)management (efficient weights)
• The FTSE EDHEC Risk Efficient Eurobloc ERAFP SRI Index can be replicated at low cost as an alternative to actively managed funds
• ERAFP has been awarded Best Investor in ESG in November 2011 by IPE and TBLI Group at the 14th
ESG Leaders Awards Ceremony and Bronze Award for Equities at the IPE Awards 2011.
25
Important Information
This document has been created by EDHEC-Risk Indices & Benchmarks as a working document. It does not constitute a contractual document or a commercial offer for a financial product directly or indirectly derived from EDHEC-Risk’s Efficient Index methodology nor does it constitute any investment recommendation. The FTSE EDHEC-Risk Efficient Index Series is calculated by FTSE International Limited (“FTSE”) or its agent. All rights in the FTSE / EDHEC-RISK Efficient Index Series vest in FTSE and EDHEC-Risk Indices & Benchmarks. “FTSE®” is trade mark of the London Stock Exchange Plc and The Financial Times Limited and is used by FTSE under licence. “EDHEC”, "EDHEC-Risk", “Efficient index”, “Efficient market index” and “Efficient weighted index” are trademarks of EDHEC Business School. Neither FTSE nor EDHEC-Risk Indices & Benchmarks nor their licensors shall be liable (including in negligence) for any loss arising out of use of the FTSE EDHEC-Risk Efficient Index Series by any person. This document or any information contained in this document are confidential and must not be transmitted to third parties without prior authorisation
26
document are confidential and must not be transmitted to third parties without prior authorisationfrom EDHEC-Risk Indices & Benchmarks.
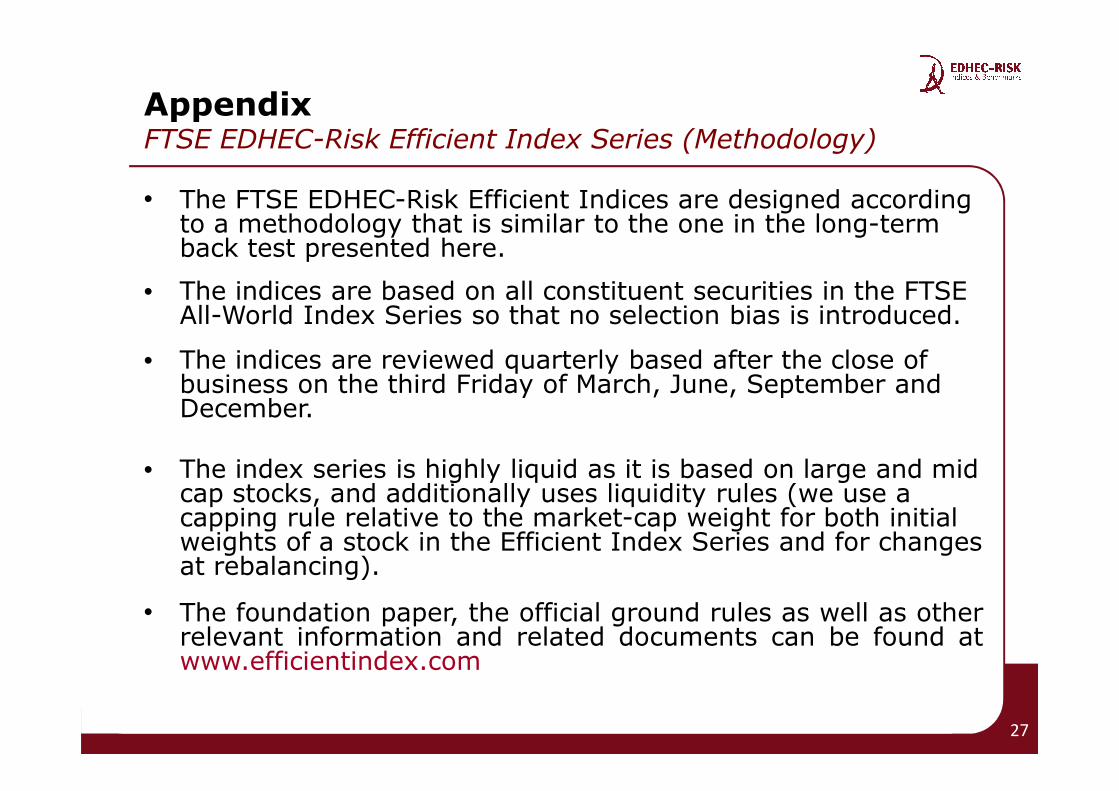
• The FTSE EDHEC-Risk Efficient Indices are designed according to a methodology that is similar to the one in the long-term back test presented here.
• The indices are based on all constituent securities in the FTSE All-World Index Series so that no selection bias is introduced.
• The indices are reviewed quarterly based after the close of business on the third Friday of March, June, September and December.
AppendixFTSE EDHEC-Risk Efficient Index Series (Methodology)
business on the third Friday of March, June, September and December.
• The index series is highly liquid as it is based on large and mid cap stocks, and additionally uses liquidity rules (we use a capping rule relative to the market-cap weight for both initial weights of a stock in the Efficient Index Series and for changes at rebalancing).
• The foundation paper, the official ground rules as well as otherrelevant information and related documents can be found atwww.efficientindex.com
27
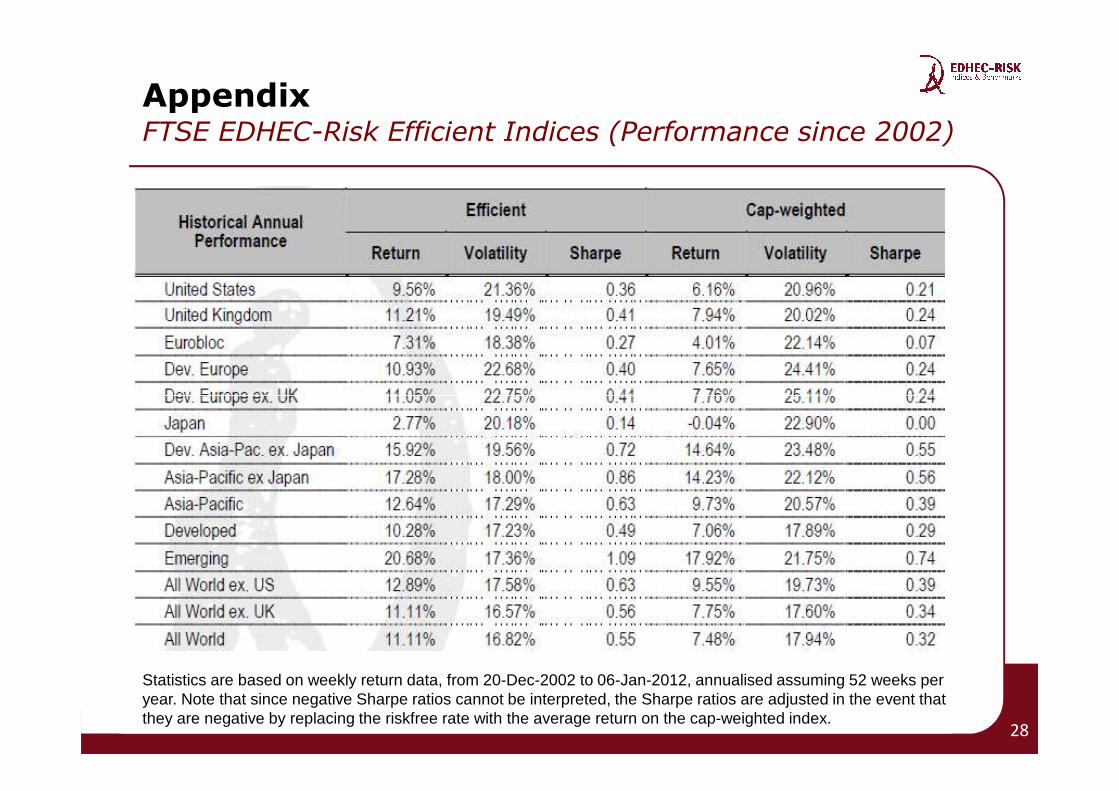
AppendixFTSE EDHEC-Risk Efficient Indices (Performance since 2002)
Statistics are based on weekly return data, from 20-Dec-2002 to 06-Jan-2012, annualised assuming 52 weeks per year. Note that since negative Sharpe ratios cannot be interpreted, the Sharpe ratios are adjusted in the event that they are negative by replacing the riskfree rate with the average return on the cap-weighted index.
28
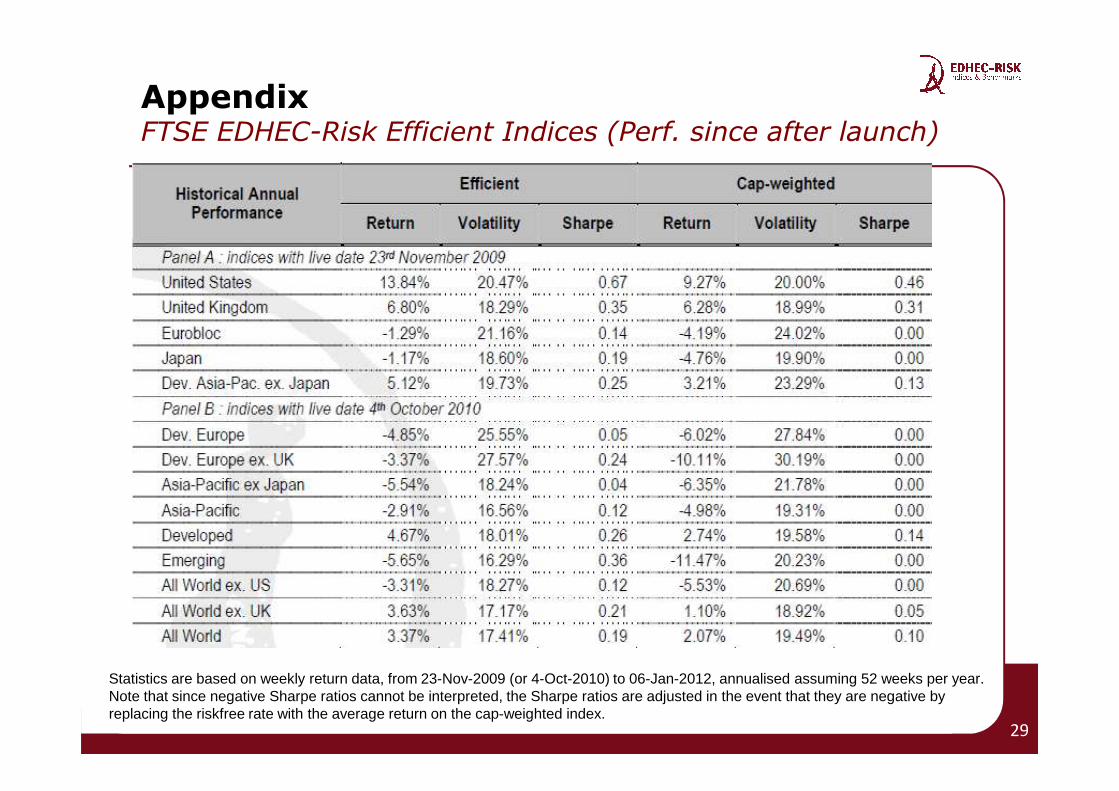
AppendixFTSE EDHEC-Risk Efficient Indices (Perf. since after launch)
Statistics are based on weekly return data, from 23-Nov-2009 (or 4-Oct-2010) to 06-Jan-2012, annualised assuming 52 weeks per year. Note that since negative Sharpe ratios cannot be interpreted, the Sharpe ratios are adjusted in the event that they are negative by replacing the riskfree rate with the average return on the cap-weighted index.
29