performance report primergy cx270 s2 - fujitsu paper performance report primergy cx270 s2 ... in...
TRANSCRIPT

White Paper Performance Report PRIMERGY CX270 S2
http://ts.fujitsu.com/primergy Page 1 (27)
White Paper Fujitsu PRIMERGY Servers Performance Report PRIMERGY CX270 S2
This document contains a summary of the benchmarks executed for the PRIMERGY CX270 S2.
The PRIMERGY CX270 S2 performance data are compared with the data of other PRIMERGY models and discussed. In addition to the benchmark results, an explanation has been included for each benchmark and for the benchmark environment.
Version
1.1
2014-02-13

White Paper Performance Report PRIMERGY CX270 S2 Version: 1.1 2014-02-13
Page 2 (27) http://ts.fujitsu.com/primergy
Contents
Document history
Version 1.0
New:
Technical data SPECcpu2006
Approximations based on measurement results of the PRIMERGY CX250 S2 with Xeon E5-2600 v2 processor series
Disk I/O Measurements with “LSI SW RAID on Intel C600 (Onboard SATA)”, “RAID Ctrl SAS 6G 0/1 (D2607)” and “RAID Ctrl SAS 5/6 512MB (D2616)” controllers
STREAM Measurements with Xeon E5-2600 v2 processor series
LINPACK Measurements with Xeon E5-2600 v2 processor series
Version 1.1
Updated:
Technical data Intel Xeon Phi Co-Processor 3120P added
SPECcpu2006 Additional approximations based on measurement results of the PRIMERGY CX250 S2 and RX300 S8 with Xeon E5-2600 v2 processor series
Disk I/O Update of disk numbers and performance values
STREAM Additional Measurements with Xeon E5-2600 v2 processor series
LINPACK Additional measurements with Xeon E5-2600 v2 processor series Measurements with 2 × Xeon E5-2697 v2 and GPGPUs/coprocessors
Document history ................................................................................................................................................ 2
Technical data .................................................................................................................................................... 3
SPECcpu2006 .................................................................................................................................................... 6
Disk I/O ............................................................................................................................................................. 10
STREAM ........................................................................................................................................................... 17
LINPACK .......................................................................................................................................................... 19
Literature ........................................................................................................................................................... 26
Contact ............................................................................................................................................................. 27

White Paper Performance Report PRIMERGY CX270 S2 Version: 1.1 2014-02-13
http://ts.fujitsu.com/primergy Page 3 (27)
Technical data
Decimal prefixes according to the SI standard are used for measurement units in this white paper (e.g. 1 GB = 10
9 bytes). In contrast, these prefixes should be interpreted as binary prefixes (e.g. 1 GB = 2
30 bytes) for
the capacities of caches and storage modules. Separate reference will be made to any further exceptions where applicable.
Model PRIMERGY CX270 S2
Form factor Server node
Chipset Intel C600 series
Number of sockets 2
Number of processors orderable 2
Processor type Intel® Xeon
® series E5-2600 v2
Number of memory slots 16 (8 per processor)
Maximum memory configuration 1024 GB
Onboard LAN controller 2 × 1 Gbit/s
Onboard HDD controller SATA controller for up to 6 × 2.5˝ SATA HDDs
PCI slots 2 × PCI-Express 3.0 x8 1 × PCI-Express 3.0 x16 for GPGPU
PRIMERGY CX270 S2
White Paper Performance Report PRIMERGY CX270 S2 Version: 1.1 2014-02-13
Page 4 (27) http://ts.fujitsu.com/primergy
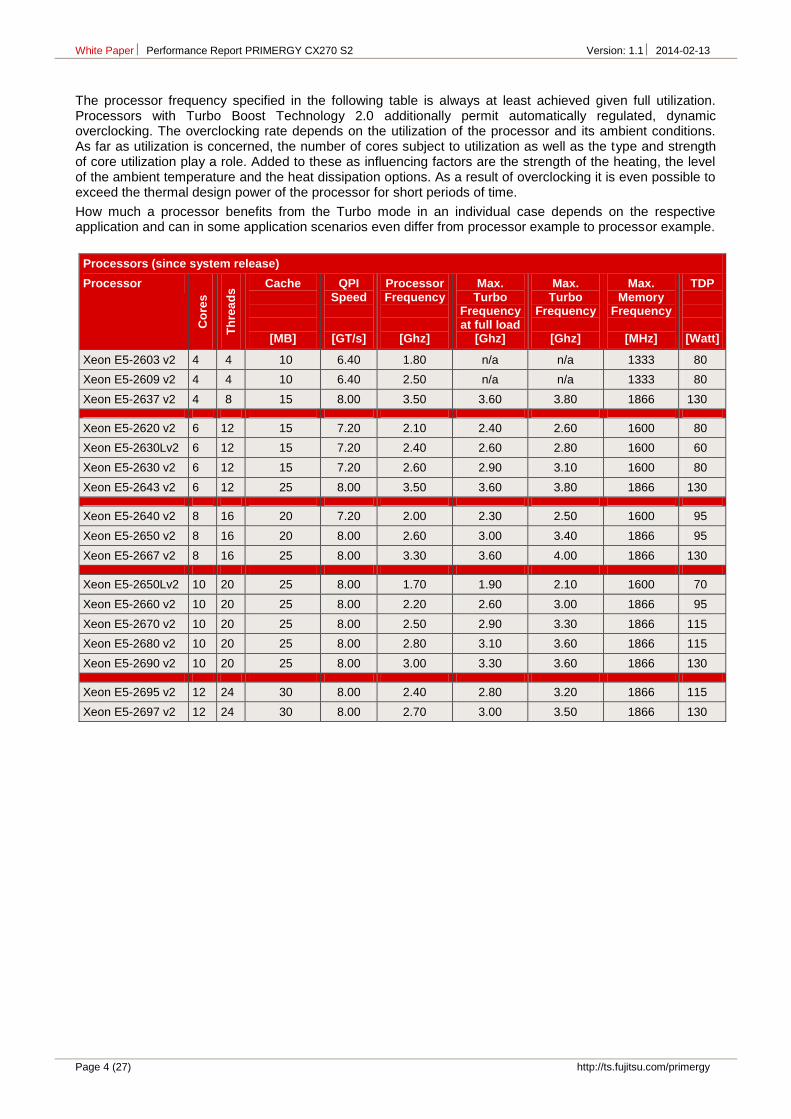
The processor frequency specified in the following table is always at least achieved given full utilization. Processors with Turbo Boost Technology 2.0 additionally permit automatically regulated, dynamic overclocking. The overclocking rate depends on the utilization of the processor and its ambient conditions. As far as utilization is concerned, the number of cores subject to utilization as well as the type and strength of core utilization play a role. Added to these as influencing factors are the strength of the heating, the level of the ambient temperature and the heat dissipation options. As a result of overclocking it is even possible to exceed the thermal design power of the processor for short periods of time.
How much a processor benefits from the Turbo mode in an individual case depends on the respective application and can in some application scenarios even differ from processor example to processor example.
Processors (since system release)
Processor
Co
res
Th
rea
ds Cache
[MB]
QPI Speed
[GT/s]
Processor Frequency
[Ghz]
Max. Turbo
Frequency at full load
[Ghz]
Max. Turbo
Frequency
[Ghz]
Max. Memory
Frequency
[MHz]
TDP
[Watt]
Xeon E5-2603 v2 4 4 10 6.40 1.80 n/a n/a 1333 80
Xeon E5-2609 v2 4 4 10 6.40 2.50 n/a n/a 1333 80
Xeon E5-2637 v2 4 8 15 8.00 3.50 3.60 3.80 1866 130
Xeon E5-2620 v2 6 12 15 7.20 2.10 2.40 2.60 1600 80
Xeon E5-2630Lv2 6 12 15 7.20 2.40 2.60 2.80 1600 60
Xeon E5-2630 v2 6 12 15 7.20 2.60 2.90 3.10 1600 80
Xeon E5-2643 v2 6 12 25 8.00 3.50 3.60 3.80 1866 130
Xeon E5-2640 v2 8 16 20 7.20 2.00 2.30 2.50 1600 95
Xeon E5-2650 v2 8 16 20 8.00 2.60 3.00 3.40 1866 95
Xeon E5-2667 v2 8 16 25 8.00 3.30 3.60 4.00 1866 130
Xeon E5-2650Lv2 10 20 25 8.00 1.70 1.90 2.10 1600 70
Xeon E5-2660 v2 10 20 25 8.00 2.20 2.60 3.00 1866 95
Xeon E5-2670 v2 10 20 25 8.00 2.50 2.90 3.30 1866 115
Xeon E5-2680 v2 10 20 25 8.00 2.80 3.10 3.60 1866 115
Xeon E5-2690 v2 10 20 25 8.00 3.00 3.30 3.60 1866 130
Xeon E5-2695 v2 12 24 30 8.00 2.40 2.80 3.20 1866 115
Xeon E5-2697 v2 12 24 30 8.00 2.70 3.00 3.50 1866 130

White Paper Performance Report PRIMERGY CX270 S2 Version: 1.1 2014-02-13
http://ts.fujitsu.com/primergy Page 5 (27)
Memory modules (since system release)
Memory module
Ca
pa
cit
y [
GB
]
Ra
nk
s
Bit
wid
th o
f th
e
me
mo
ry c
hip
s
Fre
qu
en
cy
[M
Hz]
Lo
w v
olt
ag
e
Lo
ad
re
du
ce
d
Re
gis
tere
d
EC
C
4GB (1x4GB) 1Rx4 L DDR3-1600 R ECC (4 GB 1Rx4 PC3L-12800R)
4 1 4 1600
8GB (1x8GB) 2Rx8 L DDR3-1600 U ECC (8 GB 2Rx8 PC3L-12800E)
8 2 8 1600
8GB (1x8GB) 1Rx4 L DDR3-1600 R ECC (8 GB 1Rx4 PC3L-12800R)
8 1 4 1600
8GB (1x8GB) 2Rx8 DDR3-1866 R ECC (8 GB 2Rx8 PC3-14900R)
8 2 8 1866
16GB (1x16GB) 2Rx4 L DDR3-1600 R ECC (16 GB 2Rx4 PC3L-12800R)
16 2 4 1600
16GB (1x16GB) 2Rx4 DDR3-1866 R ECC (16 GB 2Rx4 PC3-14900R)
16 2 4 1866
32GB (1x32GB) 4Rx4 L DDR3-1600 LR ECC (32 GB 4Rx4 PC3L-12800L)
32 4 4 1600
64GB (1x64GB) 8Rx4 L DDR3-1333 LR ECC (64 GB 8Rx4 PC3L-10600L)
64 8 4 1333
GPGPUs/coprocessors (since system release)
GPGPU/coprocessor Cores Peak double precision floating point performance
[GFlops]
Max. number of GPGPUs
PY NVIDIA Tesla K20 GPGPU 2496 1170 1
PY NVIDIA Tesla K20X GPGPU 2688 1310 1
Intel Xeon Phi Co-Processor 3120P 57 1001 1
Intel Xeon Phi Co-Processor 5110P 60 1011 1
Intel Xeon Phi Co-Processor 7120P 61 1208 1
Some components may not be available in all countries or sales regions.
Detailed technical information is available in the data sheet PRIMERGY CX270 S2.

White Paper Performance Report PRIMERGY CX270 S2 Version: 1.1 2014-02-13
Page 6 (27) http://ts.fujitsu.com/primergy
SPECcpu2006
Benchmark description
SPECcpu2006 is a benchmark which measures the system efficiency with integer and floating-point operations. It consists of an integer test suite (SPECint2006) containing 12 applications and a floating-point test suite (SPECfp2006) containing 17 applications. Both test suites are extremely computing-intensive and concentrate on the CPU and the memory. Other components, such as Disk I/O and network, are not measured by this benchmark.
SPECcpu2006 is not tied to a special operating system. The benchmark is available as source code and is compiled before the actual measurement. The used compiler version and their optimization settings also affect the measurement result.
SPECcpu2006 contains two different performance measurement methods: the first method (SPECint2006 or SPECfp2006) determines the time which is required to process single task. The second method (SPECint_rate2006 or SPECfp_rate2006) determines the throughput, i.e. the number of tasks that can be handled in parallel. Both methods are also divided into two measurement runs, “base” and “peak” which differ in the use of compiler optimization. When publishing the results the base values are always used; the peak values are optional.
Benchmark Arithmetics Type Compiler optimization
Measurement result
Application
SPECint2006 integer peak aggressive Speed single-threaded
SPECint_base2006 integer base conservative
SPECint_rate2006 integer peak aggressive Throughput multi-threaded
SPECint_rate_base2006 integer base conservative
SPECfp2006 floating point peak aggressive Speed single-threaded
SPECfp_base2006 floating point base conservative
SPECfp_rate2006 floating point peak aggressive Throughput multi-threaded
SPECfp_rate_base2006 floating point base conservative
The measurement results are the geometric average from normalized ratio values which have been determined for individual benchmarks. The geometric average - in contrast to the arithmetic average - means that there is a weighting in favour of the lower individual results. Normalized means that the measurement is how fast is the test system compared to a reference system. Value “1” was defined for the SPECint_base2006-, SPECint_rate_base2006, SPECfp_base2006 and SPECfp_rate_base2006 results of the reference system. For example, a SPECint_base2006 value of 2 means that the measuring system has handled this benchmark twice as fast as the reference system. A SPECfp_rate_base2006 value of 4 means that the measuring system has handled this benchmark some 4/[# base copies] times faster than the reference system. “# base copies” specify how many parallel instances of the benchmark have been executed.
Not every SPECcpu2006 measurement is submitted by us for publication at SPEC. This is why the SPEC web pages do not have every result. As we archive the log files for all measurements, we can prove the correct implementation of the measurements at any time.
White Paper Performance Report PRIMERGY CX270 S2 Version: 1.1 2014-02-13
http://ts.fujitsu.com/primergy Page 7 (27)
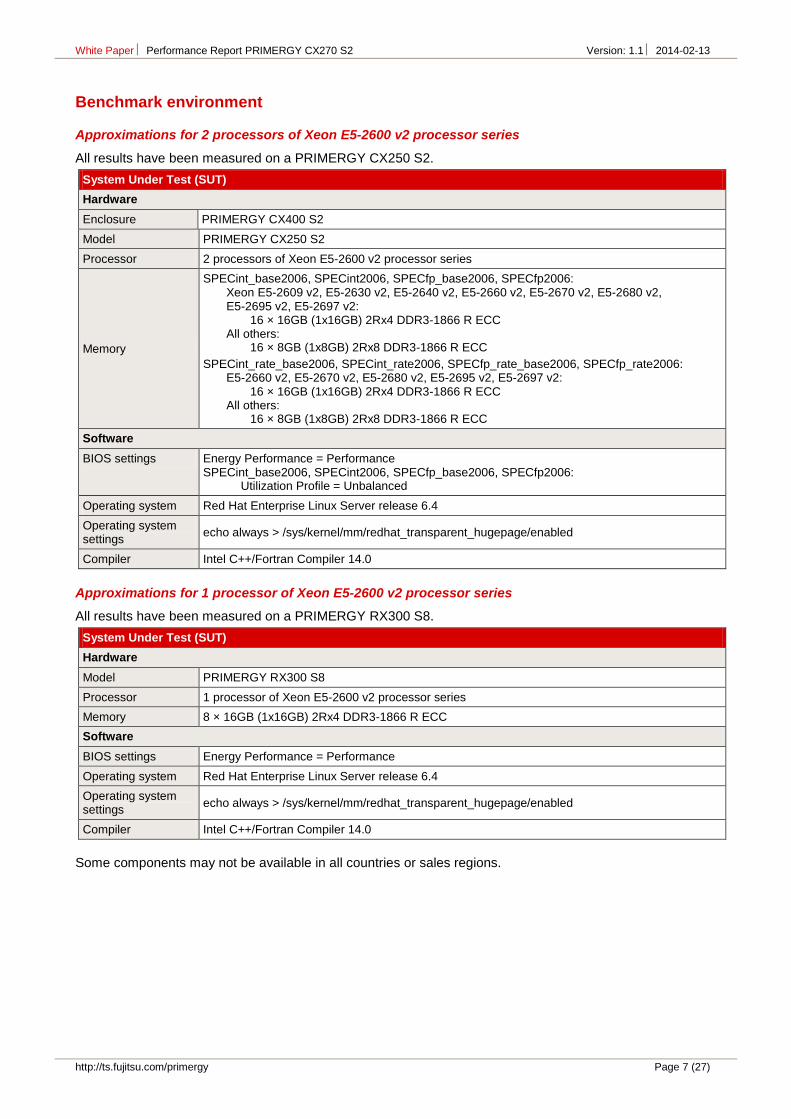
Benchmark environment
Approximations for 2 processors of Xeon E5-2600 v2 processor series
All results have been measured on a PRIMERGY CX250 S2.
System Under Test (SUT)
Hardware
Enclosure PRIMERGY CX400 S2
Model PRIMERGY CX250 S2
Processor 2 processors of Xeon E5-2600 v2 processor series
Memory
SPECint_base2006, SPECint2006, SPECfp_base2006, SPECfp2006: Xeon E5-2609 v2, E5-2630 v2, E5-2640 v2, E5-2660 v2, E5-2670 v2, E5-2680 v2, E5-2695 v2, E5-2697 v2: 16 × 16GB (1x16GB) 2Rx4 DDR3-1866 R ECC All others: 16 × 8GB (1x8GB) 2Rx8 DDR3-1866 R ECC
SPECint_rate_base2006, SPECint_rate2006, SPECfp_rate_base2006, SPECfp_rate2006: E5-2660 v2, E5-2670 v2, E5-2680 v2, E5-2695 v2, E5-2697 v2: 16 × 16GB (1x16GB) 2Rx4 DDR3-1866 R ECC All others: 16 × 8GB (1x8GB) 2Rx8 DDR3-1866 R ECC
Software
BIOS settings Energy Performance = Performance SPECint_base2006, SPECint2006, SPECfp_base2006, SPECfp2006:
Utilization Profile = Unbalanced
Operating system Red Hat Enterprise Linux Server release 6.4
Operating system settings
echo always > /sys/kernel/mm/redhat_transparent_hugepage/enabled
Compiler Intel C++/Fortran Compiler 14.0
Approximations for 1 processor of Xeon E5-2600 v2 processor series
All results have been measured on a PRIMERGY RX300 S8.
System Under Test (SUT)
Hardware
Model PRIMERGY RX300 S8
Processor 1 processor of Xeon E5-2600 v2 processor series
Memory 8 × 16GB (1x16GB) 2Rx4 DDR3-1866 R ECC
Software
BIOS settings Energy Performance = Performance
Operating system Red Hat Enterprise Linux Server release 6.4
Operating system settings
echo always > /sys/kernel/mm/redhat_transparent_hugepage/enabled
Compiler Intel C++/Fortran Compiler 14.0
Some components may not be available in all countries or sales regions.
White Paper Performance Report PRIMERGY CX270 S2 Version: 1.1 2014-02-13
Page 8 (27) http://ts.fujitsu.com/primergy
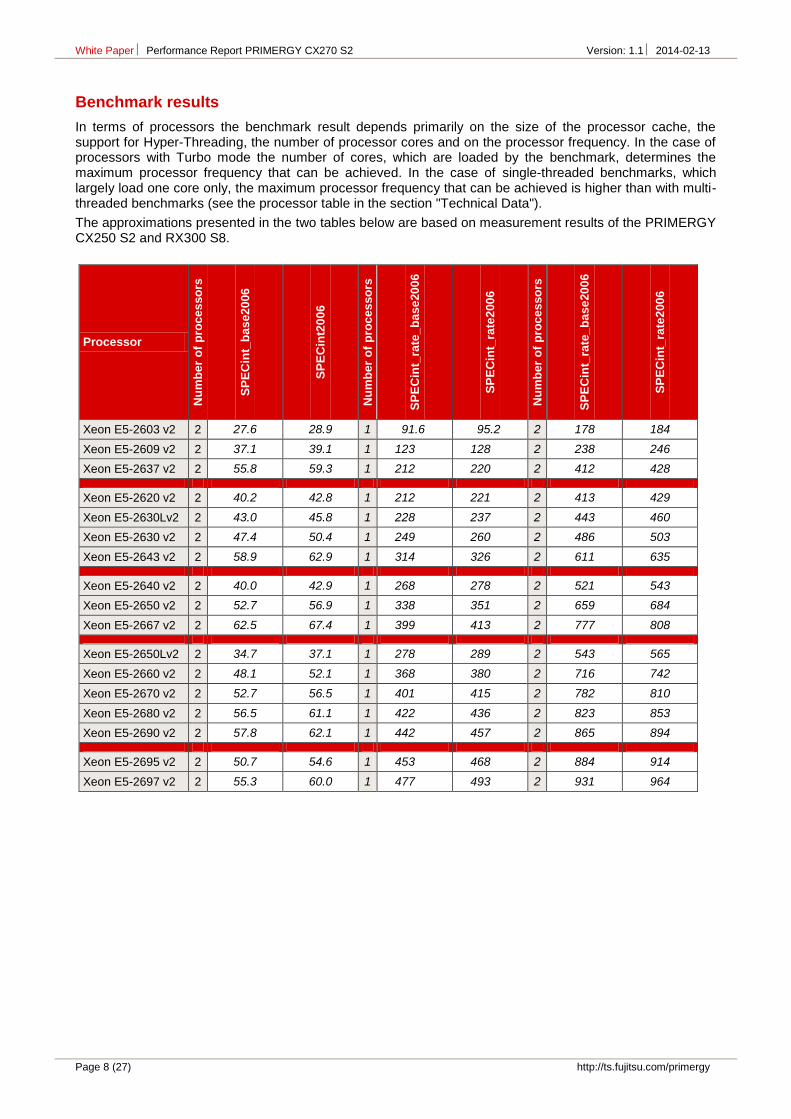
Benchmark results
In terms of processors the benchmark result depends primarily on the size of the processor cache, the support for Hyper-Threading, the number of processor cores and on the processor frequency. In the case of processors with Turbo mode the number of cores, which are loaded by the benchmark, determines the maximum processor frequency that can be achieved. In the case of single-threaded benchmarks, which largely load one core only, the maximum processor frequency that can be achieved is higher than with multi-threaded benchmarks (see the processor table in the section "Technical Data").
The approximations presented in the two tables below are based on measurement results of the PRIMERGY CX250 S2 and RX300 S8.
Processor
Nu
mb
er
of
pro
ce
sso
rs
SP
EC
int_
ba
se2
006
SP
EC
int2
00
6
Nu
mb
er
of
pro
ce
sso
rs
SP
EC
int_
rate
_b
as
e20
06
SP
EC
int_
rate
200
6
Nu
mb
er
of
pro
ce
sso
rs
SP
EC
int_
rate
_b
as
e20
06
SP
EC
int_
rate
200
6
Xeon E5-2603 v2 2 27.6 28.9 1 91.6 95.2 2 178 184
Xeon E5-2609 v2 2 37.1 39.1 1 123 128 2 238 246
Xeon E5-2637 v2 2 55.8 59.3 1 212 220 2 412 428
Xeon E5-2620 v2 2 40.2 42.8 1 212 221 2 413 429
Xeon E5-2630Lv2 2 43.0 45.8 1 228 237 2 443 460
Xeon E5-2630 v2 2 47.4 50.4 1 249 260 2 486 503
Xeon E5-2643 v2 2 58.9 62.9 1 314 326 2 611 635
Xeon E5-2640 v2 2 40.0 42.9 1 268 278 2 521 543
Xeon E5-2650 v2 2 52.7 56.9 1 338 351 2 659 684
Xeon E5-2667 v2 2 62.5 67.4 1 399 413 2 777 808
Xeon E5-2650Lv2 2 34.7 37.1 1 278 289 2 543 565
Xeon E5-2660 v2 2 48.1 52.1 1 368 380 2 716 742
Xeon E5-2670 v2 2 52.7 56.5 1 401 415 2 782 810
Xeon E5-2680 v2 2 56.5 61.1 1 422 436 2 823 853
Xeon E5-2690 v2 2 57.8 62.1 1 442 457 2 865 894
Xeon E5-2695 v2 2 50.7 54.6 1 453 468 2 884 914
Xeon E5-2697 v2 2 55.3 60.0 1 477 493 2 931 964

White Paper Performance Report PRIMERGY CX270 S2 Version: 1.1 2014-02-13
http://ts.fujitsu.com/primergy Page 9 (27)
Processor
Nu
mb
er
of
pro
ce
sso
rs
SP
EC
fp_
ba
se2
00
6
SP
EC
fp2
00
6
Nu
mb
er
of
pro
ce
sso
rs
SP
EC
fp_
rate
_b
as
e20
06
SP
EC
fp_
rate
20
06
Nu
mb
er
of
pro
ce
sso
rs
SP
EC
fp_
rate
_b
as
e20
06
SP
EC
fp_
rate
20
06
Xeon E5-2603 v2 2 49.6 51.0 1 103 105 2 198 202
Xeon E5-2609 v2 2 64.3 66.2 1 131 133 2 254 259
Xeon E5-2637 v2 2 94.7 98.1 1 196 201 2 384 394
Xeon E5-2620 v2 2 72.5 75.2 1 193 197 2 378 386
Xeon E5-2630Lv2 2 77.3 80.2 1 202 206 2 398 406
Xeon E5-2630 v2 2 83.7 86.8 1 215 220 2 423 433
Xeon E5-2643 v2 2 102 106 1 163 270 2 518 531
Xeon E5-2640 v2 2 75.4 78.3 1 228 233 2 448 459
Xeon E5-2650 v2 2 95.6 99.8 1 276 283 2 543 556
Xeon E5-2667 v2 2 108 113 1 302 311 2 593 610
Xeon E5-2650Lv2 2 66.6 69.4 1 234 239 2 460 471
Xeon E5-2660 v2 2 87.7 91.9 1 290 298 2 571 585
Xeon E5-2670 v2 2 95.5 99.8 1 306 314 2 602 617
Xeon E5-2680 v2 2 101 106 1 315 324 2 621 637
Xeon E5-2690 v2 2 101 106 1 323 332 2 633 650
Xeon E5-2695 v2 2 92.2 96.6 1 333 342 2 656 674
Xeon E5-2697 v2 2 96.6 102 1 343 353 2 676 695

White Paper Performance Report PRIMERGY CX270 S2 Version: 1.1 2014-02-13
Page 10 (27) http://ts.fujitsu.com/primergy
Disk I/O
Benchmark description
Performance measurements of disk subsystems for PRIMERGY servers are used to assess their performance and enable a comparison of the different storage connections for PRIMERGY servers. As standard, these performance measurements are carried out with a defined measurement method, which models the hard disk accesses of real application scenarios on the basis of specifications.
The essential specifications are:
Share of random accesses / sequential accesses Share of read / write access types Block size (kB) Number of parallel accesses (# of outstanding I/Os)
A given value combination of these specifications is known as “load profile”. The following five standard load profiles can be allocated to typical application scenarios:
In order to model applications that access in parallel with a different load intensity, the “# of Outstanding I/Os” is increased, starting with 1, 3, 8 and going up to 512 (from 8 onwards in increments to the power of two).
The measurements of this document are based on these standard load profiles.
The main results of a measurement are:
Throughput [MB/s] Throughput in megabytes per second Transactions [IO/s] Transaction rate in I/O operations per second Latency [ms] Average response time in ms
The data throughput has established itself as the normal measurement variable for sequential load profiles, whereas the measurement variable “transaction rate” is mostly used for random load profiles with their small block sizes. Data throughput and transaction rate are directly proportional to each other and can be transferred to each other according to the formula
Data throughput [MB/s] = Transaction rate [IO/s] × Block size [MB]
Transaction rate [IO/s] = Data throughput [MB/s] / Block size [MB]
This section specifies hard disk capacities on a basis of 10 (1 TB = 1012
bytes) while all other capacities, file sizes, block sizes and throughputs are specified on a basis of 2 (1 MB/s = 2
20 bytes/s).
All the details of the measurement method and the basics of disk I/O performance are described in the white paper “Basics of Disk I/O Performance”.
Standard load profile
Access Type of access Block size [kB]
Application
read write
File copy random 50% 50% 64 Copying of files
File server random 67% 33% 64 File server
Database random 67% 33% 8 Database (data transfer) Mail server
Streaming sequential 100% 0% 64 Database (log file), Data backup; Video streaming (partial)
Restore sequential 0% 100% 64 Restoring of files

White Paper Performance Report PRIMERGY CX270 S2 Version: 1.1 2014-02-13
http://ts.fujitsu.com/primergy Page 11 (27)
Benchmark environment
All the measurement results discussed in this chapter were determined using the hardware and software components listed below:
System Under Test (SUT)
Hardware
Controller 1 × “LSI SW RAID on Intel C600 (Onboard SATA)” 1 × “RAID Ctrl SAS 6G 0/1 (D2607)” 1 × “RAID Ctrl SAS 5/6 512MB (D2616)”
Drive 4 × EP HDD SAS 6 Gbit/s 2.5 15000 rpm 146 GB
4 × EP SSD SAS 6 Gbit/s 2.5 200 GB MLC
4 × EP SSD SATA 6 Gbit/s 2.5 200 GB MLC
4 × BC HDD SATA 6 Gbit/s 2.5 7200 rpm 1 TB
3 × BC HDD SATA 6 Gbit/s 3.5 7200 rpm 3 TB
Software
Operating system Microsoft Windows Server 2008 Enterprise x64 Edition SP2 Microsoft Windows Server 2012 Standard
Administration software
ServerView RAID Manager 5.7.2
Initialization of RAID arrays
RAID arrays are initialized before the measurement with an elementary block size of 64 kB (“stripe size”)
File system NTFS
Measuring tool Iometer 2006.07.27
Measurement data Measurement files of 32 GB with 1 – 8 hard disks; 64 GB with 9 – 16 hard disks; 128 GB with 17 or more hard disks
Some components may not be available in all countries / sales regions.
White Paper Performance Report PRIMERGY CX270 S2 Version: 1.1 2014-02-13
Page 12 (27) http://ts.fujitsu.com/primergy
Benchmark results
The results presented here are designed to help you choose the right solution from the various configuration options of the PRIMERGY CX270 S2 in the light of disk-I/O performance. The selection of suitable components and the right settings of their parameters is important here. These two aspects should therefore be dealt with as preparation for the discussion of the performance values.
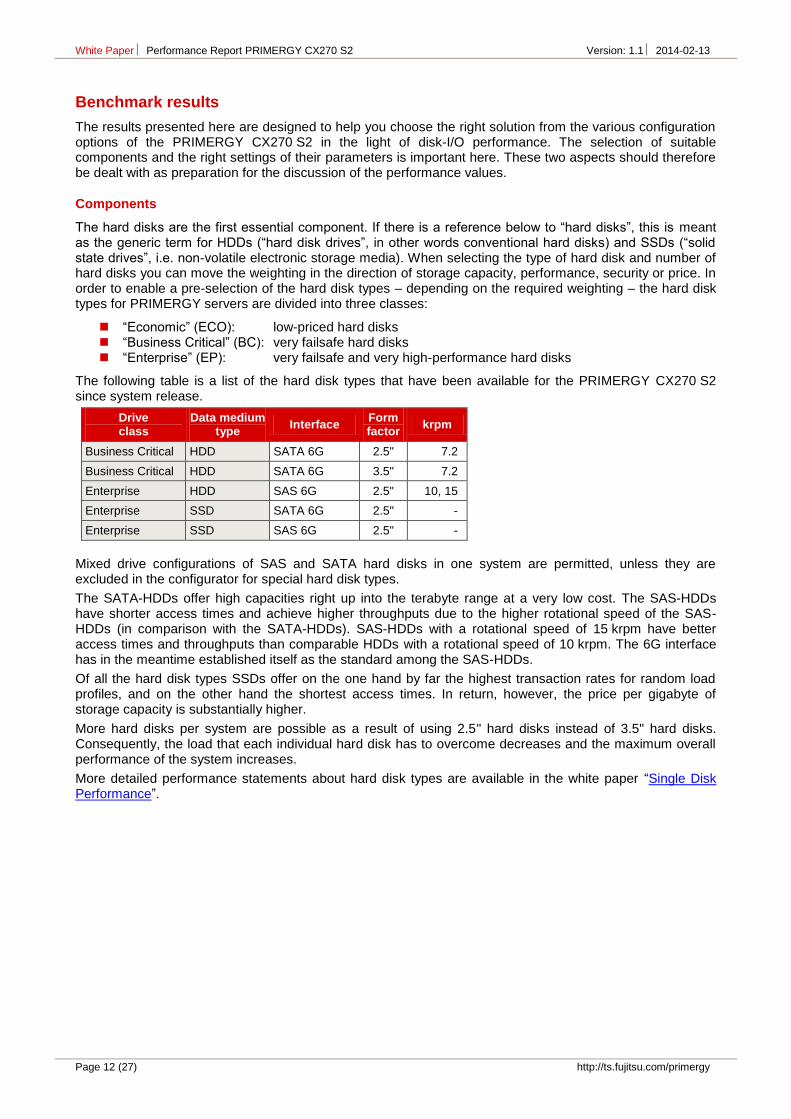
Components
The hard disks are the first essential component. If there is a reference below to “hard disks”, this is meant as the generic term for HDDs (“hard disk drives”, in other words conventional hard disks) and SSDs (“solid state drives”, i.e. non-volatile electronic storage media). When selecting the type of hard disk and number of hard disks you can move the weighting in the direction of storage capacity, performance, security or price. In order to enable a pre-selection of the hard disk types – depending on the required weighting – the hard disk types for PRIMERGY servers are divided into three classes:
“Economic” (ECO): low-priced hard disks “Business Critical” (BC): very failsafe hard disks “Enterprise” (EP): very failsafe and very high-performance hard disks
The following table is a list of the hard disk types that have been available for the PRIMERGY CX270 S2 since system release.
Drive class
Data medium type
Interface Form factor
krpm
Business Critical HDD SATA 6G 2.5" 7.2
Business Critical HDD SATA 6G 3.5" 7.2
Enterprise HDD SAS 6G 2.5" 10, 15
Enterprise SSD SATA 6G 2.5" -
Enterprise SSD SAS 6G 2.5" -
Mixed drive configurations of SAS and SATA hard disks in one system are permitted, unless they are excluded in the configurator for special hard disk types.
The SATA-HDDs offer high capacities right up into the terabyte range at a very low cost. The SAS-HDDs have shorter access times and achieve higher throughputs due to the higher rotational speed of the SAS-HDDs (in comparison with the SATA-HDDs). SAS-HDDs with a rotational speed of 15 krpm have better access times and throughputs than comparable HDDs with a rotational speed of 10 krpm. The 6G interface has in the meantime established itself as the standard among the SAS-HDDs.
Of all the hard disk types SSDs offer on the one hand by far the highest transaction rates for random load profiles, and on the other hand the shortest access times. In return, however, the price per gigabyte of storage capacity is substantially higher.
More hard disks per system are possible as a result of using 2.5" hard disks instead of 3.5" hard disks. Consequently, the load that each individual hard disk has to overcome decreases and the maximum overall performance of the system increases.
More detailed performance statements about hard disk types are available in the white paper “Single Disk Performance”.

White Paper Performance Report PRIMERGY CX270 S2 Version: 1.1 2014-02-13
http://ts.fujitsu.com/primergy Page 13 (27)
The maximum number of hard disks in the system depends on the system configuration. The following table lists the essential cases.
Form factor
Interface Connection
type Number of PCIe
controllers Maximum number
of hard disks
2.5" SATA 3G direct 0 4
3.5" SATA 3G direct 0 3
2.5" SATA 6G, SAS 6G direct 1 4
3.5" SATA 6G, SAS 6G direct 1 3
After the hard disks the RAID controller is the second performance-determining key component. In the case of these controllers the “modular RAID” concept of the PRIMERGY servers offers a plethora of options to meet the various requirements of a wide range of different application scenarios.
The following table summarizes the most important features of the available RAID controllers of the PRIMERGY CX270 S2. A short alias is specified here for each controller, which is used in the subsequent list of the performance values.
Controller name Alias Cache Supported interfaces
Max. # disks in the system
RAID levels in the system
BBU/ FBU
LSI SW RAID on Intel C600 (Onboard SATA)
Patsburg A - SATA 3G - 4 × 2.5" 0, 1, 10 -/-
RAID Ctrl SAS 6G 0/1 (D2607)
LSI2008 - SATA 3G/6G SAS 3G/6G
PCIe 2.0 x8
4 × 2.5" 3 × 3.5"
0, 1, 1E, 10 -/-
RAID Ctrl SAS 6G 5/6 512MB (D2616)
LSI2108 512 MB SATA 3G/6G SAS 3G/6G
PCIe 2.0 x8
4 × 2.5" 3 × 3.5"
0, 1, 5, 6, 10, 50, 60
/-
The onboard RAID controller is implemented in the chipset Intel C600 on the motherboard of the server and uses the CPU of the server for the RAID functionality. This controller is a simple solution that does not require a PCIe slot.
System-specific interfaces
The interfaces of a controller to the motherboard and to the hard disks have in each case specific limits for data throughput. These limits are listed in the following table. The minimum of these two values is a definite limit, which cannot be exceeded. This value is highlighted in bold in the following table.
Controller alias
Effective in the configuration Connection via expander # Disk
channels Limit for throughput of disk interface
PCIe version
PCIe width
Limit for throughput of PCIe interface
Patsburg A 4 × SATA 3G 973 MB/s - - - -
LSI2008 4 × SAS 6G 1945 MB/s 2.0 x8 3433 MB/s -
LSI2108 4 × SAS 6G 1945 MB/s 2.0 x8 3433 MB/s -
More details about the RAID controllers of the PRIMERGY systems are available in the white paper “RAID Controller Performance”.

White Paper Performance Report PRIMERGY CX270 S2 Version: 1.1 2014-02-13
Page 14 (27) http://ts.fujitsu.com/primergy
Settings
In most cases, the cache of the hard disks has a great influence on disk-I/O performance. This is particular valid for HDDs. It is frequently regarded as a security problem in case of power failure and is thus switched off. On the other hand, it was integrated by hard disk manufacturers for the good reason of increasing the write performance. For performance reasons it is therefore advisable to enable the hard disk cache. This is particular valid for SATA-HDDs. The performance can as a result increase more than tenfold for specific access patterns and hard disk types. More information about the performance impact of the hard disk cache is available in the document “Single Disk Performance”. To prevent data loss in case of power failure you are recommended to equip the system with a UPS.
In the case of controllers with a cache there are several parameters that can be set. The optimal settings can depend on the RAID level, the application scenario and the type of data medium. In the case of RAID levels 5 and 6 in particular (and the more complex RAID level combinations 50 and 60) it is obligatory to enable the controller cache for application scenarios with write share. If the controller cache is enabled, the data temporarily stored in the cache should be safeguarded against loss in case of power failure. Suitable accessories are available for this purpose (e.g. a BBU or FBU).
For the purpose of easy and reliable handling of the settings for RAID controllers and hard disks it is advisable to use the RAID-Manager software “ServerView RAID” that is supplied for PRIMERGY servers. All the cache settings for controllers and hard disks can usually be made en bloc – specifically for the application – by using the pre-defined modi “Performance” or “Data Protection”. The “Performance” mode ensures the best possible performance settings for the majority of the application scenarios.
More information about the setting options of the controller cache is available in the white paper “RAID Controller Performance”.
Performance values
In general, disk-I/O performance of a RAID array depends on the type and number of hard disks, on the RAID level and on the RAID controller. If the limits of the system-specific interfaces are not exceeded, the statements on disk-I/O performance are therefore valid for all PRIMERGY systems. This is why all the performance statements of the document “RAID Controller Performance” also apply for the PRIMERGY CX270 S2 if the configurations measured there are also supported by this system.
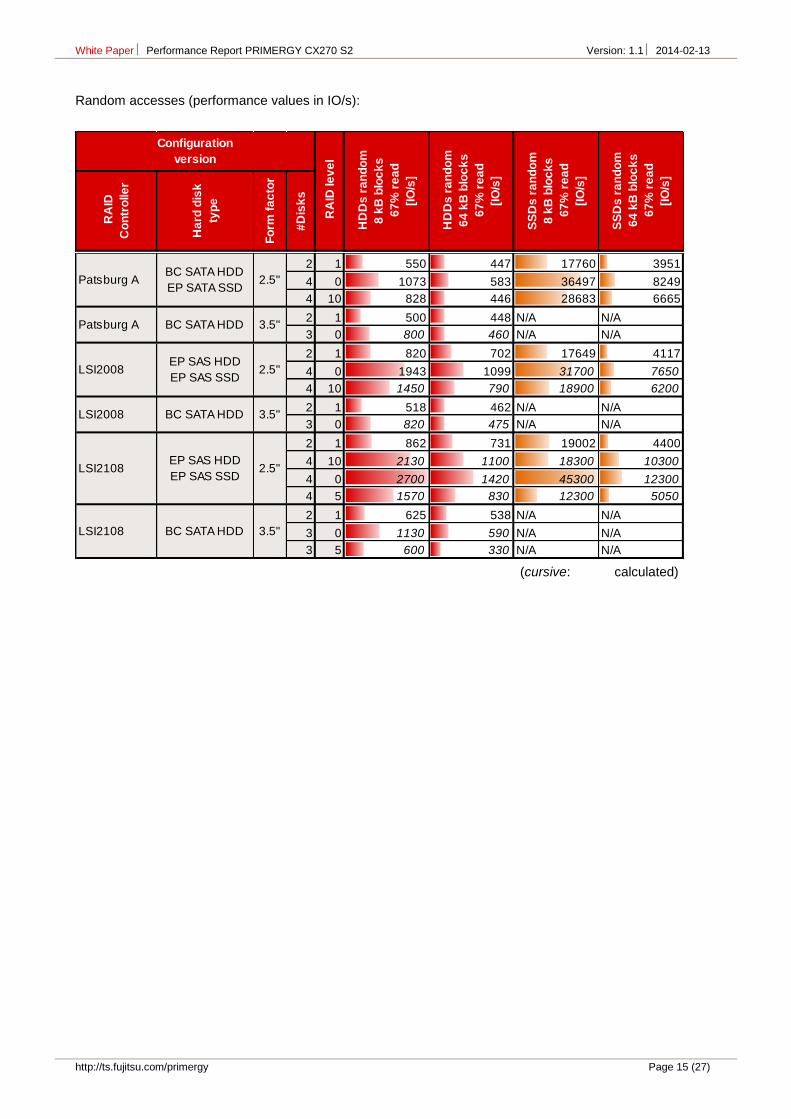
The performance values of the PRIMERGY CX270 S2 are listed in table form below, specifically for different RAID levels, access types and block sizes. Substantially different configuration versions are dealt with separately.
The performance values in the following tables use the established measurement variables, as already mentioned in the subsection Benchmark description. Thus, transaction rate is specified for random accesses and data throughput for sequential accesses. To avoid any confusion among the measurement units the tables have been separated for the two access types.
The table cells contain the maximum achievable values. This has three implications: On the one hand hard disks with optimal performance were used (the components used are described in more detail in the subsection Benchmark environment). Furthermore, cache settings of controllers and hard disks, which are optimal for the respective access scenario and the RAID level, are used as a basis. And ultimately each value is the maximum value for the entire load intensity range (# of outstanding I/Os).
In order to also visualize the numerical values each table cell is highlighted with a horizontal bar, the length of which is proportional to the numerical value in the table cell. All bars shown in the same scale of length have the same color. In other words, a visual comparison only makes sense for table cells with the same colored bars.
Since the horizontal bars in the table cells depict the maximum achievable performance values, they are shown by the color getting lighter as you move from left to right. The light shade of color at the right end of the bar tells you that the value is a maximum value and can only be achieved under optimal prerequisites. The darker the shade becomes as you move to the left, the more frequently it will be possible to achieve the corresponding value in practice.
White Paper Performance Report PRIMERGY CX270 S2 Version: 1.1 2014-02-13
http://ts.fujitsu.com/primergy Page 15 (27)
Random accesses (performance values in IO/s):
(cursive: calculated)
RA
ID
Co
ntr
olle
r
Ha
rd d
isk
typ
e
Fo
rm f
ac
tor
#D
isk
s
SS
Ds
ra
nd
om
64
kB
blo
ck
s
67
% r
ea
d
[IO
/s]
Configuration
version
RA
ID le
ve
l
HD
Ds
ra
nd
om
8 k
B b
loc
ks
67
% r
ea
d
[IO
/s]
HD
Ds
ra
nd
om
64
kB
blo
ck
s
67
% r
ea
d
[IO
/s]
SS
Ds
ra
nd
om
8 k
B b
loc
ks
67
% r
ea
d
[IO
/s]
2 1 550 447 17760 3951
4 0 1073 583 36497 8249
4 10 828 446 28683 6665
2 1 500 448 N/A N/A
3 0 800 460 N/A N/A
2 1 820 702 17649 4117
4 0 1943 1099 31700 7650
4 10 1450 790 18900 6200
2 1 518 462 N/A N/A
3 0 820 475 N/A N/A
2 1 862 731 19002 4400
4 10 2130 1100 18300 10300
4 0 2700 1420 45300 12300
4 5 1570 830 12300 5050
2 1 625 538 N/A N/A
3 0 1130 590 N/A N/A
3 5 600 330 N/A N/A
LSI2008 BC SATA HDD 3.5"
LSI2108EP SAS HDD
EP SAS SSD2.5"
LSI2108 BC SATA HDD 3.5"
LSI2008EP SAS HDD
EP SAS SSD2.5"
Patsburg ABC SATA HDD
EP SATA SSD2.5"
Patsburg A BC SATA HDD 3.5"

White Paper Performance Report PRIMERGY CX270 S2 Version: 1.1 2014-02-13
Page 16 (27) http://ts.fujitsu.com/primergy
Sequential accesses (performance values in MB/s):
(cursive: calculated)
The use of one controller at its maximum configuration with powerful hard disks (configured as RAID 0) enables the PRIMERGY CX270 S2 to achieve a throughput of up to 1260 MB/s for sequential load profiles and a transaction rate of up to 45300 IO/s for typical, random application scenarios.
RA
ID
Co
ntr
olle
r
Ha
rd d
isk
typ
e
Fo
rm f
ac
tor
#D
isk
s
Configuration
version
RA
ID le
ve
l
HD
Ds
se
qu
en
tia
l
64
kB
blo
ck
s
10
0%
re
ad
[MB
/s]
HD
Ds
se
qu
en
tia
l
64
kB
blo
ck
s
10
0%
wri
te
[MB
/s]
SS
Ds
se
qu
en
tia
l
64
kB
blo
ck
s
10
0%
re
ad
[MB
/s]
SS
Ds
se
qu
en
tia
l
64
kB
blo
ck
s
10
0%
wri
te
[MB
/s]
2 1 112 108 506 175
4 0 422 419 946 718
4 10 226 213 662 338
2 1 160 153 N/A N/A
3 0 440 440 N/A N/A
2 1 287 190 338 199
4 0 490 490 1260 780
4 10 400 240 650 320
2 1 180 153 N/A N/A
3 0 440 440 N/A N/A
2 1 371 192 680 176
4 10 520 380 1000 430
4 0 780 680 1240 790
4 5 560 580 990 610
2 1 277 154 N/A N/A
3 0 440 440 N/A N/A
3 5 290 290 N/A N/A
LSI2108 BC SATA HDD 3.5"
LSI2108EP SAS HDD
EP SAS SSD2.5"
LSI2008 BC SATA HDD 3.5"
Patsburg ABC SATA HDD
EP SATA SSD2.5"
LSI2008
Patsburg A 3.5"BC SATA HDD
EP SAS HDD
EP SAS SSD2.5"

White Paper Performance Report PRIMERGY CX270 S2 Version: 1.1 2014-02-13
http://ts.fujitsu.com/primergy Page 17 (27)
STREAM
Benchmark description
STREAM is a synthetic benchmark that has been used for many years to determine memory throughput and which was developed by John McCalpin during his professorship at the University of Delaware. Today STREAM is supported at the University of Virginia, where the source code can be downloaded in either Fortran or C. STREAM continues to play an important role in the HPC environment in particular. It is for example an integral part of the HPC Challenge benchmark suite.
The benchmark is designed in such a way that it can be used both on PCs and on server systems. The unit of measurement of the benchmark is GB/s, i.e. the number of gigabytes that can be read and written per second.
STREAM measures the memory throughput for sequential accesses. These can generally be performed more efficiently than accesses that are randomly distributed on the memory, because the CPU caches are used for sequential access.
Before execution the source code is adapted to the environment to be measured. Therefore, the size of the data area must be at least four times larger than the total of all CPU caches so that these have as little influence as possible on the result. The OpenMP program library is used to enable selected parts of the program to be executed in parallel during the runtime of the benchmark, consequently achieving optimal load distribution to the available processor cores.
During implementation the defined data area, consisting of 8-byte elements, is successively copied to four types, and arithmetic calculations are also performed to some extent.
Type Execution Bytes per step Floating-point calculation per step
COPY a(i) = b(i) 16 0
SCALE a(i) = q × b(i) 16 1
SUM a(i) = b(i) + c(i) 24 1
TRIAD a(i) = b(i) + q × c(i) 24 2
The throughput is output in GB/s for each type of calculation. The differences between the various values are usually only minor on modern systems. In general, only the determined TRIAD value is used as a comparison.
The measured results primarily depend on the clock frequency of the memory modules; the CPUs influence the arithmetic calculations. The accuracy of the results is approximately 5%.
This chapter specifies throughputs on a basis of 10 (1 GB/s = 109 Byte/s).
Benchmark environment
System Under Test (SUT)
Hardware
Enclosure PRIMERGY CX400 S2
Model PRIMERGY CX270 S2
Processor 2 processors of Xeon E5-2600 v2 processor series
Memory 16 × 16GB (1x16GB) 2Rx4 DDR3-1866 R ECC
Software
BIOS settings Processors other than Xeon E5-2603 v2, E5-2609 v2: Hyper-Threading = Disabled
Operating system Red Hat Enterprise Linux Server release 6.4
Operating system settings
echo never > /sys/kernel/mm/redhat_transparent_hugepage/enabled
Compiler Intel C Compiler 12.1
Benchmark Stream.c Version 5.9
Some components may not be available in all countries or sales regions.
White Paper Performance Report PRIMERGY CX270 S2 Version: 1.1 2014-02-13
Page 18 (27) http://ts.fujitsu.com/primergy
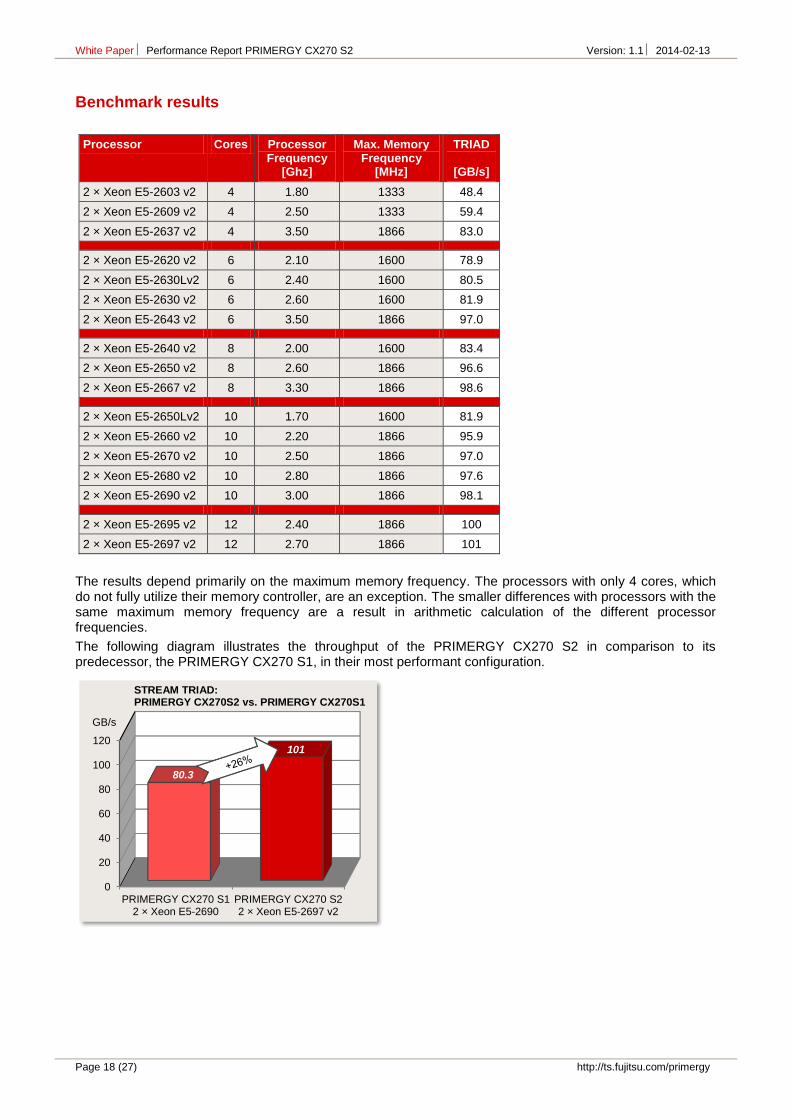
Benchmark results
Processor Cores Processor Frequency
[Ghz]
Max. Memory Frequency
[MHz]
TRIAD
[GB/s]
2 × Xeon E5-2603 v2 4 1.80 1333 48.4
2 × Xeon E5-2609 v2 4 2.50 1333 59.4
2 × Xeon E5-2637 v2 4 3.50 1866 83.0
2 × Xeon E5-2620 v2 6 2.10 1600 78.9
2 × Xeon E5-2630Lv2 6 2.40 1600 80.5
2 × Xeon E5-2630 v2 6 2.60 1600 81.9
2 × Xeon E5-2643 v2 6 3.50 1866 97.0
2 × Xeon E5-2640 v2 8 2.00 1600 83.4
2 × Xeon E5-2650 v2 8 2.60 1866 96.6
2 × Xeon E5-2667 v2 8 3.30 1866 98.6
2 × Xeon E5-2650Lv2 10 1.70 1600 81.9
2 × Xeon E5-2660 v2 10 2.20 1866 95.9
2 × Xeon E5-2670 v2 10 2.50 1866 97.0
2 × Xeon E5-2680 v2 10 2.80 1866 97.6
2 × Xeon E5-2690 v2 10 3.00 1866 98.1
2 × Xeon E5-2695 v2 12 2.40 1866 100
2 × Xeon E5-2697 v2 12 2.70 1866 101
The results depend primarily on the maximum memory frequency. The processors with only 4 cores, which do not fully utilize their memory controller, are an exception. The smaller differences with processors with the same maximum memory frequency are a result in arithmetic calculation of the different processor frequencies.
The following diagram illustrates the throughput of the PRIMERGY CX270 S2 in comparison to its predecessor, the PRIMERGY CX270 S1, in their most performant configuration.
0
20
40
60
80
100
120
PRIMERGY CX270 S12 × Xeon E5-2690
PRIMERGY CX270 S22 × Xeon E5-2697 v2
80.3
101
GB/s
STREAM TRIAD: PRIMERGY CX270S2 vs. PRIMERGY CX270S1

White Paper Performance Report PRIMERGY CX270 S2 Version: 1.1 2014-02-13
http://ts.fujitsu.com/primergy Page 19 (27)
LINPACK
Benchmark description
LINPACK was developed in the 1970s by Jack Dongarra and some other people to show the performance of supercomputers. The benchmark consists of a collection of library functions for the analysis and solution of linear system of equations. A description can be found in the document http://www.netlib.org/utk/people/JackDongarra/PAPERS/hplpaper.pdf.
LINPACK can be used to measure the speed of computers when solving a linear equation system. For this purpose, an n × n matrix is set up and filled with random numbers between -2 and +2. The calculation is then performed via LU decomposition with partial pivoting.
A memory of 8n² bytes is required for the matrix. In case of an n × n matrix the number of arithmetic operations required for the solution is
2/3n
3 + 2n
2. Thus, the choice of n determines the duration of the
measurement: a doubling of n results in an approximately eight-fold increase in the duration of the measurement. The size of n also has an influence on the measurement result itself: as n increases, the measured value asymptotically approaches a limit. The size of the matrix is therefore usually adapted to the amount of memory available. Furthermore, the memory bandwidth of the system only plays a minor role for the measurement result, but a role that cannot be fully ignored. The processor performance is the decisive factor for the measurement result. Since the algorithm used permits parallel processing, in particular the number of processors used and their processor cores are - in addition to the clock rate - of outstanding significance.
LINPACK is used to measure how many floating point operations were carried out per second. The result is referred to as Rmax and specified in GFlops (Giga Floating Point Operations per Second).
An upper limit, referred to as Rpeak, for the speed of a computer can be calculated from the maximum number of floating point operations that its processor cores could theoretically carry out in one clock cycle:
Rpeak = Maximum number of floating point operations per clock cycle × Number of processor cores of the computer × Maximum processor frequency[GHz]
LINPACK is classed as one of the leading benchmarks in the field of high performance computing (HPC). LINPACK is one of the seven benchmarks currently included in the HPC Challenge benchmark suite, which takes other performance aspects in the HPC environment into account.
Manufacturer-independent publication of LINPACK results is possible at http://www.top500.org/. The use of a LINPACK version based on HPL is prerequisite for this (see: http://www.netlib.org/benchmark/hpl).
Intel offers a highly optimized LINPACK version (shared memory version) for individual systems with Intel processors. Parallel processes communicate here via "shared memory", i.e. jointly used memory. Another version provided by Intel is based on HPL (High Performance Linpack). Intercommunication of the LINPACK processes here takes place via OpenMP and MPI (Message Passing Interface). This enables communication between the parallel processes - also from one computer to another. Both versions can be downloaded from http://software.intel.com/en-us/articles/intel-math-kernel-library-linpack-download/.
Manufacturer-specific LINPACK versions also come into play when graphics cards for General Purpose Computation on Graphics Processing Unit (GPGPU) are used. These are based on HPL and include extensions which are needed for communication with the graphics cards.
White Paper Performance Report PRIMERGY CX270 S2 Version: 1.1 2014-02-13
Page 20 (27) http://ts.fujitsu.com/primergy
Benchmark environment
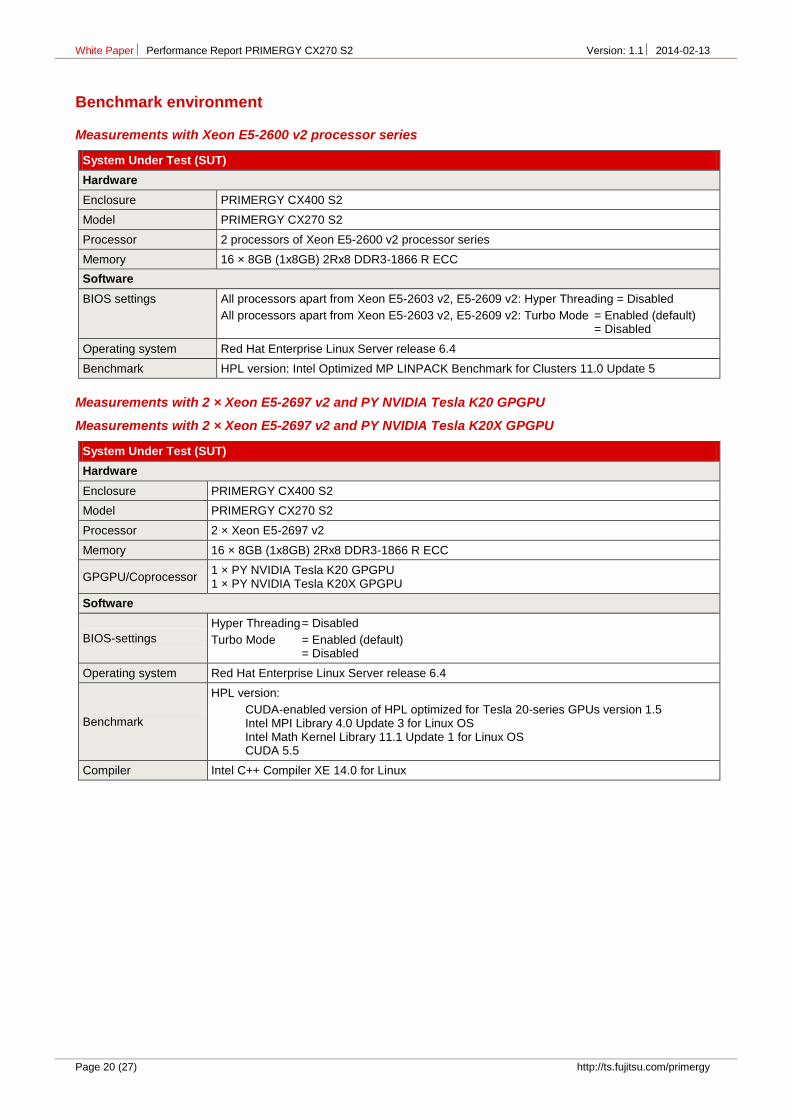
Measurements with Xeon E5-2600 v2 processor series
System Under Test (SUT)
Hardware
Enclosure PRIMERGY CX400 S2
Model PRIMERGY CX270 S2
Processor 2 processors of Xeon E5-2600 v2 processor series
Memory 16 × 8GB (1x8GB) 2Rx8 DDR3-1866 R ECC
Software
BIOS settings All processors apart from Xeon E5-2603 v2, E5-2609 v2: Hyper Threading = Disabled
All processors apart from Xeon E5-2603 v2, E5-2609 v2: Turbo Mode = Enabled (default) = Disabled
Operating system Red Hat Enterprise Linux Server release 6.4
Benchmark HPL version: Intel Optimized MP LINPACK Benchmark for Clusters 11.0 Update 5
Measurements with 2 × Xeon E5-2697 v2 and PY NVIDIA Tesla K20 GPGPU
Measurements with 2 × Xeon E5-2697 v2 and PY NVIDIA Tesla K20X GPGPU
System Under Test (SUT)
Hardware
Enclosure PRIMERGY CX400 S2
Model PRIMERGY CX270 S2
Processor 2 × Xeon E5-2697 v2
Memory 16 × 8GB (1x8GB) 2Rx8 DDR3-1866 R ECC
GPGPU/Coprocessor 1 × PY NVIDIA Tesla K20 GPGPU 1 × PY NVIDIA Tesla K20X GPGPU
Software
BIOS-settings
Hyper Threading = Disabled
Turbo Mode = Enabled (default) = Disabled
Operating system Red Hat Enterprise Linux Server release 6.4
Benchmark
HPL version:
CUDA-enabled version of HPL optimized for Tesla 20-series GPUs version 1.5 Intel MPI Library 4.0 Update 3 for Linux OS Intel Math Kernel Library 11.1 Update 1 for Linux OS CUDA 5.5
Compiler Intel C++ Compiler XE 14.0 for Linux
SPECcpu2006: floating-point performance PRIMERGY TX200 S6 vs. predecessor
White Paper Performance Report PRIMERGY CX270 S2 Version: 1.1 2014-02-13
http://ts.fujitsu.com/primergy Page 21 (27)
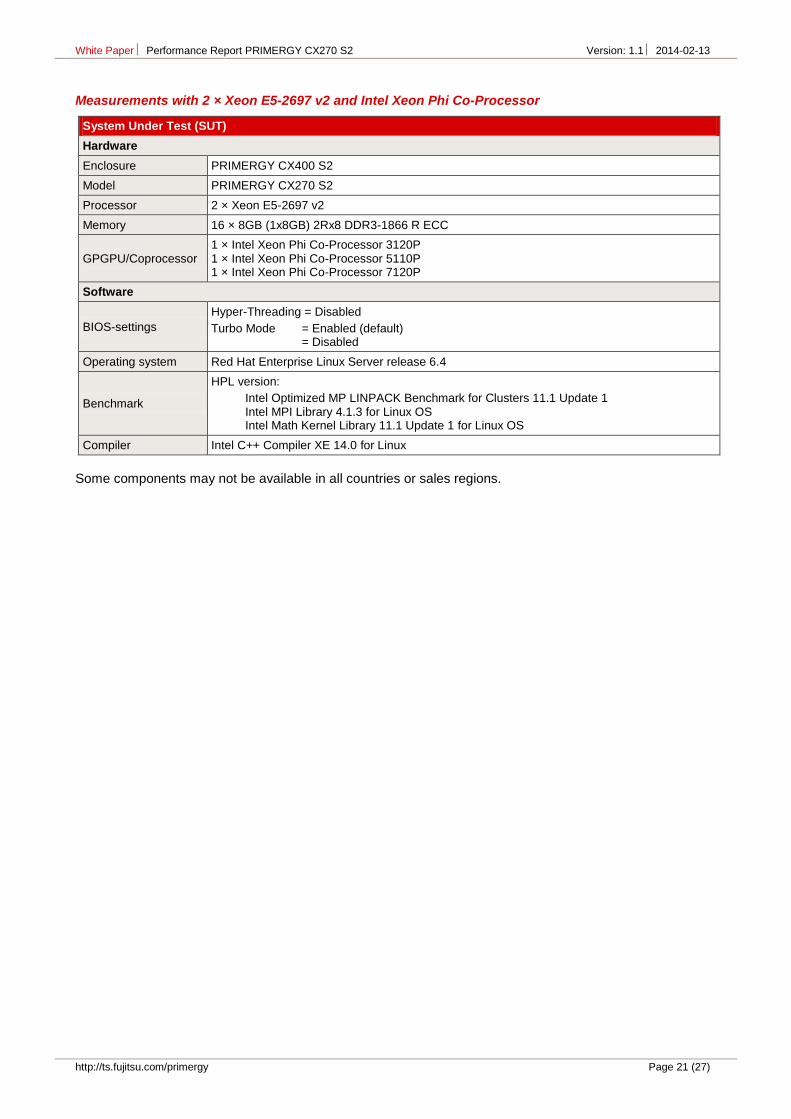
Measurements with 2 × Xeon E5-2697 v2 and Intel Xeon Phi Co-Processor
System Under Test (SUT)
Hardware
Enclosure PRIMERGY CX400 S2
Model PRIMERGY CX270 S2
Processor 2 × Xeon E5-2697 v2
Memory 16 × 8GB (1x8GB) 2Rx8 DDR3-1866 R ECC
GPGPU/Coprocessor 1 × Intel Xeon Phi Co-Processor 3120P 1 × Intel Xeon Phi Co-Processor 5110P 1 × Intel Xeon Phi Co-Processor 7120P
Software
BIOS-settings
Hyper-Threading = Disabled
Turbo Mode = Enabled (default) = Disabled
Operating system Red Hat Enterprise Linux Server release 6.4
Benchmark
HPL version:
Intel Optimized MP LINPACK Benchmark for Clusters 11.1 Update 1 Intel MPI Library 4.1.3 for Linux OS Intel Math Kernel Library 11.1 Update 1 for Linux OS
Compiler Intel C++ Compiler XE 14.0 for Linux
Some components may not be available in all countries or sales regions.

White Paper Performance Report PRIMERGY CX270 S2 Version: 1.1 2014-02-13
Page 22 (27) http://ts.fujitsu.com/primergy
Benchmark results
Measurements with Xeon E5-2600 processor series P
roc
es
so
r
Co
res
Pro
ce
ss
or
freq
ue
nc
y [
Gh
z]
Ma
xim
um
tu
rbo
fre
qu
en
cy
at
full
lo
ad
[G
hz]
Nu
mb
er
of
pro
ce
sso
rs
Without Turbo Mode With Turbo Mode
Rpeak [GFlops]
Rmax [GFlops]
Rpeak [GFlops]
Rmax [GFlops]
Xeon E5-2603 v2 4 1.80 n/a 2 115 110
Xeon E5-2609 v2 4 2.50 n/a 2 160 152
Xeon E5-2637 v2 4 3.50 3.60 2 224 213 230 220
Xeon E5-2620 v2 6 2.10 2.40 2 202 192 230 219
Xeon E5-2630Lv2 6 2.40 2.60 2 230 219 250 238
Xeon E5-2630 v2 6 2.60 2.90 2 250 238 278 265
Xeon E5-2643 v2 6 3.50 3.60 2 336 320 346 329
Xeon E5-2640 v2 8 2.00 2.30 2 256 244 294 280
Xeon E5-2650 v2 8 2.60 3.00 2 333 317 384 363
Xeon E5-2667 v2 8 3.30 3.60 2 422 402 461 422
Xeon E5-2650Lv2 10 1.70 1.90 2 272 259 304 289
Xeon E5-2660 v2 10 2.20 2.60 2 352 335 416 396
Xeon E5-2670 v2 10 2.50 2.90 2 400 380 464 426
Xeon E5-2680 v2 10 2.80 3.10 2 448 426 496 459
Xeon E5-2690 v2 10 3.00 3.30 2 480 456 528 487
Xeon E5-2695 v2 12 2.40 2.80 2 461 436 538 491
Xeon E5-2697 v2 12 2.70 3.00 2 518 492 576 530
Rmax = Measurement result
Rpeak = Maximum number of floating point operations per clock cycle × Number of processor cores of the computer × Maximum processor frequency[GHz]
The following applies for processors without Turbo mode and for those with Turbo mode disabled:
Maximum processor frequency[GHz] = Nominal processor frequency[GHz]
Processors with Turbo mode enabled are not limited by the nominal processor frequency and therefore do not provide a constant processor frequency. Instead the actual processor frequency swings - depending on temperature and power consumption - between the nominal processor frequency and maximum turbo frequency at full load. Therefore, the following applies for these processors:
Maximum processor frequency[GHz] = Maximum turbo frequency at full load[GHz]
White Paper Performance Report PRIMERGY CX270 S2 Version: 1.1 2014-02-13
http://ts.fujitsu.com/primergy Page 23 (27)
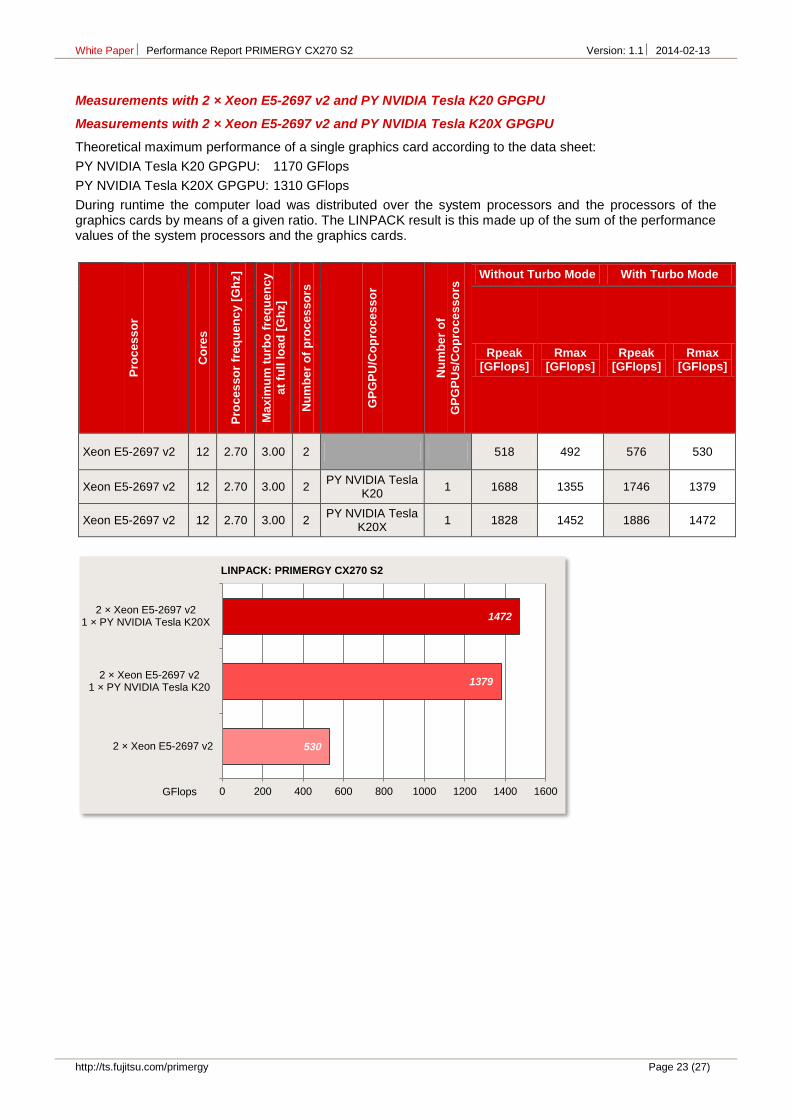
Measurements with 2 × Xeon E5-2697 v2 and PY NVIDIA Tesla K20 GPGPU
Measurements with 2 × Xeon E5-2697 v2 and PY NVIDIA Tesla K20X GPGPU
Theoretical maximum performance of a single graphics card according to the data sheet:
PY NVIDIA Tesla K20 GPGPU: 1170 GFlops
PY NVIDIA Tesla K20X GPGPU: 1310 GFlops
During runtime the computer load was distributed over the system processors and the processors of the graphics cards by means of a given ratio. The LINPACK result is this made up of the sum of the performance values of the system processors and the graphics cards.
Pro
ce
ss
or
Co
res
Pro
ce
ss
or
freq
ue
nc
y [
Gh
z]
Ma
xim
um
tu
rbo
fre
qu
en
cy
at
full
lo
ad
[G
hz]
Nu
mb
er
of
pro
ce
sso
rs
GP
GP
U/C
op
roc
es
so
r
Nu
mb
er
of
GP
GP
Us
/Co
pro
ce
ss
ors
Without Turbo Mode With Turbo Mode
Rpeak [GFlops]
Rmax [GFlops]
Rpeak [GFlops]
Rmax [GFlops]
Xeon E5-2697 v2 12 2.70 3.00 2 518 492 576 530
Xeon E5-2697 v2 12 2.70 3.00 2 PY NVIDIA Tesla
K20 1 1688 1355 1746 1379
Xeon E5-2697 v2 12 2.70 3.00 2 PY NVIDIA Tesla
K20X 1 1828 1452 1886 1472
530
1379
1472
0 200 400 600 800 1000 1200 1400 1600
2 × Xeon E5-2697 v2
2 × Xeon E5-2697 v21 × PY NVIDIA Tesla K20
2 × Xeon E5-2697 v21 × PY NVIDIA Tesla K20X
GFlops
LINPACK: PRIMERGY CX270 S2
White Paper Performance Report PRIMERGY CX270 S2 Version: 1.1 2014-02-13
Page 24 (27) http://ts.fujitsu.com/primergy
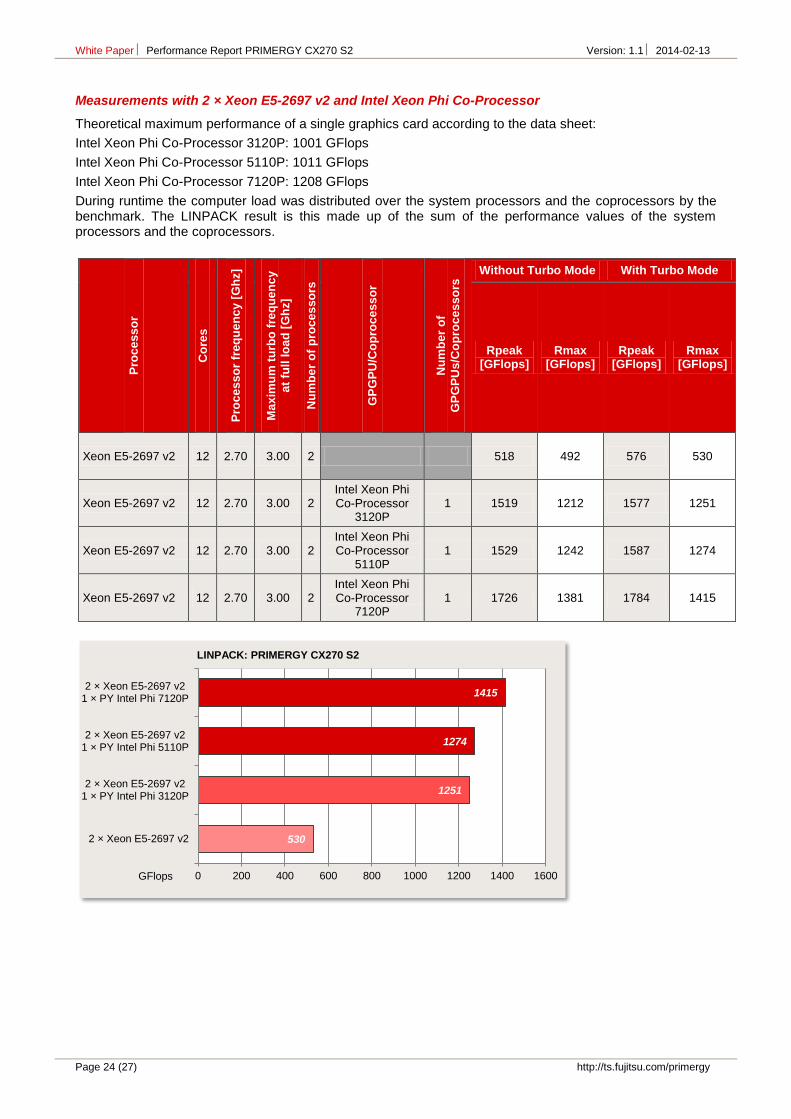
Measurements with 2 × Xeon E5-2697 v2 and Intel Xeon Phi Co-Processor
Theoretical maximum performance of a single graphics card according to the data sheet:
Intel Xeon Phi Co-Processor 3120P: 1001 GFlops
Intel Xeon Phi Co-Processor 5110P: 1011 GFlops
Intel Xeon Phi Co-Processor 7120P: 1208 GFlops
During runtime the computer load was distributed over the system processors and the coprocessors by the benchmark. The LINPACK result is this made up of the sum of the performance values of the system processors and the coprocessors.
Pro
ce
ss
or
Co
res
Pro
ce
ss
or
freq
ue
nc
y [
Gh
z]
Ma
xim
um
tu
rbo
fre
qu
en
cy
at
full
lo
ad
[G
hz]
Nu
mb
er
of
pro
ce
sso
rs
GP
GP
U/C
op
roc
es
so
r
Nu
mb
er
of
GP
GP
Us
/Co
pro
ce
ss
ors
Without Turbo Mode With Turbo Mode
Rpeak [GFlops]
Rmax [GFlops]
Rpeak [GFlops]
Rmax [GFlops]
Xeon E5-2697 v2 12 2.70 3.00 2 518 492 576 530
Xeon E5-2697 v2 12 2.70 3.00 2 Intel Xeon Phi Co-Processor
3120P 1 1519 1212 1577 1251
Xeon E5-2697 v2 12 2.70 3.00 2 Intel Xeon Phi Co-Processor
5110P 1 1529 1242 1587 1274
Xeon E5-2697 v2 12 2.70 3.00 2 Intel Xeon Phi Co-Processor
7120P 1 1726 1381 1784 1415
530
1251
1274
1415
0 200 400 600 800 1000 1200 1400 1600
2 × Xeon E5-2697 v2
2 × Xeon E5-2697 v21 × PY Intel Phi 3120P
2 × Xeon E5-2697 v21 × PY Intel Phi 5110P
2 × Xeon E5-2697 v21 × PY Intel Phi 7120P
GFlops
LINPACK: PRIMERGY CX270 S2
White Paper Performance Report PRIMERGY CX270 S2 Version: 1.1 2014-02-13
http://ts.fujitsu.com/primergy Page 25 (27)
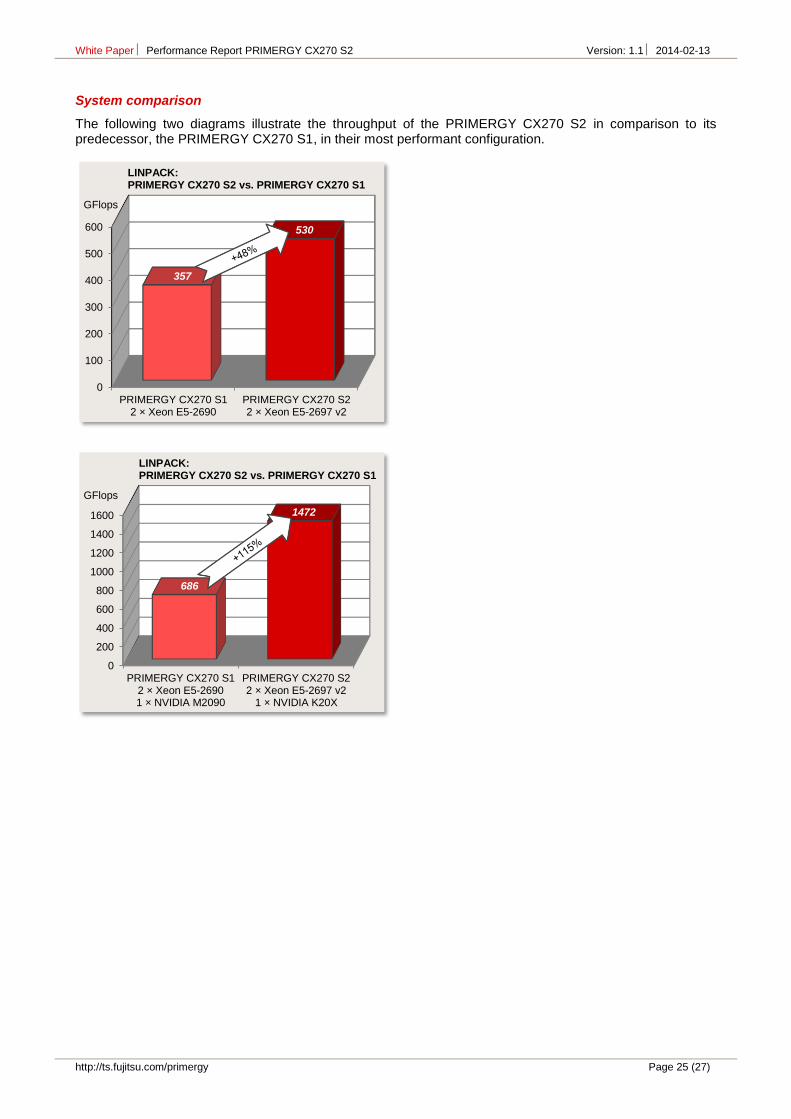
System comparison
The following two diagrams illustrate the throughput of the PRIMERGY CX270 S2 in comparison to its predecessor, the PRIMERGY CX270 S1, in their most performant configuration.
0
200
400
600
800
1000
1200
1400
1600
PRIMERGY CX270 S12 × Xeon E5-26901 × NVIDIA M2090
PRIMERGY CX270 S22 × Xeon E5-2697 v2
1 × NVIDIA K20X
686
1472
GFlops
0
100
200
300
400
500
600
PRIMERGY CX270 S12 × Xeon E5-2690
PRIMERGY CX270 S22 × Xeon E5-2697 v2
357
530
GFlops
LINPACK: PRIMERGY CX270 S2 vs. PRIMERGY CX270 S1
LINPACK: PRIMERGY CX270 S2 vs. PRIMERGY CX270 S1

White Paper Performance Report PRIMERGY CX270 S2 Version: 1.1 2014-02-13
Page 26 (27) http://ts.fujitsu.com/primergy
Literature
PRIMERGY Systems
http://primergy.com/
PRIMERGY CX270 S2
This White Paper: http://docs.ts.fujitsu.com/dl.aspx?id=cb75e451-a6c8-41e3-afe0-f81956ec1ed1 http://docs.ts.fujitsu.com/dl.aspx?id=38b02180-dd8e-4eb3-9d69-3d30529f8734 http://docs.ts.fujitsu.com/dl.aspx?id=94f06654-9c38-4575-b3b6-3ef88bb6124e
Data sheet http://docs.ts.fujitsu.com/dl.aspx?id=b2baf2e0-6b18-4d0a-8293-cfcdeba76850
BIOS optimizations for Xeon E5-2600 v2 based systems http://docs.ts.fujitsu.com/dl.aspx?id=84dc1adf-adb8-419f-8d08-b226eb077e46
Memory performance of Xeon E5-2600 v2 (Ivy Bridge-EP)-based systems http://docs.ts.fujitsu.com/dl.aspx?id=a344b05e-2e9d-481b-8c9b-c6542defd839
PRIMERGY Performance
http://www.fujitsu.com/fts/products/computing/servers/primergy/benchmarks/
Disk I/O
Basics of Disk I/O Performance http://docs.ts.fujitsu.com/dl.aspx?id=65781a00-556f-4a98-90a7-7022feacc602
Single Disk Performance http://docs.ts.fujitsu.com/dl.aspx?id=0e30cb69-44db-4cd5-92a7-d38bacec6a99
RAID Controller Performance http://docs.ts.fujitsu.com/dl.aspx?id=e2489893-cab7-44f6-bff2-7aeea97c5aef
Information about Iometer http://www.iometer.org
LINPACK
The LINPACK Benchmark: Past, Present, and Future http://www.netlib.org/utk/people/JackDongarra/PAPERS/hplpaper.pdf.
TOP500 http://www.top500.org/
HPL - A Portable Implementation of the High-Performance Linpack Benchmark for Distributed-Memory Computers http://www.netlib.org/benchmark/hpl
Intel Math Kernel Library – LINPACK Download http://software.intel.com/en-us/articles/intel-math-kernel-library-linpack-download/
SPECcpu2006
http://www.spec.org/osg/cpu2006
Benchmark overview SPECcpu2006 http://docs.ts.fujitsu.com/dl.aspx?id=1a427c16-12bf-41b0-9ca3-4cc360ef14ce
STREAM
http://www.cs.virginia.edu/stream/

White Paper Performance Report PRIMERGY CX270 S2 Version: 1.1 2014-02-13
http://ts.fujitsu.com/primergy Page 27 (27)
Contact
FUJITSU
Website: http://www.fujitsu.com/
PRIMERGY Product Marketing
mailto:[email protected]
PRIMERGY Performance and Benchmarks
mailto:[email protected]
© Copyright 2013-2014 Fujitsu Technology Solutions. Fujitsu and the Fujitsu logo are trademarks or registered trademarks of Fujitsu Limited in Japan and other countries. Other company, product and service names may be trademarks or registered trademarks of their respective owners. Technical data subject to modification and delivery subject to availability. Any liability that the data and illustrations are complete, actual or correct is excluded. Designations may be trademarks and/or copyrights of the respective manufacturer, the use of which by third parties for their own purposes may infringe the rights of such owner. For further information see http://www.fujitsu.com/fts/resources/navigation/terms-of-use.html
2014-02-13 WW EN