performing geospatial analysis - verticaperforming geospatial analysis using latitude and longitude...
TRANSCRIPT
Performing
Geospatial Analysis Using Latitude and Longitude DataGinger Ni - Software Engineer

#SeizeTheData
Hewlett Packard Enterprise confidential informationThis is a rolling (up to three year) roadmap and is subject to change without notice.
This Roadmap contains Hewlett Packard Enterprise Confidential Information. If you have a valid Confidential Disclosure Agreement with Hewlett Packard Enterprise, disclosure of the Roadmap is subject to that CDA. If not, it is subject to the following terms: for a period of three years after the date of disclosure, you may use the Roadmap solely for the purpose of evaluating purchase decisions from HPE and use a reasonable standard of care to prevent disclosures. You will not disclose the contents of the Roadmap to any third party unless it becomes publically known, rightfully received by you from a third party without duty of confidentiality, or disclosed with Hewlett Packard Enterprise’s prior written approval.

#SeizeTheData
Please give me your feedback
–Use the mobile app to complete a session survey 1. Access “My schedule”
2. Click on the session detail page
3. Scroll down to “Rate & review”
– If the session is not on your schedule, just find it via the Discover app’s “Session Schedule” menu, click on this session, and scroll down to “Rate & Review”
– If you have not downloaded our event app, please go to your phone’s app store and search on “Discover 2016 Las Vegas”
– Thank you for providing your feedback, which helps us enhance content for future events.
Session ID: B9697 Speaker: Ginger Ni
#SeizeTheData
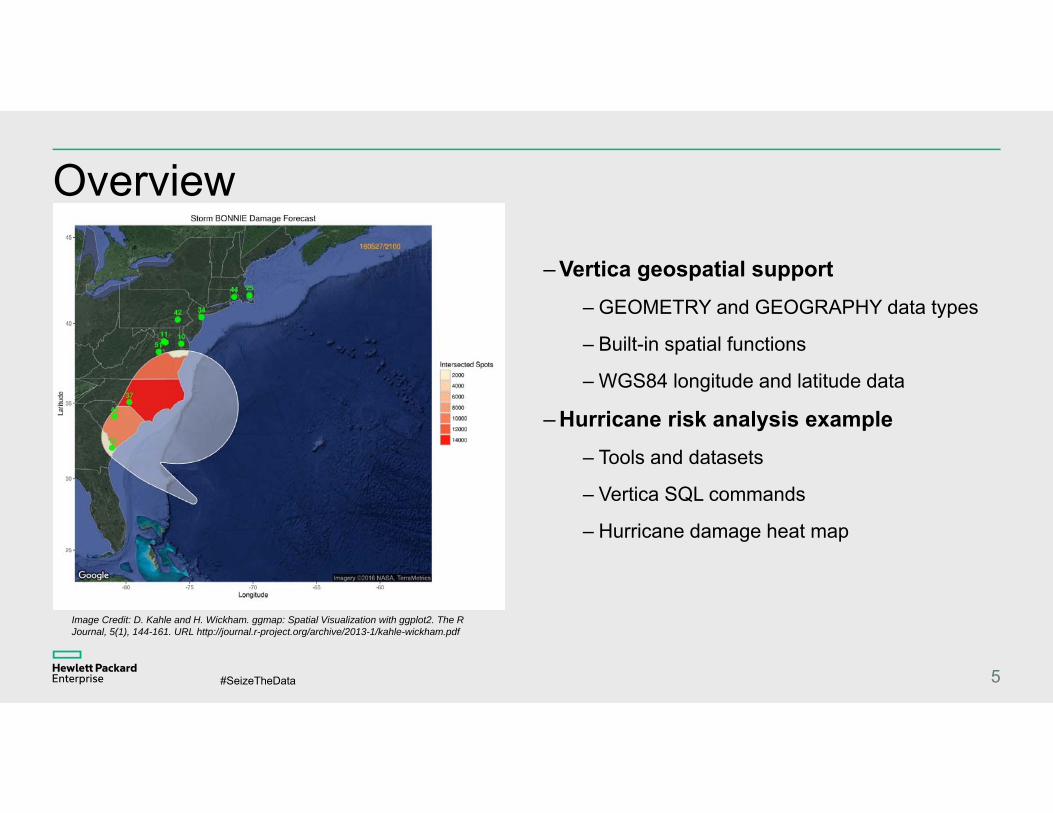
Overview
5
– Vertica geospatial support – GEOMETRY and GEOGRAPHY data types
– Built-in spatial functions
– WGS84 longitude and latitude data
– Hurricane risk analysis example – Tools and datasets
– Vertica SQL commands
– Hurricane damage heat map
Image Credit: D. Kahle and H. Wickham. ggmap: Spatial Visualization with ggplot2. The R Journal, 5(1), 144-161. URL http://journal.r-project.org/archive/2013-1/kahle-wickham.pdf

#SeizeTheData
Geospatial analysis in daily life
6
People are using technology of Geographic Information Systems (GIS) in their everyday lives.
– View images on Google Earth
– Navigate cars using Global Positioning System (GPS) devices
– Show your locations when you upload pictures to social media
– Search nearby restaurants on your smart phone
Government, companies, and individuals are using, generating and collecting geospatial data. From industry-leading businesses, to individual daily activities, vast amounts of geospatial data are being collected each day. Vertica can help you analyze geospatial data.
#SeizeTheData
Spatial analysis with Vertica
7
– People who are using or developing GIS for data management and analysis would benefit from the geospatial package in Vetica.
– Vertica supports two spatial data types, GEOMETRY and GEOGRAPHY, allowing spatial data to be stored and queried. A lot of GIS-enabled applications can work with Vertica.
– Vertica provides 65+ built-in functions for spatial analysis.
– Vertica geospatial analysis functions follow the Open Geospatial Consortium (OGC) standards, which are international open standards for geospatial interface and content.
– Vertica also has additional spatial functions beyond OGC standard functions.
#SeizeTheData
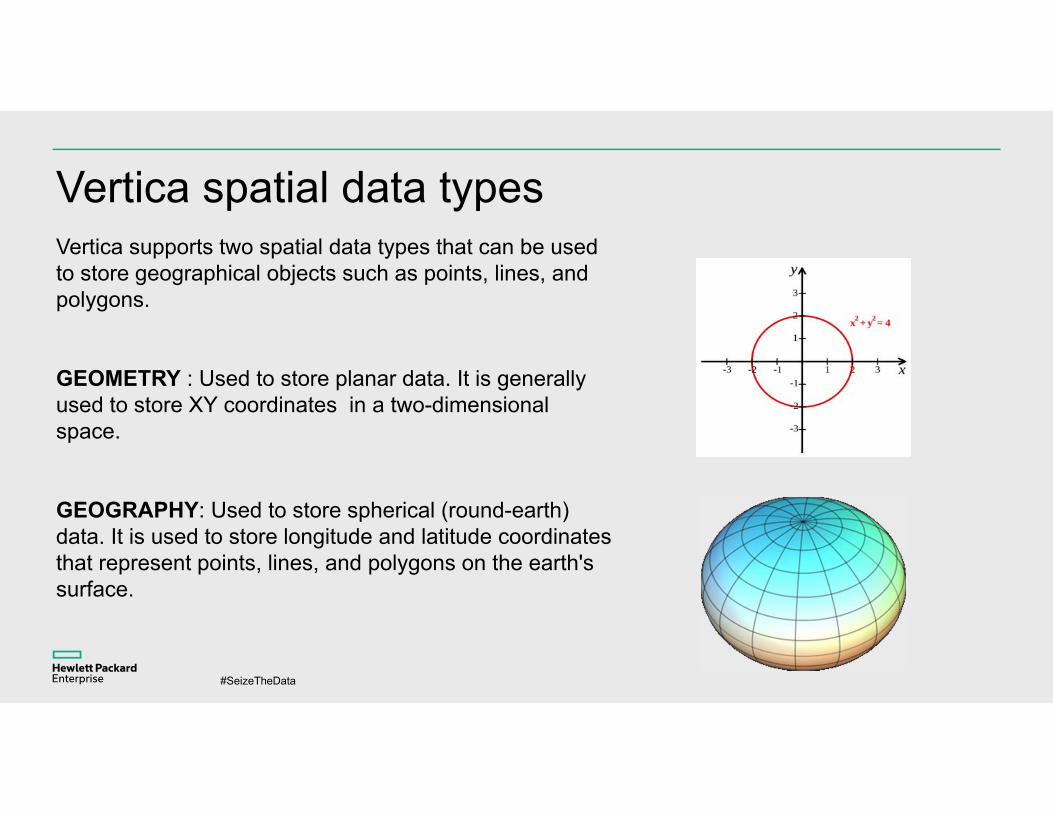
Vertica spatial data types Vertica supports two spatial data types that can be used to store geographical objects such as points, lines, and polygons.
GEOMETRY : Used to store planar data. It is generally used to store XY coordinates in a two-dimensional space.
GEOGRAPHY: Used to store spherical (round-earth) data. It is used to store longitude and latitude coordinates that represent points, lines, and polygons on the earth's surface.
#SeizeTheData
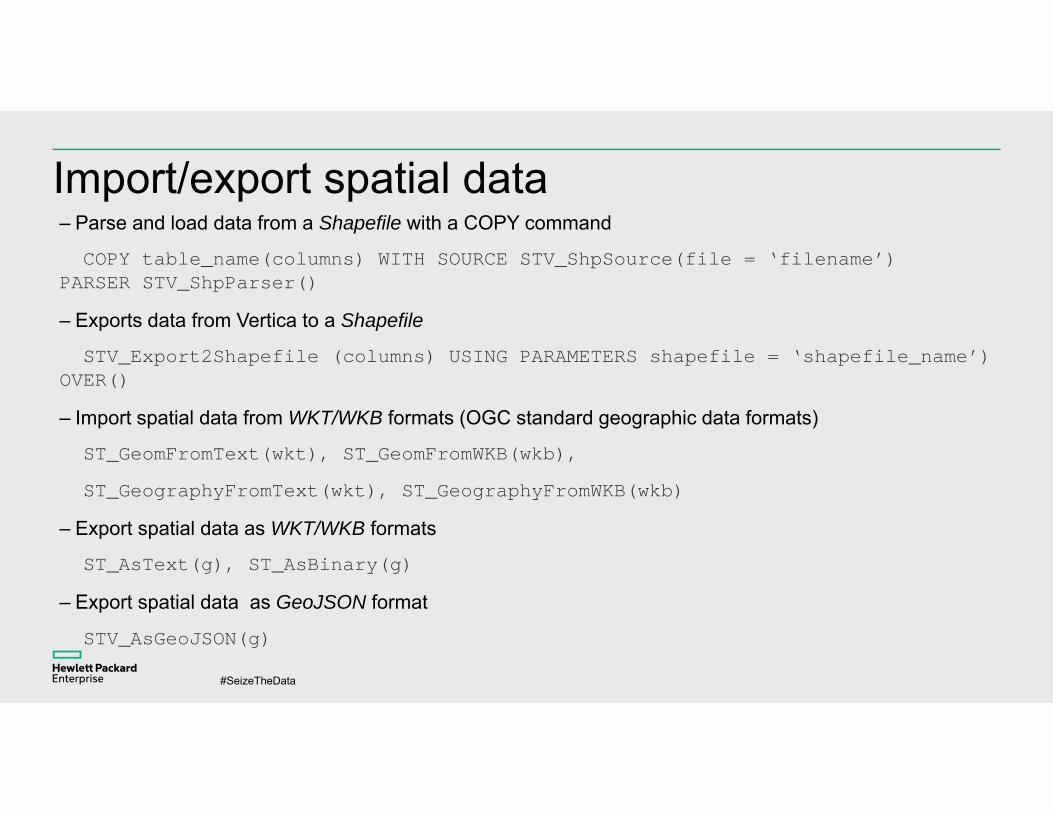
Import/export spatial data– Parse and load data from a Shapefile with a COPY command
COPY table_name(columns) WITH SOURCE STV_ShpSource(file = ‘filename’) PARSER STV_ShpParser()
– Exports data from Vertica to a Shapefile
STV_Export2Shapefile (columns) USING PARAMETERS shapefile = ‘shapefile_name’) OVER()
– Import spatial data from WKT/WKB formats (OGC standard geographic data formats)
ST_GeomFromText(wkt), ST_GeomFromWKB(wkb),
ST_GeographyFromText(wkt), ST_GeographyFromWKB(wkb)
– Export spatial data as WKT/WKB formats
ST_AsText(g), ST_AsBinary(g)
– Export spatial data as GeoJSON format
STV_AsGeoJSON(g)

#SeizeTheData 10
Vertica spatial analysis functions
ST_<function_name> functions are compliant with OGC standards. (40+ functions)
–ST_Area
–ST_Distance
–ST_Boundary
–ST_Intersects
–ST_IsValid
– …
10
STV_<function_name> functions are unique to Vertica and not compliant with OGC standards.(25+ functions)
–STV_Create_Index
–STV_Refresh_Index
–STV_Intersect
–STV_Export2Shapefile
–STV_AsGeoJSON
– …
Vertica provides SQL functions that allow for the creation, comparison, analysis and retrieval of spatial data.
#SeizeTheData
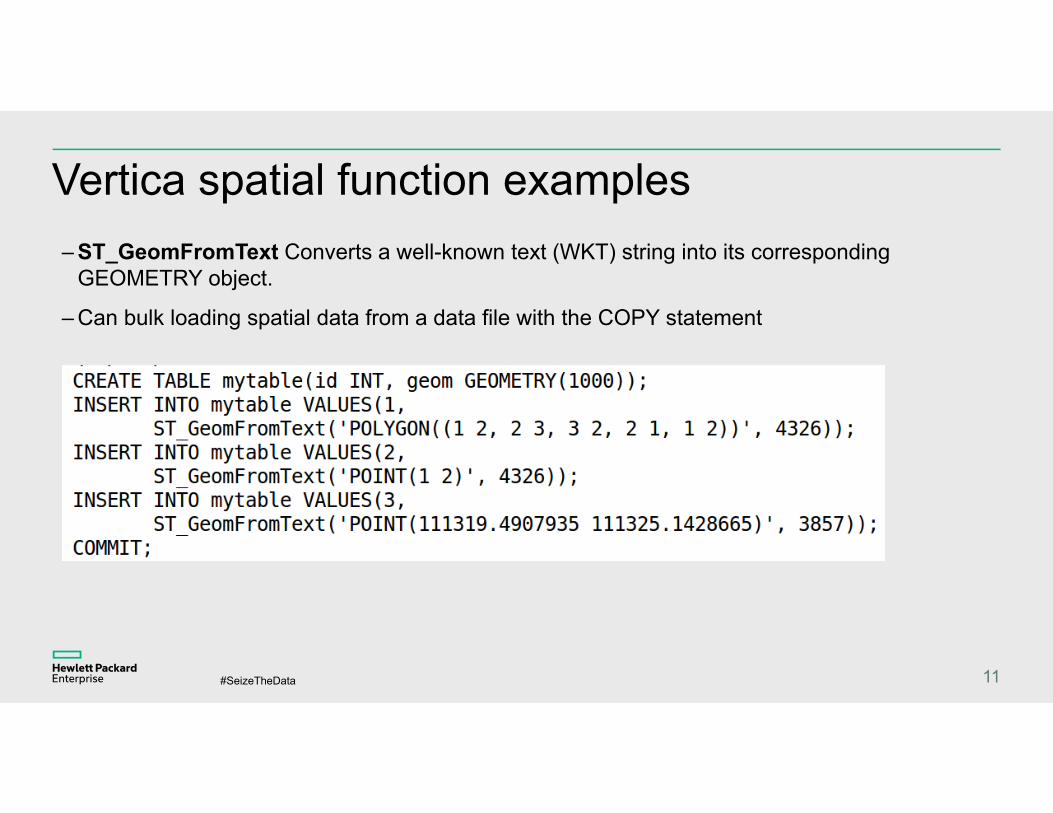
Vertica spatial function examples– ST_GeomFromText Converts a well-known text (WKT) string into its corresponding
GEOMETRY object.
– Can bulk loading spatial data from a data file with the COPY statement
11

#SeizeTheData
Vertica spatial function examples– ST_AsText Creates the well-known text (WKT) representation of a spatial object.
The OGC defines the format of a WKT string.
– ST_SRID Identifies the spatial reference system identifier (SRID) stored with a spatial object.
12
#SeizeTheData
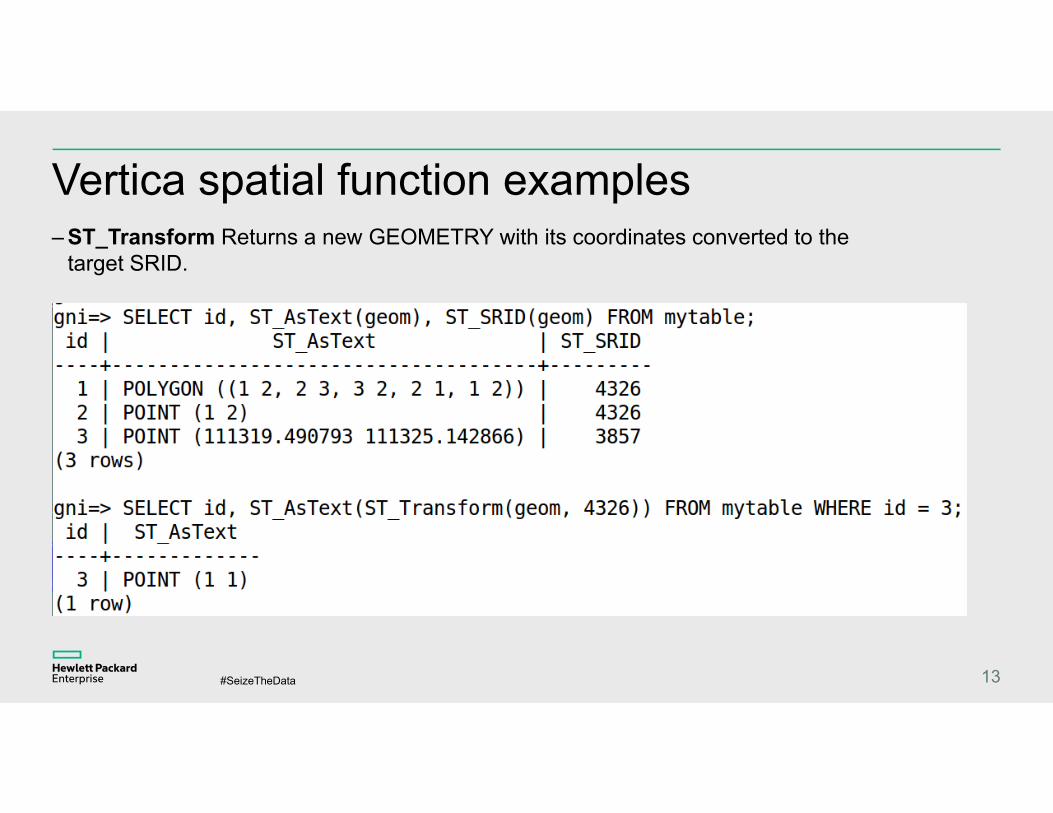
Vertica spatial function examples– ST_Transform Returns a new GEOMETRY with its coordinates converted to the
target SRID.
13
#SeizeTheData
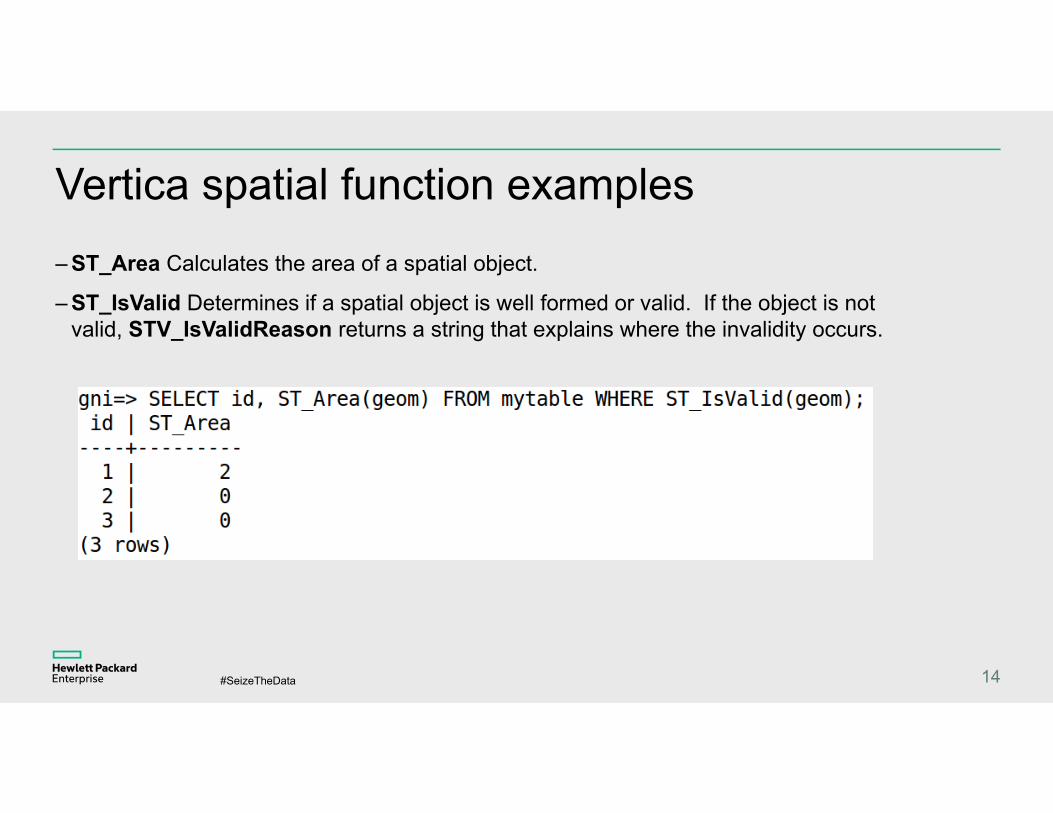
Vertica spatial function examples– ST_Area Calculates the area of a spatial object.
– ST_IsValid Determines if a spatial object is well formed or valid. If the object is not valid, STV_IsValidReason returns a string that explains where the invalidity occurs.
14

#SeizeTheData
Vertica spatial function examples– ST_Intersects Determines if two spatial objects intersect or touch at a single point
15

#SeizeTheData
Spatial Joins
16
– Spatial Joins allow you to identify spatial relationships between two sets of spatial data. Extensive applications are based on spatial join analysis.
For example:
• Calculate the density of mobile calls in various regions to determine the location of a new cell phone tower
• Identify homes that fall within the impact zone of a hurricane
• Calculate the number of users who live within a certain ZIP code
• Calculate the number of customers in a retail store at any given time
– Spatial join functions in Vertia are using spatial indexes which provide good performance.
#SeizeTheData
Longitude and latitude data– World Geodetic System(WGS84) is an industry standard when mapping the Earth’s oblate
spheroidal surface, and it is also the reference coordinate system used by GPS enabled devices.
– WGS84 is common nowadays and is the standard for GPS data, so when people refer to lon lat, they mean WGS84 lon lat.
17

#SeizeTheData
GEOGRAPHY data type– Vertica supports GEOGRAPHY spatial data type.
– A GEOGRAPHY object is a spatial object defined as on the surface of a perfect sphere, or a spatial object in the WGS84 coordinate system.
18
#SeizeTheData
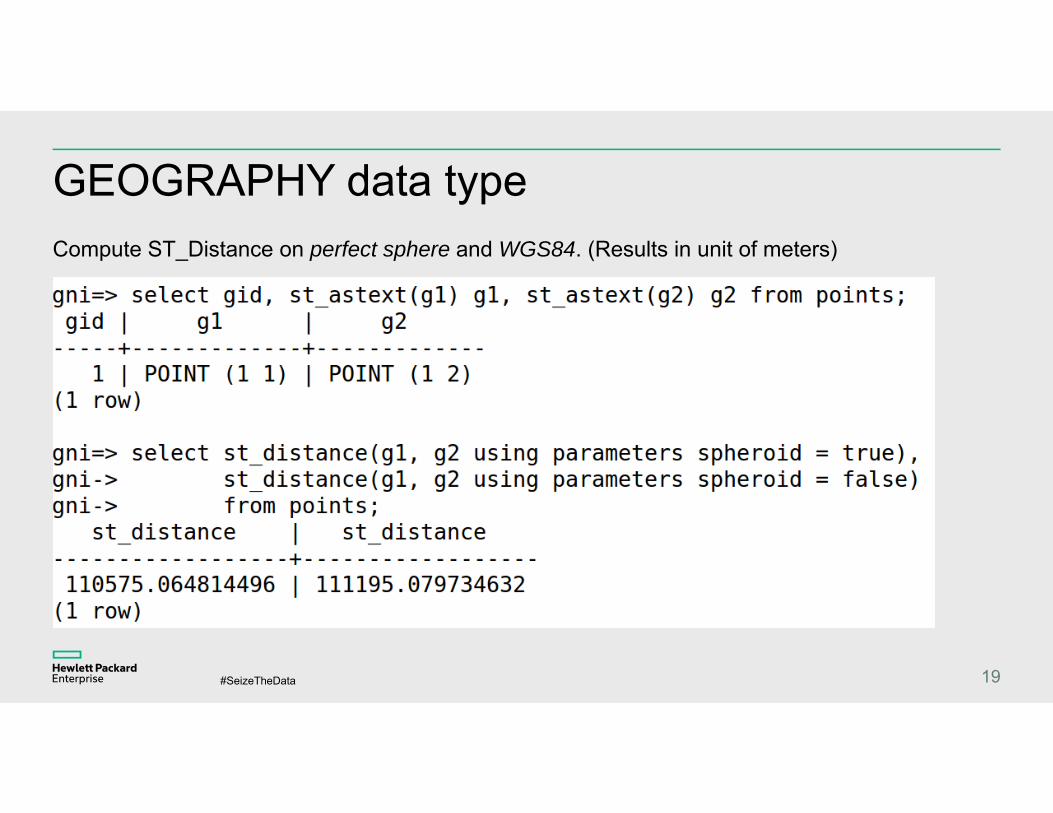
GEOGRAPHY data type
19
Compute ST_Distance on perfect sphere and WGS84. (Results in unit of meters)

#SeizeTheData
Using GEOGRAPHY data type Pros
– If your data covers the globe or a large area, this is probably the best. WGS84 is not projected, so distance measurement and spatial joins are more accurate than Universal Transverse Mercator (UTM).
– Most web mapping expect data to be fed to them in WGS84, so GEOGRAPHY will work fine in your spatial analysis work flow.
Cons
– Processing functions for GEOGRAPHY are limited.
– Computationally, functions for GEOGRAPHY are more expensive thus slower. For regional data, we usually use GEOMETRY data type.
20

#SeizeTheData
Summary– Vertica provides 65+ functions that allow you to manipulate complex spatial objects.
– Functions follow the OGC standards -- Easy for migration.
– Fast computations based on spatial index.
– Geosaptial analysis package automatically deploy on Vertica cluster.
– Support spatial analysis on longitude and latitude data in WGS84 coordinate system.

#SeizeTheData
Hurricane risk analysis example
22
– In his example, I will show you perform spatial analysis on longitude latitude data with Vertica. Make a heat map with your spatial data using Vertica and third-party softwares.
– The ability to perform spatial queries, and display data spatially, is the essence and power of GIS. Vertica is perfect fit for your GIS development.

#SeizeTheData
Hurricane risk analysis with VerticaHurricanes leave behind extensive property damage. Using spatial analysis to estimate the impact of disasters in high-risk areas will provide important information to insurance companies on potential loss of property value.
– In this example, we do a point-in-polygon analysis to identify properties that fall within the impact zone of a hurricane.
– Determine areas most affected by a hurricane and visualize them on a heat map.
– The example shows how you can gain insight into real-world challenges using your spatial data with Vertica.
23
#SeizeTheData
Hurricane heat map The National Hurricane Center(NHC) provides various GIS datasets. In this example, we use the hurricane BONNIE dataset.
The United States Census Bureau provides various census data. We downloaded the landmark dataset from the TIGER database.
We do a spatial join analysis of a set of points and a set of polygons.
Polygon dataset
Hurricane BONNIE from http://www.nhc.noaa.gov/gis/
Point dataset
Landmarks from ftp://ftp2.census.gov/geo/tiger/TIGER2015/POINTLM/
Tools
Vertica + third-parth softwares
24

#SeizeTheData 25
#SeizeTheData
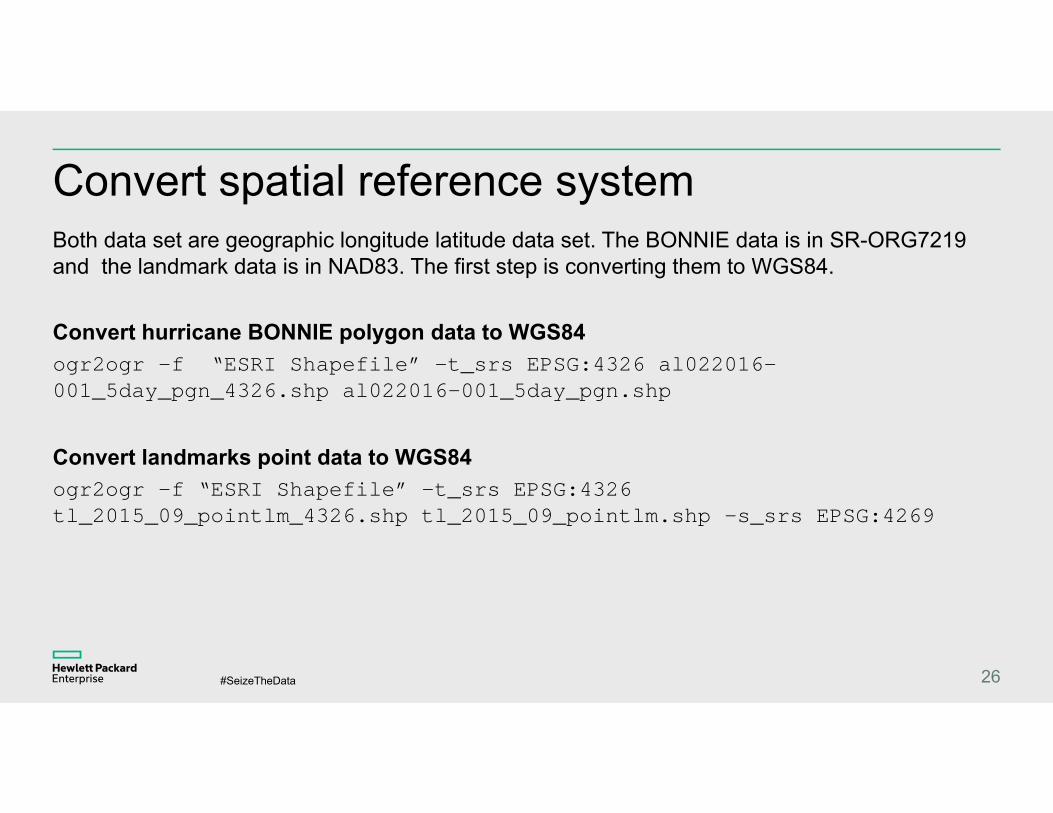
Convert spatial reference systemBoth data set are geographic longitude latitude data set. The BONNIE data is in SR-ORG7219 and the landmark data is in NAD83. The first step is converting them to WGS84.
Convert hurricane BONNIE polygon data to WGS84ogr2ogr –f “ESRI Shapefile” –t_srs EPSG:4326 al022016-001_5day_pgn_4326.shp al022016-001_5day_pgn.shp
Convert landmarks point data to WGS84ogr2ogr –f “ESRI Shapefile” –t_srs EPSG:4326 tl_2015_09_pointlm_4326.shp tl_2015_09_pointlm.shp –s_srs EPSG:4269
26

#SeizeTheData
Load shapefile into a Vertica table-- Load the hurricane BONNIE shapefileSELECT stv_shpcreatetable(using parameters file=bonnie.shp) OVER();
CREATE TABLE tmp(
gid IDENTITY(64) PRIMARY KEY,
ADVDATE VARCHAR(28),
geom GEOMETRY(7581)
);
COPY tmp SOURCE STV_ShpSource(file=bonnie.shp) PARSER STV_ShpParser();
-- Convert GEOMETRY to GEOGRAPHYCREATE TABLE bonnie AS SELECT gid, ADVDATE, stv_geography(geom) geomFROM tmp;
27
#SeizeTheData
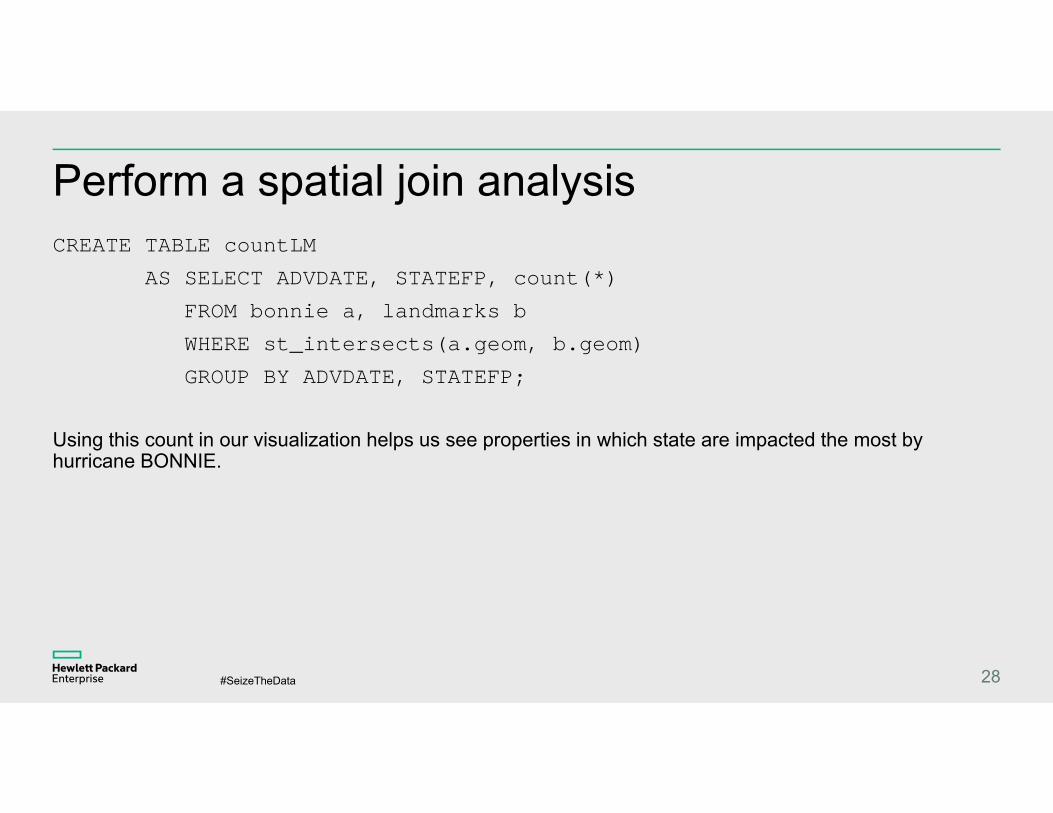
Perform a spatial join analysisCREATE TABLE countLM
AS SELECT ADVDATE, STATEFP, count(*)
FROM bonnie a, landmarks b
WHERE st_intersects(a.geom, b.geom)
GROUP BY ADVDATE, STATEFP;
Using this count in our visualization helps us see properties in which state are impacted the most by hurricane BONNIE.
28

#SeizeTheData
– More than 236 thousands landmarks on US east coast line are computed in each frame.
– Spatial join computation of all 236+ thousands instances takes ~1 second run time.
– You can export the intersect results to a shapefile and then load to a visualization tool.
– Or you can connect GIS tools with Vertica though JDBC/ODBC to fetch those spatial analysis results.

#SeizeTheData
Q&A
30