permissions · pdf filedespite its obvious socio-economic significance, the black rat remains...
TRANSCRIPT

PUBLISHED VERSION
Donnellan, Stephen Charles, Austin, Jeremy James, Soubrier, Julien, Cooper, Alan, Multiple geographic origins of commensalism and complex dispersal history of black rats, PLoS ONE, 2011; 6(11): e26357
Copyright: © 2011 Aplin et al. This is an open-access article distributed under the terms of the Creative Commons Attribution License, which permits unrestricted use, distribution, and reproduction in any medium, provided the original author and source are credited.
http://hdl.handle.net/2440/68855
PERMISSIONS
http://www.plosone.org/static/policies.action#copyright
PLoS Editorial and Publishing Policies 3. Copyright and License Policies
Open access agreement. Upon submission of an article, its authors are asked to indicate their agreement to abide by an open access Creative Commons license (CC-BY). Under the terms of this license, authors retain ownership of the copyright of their articles. However, the license permits any user to download, print out, extract, reuse, archive, and distribute the article, so long as appropriate credit is given to the authors and source of the work. The license ensures that the authors' article will be available as widely as possible and that the article can be included in any scientific archive.
Open access agreement: US government authors. Papers authored by one or more US government employees are not copyrighted, but are licensed under a Creative Commons public domain license (CC0), which allows unlimited distribution and reuse of the article for any lawful purpose. Authors should read about CC-BY or CC0 before submitting papers.
Archiving in PubMed Central. Upon publication, PLoS also deposits all articles in PubMed Central. This complies with the policies of funding agencies, such as the NIH in the USA, the Wellcome Trust, and the Research Councils in the UK, and the Deutsche Forschungsgemeinschaft in Germany, which request or require deposition of the published articles that they fund into publicly available databases.
Multiple Geographic Origins of Commensalism andComplex Dispersal History of Black RatsKen P. Aplin1*, Hitoshi Suzuki2, Alejandro A. Chinen2, R. Terry Chesser3, Jose ten Have4, Stephen C.
Donnellan5, Jeremy Austin6, Angela Frost1, Jean Paul Gonzalez7, Vincent Herbreteau7, Francois
Catzeflis8, Julien Soubrier6, Yin-Ping Fang9, Judith Robins10, Elizabeth Matisoo-Smith11, Amanda D. S.
Bastos12, Ibnu Maryanto13, Martua H. Sinaga13, Christiane Denys14, Ronald A. Van Den Bussche15, Chris
Conroy16, Kevin Rowe16, Alan Cooper6
1 Australian National Wildlife Collection, CSIRO Ecosystem Sciences, Canberra, Australia, 2 Graduate School of Environmental Earth Science, Hokkaido University, Sapporo,
Japan, 3 Smithsonian Institution, Division of Birds, Washington D.C., United States of America, 4 Office of the Gene Technology Regulator, Canberra, Australia, 5 South
Australian Museum, and Australian Centre for Evolutionary Biology and Biodiversity, University of Adelaide, Adelaide, Australia, 6 Australian Centre for Ancient DNA,
University of Adelaide, Adelaide, Australia, 7 Institut de Recherche pour le Developpement, Research Unit 178, Center for Vectors and Vector Diseases, Faculty of Science,
Mahidol University, Nakhonpathom, Thailand, 8 Laboratoire de Paleontologie, Phylogenie et Paleobiologie, Institut des Sciences de l’Evolution, Universite Montpellier II,
Montpellier, France, 9 Department of Biological Resources, National Chiayi University, Chiayi City, Taiwan, 10 Department of Anthropology, University of Auckland,
Auckland, New Zealand, 11 Department of Anatomy & Structural Biology, University of Otago, Dunedin, New Zealand, 12 Mammal Research Institute, Department of
Zoology & Entomology, University of Pretoria, Pretoria, South Africa, 13 Indonesian Institute of Sciences (LIPI) & Museum Bogoriense, Cibinong, West Java, Indonesia,
14 Department of Systematics and Evolution, Museum National d’Histoire Naturelle, Paris, France, 15 Department of Zoology, Oklahoma State University, Stillwater,
Oklahoma, United States of America, 16 Museum of Vertebrate Zoology, University of California, Berkeley, California, United States of America
Abstract
The Black Rat (Rattus rattus) spread out of Asia to become one of the world’s worst agricultural and urban pests, and areservoir or vector of numerous zoonotic diseases, including the devastating plague. Despite the global scale andinestimable cost of their impacts on both human livelihoods and natural ecosystems, little is known of the global geneticdiversity of Black Rats, the timing and directions of their historical dispersals, and the risks associated with contemporarymovements. We surveyed mitochondrial DNA of Black Rats collected across their global range as a first step towardsobtaining an historical genetic perspective on this socioeconomically important group of rodents. We found a strongphylogeographic pattern with well-differentiated lineages of Black Rats native to South Asia, the Himalayan region,southern Indochina, and northern Indochina to East Asia, and a diversification that probably commenced in the early MiddlePleistocene. We also identified two other currently recognised species of Rattus as potential derivatives of a paraphyletic R.rattus. Three of the four phylogenetic lineage units within R. rattus show clear genetic signatures of major populationexpansion in prehistoric times, and the distribution of particular haplogroups mirrors archaeologically and historicallydocumented patterns of human dispersal and trade. Commensalism clearly arose multiple times in R. rattus and in widelyseparated geographic regions, and this may account for apparent regionalism in their associated pathogens. Our findingsrepresent an important step towards deeper understanding the complex and influential relationship that has developedbetween Black Rats and humans, and invite a thorough re-examination of host-pathogen associations among Black Rats.
Citation: Aplin KP, Suzuki H, Chinen AA, Chesser RT, ten Have J, et al. (2011) Multiple Geographic Origins of Commensalism and Complex Dispersal History ofBlack Rats. PLoS ONE 6(11): e26357. doi:10.1371/journal.pone.0026357
Editor: M. Thomas P. Gilbert, Natural History Museum of Denmark, Denmark
Received February 24, 2011; Accepted September 25, 2011; Published November 2, 2011
Copyright: � 2011 Aplin et al. This is an open-access article distributed under the terms of the Creative Commons Attribution License, which permitsunrestricted use, distribution, and reproduction in any medium, provided the original author and source are credited.
Funding: Funding support that allowed KA and AF to collect samples in Myanmar, Vietnam, Laos and Cambodia was provided by Australian Centre forInternational Agricultural Research (ACIAR - (http://aciar.gov.au/) and AusAID (http://www.ausaid.gov.au/), funding agencies of the Australian Government.Collecting by KA in Bangladesh was supported by Department for International Development(DfID) grants through the Poverty Elimination through Rice ResearchAssistance and Crop Protection Programme programmes. Y-PF was supported by grants from the National Science Council (http://web1.nsc.gov.tw/) and theCouncil of Agriculture (http://eng.coa.gov.tw/), Republic of China. AB was supported by DFID (project number R8190) and the European Commission’s INCO-DEVprogramme (ICA4-CT2002-10056: Ratzooman - http://www.nri.org/ratzooman). CD’s collecting in Guinea was supported by the European Commission’s INCO-DEVprogramme (project ‘TREATCONTROL’). The funders had no role in study design, data collection and analysis, decision to publish, or preparation of themanuscript.
Competing Interests: The authors have declared that no competing interests exist.
* E-mail: [email protected]
Introduction
The Black Rat (Rattus rattus; also known as ‘House’, ‘Roof’ and
‘Ship’ Rat) is the most widely distributed of all commensal animals
and the most destructive of all animal pests. It is a remarkably
adaptable species that plays multiple roles as a household pest [1],
a destructive agricultural pest in cereal and vegetable crops,
orchards and palm plantations [1,2], and a feral invader of natural
habitats [3,4]. Huge effort is invested in pest control and feral
eradication of the species, and there is growing interest in its role
in numerous zoonotic disease cycles, including the ongoing threat
posed by plague (Yersinia pestis) [5] and the emerging threats posed
by bunyaviruses, leptospirosis and a range of bacterial ‘‘typhus’’
syndromes in particular [6,7].
PLoS ONE | www.plosone.org 1 November 2011 | Volume 6 | Issue 11 | e26357
Despite its obvious socio-economic significance, the Black Rat
remains poorly understood from a taxonomic and evolutionary
standpoint, and it remains almost entirely unstudied as a wild
mammal within its natural range. Studies of chromosomes and
blood proteins during the 1960s and 70 s identified patterns of
geographic variation in the species [8], and subsequent genetic [9]
and morphological work [10] encouraged discrimination of two
weakly differentiated species – R. rattus for European and Indian
populations with a karyotype of 2n = 38–40 and R. tanezumi for
Asian populations with a 2n = 42 karyotype [11]. However, more
recent regional studies of Black Rat mitochondrial DNA (mtDNA)
[12–13,14] identified patterns of genetic diversity that are not
easily reconciled with this taxonomic arrangement.
We undertook a global survey of mitochondrial DNA (mtDNA)
of this important pest animal throughout its entire range. Our
findings shed new light on the evolutionary history of Black Rats,
including the geographic pattern of diversification and the
direction and timing of prehistoric, historic and contemporary
dispersals, and suggest a novel explanation for the exceptionally
diverse zoonotic disease associations of this particular group of
rats. Our findings also point the way forward to resolving the
taxonomy of this problematic group of mammals.
Results
We obtained mitochondrial cytochrome b (cyt b) gene sequences
from 165 individuals identified on morphological criteria as Black
Rats, presumably representing either R. rattus or R. tanezumi. These
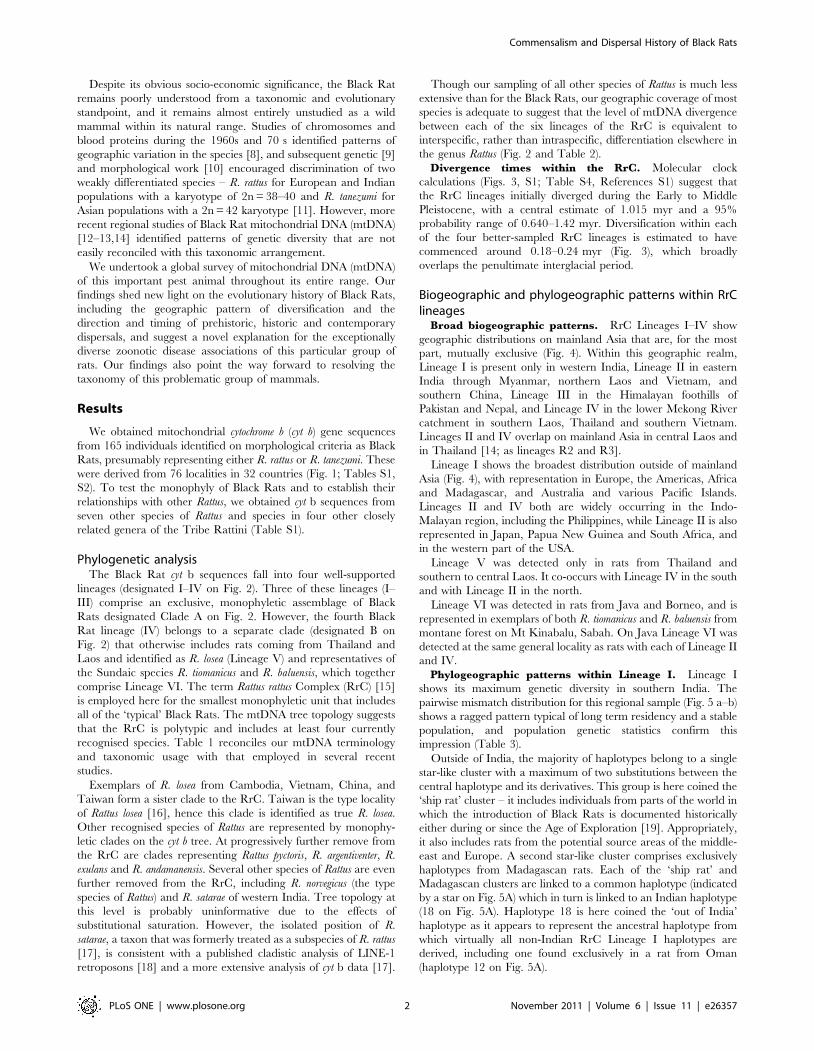
were derived from 76 localities in 32 countries (Fig. 1; Tables S1,
S2). To test the monophyly of Black Rats and to establish their
relationships with other Rattus, we obtained cyt b sequences from
seven other species of Rattus and species in four other closely
related genera of the Tribe Rattini (Table S1).
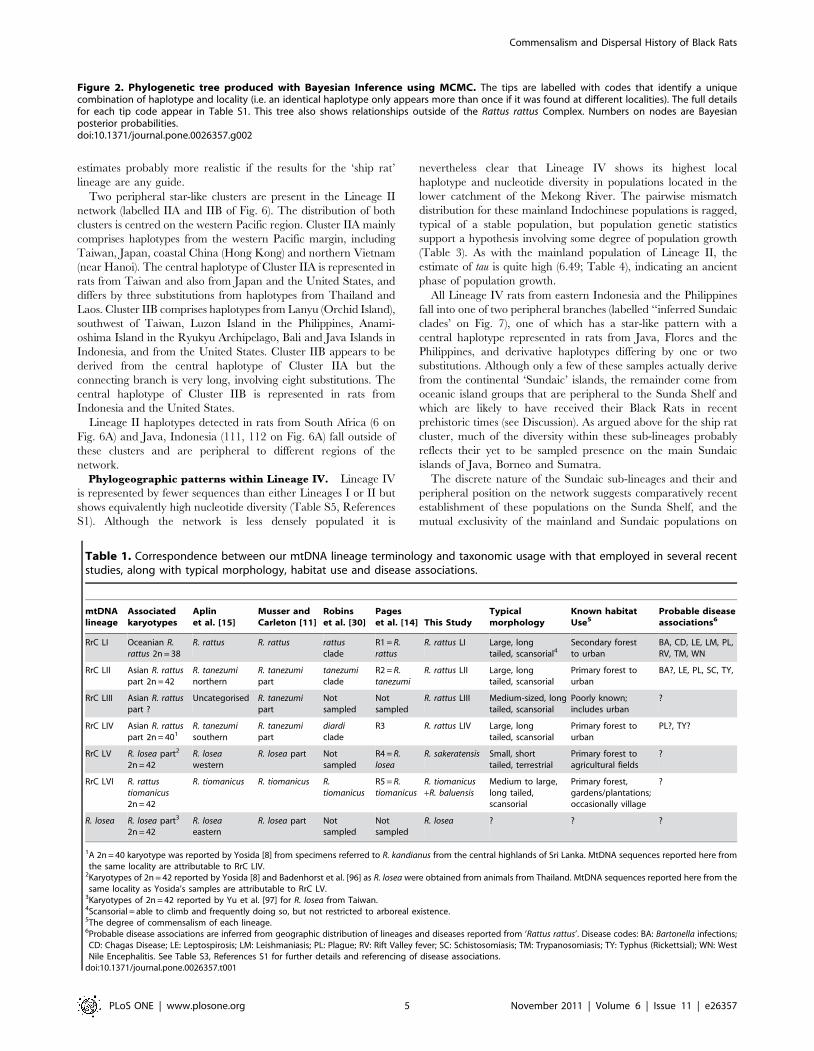
Phylogenetic analysisThe Black Rat cyt b sequences fall into four well-supported
lineages (designated I–IV on Fig. 2). Three of these lineages (I–
III) comprise an exclusive, monophyletic assemblage of Black
Rats designated Clade A on Fig. 2. However, the fourth Black
Rat lineage (IV) belongs to a separate clade (designated B on
Fig. 2) that otherwise includes rats coming from Thailand and
Laos and identified as R. losea (Lineage V) and representatives of
the Sundaic species R. tiomanicus and R. baluensis, which together
comprise Lineage VI. The term Rattus rattus Complex (RrC) [15]
is employed here for the smallest monophyletic unit that includes
all of the ‘typical’ Black Rats. The mtDNA tree topology suggests
that the RrC is polytypic and includes at least four currently
recognised species. Table 1 reconciles our mtDNA terminology
and taxonomic usage with that employed in several recent
studies.
Exemplars of R. losea from Cambodia, Vietnam, China, and
Taiwan form a sister clade to the RrC. Taiwan is the type locality
of Rattus losea [16], hence this clade is identified as true R. losea.
Other recognised species of Rattus are represented by monophy-
letic clades on the cyt b tree. At progressively further remove from
the RrC are clades representing Rattus pyctoris, R. argentiventer, R.
exulans and R. andamanensis. Several other species of Rattus are even
further removed from the RrC, including R. norvegicus (the type
species of Rattus) and R. satarae of western India. Tree topology at
this level is probably uninformative due to the effects of
substitutional saturation. However, the isolated position of R.
satarae, a taxon that was formerly treated as a subspecies of R. rattus
[17], is consistent with a published cladistic analysis of LINE-1
retroposons [18] and a more extensive analysis of cyt b data [17].
Though our sampling of all other species of Rattus is much less
extensive than for the Black Rats, our geographic coverage of most
species is adequate to suggest that the level of mtDNA divergence
between each of the six lineages of the RrC is equivalent to
interspecific, rather than intraspecific, differentiation elsewhere in
the genus Rattus (Fig. 2 and Table 2).
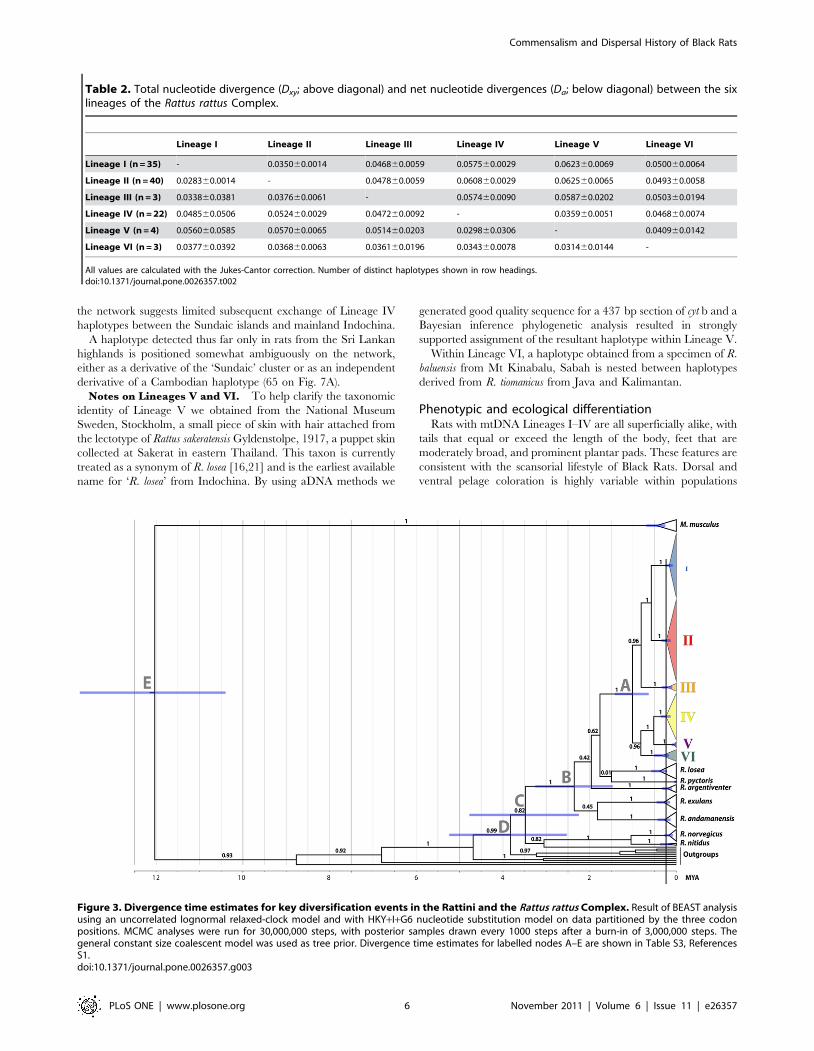
Divergence times within the RrC. Molecular clock
calculations (Figs. 3, S1; Table S4, References S1) suggest that
the RrC lineages initially diverged during the Early to Middle
Pleistocene, with a central estimate of 1.015 myr and a 95%
probability range of 0.640–1.42 myr. Diversification within each
of the four better-sampled RrC lineages is estimated to have
commenced around 0.18–0.24 myr (Fig. 3), which broadly
overlaps the penultimate interglacial period.
Biogeographic and phylogeographic patterns within RrClineages
Broad biogeographic patterns. RrC Lineages I–IV show
geographic distributions on mainland Asia that are, for the most
part, mutually exclusive (Fig. 4). Within this geographic realm,
Lineage I is present only in western India, Lineage II in eastern
India through Myanmar, northern Laos and Vietnam, and
southern China, Lineage III in the Himalayan foothills of
Pakistan and Nepal, and Lineage IV in the lower Mekong River
catchment in southern Laos, Thailand and southern Vietnam.
Lineages II and IV overlap on mainland Asia in central Laos and
in Thailand [14; as lineages R2 and R3].
Lineage I shows the broadest distribution outside of mainland
Asia (Fig. 4), with representation in Europe, the Americas, Africa
and Madagascar, and Australia and various Pacific Islands.
Lineages II and IV both are widely occurring in the Indo-
Malayan region, including the Philippines, while Lineage II is also
represented in Japan, Papua New Guinea and South Africa, and
in the western part of the USA.
Lineage V was detected only in rats from Thailand and
southern to central Laos. It co-occurs with Lineage IV in the south
and with Lineage II in the north.
Lineage VI was detected in rats from Java and Borneo, and is
represented in exemplars of both R. tiomanicus and R. baluensis from
montane forest on Mt Kinabalu, Sabah. On Java Lineage VI was
detected at the same general locality as rats with each of Lineage II
and IV.
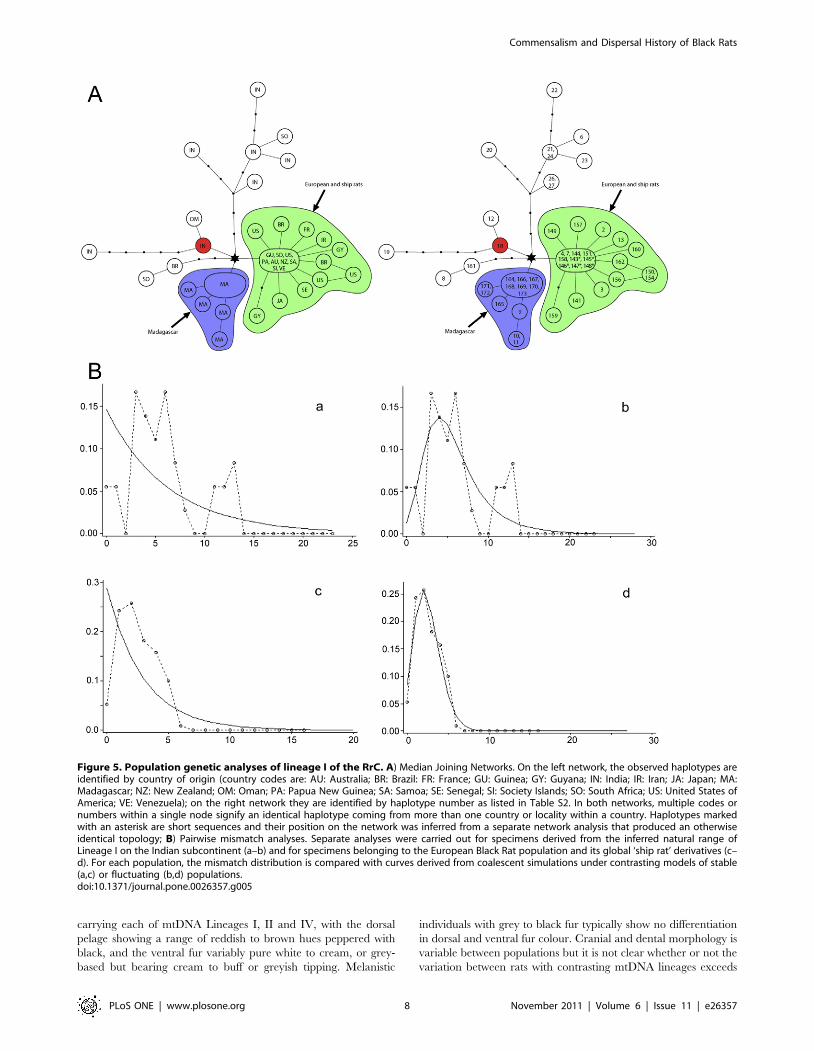
Phylogeographic patterns within Lineage I. Lineage I
shows its maximum genetic diversity in southern India. The
pairwise mismatch distribution for this regional sample (Fig. 5 a–b)
shows a ragged pattern typical of long term residency and a stable
population, and population genetic statistics confirm this
impression (Table 3).
Outside of India, the majority of haplotypes belong to a single
star-like cluster with a maximum of two substitutions between the
central haplotype and its derivatives. This group is here coined the
‘ship rat’ cluster – it includes individuals from parts of the world in
which the introduction of Black Rats is documented historically
either during or since the Age of Exploration [19]. Appropriately,
it also includes rats from the potential source areas of the middle-
east and Europe. A second star-like cluster comprises exclusively
haplotypes from Madagascan rats. Each of the ‘ship rat’ and
Madagascan clusters are linked to a common haplotype (indicated
by a star on Fig. 5A) which in turn is linked to an Indian haplotype
(18 on Fig. 5A). Haplotype 18 is here coined the ‘out of India’
haplotype as it appears to represent the ancestral haplotype from
which virtually all non-Indian RrC Lineage I haplotypes are
derived, including one found exclusively in a rat from Oman
(haplotype 12 on Fig. 5A).
Commensalism and Dispersal History of Black Rats
PLoS ONE | www.plosone.org 2 November 2011 | Volume 6 | Issue 11 | e26357
Two Lineage I haplotypes (6,8 on Fig. 5A) detected in South
Africa and one detected in Brazil (161 on Fig. 5A) fall outside of
the ‘ship rat’ cluster. Haplotypes 8 and 161 differ from each other
by a single base pair substitution, while haplotype 161 differs by
two substitutions from the ‘out of India’ haplotype. Haplotype 6
from South Africa is derived from Indian haplotypes 21/24 and
represents an independent emigrant lineage. The tau value of 2.49
(Table 4) for the ‘ship rat’ cluster indicates a comparatively recent
population expansion but the minimum estimate of time since the
start of this expansion (using the highest suggested cyt b substitution
rate and the shortest generation time) still falls around 4000 years
ago. Unless cyt b mutation rates are not appreciably different over
periods of 102 and 103 years [20], this suggests that haplotype
diversity within the ‘ship rat’ cluster is inherited from a genetically
diverse European source population. This is readily testable
through wider geographic sampling of extant European Black
Rats.
Phylogeographic patterns within Lineage II. Lineage II
shows its highest local haplotype and nucleotide diversity in
populations from mainland Indo-China (Laos, Myanmar, and
Thailand). The pairwise mismatch distribution of mainland
populations of Lineage II shows a unimodal pattern suggestive
of recent population expansion rather than a ragged pattern
indicative of long term population stability (Fig. 6B a–b). However,
the tau estimate of 6.77 (Table 4) suggests a considerably more
ancient population expansion than that of the ‘ship rats’ of Lineage
I. Estimates of the time since expansion vary between 10,740 years
and 155,600 years (Table S4, References S1), with the lower
Figure 1. Maps showing the global distribution of sampling localities. Locality numbers refer to entries in Tables S1 and S2.doi:10.1371/journal.pone.0026357.g001
Commensalism and Dispersal History of Black Rats
PLoS ONE | www.plosone.org 3 November 2011 | Volume 6 | Issue 11 | e26357
Commensalism and Dispersal History of Black Rats
PLoS ONE | www.plosone.org 4 November 2011 | Volume 6 | Issue 11 | e26357
estimates probably more realistic if the results for the ‘ship rat’
lineage are any guide.
Two peripheral star-like clusters are present in the Lineage II
network (labelled IIA and IIB of Fig. 6). The distribution of both
clusters is centred on the western Pacific region. Cluster IIA mainly
comprises haplotypes from the western Pacific margin, including
Taiwan, Japan, coastal China (Hong Kong) and northern Vietnam
(near Hanoi). The central haplotype of Cluster IIA is represented in
rats from Taiwan and also from Japan and the United States, and
differs by three substitutions from haplotypes from Thailand and
Laos. Cluster IIB comprises haplotypes from Lanyu (Orchid Island),
southwest of Taiwan, Luzon Island in the Philippines, Anami-
oshima Island in the Ryukyu Archipelago, Bali and Java Islands in
Indonesia, and from the United States. Cluster IIB appears to be
derived from the central haplotype of Cluster IIA but the
connecting branch is very long, involving eight substitutions. The
central haplotype of Cluster IIB is represented in rats from
Indonesia and the United States.
Lineage II haplotypes detected in rats from South Africa (6 on
Fig. 6A) and Java, Indonesia (111, 112 on Fig. 6A) fall outside of
these clusters and are peripheral to different regions of the
network.
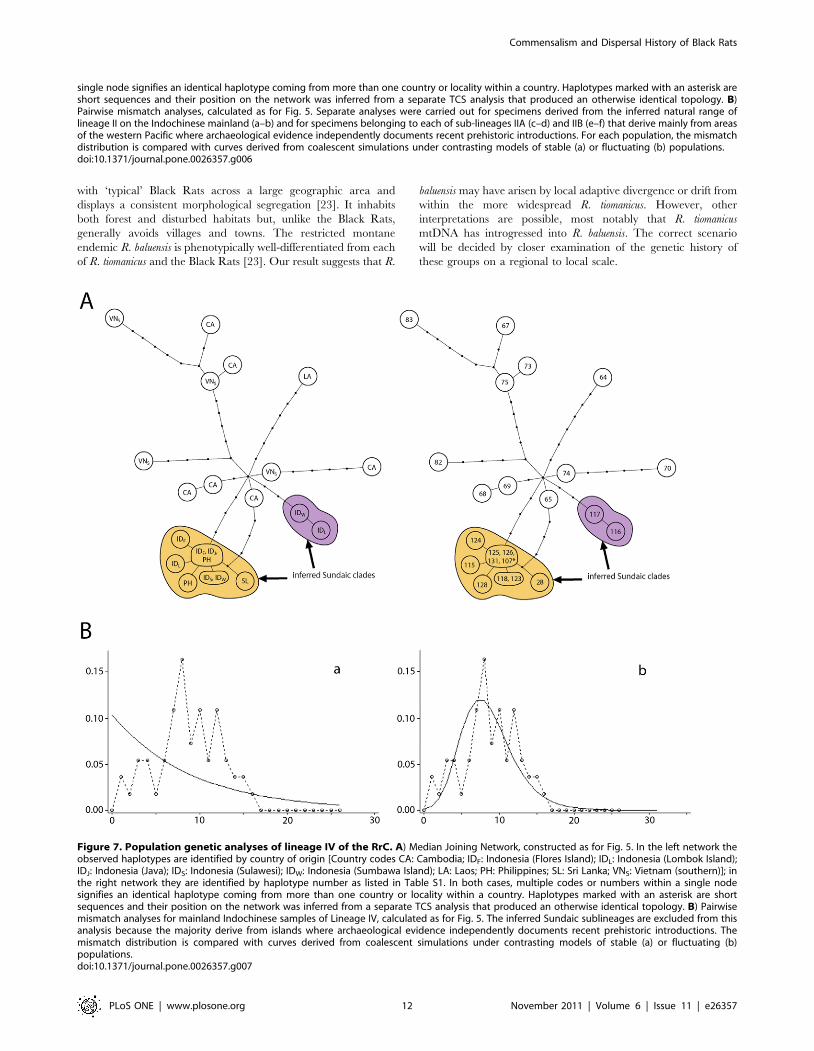
Phylogeographic patterns within Lineage IV. Lineage IV
is represented by fewer sequences than either Lineages I or II but
shows equivalently high nucleotide diversity (Table S5, References
S1). Although the network is less densely populated it is
nevertheless clear that Lineage IV shows its highest local
haplotype and nucleotide diversity in populations located in the
lower catchment of the Mekong River. The pairwise mismatch
distribution for these mainland Indochinese populations is ragged,
typical of a stable population, but population genetic statistics
support a hypothesis involving some degree of population growth
(Table 3). As with the mainland population of Lineage II, the
estimate of tau is quite high (6.49; Table 4), indicating an ancient
phase of population growth.
All Lineage IV rats from eastern Indonesia and the Philippines
fall into one of two peripheral branches (labelled ‘‘inferred Sundaic
clades’ on Fig. 7), one of which has a star-like pattern with a
central haplotype represented in rats from Java, Flores and the
Philippines, and derivative haplotypes differing by one or two
substitutions. Although only a few of these samples actually derive
from the continental ‘Sundaic’ islands, the remainder come from
oceanic island groups that are peripheral to the Sunda Shelf and
which are likely to have received their Black Rats in recent
prehistoric times (see Discussion). As argued above for the ship rat
cluster, much of the diversity within these sub-lineages probably
reflects their yet to be sampled presence on the main Sundaic
islands of Java, Borneo and Sumatra.
The discrete nature of the Sundaic sub-lineages and their and
peripheral position on the network suggests comparatively recent
establishment of these populations on the Sunda Shelf, and the
mutual exclusivity of the mainland and Sundaic populations on
Table 1. Correspondence between our mtDNA lineage terminology and taxonomic usage with that employed in several recentstudies, along with typical morphology, habitat use and disease associations.
mtDNAlineage
Associatedkaryotypes
Aplinet al. [15]
Musser andCarleton [11]
Robinset al. [30]
Pageset al. [14] This Study
Typicalmorphology
Known habitatUse5
Probable diseaseassociations6
RrC LI Oceanian R.rattus 2n = 38
R. rattus R. rattus rattusclade
R1 = R.rattus
R. rattus LI Large, longtailed, scansorial4
Secondary forestto urban
BA, CD, LE, LM, PL,RV, TM, WN
RrC LII Asian R. rattuspart 2n = 42
R. tanezuminorthern
R. tanezumipart
tanezumiclade
R2 = R.tanezumi
R. rattus LII Large, longtailed, scansorial
Primary forest tourban
BA?, LE, PL, SC, TY,
RrC LIII Asian R. rattuspart ?
Uncategorised R. tanezumipart
Notsampled
Notsampled
R. rattus LIII Medium-sized, longtailed, scansorial
Poorly known;includes urban
?
RrC LIV Asian R. rattuspart 2n = 401
R. tanezumisouthern
R. tanezumipart
diardiclade
R3 R. rattus LIV Large, longtailed, scansorial
Primary forest tourban
PL?, TY?
RrC LV R. losea part2
2n = 42R. loseawestern
R. losea part Notsampled
R4 = R.losea
R. sakeratensis Small, shorttailed, terrestrial
Primary forest toagricultural fields
?
RrC LVI R. rattustiomanicus2n = 42
R. tiomanicus R. tiomanicus R.tiomanicus
R5 = R.tiomanicus
R. tiomanicus+R. baluensis
Medium to large,long tailed,scansorial
Primary forest,gardens/plantations;occasionally village
?
R. losea R. losea part3
2n = 42R. loseaeastern
R. losea part Notsampled
Notsampled
R. losea ? ? ?
1A 2n = 40 karyotype was reported by Yosida [8] from specimens referred to R. kandianus from the central highlands of Sri Lanka. MtDNA sequences reported here fromthe same locality are attributable to RrC LIV.
2Karyotypes of 2n = 42 reported by Yosida [8] and Badenhorst et al. [96] as R. losea were obtained from animals from Thailand. MtDNA sequences reported here from thesame locality as Yosida’s samples are attributable to RrC LV.
3Karyotypes of 2n = 42 reported by Yu et al. [97] for R. losea from Taiwan.4Scansorial = able to climb and frequently doing so, but not restricted to arboreal existence.5The degree of commensalism of each lineage.6Probable disease associations are inferred from geographic distribution of lineages and diseases reported from ‘Rattus rattus’. Disease codes: BA: Bartonella infections;CD: Chagas Disease; LE: Leptospirosis; LM: Leishmaniasis; PL: Plague; RV: Rift Valley fever; SC: Schistosomiasis; TM: Trypanosomiasis; TY: Typhus (Rickettsial); WN: WestNile Encephalitis. See Table S3, References S1 for further details and referencing of disease associations.
doi:10.1371/journal.pone.0026357.t001
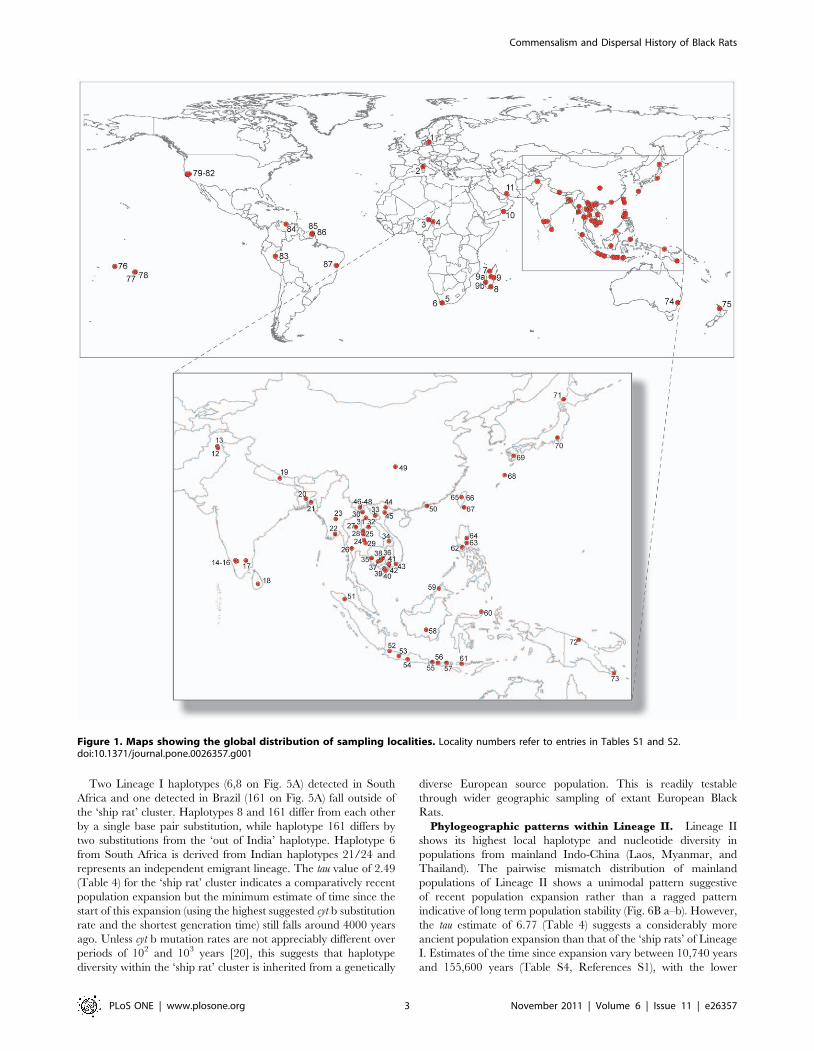
Figure 2. Phylogenetic tree produced with Bayesian Inference using MCMC. The tips are labelled with codes that identify a uniquecombination of haplotype and locality (i.e. an identical haplotype only appears more than once if it was found at different localities). The full detailsfor each tip code appear in Table S1. This tree also shows relationships outside of the Rattus rattus Complex. Numbers on nodes are Bayesianposterior probabilities.doi:10.1371/journal.pone.0026357.g002
Commensalism and Dispersal History of Black Rats
PLoS ONE | www.plosone.org 5 November 2011 | Volume 6 | Issue 11 | e26357
the network suggests limited subsequent exchange of Lineage IV
haplotypes between the Sundaic islands and mainland Indochina.
A haplotype detected thus far only in rats from the Sri Lankan
highlands is positioned somewhat ambiguously on the network,
either as a derivative of the ‘Sundaic’ cluster or as an independent
derivative of a Cambodian haplotype (65 on Fig. 7A).
Notes on Lineages V and VI. To help clarify the taxonomic
identity of Lineage V we obtained from the National Museum
Sweden, Stockholm, a small piece of skin with hair attached from
the lectotype of Rattus sakeratensis Gyldenstolpe, 1917, a puppet skin
collected at Sakerat in eastern Thailand. This taxon is currently
treated as a synonym of R. losea [16,21] and is the earliest available
name for ‘R. losea’ from Indochina. By using aDNA methods we
generated good quality sequence for a 437 bp section of cyt b and a
Bayesian inference phylogenetic analysis resulted in strongly
supported assignment of the resultant haplotype within Lineage V.
Within Lineage VI, a haplotype obtained from a specimen of R.
baluensis from Mt Kinabalu, Sabah is nested between haplotypes
derived from R. tiomanicus from Java and Kalimantan.
Phenotypic and ecological differentiationRats with mtDNA Lineages I–IV are all superficially alike, with
tails that equal or exceed the length of the body, feet that are
moderately broad, and prominent plantar pads. These features are
consistent with the scansorial lifestyle of Black Rats. Dorsal and
ventral pelage coloration is highly variable within populations
Figure 3. Divergence time estimates for key diversification events in the Rattini and the Rattus rattus Complex. Result of BEAST analysisusing an uncorrelated lognormal relaxed-clock model and with HKY+I+G6 nucleotide substitution model on data partitioned by the three codonpositions. MCMC analyses were run for 30,000,000 steps, with posterior samples drawn every 1000 steps after a burn-in of 3,000,000 steps. Thegeneral constant size coalescent model was used as tree prior. Divergence time estimates for labelled nodes A–E are shown in Table S3, ReferencesS1.doi:10.1371/journal.pone.0026357.g003
Table 2. Total nucleotide divergence (Dxy; above diagonal) and net nucleotide divergences (Da; below diagonal) between the sixlineages of the Rattus rattus Complex.
Lineage I Lineage II Lineage III Lineage IV Lineage V Lineage VI
Lineage I (n = 35) - 0.035060.0014 0.046860.0059 0.057560.0029 0.062360.0069 0.050060.0064
Lineage II (n = 40) 0.028360.0014 - 0.047860.0059 0.060860.0029 0.062560.0065 0.049360.0058
Lineage III (n = 3) 0.033860.0381 0.037660.0061 - 0.057460.0090 0.058760.0202 0.050360.0194
Lineage IV (n = 22) 0.048560.0506 0.052460.0029 0.047260.0092 - 0.035960.0051 0.046860.0074
Lineage V (n = 4) 0.056060.0585 0.057060.0065 0.051460.0203 0.029860.0306 - 0.040960.0142
Lineage VI (n = 3) 0.037760.0392 0.036860.0063 0.036160.0196 0.034360.0078 0.031460.0144 -
All values are calculated with the Jukes-Cantor correction. Number of distinct haplotypes shown in row headings.doi:10.1371/journal.pone.0026357.t002
Commensalism and Dispersal History of Black Rats
PLoS ONE | www.plosone.org 6 November 2011 | Volume 6 | Issue 11 | e26357
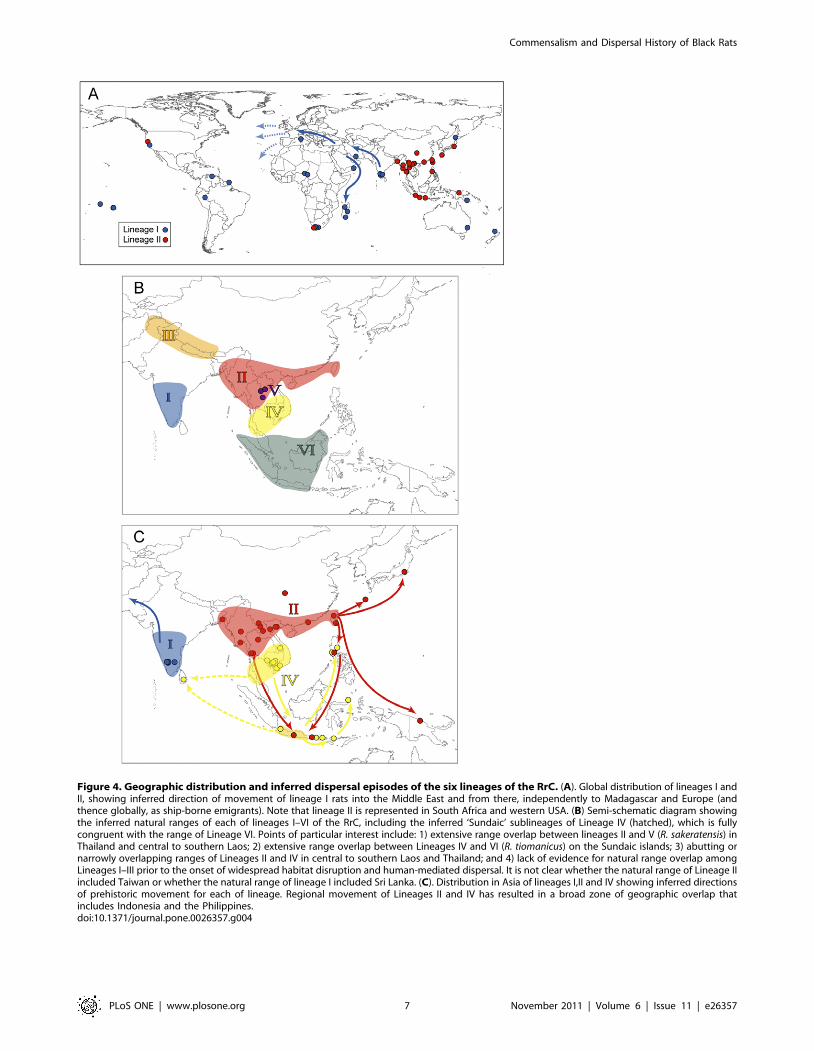
Figure 4. Geographic distribution and inferred dispersal episodes of the six lineages of the RrC. (A). Global distribution of lineages I andII, showing inferred direction of movement of lineage I rats into the Middle East and from there, independently to Madagascar and Europe (andthence globally, as ship-borne emigrants). Note that lineage II is represented in South Africa and western USA. (B) Semi-schematic diagram showingthe inferred natural ranges of each of lineages I–VI of the RrC, including the inferred ‘Sundaic’ sublineages of Lineage IV (hatched), which is fullycongruent with the range of Lineage VI. Points of particular interest include: 1) extensive range overlap between lineages II and V (R. sakeratensis) inThailand and central to southern Laos; 2) extensive range overlap between Lineages IV and VI (R. tiomanicus) on the Sundaic islands; 3) abutting ornarrowly overlapping ranges of Lineages II and IV in central to southern Laos and Thailand; and 4) lack of evidence for natural range overlap amongLineages I–III prior to the onset of widespread habitat disruption and human-mediated dispersal. It is not clear whether the natural range of Lineage IIincluded Taiwan or whether the natural range of lineage I included Sri Lanka. (C). Distribution in Asia of lineages I,II and IV showing inferred directionsof prehistoric movement for each of lineage. Regional movement of Lineages II and IV has resulted in a broad zone of geographic overlap thatincludes Indonesia and the Philippines.doi:10.1371/journal.pone.0026357.g004
Commensalism and Dispersal History of Black Rats
PLoS ONE | www.plosone.org 7 November 2011 | Volume 6 | Issue 11 | e26357
carrying each of mtDNA Lineages I, II and IV, with the dorsal
pelage showing a range of reddish to brown hues peppered with
black, and the ventral fur variably pure white to cream, or grey-
based but bearing cream to buff or greyish tipping. Melanistic
individuals with grey to black fur typically show no differentiation
in dorsal and ventral fur colour. Cranial and dental morphology is
variable between populations but it is not clear whether or not the
variation between rats with contrasting mtDNA lineages exceeds
Figure 5. Population genetic analyses of lineage I of the RrC. A) Median Joining Networks. On the left network, the observed haplotypes areidentified by country of origin (country codes are: AU: Australia; BR: Brazil: FR: France; GU: Guinea; GY: Guyana; IN: India; IR: Iran; JA: Japan; MA:Madagascar; NZ: New Zealand; OM: Oman; PA: Papua New Guinea; SA: Samoa; SE: Senegal; SI: Society Islands; SO: South Africa; US: United States ofAmerica; VE: Venezuela); on the right network they are identified by haplotype number as listed in Table S2. In both networks, multiple codes ornumbers within a single node signify an identical haplotype coming from more than one country or locality within a country. Haplotypes markedwith an asterisk are short sequences and their position on the network was inferred from a separate network analysis that produced an otherwiseidentical topology; B) Pairwise mismatch analyses. Separate analyses were carried out for specimens derived from the inferred natural range ofLineage I on the Indian subcontinent (a–b) and for specimens belonging to the European Black Rat population and its global ‘ship rat’ derivatives (c–d). For each population, the mismatch distribution is compared with curves derived from coalescent simulations under contrasting models of stable(a,c) or fluctuating (b,d) populations.doi:10.1371/journal.pone.0026357.g005
Commensalism and Dispersal History of Black Rats
PLoS ONE | www.plosone.org 8 November 2011 | Volume 6 | Issue 11 | e26357
that observed within single lineages. Detailed morphometric
analyses are currently underway to further explore this variability.
Rats with Lineages I–IV all can be found as commensal
populations as well as pests in agricultural fields. Rats with
Lineages II and IV are also known from natural forest habitats in
Southeast Asia where they tend to be comparatively scarce except
in areas of recent disturbance.
Rats with mtDNA Lineage V are consistently smaller than the
others and have narrower hind feet and shorter tails than any of
the typical Black Rats. A more detailed morphological description
of this taxon is available from accounts in which they were treated
as a regional variant of R. losea [16,21]. Field studies of RrC
Lineage V rats in Cambodia indicate that they are non-
commensal but common in agricultural fields [22].
Rats with mtDNA Lineage VI are similar in body form to the
typical Black Rats but most have greyer dorsal pelage, usually
combined with a cream ventral fur. These rats are consistent with
descriptions of R. tiomanicus [21,23]; these accounts should be
consulted for a detailed account of external and cranio-dental
differentiation from typical Black Rats. Rattus tiomanicus is common
in secondary forest and plantations, and less so close to human
habitation [21].
Discussion
Our study provides the first global perspective on the
evolutionary history of Black Rats and their close relatives.
Though many gaps remain in our geographic coverage, our
sampling in the key ancestral region of South and Southeast Asia is
sufficiently dense to support a new hypothesis on the evolutionary
origin and diversification of Rattus rattus. Additionally, our findings
yield key insights into the complex dispersal history within the
group, and provide new perspectives on the origin of commen-
salism in the group and on the diverse zoonotic disease
associations of Black Rats. Our results also clarify the taxonomic
identity of the short-tailed Indochinese rats currently but
erroneously included within R. losea.
Evolutionary history and taxonomy of the Rattus rattusComplex
The mtDNA gene tree presented here portrays the RrC as one
element of geographically dispersed but comparatively recent
radiation within the genus Rattus that includes a number of other
species with Indochinese (e.g. R. andamanensis, R. argentiventer, R.
losea), Himalayan (R. pyctoris), and Indo-Malayan distributions (R.
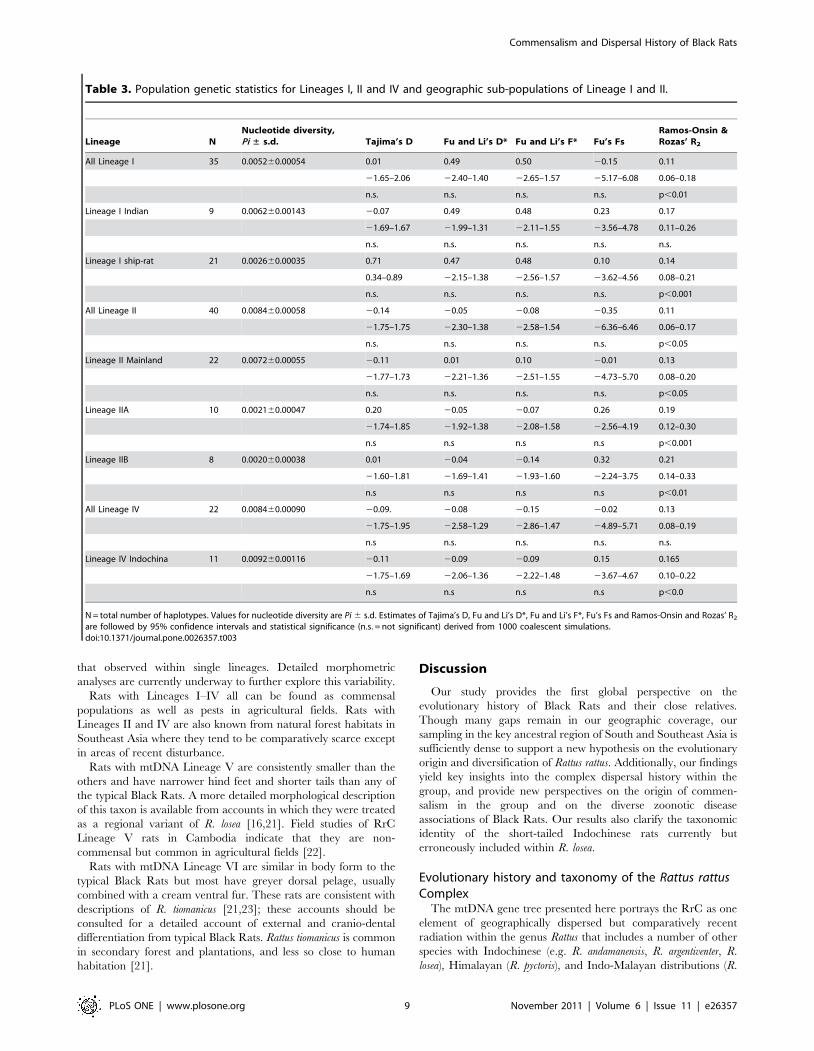
Table 3. Population genetic statistics for Lineages I, II and IV and geographic sub-populations of Lineage I and II.
Lineage NNucleotide diversity,Pi ± s.d. Tajima’s D Fu and Li’s D* Fu and Li’s F* Fu’s Fs
Ramos-Onsin &Rozas’ R2
All Lineage I 35 0.005260.00054 0.01 0.49 0.50 20.15 0.11
21.65–2.06 22.40–1.40 22.65–1.57 25.17–6.08 0.06–0.18
n.s. n.s. n.s. n.s. p,0.01
Lineage I Indian 9 0.006260.00143 20.07 0.49 0.48 0.23 0.17
21.69–1.67 21.99–1.31 22.11–1.55 23.56–4.78 0.11–0.26
n.s. n.s. n.s. n.s. n.s.
Lineage I ship-rat 21 0.002660.00035 0.71 0.47 0.48 0.10 0.14
0.34–0.89 22.15–1.38 22.56–1.57 23.62–4.56 0.08–0.21
n.s. n.s. n.s. n.s. p,0.001
All Lineage II 40 0.008460.00058 20.14 20.05 20.08 20.35 0.11
21.75–1.75 22.30–1.38 22.58–1.54 26.36–6.46 0.06–0.17
n.s. n.s. n.s. n.s. p,0.05
Lineage II Mainland 22 0.007260.00055 20.11 0.01 0.10 20.01 0.13
21.77–1.73 22.21–1.36 22.51–1.55 24.73–5.70 0.08–0.20
n.s. n.s. n.s. n.s. p,0.05
Lineage IIA 10 0.002160.00047 0.20 20.05 20.07 0.26 0.19
21.74–1.85 21.92–1.38 22.08–1.58 22.56–4.19 0.12–0.30
n.s n.s n.s n.s p,0.001
Lineage IIB 8 0.002060.00038 0.01 20.04 20.14 0.32 0.21
21.60–1.81 21.69–1.41 21.93–1.60 22.24–3.75 0.14–0.33
n.s n.s n.s n.s p,0.01
All Lineage IV 22 0.008460.00090 20.09. 20.08 20.15 20.02 0.13
21.75–1.95 22.58–1.29 22.86–1.47 24.89–5.71 0.08–0.19
n.s n.s. n.s. n.s. n.s.
Lineage IV Indochina 11 0.009260.00116 20.11 20.09 20.09 0.15 0.165
21.75–1.69 22.06–1.36 22.22–1.48 23.67–4.67 0.10–0.22
n.s n.s n.s n.s p,0.0
N = total number of haplotypes. Values for nucleotide diversity are Pi 6 s.d. Estimates of Tajima’s D, Fu and Li’s D*, Fu and Li’s F*, Fu’s Fs and Ramos-Onsin and Rozas’ R2
are followed by 95% confidence intervals and statistical significance (n.s. = not significant) derived from 1000 coalescent simulations.doi:10.1371/journal.pone.0026357.t003
Commensalism and Dispersal History of Black Rats
PLoS ONE | www.plosone.org 9 November 2011 | Volume 6 | Issue 11 | e26357
exulans). The Norway Rat (R. norvegicus), the type species of the
genus Rattus, appears to be phyletically more remote, as are several
less well-known species of Rattus (e.g. R. satarae of western India).
Our molecular clock estimates of initial diversification of Rattus
at 3.5 mya and for the origin of the RrC at 1.0 mya are consistent
with other recent estimates based on small numbers of whole
mtDNA genomes [24] and multiple unlinked genes [25–27] and
with the earliest occurrence of fossils attributable to the RrC in
deposits of middle Pleistocene age in Thailand [28] and Java [29].
The Javan deposits, dated to around 1 million years ago, contain
two possible members of this group, one with morphological
affinities with R. rattus, the other closer to R. tiomanicus.
The six primary mtDNA lineages within the RrC show only
partial correspondence either with currently recognised Rattus
species or with chromosomally defined ‘races’ of R. rattus. Lineage
I does show good fidelity with populations commonly identified as
R. rattus, including rats from European and Indian localities, and
with the 2n = 38 ‘Oceanian’ karyotype of Yosida [9]. By contrast,
populations with Lineages II, III and IV would all be regarded as
R. tanezumi under current taxonomy. Most populations associated
with these lineages have 2n = 42 karyotypes (‘Asian’ of Yosida’s
terminology) but one population of Lineage IV on Sri Lanka has
2n = 40 [8]. Himalayan populations sampled by Yosida [8] have
2n = 42 but the mtDNA affinity of the karyotyped rats is unknown.
Lineage IV was detected by each of Robins et al. [30], who
suggested a possible association with R. rattus diardii, and Pages et
al. [14], who considered it to be a novel taxon based on attributes
of tree topology as well as regional sympatry with Lineage II in
Thailand. Our results confirm those of Pages et al. [14] in
suggesting a closer relationship of Lineage IV with several other
currently recognised species of Rattus, represented in our study by
Lineages V and VI.
Lineage V corresponds with cluster R4 of Pages et al. [14] who
identified it as R. losea. Unlike all previous assessments, our study
included exemplars of true R. losea from the type locality of
Taiwan, as well as from multiple localities in southern China,
northern and southern Vietnam, and Cambodia. These popula-
tions cluster separately from the Thai and Laotian rats of Lineage
V, and fall outside of the RrC as defined here. Morphological
comparisons, to be presented elsewhere, also highlight the
distinction between the Thai/Laotian populations and true R.
losea and favour recognition of Lineage V as a distinct species. The
nomenclature of this previously unsuspected member of the genus
Rattus is resolved in the following section. Morphological and
ecological similarity between this taxon and true R. losea might be
due to retained ancestral ecomorphology or to a parallel terrestrial
adaptation. The pattern of ecomorphological evolution within the
genus will become clear once details of Rattus phylogeny are
clarified by wider genome sampling.
Lineage VI includes R. tiomanicus of the Malay Peninsula and the
Sundaic islands, and R. baluensis, a montane endemic of
northwestern Borneo. Rattus tiomanicus is broadly co-distributed
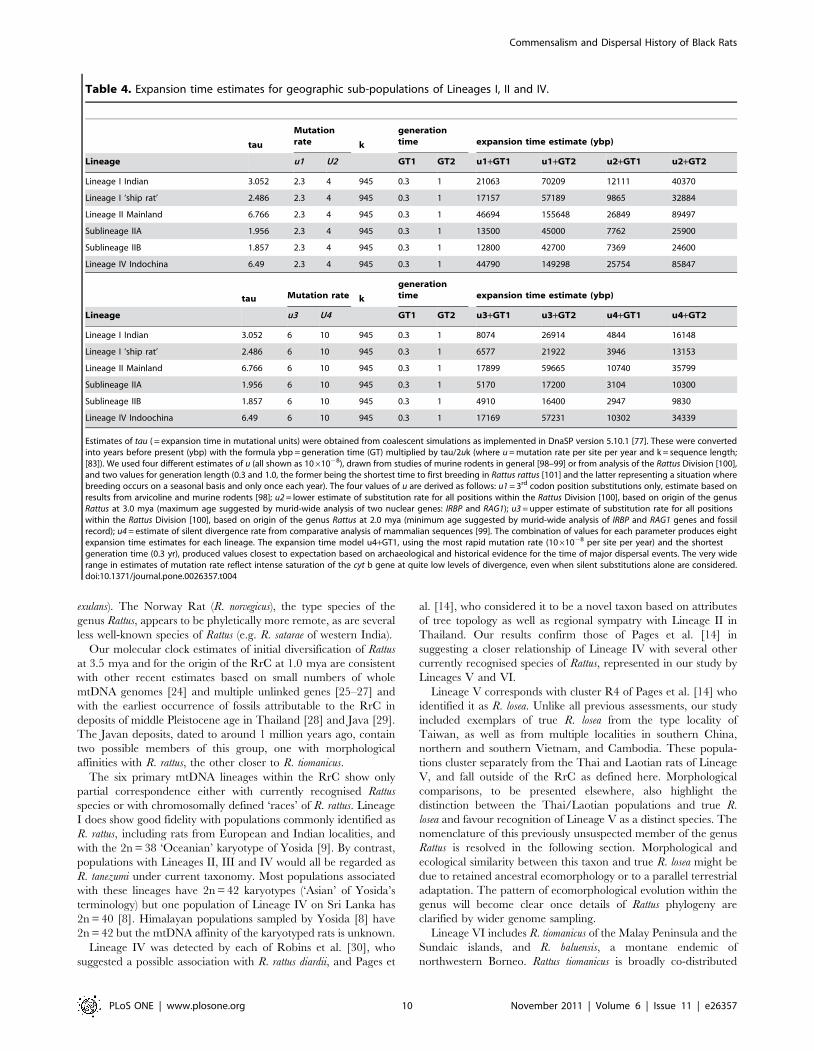
Table 4. Expansion time estimates for geographic sub-populations of Lineages I, II and IV.
tau
Mutationrate k
generationtime expansion time estimate (ybp)
Lineage u1 U2 GT1 GT2 u1+GT1 u1+GT2 u2+GT1 u2+GT2
Lineage I Indian 3.052 2.3 4 945 0.3 1 21063 70209 12111 40370
Lineage I ‘ship rat’ 2.486 2.3 4 945 0.3 1 17157 57189 9865 32884
Lineage II Mainland 6.766 2.3 4 945 0.3 1 46694 155648 26849 89497
Sublineage IIA 1.956 2.3 4 945 0.3 1 13500 45000 7762 25900
Sublineage IIB 1.857 2.3 4 945 0.3 1 12800 42700 7369 24600
Lineage IV Indochina 6.49 2.3 4 945 0.3 1 44790 149298 25754 85847
tau Mutation rate k
generationtime expansion time estimate (ybp)
Lineage u3 U4 GT1 GT2 u3+GT1 u3+GT2 u4+GT1 u4+GT2
Lineage I Indian 3.052 6 10 945 0.3 1 8074 26914 4844 16148
Lineage I ‘ship rat’ 2.486 6 10 945 0.3 1 6577 21922 3946 13153
Lineage II Mainland 6.766 6 10 945 0.3 1 17899 59665 10740 35799
Sublineage IIA 1.956 6 10 945 0.3 1 5170 17200 3104 10300
Sublineage IIB 1.857 6 10 945 0.3 1 4910 16400 2947 9830
Lineage IV Indoochina 6.49 6 10 945 0.3 1 17169 57231 10302 34339
Estimates of tau ( = expansion time in mutational units) were obtained from coalescent simulations as implemented in DnaSP version 5.10.1 [77]. These were convertedinto years before present (ybp) with the formula ybp = generation time (GT) multiplied by tau/2uk (where u = mutation rate per site per year and k = sequence length;[83]). We used four different estimates of u (all shown as 1061028), drawn from studies of murine rodents in general [98–99] or from analysis of the Rattus Division [100],and two values for generation length (0.3 and 1.0, the former being the shortest time to first breeding in Rattus rattus [101] and the latter representing a situation wherebreeding occurs on a seasonal basis and only once each year). The four values of u are derived as follows: u1 = 3rd codon position substitutions only, estimate based onresults from arvicoline and murine rodents [98]; u2 = lower estimate of substitution rate for all positions within the Rattus Division [100], based on origin of the genusRattus at 3.0 mya (maximum age suggested by murid-wide analysis of two nuclear genes: IRBP and RAG1); u3 = upper estimate of substitution rate for all positionswithin the Rattus Division [100], based on origin of the genus Rattus at 2.0 mya (minimum age suggested by murid-wide analysis of IRBP and RAG1 genes and fossilrecord); u4 = estimate of silent divergence rate from comparative analysis of mammalian sequences [99]. The combination of values for each parameter produces eightexpansion time estimates for each lineage. The expansion time model u4+GT1, using the most rapid mutation rate (1061028 per site per year) and the shortestgeneration time (0.3 yr), produced values closest to expectation based on archaeological and historical evidence for the time of major dispersal events. The very widerange in estimates of mutation rate reflect intense saturation of the cyt b gene at quite low levels of divergence, even when silent substitutions alone are considered.doi:10.1371/journal.pone.0026357.t004
Commensalism and Dispersal History of Black Rats
PLoS ONE | www.plosone.org 10 November 2011 | Volume 6 | Issue 11 | e26357
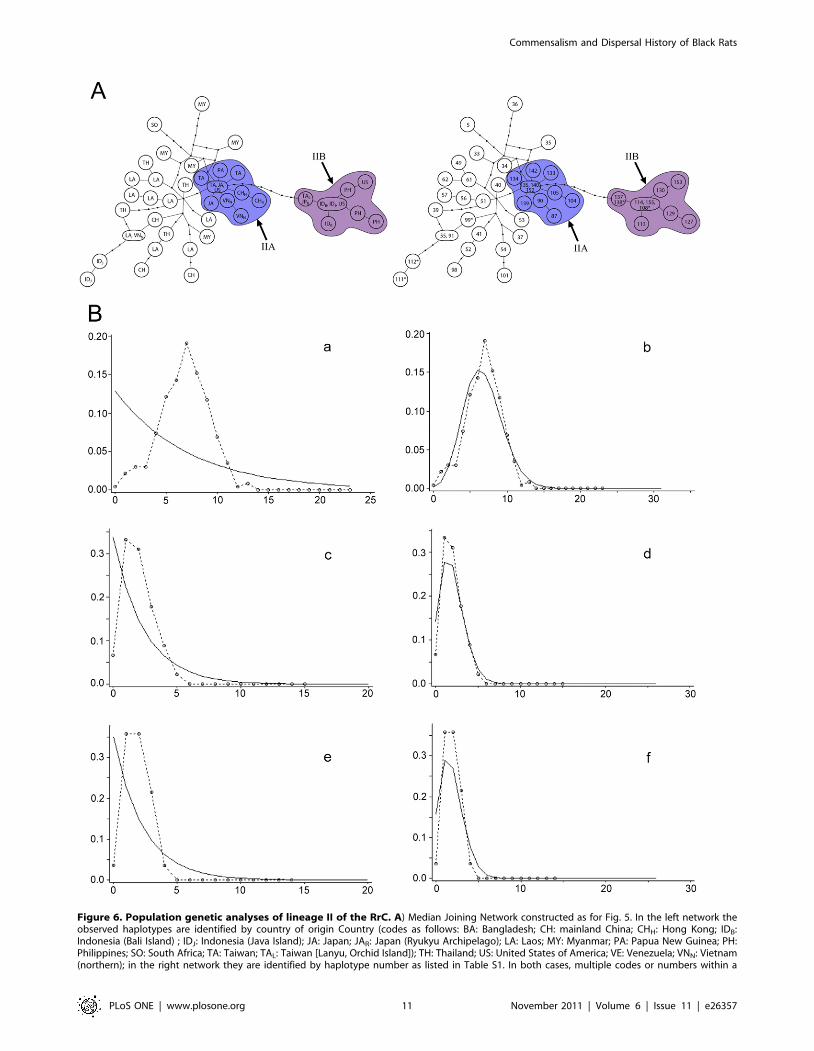
Figure 6. Population genetic analyses of lineage II of the RrC. A) Median Joining Network constructed as for Fig. 5. In the left network theobserved haplotypes are identified by country of origin Country (codes as follows: BA: Bangladesh; CH: mainland China; CHH: Hong Kong; IDB:Indonesia (Bali Island) ; IDJ: Indonesia (Java Island); JA: Japan; JAR: Japan (Ryukyu Archipelago); LA: Laos; MY: Myanmar; PA: Papua New Guinea; PH:Philippines; SO: South Africa; TA: Taiwan; TAL: Taiwan [Lanyu, Orchid Island]); TH: Thailand; US: United States of America; VE: Venezuela; VNN: Vietnam(northern); in the right network they are identified by haplotype number as listed in Table S1. In both cases, multiple codes or numbers within a
Commensalism and Dispersal History of Black Rats
PLoS ONE | www.plosone.org 11 November 2011 | Volume 6 | Issue 11 | e26357
with ‘typical’ Black Rats across a large geographic area and
displays a consistent morphological segregation [23]. It inhabits
both forest and disturbed habitats but, unlike the Black Rats,
generally avoids villages and towns. The restricted montane
endemic R. baluensis is phenotypically well-differentiated from each
of R. tiomanicus and the Black Rats [23]. Our result suggests that R.
baluensis may have arisen by local adaptive divergence or drift from
within the more widespread R. tiomanicus. However, other
interpretations are possible, most notably that R. tiomanicus
mtDNA has introgressed into R. baluensis. The correct scenario
will be decided by closer examination of the genetic history of
these groups on a regional to local scale.
Figure 7. Population genetic analyses of lineage IV of the RrC. A) Median Joining Network, constructed as for Fig. 5. In the left network theobserved haplotypes are identified by country of origin [Country codes CA: Cambodia; IDF: Indonesia (Flores Island); IDL: Indonesia (Lombok Island);IDJ: Indonesia (Java); IDS: Indonesia (Sulawesi); IDW: Indonesia (Sumbawa Island); LA: Laos; PH: Philippines; SL: Sri Lanka; VNS: Vietnam (southern)]; inthe right network they are identified by haplotype number as listed in Table S1. In both cases, multiple codes or numbers within a single nodesignifies an identical haplotype coming from more than one country or locality within a country. Haplotypes marked with an asterisk are shortsequences and their position on the network was inferred from a separate TCS analysis that produced an otherwise identical topology. B) Pairwisemismatch analyses for mainland Indochinese samples of Lineage IV, calculated as for Fig. 5. The inferred Sundaic sublineages are excluded from thisanalysis because the majority derive from islands where archaeological evidence independently documents recent prehistoric introductions. Themismatch distribution is compared with curves derived from coalescent simulations under contrasting models of stable (a) or fluctuating (b)populations.doi:10.1371/journal.pone.0026357.g007
single node signifies an identical haplotype coming from more than one country or locality within a country. Haplotypes marked with an asterisk areshort sequences and their position on the network was inferred from a separate TCS analysis that produced an otherwise identical topology. B)Pairwise mismatch analyses, calculated as for Fig. 5. Separate analyses were carried out for specimens derived from the inferred natural range oflineage II on the Indochinese mainland (a–b) and for specimens belonging to each of sub-lineages IIA (c–d) and IIB (e–f) that derive mainly from areasof the western Pacific where archaeological evidence independently documents recent prehistoric introductions. For each population, the mismatchdistribution is compared with curves derived from coalescent simulations under contrasting models of stable (a) or fluctuating (b) populations.doi:10.1371/journal.pone.0026357.g006
Commensalism and Dispersal History of Black Rats
PLoS ONE | www.plosone.org 12 November 2011 | Volume 6 | Issue 11 | e26357
Paraphyly of the ‘typical’ Black Rats is an intriguing prospect
but whether or not the mtDNA trees accurately portray the
evolutionary history of the RrC requires confirmation with
additional, unlinked genes. An alternative scenario that needs to
be excluded is ancient introgression into a population of Black
Rats in the Lower Mekong catchment or Sundaic area from a now
extinct Clade B mitochondrial lineage. However, any such event
would need to predate diversification within Lineage IV, which is
estimated to have commenced around 0.25 myr ago. Nuclear gene
trees that show well-supported monophyly of Lineage IV with the
other Black Rats would favour this history.
Leaving aside this issue of paraphyly, the deep and geograph-
ically highly structured mitochondrial diversity among the Black
Rats suggests an ancient range expansion that resulted in broad
colonisation of mainland Indochina and South Asia, followed by
long history of allopatric divergence of at least partially isolated
populations. Based on patterns of haplotype and nucleotide
diversity, the likely geographic focus of diversification within each
lineage was: eastern and southern India for Lineage I; the western
part of Indochina and uplands of eastern Indochina for Lineage II;
the Himalayan foothills for Lineage III; and the lower Mekong
River catchment for Lineage IV. These geographic populations
probably remained at least partially isolated, at least to mtDNA
diffusion, until the emergence of human agricultural communities
and later still, regional civilizations, provided Black Rats with the
opportunity for local, regional, and eventually, global dispersal.
The current taxonomic arrangement of the Black Rats into two
species (R. rattus and R. tanezumi) does not rest easily atop this
model of multi-regional differentiation. However, the model itself
suggests a way toward taxonomic rationalization. As commonly
acknowledged by evolutionary biologists [31], allopatric diver-
gence is probably the most common route to speciation among
higher vertebrates, yet paradoxically, it is allopatric populations
that generate most taxonomic uncertainty and dispute. The core
issue is whether allopatric populations are sufficiently differenti-
ated to warrant recognition at either subspecies or species level. If
spatial isolation of the populations is absolute, the decision may
need to be an arbitrary one, at best guided by some ‘yardstick’ of
acceptable intra-populational variation [32]. However, in many
cases, secondary contact occurs either in natural or artificial
contexts, and while this may not replicate natural interaction, it
does provide an opportunity to assess the strength of reproductive
isolation. Possible scenarios include unhindered gene flow
(indicating no effective postzygotic isolation; often taken as
evidence for lack of speciation); limited introgression involving
parts of the genome only, with establishment of a stable or
gradually fluctuating hybrid zone (variably taken as grounds for
species or subspecies recognition); and establishment of sympatry
or parapatry without significant gene flow (indicative of species
level differentiation). In the absence of natural secondary contact,
laboratory crosses or other kinds of artificial contact provide useful
clues to possible biological outcomes.
In the case of the Black Rats, the location of possible natural
contact zones between mtDNA lineages is not yet known. However,
there is a significant body of information available on laboratory
crosses; and the complex history of human-assisted dispersals has
produced a number of instances of artificial secondary contact.
Laboratory crossing experiments have focussed on the potential
post-zygotic barriers generated by various chromosomal rearrange-
ments [7]. Crosses among rats with 2n = 38 (Lineage I), 2n = 42
(Lineage II) and 2n = 40 from Sri Lanka (Lineage IV) karyotypes all
produced viable F1 hybrids that reached sexual maturity. However,
F2 hybrids were produced with difficulty in all cross combinations
except for the 2n = 38 and 2n = 40 (Sri Lanka) pairing.
Yosida [8] identified a few localities where multiple chromo-
somal races had come into secondary contact. These were
identified initially through recognition of hybrid karyotypes and
in one case, investigated further through serology and allozyme
analysis. More recently, instances of multiple introductions
involving Lineages I and II have been reported in Japan
[12,33], in South Africa [34], on the west coast of the United
States [this paper], and in Australia [35–36]. In the cases where
data that can used to assess gene flow was obtained, the analyses
suggest a moderate to high level of gene flow among the
immigrant populations, though perhaps with variable outcomes.
In South Africa, Black Rats with mtDNA Lineages I and II
generally have 38 and 42 chromosomes, respectively, though two
possible F1 hybrids with 2n = 40 were observed in a series of eight
individuals with Lineage I cyt b haplotypes [34]. Similar fidelity
between chromosomal races and mtDNA lineages was reported by
Chinen et al. [12] in the case of a recently introduced population
of Lineage I rats with 2n = 38 in a predominantly 2n = 42 Lineage
II stronghold in northern Hokkaido, Japan. However, Chinen et
al. [12] reported evidence for wider introgression of nuclear genes
associated with Lineage I rats, perhaps due to an earlier,
undocumented introduction. Kambe et al. [33] also identified
likely introgression of Lineage I genetic material in Japan,
involving the nuclear Mc1r gene.
Taking into account all available lines of evidence, we advocate
an abandonment of the current bipartite separation of R. tanezumi
from R. rattus. However, because we suspect that each of the four
allopatric populations of Black Rats will prove to have significant
descriptive utility and will ultimately be accorded some taxonomic
recognition (if only as subspecies), we recommend the use of an
informal taxonomy that recognizes each of the four naturally
occurring allopatric populations according to their mtDNA
lineage; i.e. as Rattus rattus Lineages I–IV. This is preferable to
attempting to fix species or subspecies names at this point in time
for each of the regional forms, due to the need for resolution of
various nomenclatural issues including the status of various early
names (e.g. Mus asiaticus Gray, 1837; Mus indicus Desmarest, 1822)
and the genetic identity of early name-bearing specimens from
localities where a history of multiple introductions and genetic
admixture is likely (e.g. Sri Lanka). Furthermore, we caution that
significant introgression may have occurred, even within parts of
the ancestral areas of each lineage, such that the mtDNA identity
of an individual or even an entire population might not reflect its
dominant genetic identity. Broad genome sampling will be
required to clarify the extent of these problems and ultimately
lay the foundation for a more stable taxonomy of the Rattus rattus
Complex.
The identity of RrC Lineage VThere appears to be only one available name for the taxon
represented by mtDNA Lineage V. Rattus sakeratensis Gyldenstolpe,
1917 (type locality: Sakerat, eastern Thailand) was erroneously
described on a study skin of a Rattus mismatched with a skull of
Maxomys whiteheadi. Marshall [21] designated the skin only as the
lectotype and noted its similarity to regional populations referred
to R. losea (Swinhoe, 1871). One other available name for a
member of the RrC comes from within the known or inferred
range of Lineage V is Rattus rattus thai Kloss, 1917 (type locality:
Raheng, central Thailand), but this is a larger, longer-tailed
animal that is more likely associated with RrC Lineage II or IV.
The type locality of Mus losea Swinhoe, 1871 is Taiwan. Musser
and Newcomb [16] noted slight differences in external and cranial
morphology between the regional sample from Indochina and
samples of typical R. losea from Taiwan and adjacent parts of
Commensalism and Dispersal History of Black Rats
PLoS ONE | www.plosone.org 13 November 2011 | Volume 6 | Issue 11 | e26357
China, and our studies (to be presented elsewhere) confirm this
distinction. Rattus rattus exiguus Howell, 1927, described from
Yenpingfu, Fukien Province, China, is regarded as a synonym of
losea [16,21].
A skin and hair sample from the lectotype of R. sakeratensis
(Royal Natural History Museum, Stockholm, Mammals 560932)
produced a partial cyt b sequence (GenBank JN812337) that
clusters unambiguously with Lineage V of the RrC. While this
result is consistent with Marshall’s morphological assessment of the
lectotype as a specimen of ‘R. losea’, caution is required over
several points: 1) potential contamination of the lectotype with
mtDNA from another specimen of R. sakeratensis, either in the host
museum or the laboratory; 2) potential retention of an ancestral
allele; and 3) potential genetic exchange between the lectotype
individual of R. sakeratensis and another naturally co-occurring
population of Rattus.
DNA contamination of the lectotype seems unlikely as there was
no possible source for an appropriate contaminant. The lectotype
was the only example of this taxon collected by Gyldenstolpe in
Thailand [37] and the National Museum of Sweden holds no
other collections that might include other examples of R.
sakeratensis. The skin sample provided for our study remained in
a sealed container until it was opened within the ancient DNA
facility. Although other samples of Rattus had been processed in the
ancient DNA facility, these did not include any other specimens of
Lineage V of the RrC. Accordingly, we have full confidence that
the extracted mtDNA derived from the skin sample.
The reciprocal monophyly of cyt b lineages within the RrC
clearly argues against retention of an ancestral allele. However,
genetic exchange between Lineage V and a different species of
Rattus cannot be entirely ruled out as a possibility. However, two
points argue against hybridization or genetic introgression. The
first is the agreement between the morphological and genetic
assessment of the specimen. Small body size, a short tail relative to
body length, and relative small narrow feet are some of the
features that distinguish rats of Lineage V from most other species
of Rattus found in central Thailand (i.e. R. rattus and R. argentiventer,
R. andamanensis), while larger body size, a non-spinous pelage and
larger feet distinguish Lineage V rats from R. exulans [15,21]. The
second is the fact that specimens identified on morphological
criteria as ‘R. losea’ from Thailand and Laos have thus far yielded
only Lineage V mtDNA, and conversely, no rats with Lineage V
have displayed a contrasting morphology. Thus, at present, there
is no evidence of mtDNA exchange between rats with mtDNA
Lineage V and other, regionally occurring Rattus species.
Based on this evidence, we identify R. sakeratensis Gyldenstolpe,
1917 as the earliest available name for Lineage V of the RrC and
as a valid species distinct from R. losea and the ‘typical’ Black Rats.
Dispersal and range expansion among the Black RatsPrevious treatments of Black Rat dispersal have focused on the
presumed migration of rats from India to Europe [38], the
historically documented global spread of ship rats [19], and the
prehistoric to recent dispersal of rats in the Western Indian Ocean
[39–40]. The pattern of mitochondrial variation revealed by our
global study clearly depicts each of these events. Additionally,
however, it reveals a number of previously undocumented aspects
of population growth and range expansion among Black Rats, the
majority of which have occurred exclusively with the Asian realm.
Prehistoric to modern dispersals of Lineage I rats. Apart
from a somewhat anomalous record of R. rattus from middle
Pleistocene cave sediments of Turkish Thrace [41], the earliest
evidence of R. rattus in Eurasia comes from the Levant [42], possibly
dated to 15,000 BP or younger [38]. The earliest Mediterranean
records are of pre-Roman age, c. 6000 BP [38] and by the 4th
Century, the roof rat was in Britain [43]). The palaeontological and
archaeological records of the Middle East and Europe suggest a
possible late Pleistocene migration of Black Rats from India to the
Middle East. The mtDNA evidence supports this general notion but
allows further inferences to be drawn regarding the dispersal
process. Remarkably, with the exception of a few haplotypes found
in South Africa and Brazil, all other Lineage I haplotypes detected
outside of western India appear to be derived from a single emigrant
haplotype (number 18 on Fig. 5) which we have dubbed the ‘out of
India’ haplotype. Three independent offshoots of this haplotype are
recorded and all are derived through single base pair substitutions.
One is recorded only in Oman; another gave rise to a star-like
radiation in Madagascar; and a third produced the ‘ship rat’ cluster
which is presumed to represent as yet an otherwise unsampled local
radiation in Europe. Tollenaere et al.’s [40] study of R. rattus in the
Western Indian Ocean shows many of these same features including
the divergent ship rat and Madagascan clusters (labelled Groups C
and B, respectively) and the close association of Group C with a
particular Indian haplotype (labelled Hap4). However, their study
provides an important additional detail, namely the presence in
Oman of multiple highly divergent haplotypes, suggesting either a
long period of residency of Lineage I on the Arabian Peninsula or
multiple dispersals across the Arabian Sea. The absence of shared
haplotypes between their Indian and Oman samples favour the
former interpretation but sampling in both areas is probably
inadequate to rule out either scenarios.
The earliest archaeological evidence of R. rattus in Madagascar
dates to around the 10th Century [44] but the presence of an in situ
radiation with similar nucleotide diversity to that found in the ‘ship
rat’ cluster clearly favours a longer history, perhaps even associated
with the earliest human migrations to Madagascar about 2300 yr
BP [45]. Tollenaere et al. [40] estimated the onset of population
expansion in the immigrant Madagascan Black Rats at around
3000 yr BP which is consistent with this scenario and the notion that
the environment was rapidly transformed following human arrival.
The ‘ship rat’ cluster is a striking feature of the mitochondrial
gene topology and it gives new resonance to previous reports of
low global mitochondrial diversity among historically introduced
populations of R. rattus [5,40]. Given the history of ship-borne
dispersal of Black Rats during the Age of Exploration, the limited
diversity within this group is surely a reflection of low variation
within European source populations, and a strong indication that
Black Rats arrived in Europe only during the Neolithic or Bronze
Age [43,46].
South African Lineage I haplotypes include typical ‘ship rats’ as
well as several others that fall outside of this restricted cluster
(Fig. 5) [34]. These may represent independent dispersal events
that occurred direct from the Middle East or India, possibly with
early Arab trading activities, as suggested previously on morpho-
logical grounds [47]. Alternatively, they might represent otherwise
undetected components of ‘ship rat’ genetic diversity, possibly
coming out one or more restrict source areas in Europe.
Ship-borne dispersal of Lineage I rats presumably continues
today but in many contexts it probably goes undetected. Suzuki
et al. [48] documented the arrival of Lineage I Black Rats at a sea
port on Hokkaido island, Japan, in a context where the dominant
mtDNA is Lineage II. However, studies of Japanese rats using
nuclear markers point to low level contamination of the Japanese
Black Rat population by genetic components derived from earlier
invasions of Lineage I rats [12,33]. The occurrence of non-‘ship
rat’ Lineage I haplotypes in Brazil and South Africa is suggestive of
independent, ship-borne translocations of Black Rats out of India
or the Middle East.
Commensalism and Dispersal History of Black Rats
PLoS ONE | www.plosone.org 14 November 2011 | Volume 6 | Issue 11 | e26357
Prehistoric to modern range expansions and dispersals of
Lineage II and IV rats. Population genetic analyses of Lineage
II haplotypes points to a phase of population growth on mainland
Asia during the terminal Pleistocene or early Holocene.
Palynological evidence records a widespread transition at this
time from broadly distributed pine and oak forests to a more
complex mosaic of broadleaf evergreen and deciduous plant
communities over much of Thailand [49] and southern China
[50], with indications of regular burning in several areas, possibly
due to human activities. These conditions of environmental
instability may have favoured a disturbance specialist and allowed
Black Rats to assume a greater dominance in small mammal
communities. This may have also facilitated geographic range
expansion, although the relatively high haplotype and nucleotide
diversity recorded across much of mainland Indochina suggests a
general pattern of local population growth within an originally
large geographic range, rather than dramatic range expansion into
formerly unoccupied territory. The emergence and spread of
agricultural activities with the resultant modification of natural
into anthropogenic habitats is likely to have further advantaged
populations of Black Rats and provided a context for the
development of close associations between human and rat
populations. Lineage IV shows a similar signal of population
expansion but remains too poorly sampled within its likely natural
range to infer further details of population history.
Islands off the continental shelf of East and Southeast Asia
evidently lacked any form of Black Rat prior to their arrival in the
mid- to late Holocene. Rats are convincingly absent from Japanese
fossil assemblages of late Pleistocene age but are present in
archaeological samples of late Holocene age [51]. Similar evidence
of Holocene introductions is repeated in the fossil and archaeo-
logical record of oceanic islands in eastern Indonesia, e.g. Sulawesi
[29], Flores [52–53] and Timor [28,54] and in wider Melanesia
[55–57], with the earliest evidence for R. rattus both in Timor and
in Micronesia dating to around 3000 BP [28,54–55]. The mtDNA
data provide a clear signal of prehistoric dispersal of Black Rats
into the western Pacific region during the mid- to late Holocene.
The most likely source for dispersal of Lineage II rats, based on the
distribution of ancestral genotypes, is Taiwan or southern China/
northern Indochina. The few available Taiwanese haplotypes are
diverse and distinct from those recorded from mainland localities
and it seems likely that Lineage II occurred naturally on Taiwan,
which had intermittent land connection to mainland China
through the Quaternary [58].
Two sub-lineages of Lineage II were carried into the near
Pacific including Japan and the Philippines, and probably from the
latter, to the islands of eastern Indonesia and Micronesia. The
inferred dispersal of these sub-lineages Lineage II rats parallels the
diaspora of Austronesian-speakers out of Taiwan around 4,000
years ago and the associated spread of agricultural lifestyles
throughout the Philippines, Indonesia, Micronesia and beyond,
into the remote Pacific [59]. Much remains to be learned
regarding the routes and timing of dispersal but it is noteworthy
that Black Rats are recorded archaeologically in Micronesia, near
the geographic terminus of their journey, at ca. 3000 BP [60].
Possible back-migration to coastal areas of mainland Asia, such as
northern Vietnam and Hong Kong Island, is also indicated by the
network structure of sub-lineage IIA.
Approximately synchronous dispersal occurred among several
sub-lineages of Lineage IV. The homeland in this instance appears
to be the Lower Mekong Basin of mainland Indochina, or possibly
the Malay Peninsula which remains unsampled. Somewhat
surprisingly, the Sundaic island of Java appears to lack ancient
haplotype diversity in Lineage IV and it seems likely that this
island did not support a native population of Black Rats, perhaps
because of competition in natural forest habitat with R. tiomanicus.
Two emigrant sub-lineages of IV are represented in the islands
of Indonesia but only one of these is also known from the
Philippines. A dispersal route that involved initial colonisation of
the Sundaic and Wallacean islands seems likely, with later
northward movement into the Philippines (Fig. 4c). The lack of
any haplotype sharing between mainland Indochina and the Indo-
Malayan islands suggests either limited opportunities for dispersal
between these areas following initial establishment, or a strong
local competitive deterrent to back migration.
A Lineage IV haplotype, detected in the Sri Lankan highlands,
represents the soft-furred kandianus form of earlier taxonomies. The
geographic location of this haplotype is not altogether unexpected
given the presence in the 4th Century of outposts of the ancient
Ceylonese Hindu empire on the islands of Java and Bali [61].
However, ambiguity in the haplotype network also leaves open the
possibility of dispersal direct from mainland Indochina (Fig. 4c).
Recent historical periods saw comparatively little dispersal
among Asian rats to match the global spread of the European-
derived ‘ship rats’. Nevertheless, a number of historical or even
contemporary translocations of Lineages II and IV have come to
light through recent genetic screening, including occurrences of
single haplotypes of Lineage II in South Africa, in California, and
in Australia. This most recent phase of Black Rat dispersal is
clearly ongoing and is likely to produce increasingly intermingled
global distributions of the four commensal Black Rat lineages.
Multiple origins of commensalism and its implications forzoonotic diseases
Exactly when and how commensalism arose is not well-
documented for any of the small mammals that have adopted
this way of life. A recent discussion of this issue for Black Rats
postulated a unique origin of commensalism within a population
resident on the Indian subcontinent, perhaps associated with a
genetic innovation in this population [38]. Our results suggest a
very different scenario in which commensalism arose multiple
times and in different geographic populations of Black Rats. This
scenario has important implications for human history as well as
for interpretation of host–pathogen co-evolution in this group of
mammals.
Two observations are critical in inferring that commensalism
arose multiple times among the Black Rats. First, as amply
demonstrated by the BEAST analysis, mtDNA lineage diversifi-
cation among Black Rats is far more ancient than the late
Pleistocene to early Holocene emergence of agriculture or any
form of settled human lifestyle in Asia or elsewhere [59,62–63].
These contrasting time frames are readily accounted for under a
model of multiple origins of commensalism. By contrast, a single
origin hypothesis would require either that commensalism
represents an ancestral condition in the group (a nonsensical
proposition), or that it evolved recently but was subsequently
shared among the sampled populations through gene flow or
‘cultural’ transmission. The latter scenarios warrant consideration
but are at odds with the evidence presented here for well-
maintained phylogeographic structuring in the homeland of the
RrC on mainland Asia.
We postulate that commensalism arose many times among
geographically dispersed populations of Black Rats. Furthermore,
we suggest that this reflects a pre-adaption as disturbance
specialists. Across Indochina, Black Rats of lineages II and IV
are uncommon in primary forest except in areas of local
disturbance, such as along river banks. In contrast, they are the
dominant rodent species in all disturbed and artificial habitats
Commensalism and Dispersal History of Black Rats
PLoS ONE | www.plosone.org 15 November 2011 | Volume 6 | Issue 11 | e26357
within the human-modified landscape [15,64]. The success of
Black Rats in disturbed contexts is readily explained by their
exceptionally high reproductive potential (a product of short
gestation, large litter size, and short period of post-natal
dependency), and their high phenotypic and behavioural plasticity
[1]. Throughout much of Asia today, Black Rats are not obligate
commensals but rather they exploit the entire human landscape of
villages, field complexes, and disturbed forests [64]. Whether
commensal populations show any genetic modification relative to
their wild relatives is not known. However, we might anticipate a
long history of selection for genetic variants that improved survival
and reproduction of individual rats living in and around
agricultural settlements, possibly including socio-behavioural traits
of the kind documented between commensal and non-commensal
populations of house mice [65]. Several authors have noted the
tendency for rural Black Rats populations to be grey-bellied rather
than white-bellied, thereby distinguishing them from the majority
of forest and field inhabiting populations.
Zoonotic diseases associated with Black Rats are remarkable not
only for their diversity but also for their strong but largely
unremarked geographic patterning (Tables 1 and S1). Our
findings cast new light on both issues. As circumscribed here,
the natural range of the RrC encompasses four of the six sub-
regions of the Indo-Malayan zoogeographic realm – the Indian,
Himalayan, Indochinese, and Sundaic sub-regions – each of which
hosts a distinctive mammalian fauna [66]. Many pathogens
detected in species of Rattus have been acquired through host
switching from co-occurring groups of wild mammals [67–68],
and rats living in different zoogeographic region thus are likely to
have acquired regionally distinctive suites of pathogens, leading to
a higher than average pathogen diversity among Black Rats as a
whole. The separate origin of commensal Black Rat populations in
each region, in turn, could be expected to produce regionally
contrasting suites of zoonotic diseases. Future studies of rat-borne
zoonoses clearly need to include genetic typing of the host animals
as a high priority. For some classic disease studies, this may be
possible retrospectively, providing rat populations remain un-
changed. From a historical perspective, our findings also invite
reconsideration of the biological context of various disease
epidemics. For example, we note here that each of the three
plague pandemics are believed to have emerged out of regions
occupied by different lineages of Black Rats (the Justinian Plague
from Africa – lineage I as immigrants; the 14th Century Black
Death from central Asia – most likely within the range of lineage
III; and the 19th Century Pandemic from East Asia – the heartland
of lineage II [69]).
Future research directionsOur findings prompt numerous other questions regarding the
history and biology of the RrC. For example, do the genetically
differentiated regional populations of Black Rats have contrasting
impacts on agricultural systems and natural ecosystems in different
parts of the world? And do subtle biological differences between
the lineages result in different susceptibility to management tools
currently in use, including major classes of rodenticide? Finally,
the known capacity of at least some members of the RrC to
interbreed [8] raises the question of whether populations of mixed
ancestry might possess biological properties different from those of
parental lineages.
While the mitochondrial genetic framework introduced here
represents an important first step towards deeper understanding
the complex and influential relationship that has developed over
millennia between various populations of Black Rats and humans,
exploration of the diversity in the nuclear genome and broader
genetic interactions among members of the RrC will also need to
be articulated before the evolutionary history of Black Rats is
written in its full complexity, and with ongoing dispersal and novel
interactions a high likelihood, new chapters in this history may still
be in the making.
Materials and Methods
Ethics StatementSample collecting by KPA was carried out under CSIRO AEC
Permit No: 00/01 – 28 titled ‘‘Taxonomic studies of agricultural
pest rodents and their relatives in Southeast Asia’’. All other
samples were sourced from existing tissue collections associated
with museum collections.
Sample and locus selectionOur sampling of Black Rats focussed on the Asian region which
is widely regarded as the place of origin of both the genus Rattus
and of Black Rats specifically [8]. However, we also attempted to
include samples from all continents, and from major island groups
(Table S2). In Asia, we sampled populations in rural contexts and
in remnant forest habitats rather than in major towns to maximize
our chances of sampling native lineages or those derived from
prehistoric introductions. Populations in larger towns and ports
are more likely to be of mixed origin due to introductions in
modern times.
Sampling coverage in Southeast Asia includes one significant
gap spanning the Malay Peninsula and it is also sparse for the
larger Sundaic Islands (Sumatra, Borneo). It is similarly sparse for
the Indian subcontinent but adequate for southern India where
chromosomal diversity is greatest [8]. Our sampling of Europe is
also very incomplete. However, because of the strong historical
evidence for dispersal of European ‘ship rats’ during the past 500
years or less [19,38], we anticipated that our sampling in Africa,
the Americas and Australia would be representative of diversity
within the secondary ‘source area’ of Europe.
We included samples of a variety of other species of Rattus
including some that are considered to be close relatives of R. rattus
[11]. For these potentially related species, we attempted to sample
multiple individuals from across the species’ entire geographic
range so as to establish a benchmark for typical levels of
phylogeographic diversity within Rattus.
The mitochondrial cytochrome b gene (cyt b) was selected for
analysis because: 1) mitochondrial DNA has proven utility for
revealing phylogeographic structure within mammalian taxa [70]
as well as dispersal histories, including those associated with
human translocation [71]; 2) a prior study of Japanese Black Rats
[12] found an appropriate level of variation in cyt b between two
karyomorphs; and 3) we have access to a large cyt b dataset for
Rattus and related murines of the Tribe Rattini [25].
Molecular methodsThe majority of sequences were determined from liver samples
obtained from modern specimens. A small number of sequences
were obtained from skin and hair samples removed from museum
vouchers (see below). The following primer combinations were
used for particular DNA amplifications: A) mcytb1: CCA TCG
TTG TAA TTC AAC TAT AG, mcytbL400: CAT GAG GAC
AAA TAT CAT TCT GAG G, mcytbHb: GAA TGG GAG AAT
GAA GTG GAA TGC G, mcytb4: CTT TGG CTT ACA AGA
CCA AGG TAA; B) L14724: TGA YAT GAA AAA YCA TCG
TTG, H15915: CAT TTC AGG TTT ACA AGA C; C) L14724:
59 CGA AGC TTG ATA TGA AAA ACC ATC GTT G 39,
HRa1025: 59 GGG TGT TCT ACT GGT TGG CCT CC 39.
Commensalism and Dispersal History of Black Rats
PLoS ONE | www.plosone.org 16 November 2011 | Volume 6 | Issue 11 | e26357
The cyt b gene was sequenced for more than 200 individuals
(Table S1), either in entirety or in part, depending on the quality of
available tissues. A small number of sequences were obtained from
GenBank. Most sequences included a common alignment of
945 bp and this was used for the primary analysis of 153 sequences
providing unique combinations of haplotype and locality. A
subsequent round of analyses used a shorter alignment of 596 bp
to accommodate a further 14 sequences. Details of collecting
localities are given in Table S3, References S1.
We designed several sets of primers to amplify overlapping
smaller fragments of the cyt b gene from museum vouchers of
Rattus. Primers were designed from an alignment of six Rattus
species and human cyt b – where feasible, primers included
nucleotides that mismatched human sequences at the 39 end of
each primer to exclude amplification of human contamination.
The six reference sequences are: Rattus praetor DQ191487; Rattus
tanezumi DQ191488; Rattus exulans DQ191486; Rattus everetti
DQ191485; Rattus rattus AB033702; and Rattus norvegicus
AB033713. Predicted PCR product lengths were (including
primers): 235 bp for RattuscytbF2 59 TCA TCA GTT ACC
CAC ATC TGC 39 and RattuscytbR2 39-ACC CTA GTC GAA
TGA ATC TGA GG-59; and 306 bp for RattuscytbF1 59ATC
ACA CCC TCT ACT CAA AA 39 and RattuscytbR1 59CTA
ATY CGA TAC TTA CAT GCC 39.
DNA was extracted from small (1–2 mm2) pieces of dried skin
using Qiagen DNeasy tissue kit as per the manufacturer’s
instructions. Control extracts and PCR negative controls were
included. We used Invitrogen’s Platinum Taq Hi Fidelity (MgSO4,
buffer and enzyme) employing 50 cycles of amplification for PCR.
Products of expected size were observed on agarose gels in the
sample lanes, all control lanes were clean. PCR products were
cleaned using magnetic cleanup system (Agencourt, Ampure) and
sequenced using the same primers as for the PCR using ABI Big
Dye 3.1 chemistry. The majority of sequences were determined
from liver samples obtained from modern specimens. A small
number of sequences were obtained from skin and hair samples
removed from museum vouchers (see below). The following
primer combinations were used for particular DNA amplifications:
A) mcytb1: CCA TCG TTG TAA TTC AAC TAT AG,
mcytbL400: CAT GAG GAC AAA TAT CAT TCT GAG G,
mcytbHb: GAA TGG GAG AAT GAA GTG GAA TGC G,
mcytb4: CTT TGG CTT ACA AGA CCA AGG TAA; B)
L14724: TGA YAT GAA AAA YCA TCG TTG, H15915: CAT
TTC AGG TTT ACA AGA C; C) L14724: 59 CGA AGC TTG
ATA TGA AAA ACC ATC GTT G 39, HRa1025: 59 GGG TGT
TCT ACT GGT TGG CCT CC 39.
The cyt b gene was sequenced for more than 200 individuals
(Table S1), either in entirety or in part, depending on the quality of
available tissues. A small number of sequences were obtained from
GenBank. Most sequences included a common alignment of
945 bp and this was used for the primary analysis of 153 sequences
providing unique combinations of haplotype and locality. A
subsequent round of analyses used a shorter alignment of 596 bp
to accommodate a further 14 sequences. Details of collecting
localities are given in Table S3, References S1.
We designed several sets of primers to amplify overlapping
smaller fragments of the cyt b gene from museum vouchers of
Rattus. Primers were designed from an alignment of six Rattus
species and human cyt b – where feasible, primers included
nucleotides that mismatched human sequences at the 39 end of
each primer to exclude amplification of human contamination.
The six reference sequences are: Rattus praetor DQ191487; Rattus
tanezumi DQ191488; Rattus exulans DQ191486; Rattus everetti
DQ191485; Rattus rattus AB033702; and Rattus norvegicus
AB033713. Predicted PCR product lengths were (including
primers): 235 bp for RattuscytbF2 59 TCA TCA GTT ACC
CAC ATC TGC 39 and RattuscytbR2 39-ACC CTA GTC GAA
TGA ATC TGA GG-59; and 306 bp for RattuscytbF1 59ATC
ACA CCC TCT ACT CAA AA 39 and RattuscytbR1 59CTA
ATY CGA TAC TTA CAT GCC 39.
DNA was extracted from very small (1–2 mm2) pieces of dried
skin using the Qiagen DNeasy tissue kit as per the manufacturer’s
instructions. Control extracts and PCR negative controls were
included. We used Invitrogen’s Platinum Taq Hi Fidelity (MgSO4,
buffer and enzyme) employing 50 cycles of amplification for PCR.
Products of expected size were observed on agarose gels in the
sample lanes, all control lanes were clean. PCR products were
cleaned using magnetic cleanup system (Agencourt, Ampure) and
sequenced using the same primers as for the PCR using ABI Big
Dye 3.1 chemistry. Authenticity of cyt b sequences obtained from
museum vouchers was controlled and assessed using a number of
standard ancient DNA criteria, including conducting all pre-PCR
work (DNA extraction and PCR set-up) in a physically remote
ancient DNA laboratory employing positive HEPA-filtered air
pressure, bleach and UV decontamination and full PPE; including
negative extraction controls and PCR negative controls alongside
all sample extractions and PCR amplifications; intra-laboratory
replication of all sequences from independent PCRs; and visual
assessment of nucleotide substitutions to ensure they conform with
molecular evolutionary expectations (ts.tv, 3rd codon.1st co-
don.2nd codon substitutions, synonymous.non-synonymous
substitutions, absence of intra-sequence stop codons).
Phylogenetic and Population Genetic analysesPhylogenetic analyses were performed on manually aligned
sequences under Bayesian Inference (BI) using MrBayes version
3.1.2 [72], and the Neighbour Joining (NJ) Method and
Maximum Parsimony (MP) as implemented in MEGA version
3.1 [73]. Appropriate models of DNA evolution were determined
using ModelTest [74]. For the BI analysis, MCMC were run for
56106 generations with each codon position as a separate
partition with the (GTR+I+C) model of nucleotide substitution.
Convergence was assessed from multiple chains and by ensuring
that effective sample sizes for parameters were .200. Visual
inspection of a plot of log likelihood against generation was use to
select ‘burnin’ trees to discard prior to summarising the search
results with a majority rule consensus tree. For NJ and MP
methods we performed 1000 pseudoreplicates to obtain estimates
of nodal non-parametric bootstrap support. The tree generated
under BI is shown in Fig. 2.
For each of the analyses, we included representatives of various
other species of Rattus (R. andamanensis, R. argentiventer, R. exulans, R.
losea, R. nitidus, R. norvegicus, R. satarae) with the following
objectives: 1) to test the monophyly or otherwise of R. rattus; 2)
to identify the closest relatives of R. rattus within Rattus; and 3) to
compare nucleotide diversity within R. rattus with the inter- and
intra-specific nucleotide diversity in each species of Rattus and its
close relative Bandicota. We also included representatives of other
genera of the Rattini (Berylmys and Niviventer [14]) to serve as
outgroups.
The phylogenetic structure of better sampled sub-lineages
was investigated using Median-Joining Network analyses [75]
and the inferential methods developed in comparable studies of
human dispersal history [76]. To quantify diversity and test for
population expansions, we calculated a variety of population
genetic parameters and statistics for different mtDNA lineages
and geographic groupings (Table 3), using DnaSP version
5.10.1 [77]. Specifically, we calculated nucleotide diversity Pi,
Commensalism and Dispersal History of Black Rats
PLoS ONE | www.plosone.org 17 November 2011 | Volume 6 | Issue 11 | e26357
Tajima’s D [78], Fu and Li’s D* and F* [79], Fu’s Fs [80], and
Ramos-Onsin and Rozas’s R2 [81]. We also produced graphs of
pairwise mismatch distribution [82], using the coalescent
simulation approach implemented in DnaSP version 5.10.1
[77] (Figs. 5, 6, 7). Estimates of tau ( = expansion time in
mutational units) were converted into years before present (ybp)
with the formula ybp = generation length multiplied by tau/
2uk, where u = substitution rate per site per year; k = sequence
length [83]. We used various prior estimates of u, drawn from
studies of murine rodents in general or from analysis of the
Rattus Division (see Table 4). For each of lineages I and II,
separate analyses were carried out on populations within the
inferred natural range vs populations resulting from range
expansion into areas not originally occupied by any member of
the Black Rat group.
Where the karyotype of individual rats included in this study is
known from prior studies, this information is included in Table S1.
No karyotypes were determined specifically for our study.
Molecular clock analysesCytochrome b sequences reported by Robins et al. [24] were
added to the current dataset to enable further comparison of
results. Six House Mouse (Mus musculus) cytochrome b sequences
(GenBank accession numbers EF108340-5) were added to
incorporate a calibration point from the murine fossil record.
The widely used divergence of Mus and Rattus actually
corresponds to the origin of tribal diversity within mainland
Asian representatives of the subfamily Murinae [25]. The best
substitution model was selected using ModelGenerator by
comparison of Akaike Information Criterion 2 scores [84].
Bayesian phylogenetic analysis with timescale was performed
with BEAST version 1.4 [85], using the divergence time
estimation of 10.4–14 Mya [64] for the Mus/Rattus node. An
uncorrelated lognormal relaxed-clock model [86] was used with
HKY+I+G6 substitution model on the data partitioned into the
three codon positions. MCMC analyses were run for 30,000,000
steps, with posterior samples drawn every 1000 steps after a burn-
in of 3,000,000 steps.
Due to the complex mixture of intra and inter-specific
diversity in the dataset, the general constant size coalescent
model was chosen as tree prior (see Fig. 3). However, applying a
general model will not always conciliate such different levels of
genetic diversity. In order to check for any bias in time
estimations due to this issue, a similar BEAST analysis was
conducted using only one representative per clade (these are
identified in Table S4, References S1), and applying the Yule
process speciation model as tree prior (see Fig. S1). Comparison
of the two sets of results does not indicate significant differences
in estimated dates according to 95% margins (Table S4,
References S1). The BEAST input files are available from the
authors upon request.
Robins et al. [24] calculated the tMRCA for four clades that are
present in our data (see Table S4, References S1), using whole
mitochondrial sequences and a narrower calibration date range
(Mus/Rattus, 11–12.3 Mya [87]). We defined a broader time
interval for the fossil calibration point that better reflects
uncertainties about the evolutionary history of this group [88].
Comparison of tMRCA estimations between the two studies shows
slightly older dates in our analysis, but no significant differences
considering the error margins.
Two sources of uncertainty remain concerning the inferred
timescale. Firstly, it is now well known that molecular rates are
time-dependant [89–91], and a single, deep, calibration point at
inter-specific level may not provide optimal accuracy for
estimations at an intra-specific level. Only a combination of
several calibration points at contrasting time scales would be
likely to significantly increase dating accuracy [92–93]. Unfor-
tunately, for this group we lack both a well-dated Quaternary
fossil record or radiocarbon dated specimens from which
ancient DNA has been derived. Secondly, our study and that
of Robins et al. [24] are based only on the mitochondrial
genome and thus is subject to intrinsic biases related to maternal
inheritance and organelle location [94–95]. Information from
multiple markers will be needed to derive more robust estimates
of the timing of phylogenetic diversification in this recently
evolved group.
Supporting Information
Figure S1 Result of BEAST analysis using the sameparameters as Fig. 4 but using the Yule process speciationmodel as tree prior and with a single representative ofeach of the species and mtDNA lineages within the RrC.Divergence time estimates for labelled nodes A–E are shown in Table
S4.
(DOC)
Table S1 List of haplotypes with GenBank accessionnumbers and details of collecting locality.
(DOC)
Table S2 Details of collecting localities and habitat forall samples listed in Table S1.
(DOC)
Table S3 Selection of important zoonotic diseases andpathogens for which members of the Rattus rattusComplex are identified as significant hosts or carriers.
(DOC)
Table S4 Comparison of estimated divergence datesfrom the present study and from Robins et al. [28].
(DOC)
Table S5 Nucleotide diversity, Pi [29] for each of the sixlineages and two clades of the Rattus rattus Complex,and for various other species of Rattus.
(DOC)
References S1 References for Supporting Information.
(DOC)
Acknowledgments
We thank Jim Patton for generously providing unpublished sequence data
for Madagascar and the USA, Annette Olsson (Conservation International,
Cambodia) and Kylie Chung (University of Hong Kong) for providing
tissue samples, Simon Ho and Matt Phillips with guidance on the
molecular clock analyses, and Terry Bertozzi and Andrew Wiewel for
assistance with preparing the manuscript. For other assistance, HS thanks
Kimiyuki Tsuchiya and Sosuke Suzuki and YPF thanks Hai-Yin Wu and
Wei-Shin Jenq. Collecting by KPA was carried out under CSIRO Animal
Ethics Committee Permit Number 00/01-28 titled ‘‘Taxonomic studies of
agricultural pest rodents and their relatives in Southeast Asia’’.
Author Contributions
Conceived and designed the experiments: KA HS. Performed the
experiments: AC JA RC JtH. Analyzed the data: KA JS RVDB AC SD
JA. Contributed reagents/materials/analysis tools: KA AF JPG VH FC Y-
PF JR EM-S AB IM MS CD CC KR. Wrote the paper: KA AC JA JS SD.
Commensalism and Dispersal History of Black Rats
PLoS ONE | www.plosone.org 18 November 2011 | Volume 6 | Issue 11 | e26357
References
1. Barnett SA (2001) The Story of Rats. Their impact on us, and our impact on
them. Allen & Unwin: Crows Nest, Sydney. 202 p.
2. Meerburg BG, Singleton GR, Leirs H (2009) The year of the Rat ends—time
to fight hunger! Pest Manag Sci 65: 351–2.
3. Goodman SM (1994) Rattus on Madagascar and the dilemma of protecting the
endemic rodent fauna. Conserv Biol 9: 450–3.
4. Atkinson IAE (1985) The spread of commensal species of Rattus to oceanic
islands and their effects on island avifaunas. In: Moors PJ, ed. Conservation ofisland birds, International Council for Bird Preservation: Bristol. pp 35–81.
5. Duplantier J-M, Catalan J, Orth A, Grolleau B, Britton-Davidian J (2003)Systematics of the black rat in Madagascar: consequences for the transmission
and distribution of plague. Biol J Linn Soc 78: 335–341.
6. Meerburg BG, Singleton GR, Kijlstra A (2009) Rodent-borne diseases and
their risks for public health. Critical Rev Microbiol 35: 221–70.
7. McNeill WH (1976) Plagues and Peoples. Doubleday: New York. 340 p.
8. Yosida TH (1980) Cytogenetics of the Black Rat. Karyotype evolution and
species differentiation. Tokyo University: Tokyo. 256 p.
9. Baverstock PR, Adams M, Maxson LR, Yosida TH (1983) Genetic
differentiation among karyotypic forms of the black rat, Rattus rattus. Genetics105: 969–83.
10. Niethammer J (1975) Zur Taxonomie und Ausbreitungsgeschichte derHausratte (Rattus rattus). Zool Anz 194: 405–415.
11. Musser GG, Carleton MD (2005) Superfamily Muroidea. In: Wilson DE,
Reeder DR, eds. Mammal species of the world: a taxonomic and geographic
reference, 3rd ed, John Hopkins University Press: Baltimore. pp 894–1531.
12. Chinen AA, Suzuki H, Aplin KP, Tsuchiya K, Suzuki S (2005) Preliminary
genetic characterization of two lineages of black rats (Rattus rattus sensu lato) inJapan, with evidence for introgression at several localities. Genes Genet Syst 80:
367–75.
13. Brown GG, Simpson MV (1981) Intra- and interspecific variation of the
mitochondrial genome in Rattus norvegicus and Rattus rattus: restriction enzymeanalysis of variant mitochondrial DNA molecules and their evolutionary
relationships. Genetics 97: 125–143.
14. Pages M, Chaval Y, Herbreteau V, Waengsothorn S, Cosson J-F, et al. (2010)
Revisiting the taxonomy of the Rattini tribe: a phylogeny-based delimitation ofspecies boundaries. BMC Evol Biol 10: 184.
15. Aplin KP, Brown PR, Jacob J, Krebs C, Singleton GR (2003) Field methods forrodent studies in Asia and the Pacific. Australian Centre for International
Agricultural Research: Canberra. 223 p.
16. Musser GG, Newcomb C (1985) Definitions of Indochinese Rattus losea and a
new species from Vietnam. Amer Mus Novit 2814: 1–31.
17. Pages M, Corbet G, Orth A, Volobouev V, Michaux J, et al. (2011)
Morphological, chromosomal, and genic differences between sympatric Rattus
rattus and Rattus satarae in South India. J Mamm 92: 659–670.
18. Verneau O, Catzeflis F, Furano AV (1997) Determination of the evolutionary
relationships in Rattus sensu lato (Rodentia: Muridae) using L1 (LINE-1)
amplification events. J Mol Evol 45: 424–436.
19. Armitage PL (1994) Unwelcome companions: Ancient rats reviewed. Antiquity68: 231–41.
20. Ho SY, Phillips MJ, Cooper A, Drummond AJ (2005) Time dependency ofmolecular rate estimates and systematic overestimation of recent divergence
times. Mol Biol Evol 22: 1561–1568.
21. Marshall JT (1977) Family Muridae. Rats and mice. In: Lekagul B,
McNeely JA, eds. Mammals of Thailand, Association for the Conservation ofWildlife: Bangkok, Thailand. pp 396–487.
22. Frost A (2009) Pest rodent biology, ecology and management in lowland ricefields of Cambodia and the value of local knowledge for site-specific research.
PhD Thesis. University of Queensland.
23. Musser GG (1986) Sundaic Rattus: definitions of Rattus baluensis and Rattus
korinchi. Amer Mus Novit 2862: 1–24.
24. Robins JH, McLenachan PA, Phillips MJ, Craig L, Ross HA, et al. (2008)
Dating of divergences within the Rattus genus phylogeny using wholemitochondrial genomes. Mol Phyl Evol 49: 460–66.
25. Lecompte E, Aplin K, Denys C, Catzeflis F, Chades M, et al. (2008) Phylogenyand biogeography of African Murinae based on mitochondrial and nuclear
gene sequences, with a new tribal classification of the subfamily. BMC EvolBiol 8: 199.
26. Rowe KC, Reno ML, Richmond DM, Adkins RM, Steppan SJ (2008) Pliocenecolonization and adaptive radiations in Australia and New Guinea (Sahul):
multilocus systematics of the old endemic rodents (Muroidea: Murinae). MolPhylogenet Evol 47: 84–101.
27. Rowe KC, Aplin KP, Baverstock PR, Moritz C (2011) Recent and rapidspeciation with limited morphological disparity in the genus Rattus. Syst Biol 60:
188–203.
28. Glover T (1986) Archaeology in Eastern Timor, 1966–67. Dept Prehistory, Res
Sch Pacific Studies, Australian National University: Canberra. 241 p.
29. Musser GG (1984) Identities of subfossil rats from caves in southwestern
Sulawesi. Mod Quat Res Southeast Asia 8: 61–94.
30. Robins JH, Hingston M, Matisoo-Smith E, Ross HA (2007) Identifying Rattus
species using mitochondrial DNA. Mol Ecol Notes 7: 717–729.
31. Mayr E (1970) Populations, Species, and Evolution. The Belknap Press ofHarvard University Press: Cambridge, MA. 459 p.
32. Tobias JA, Seddon N, Spottiswoode CN, Pilgrim JD, Fishpool LDC, et al.(2010) Quantitative criteria for species delimitation. Ibis 152: 724–746.
33. Kambe Y, Tanikawa T, Matsumoto Y, Tomozawa M, Aplin KP, et al. (2011)Origin of agouti-melanistic polymorphism in wild Black Rats (Rattus rattus)
inferred from Mc1r gene sequences. Zool Sci 28: 560–567.
34. Bastos AD, Nair D, Taylor PJ, Brettschneider H, Kirsten F, et al. (2011)
Genetic monitoring detects an overlooked cryptic species and reveals the
diversity and distribution of three invasive Rattus congeners in south Africa.BMC Evol Biol 12: 26.
35. Martin JHD (1971) Karyotypes of native Muridae of Queensland. MSc thesis,University of Queensland.
36. Watts CHS, Aslin H (1981) The rodents of Australia. Angus and Robertson:Sydney. pp 321.
37. Gyldenstolpe NK (1917) Zoological results of the Swedish Zoologicalexpeditions to Siam, 1911–1912 and 1914–1915. V. Mammals. Svenska
Vetensk-Akad Handl 57: 1–59.
38. Ervynck A (2002) Sedentism or urbanism? On the origin of the commensalblack rat (Rattus rattus). In: Dobney K, O’Connor T, eds. Bones and the man.
Studies in honour of Don Brothwell, Oxbow: Oxford. pp 95–109.
39. Blench R (2007) New palaeozoogeographical evidence for the settlement of
Madagascar. Azania 42: 69–82.
40. Tollenaere C, Brouat C, Duplantier J-M, Rahalison L, Rahelinirina S, et al.
(2010) Phylogeography of the introduced species Rattus rattus in the western
Indian Ocean, with special emphasis on the colonization history ofMadagascar. J Biogeog 37: 398–410.
41. Santel W, von Koenigswald W (1998) Preliminary report on the middlePleistocene small mammal fauna from Yarimburgaz Cave in Turkish Thrace.
Eiszeitalter Ggw 48: 162–169.
42. Tchernov E (1996) Rodent faunas, chronostratigraphy and paleobiogeography
of the southern Levant during the Quaternary. Acta Zool Cracov 39: 513–30.
43. Yalden DW (2003) Mammals in Britain - A historical perspective. Brit Wildl
14: 243–251.
44. Burney DA, Burney LP, Godfrey LR, Jungers WL, Goodman SM, et al. (2004)A chronology for late prehistoric Madagascar. J Hum Evol 47: 25–63.
45. Blench R (2007) New palaeozoogeographical evidence for the settlement ofMadagascar. Azania 42: 69–82.
46. Audouin-Rouzeau F, Vigne J-D (1994) La colonisation de l’Europe par le ratnoir (Rattus rattus). Revue de Paleobiologie 13: 125–145.
47. Schwarz E (1934) The origin of African house rats. Proc Zool Soc Lond 104:723–726.
48. Suzuki S, Yonekawa H, Tsuchiya K, Tsutamune T, Fujikawa K, Uchida Y
(2001) Oceanina-type black rat (Rattus rattus) found in port Otaru of Hokkaido,Japan. Med Entomol Zool 52: 1–7.
49. White JC, Penny D, Kealhofer L, Maloney B (2004) Vegetation changes fromthe late Pleistocene through the Holocene from three areas of archaeological
significance in Thailand. Quat Int 113: 111–132.
50. Sun X, Wu Y, Qiou Y, Walker D (1986) Late Pleistocene and Holocene
vegetation history at Kunming, Yunnan Province, southwest China. J Biogeogr
13: 441–476.
51. Kawamura Y (1989) Quaternary rodent faunas in the Japanese islands (Part 2).
Mem Fac Sci, Kyoto Univ, Ser Geol Mineral 54: 1–235.
52. Musser GG (1981) The giant rat of Flores and its relatives east of Borneo and
Bali. Bull Am Mus Nat Hist 169: 67–176.
53. Musser GG, van de Weerd A, Strasser E (1986) Paulamys, a replacement name
for Floresomys Musser, 1981 (Muridae), and new material of that taxon fromFlores, Indonesia. Am Mus Novit 2850: 1–10.
54. Unpublished studies by KPA on well-dated archaeological faunal sequences
from East Timor.
55. Flannery TF (1995) Mammals of New Guinea. Cornell University Press: New
York. 439 p.
56. Flannery TF (1995) Mammals of the South-West Pacific and Moluccan Islands.
Cornell University Press: New York. 464 p.
57. White JP, Clark G, Bedford S (2000) Distribution, present and past, of Rattus
praetor in the Pacific and its implications. Pacific Sci 54: 105–117.
58. Shen C-F (1995) Introduction to the flora of Taiwan, 2: Geotectonic evolution,
paleogeography, and the origin of the flora. In: Huang TC, ed. Flora of
Taiwan, Vol. 1, Editorial Committee of the Flora of Taiwan: Taipei, Taiwan.pp 3–7.
59. Bellwood P (1997) Prehistory of the Indo-Malaysian Archipelago, revisededition. University of Hawai’i Press, Honolulu. 384 p.
60. White JP, Clark G, Bedford S (2000) Distribution present and past of Rattus
praetor in the Pacific and its implications. Pacific Sci 54: 105–117.
61. Lansing JS, Redd AJ, Karafet TM, Watkins J, Ardika IW, et al. (2004) AnIndian trader in ancient Bali? Antiquity 78: 287–93.
62. Underhill A (1997) Current issues in Chinese Neolithic archaeology. J World
Prehistory 11: 103–160.
63. Barton L, Newsome SD, Chen F-H, Wang H, Guilderson TP, Bettinger RL
(2009) Agricultural origins and the isotopic identity of domestication innorthern China. PNAS USA 106: 5523–8.
64. Aplin KP, Brown PR, Singleton GR, Douangboupha B, Khamphoukheo K(2006) Rodents in the rice environments of Laos. In: Schiller JM,
Commensalism and Dispersal History of Black Rats
PLoS ONE | www.plosone.org 19 November 2011 | Volume 6 | Issue 11 | e26357
Chanphengxay MB, Linquist B, Appa Rao S, eds. Rice in Laos, International
Rice Research Institute: Los Banos. pp 291–308.65. Frynta D, Slabova M, Vachova H, Volfova R, Munclinger P (2005) Aggression
and commensalism in house mouse: a comparative study across Europe and the
near east. Aggressive Behavior 31: 283–293.66. Corbet GB, Hill JE (1992) The Mammals of the Indomalayan region: A
systematic review. Oxford University Press: London. 488 p.67. Henttonen H, Buchy P, Suputtamongkol Y, Jittapalapong S, Herbreteau V,
et al. (2008) Recent discoveries of new hantaviruses widen their range and
question their origins. Ann N Y Acad Sci 1149: 84–9.68. Nemirov K, Vaheri A, Plyusnin A (2004) A Hantaviruses: co-evolution with
natural hosts. Recent Res Devel Virol 6: 201–28.69. Achtman M, Zurth K, Morelli G, Torrea G, Guiyoule A, et al. (1999) Yersinia
pestis, the cause of plague, is a recently emerged clone of Yersinia
pseudotuberculosis. PNAS USA 96: 14043–8.
70. Avise JC (1994) Molecular markers, natural history and evolution. Chapman &
Hall: New York. 511 p.71. Matisoo-Smith E, Roberts RM, Irwin GJ, Allen JS, Penny D, et al. (1998)
Patterns of prehistoric human mobility in Polynesia indicated by mtDNA fromthe Pacific rat. PNAS USA 95: 15145–15150.
72. Ronquist F, Huelsenbeck JP (2003) MrBayes 3: Bayesian phylogenetic
inference under mixed models. Bioinformatics 19: 1572–1574.73. Kumar S, Tamura K, Nei M (2001) MEGA: molecular evolutionary genetics
analysis, v. 2.0. Pennsylvania State University; Pennsylvania.74. Posada D, Crandall KA (1998) MODELTEST: testing the model of DNA
substitution. Bioinformatics 14: 817–818.75. Clement M, Posada D, Crandall K (2000) TCS: a computer program to
estimate gene genealogies. Mol Ecol 9: 1657–1659.
76. Richards M, Macaulay V, Hickey E, Vega E, Sykes B, et al. (2000) TracingEuropean founder lineages in the Near Eastern mitochondrial gene pool.
Am J Hum Genet 67: 1251–76.77. Rozas J, Sanchez-Delbarrio JC, Messeguer X, Rozas R (2003) DnaSP, DNA
polymorphism analyses by the coalescent and other methods. Bioinformatics
19: 2496–2497.78. Tajima F (1983) Evolutionary relationship of DNA sequences in finite
populations. Genetics 105: 437–460.79. Fu Y-X, Li W-H (1993) Statistical tests of neutrality of mutations genetics 133:
693–709.80. Fu Y-X (1997) Statistical tests of neutrality of mutations against population
growth, hitchhiking and background selection genetics. 147: 915–925.
81. Ramos-Onsins SE, Rozas J (2002) Statistical properties of new neutrality testsagainst population growth. Mol Biol Evol 19: 2092–2100.
82. Rogers AR, Harpending H (1992) Population growth makes waves in thedistribution of pairwise genetic differences. Mol Biol Evol 9: 552–569.
83. von Haeseler A, Sajantila A, Paabo S (1996) The genetical archaeology of the
human genome. Nature Genet 14: 135–140.
84. Keane TM, Creevey CJ, Pentony MM, Naughton TJ, Mclnerney JO (2006)
Assessment of methods for amino acid matrix selection and their use on
empirical data shows that ad hoc assumptions for choice of matrix are not
justified. BMC Evol Biol 6: 29.
85. Drummond AJ, Rambaut A (2007) BEAST: Bayesian evolutionary analysis by
sampling trees. BMC Evol Biol 7: 214.
86. Drummond AJ, Ho SYW, Phillips MJ, Rambaut A (2006) Relaxed
phylogenetics and dating with confidence. PLOS Biology 4: e88.
87. Benton MJ, Donoghue PCJ (2007) Paleontological evidence to date the tree of
life. Molec Biol Evol 24: 26–53.
88. Benton MJ, Donoghue PCJ, Asher J (2009) Calibrating and constraining
molecular clocks. In: Hedges SB, Kumar S, eds. The Timetree of life, Oxford
University Press: Oxford. pp 35–86.
89. Penny D (2005) Evolutionary biology: Relativity for molecular clocks. Nature
436: 183–184.
90. Peterson GI, Masel J (2009) Quantitative prediction of molecular clock and Ka/
Ks at short timescales. Molec Biol Evol 26: 2595–2603.
91. Ho SYW, Shapiro B, Phillips MJ, Cooper A, Drummond AJ (2007) Evidence
for time dependency of molecular rate estimates. Syst Biol 56: 515–522.
92. Ho SYW, Larson G (2006) Molecular clocks: when times are a-changin’.
Trends Genet 22: 79–83.
93. Endicott P, Ho SY, Metspalu M, Stringer C (2009) Evaluating the
mitochondrial timescale of human evolution. Trends Ecol Evol 24: 515–521.
94. Galtier N, Nabholz B, Glemin S, Hurst GDD (2009) Mitochondrial DNA as a
marker of molecular diversity: a reappraisal. Molec Ecol 18: 4541.
95. Nabholz B, Glemin S, Galtier N (2009) The erratic mitochondrial clock:
variations of mutation rate, not population size, affect mtDNA diversity across
birds and mammals. BMC Evol Biol 9: 54.
96. Badenhorst D, Herbreteau V, Chaval Y, Pages M, Robinson TJ, et al. (2009)
New karyotypic data for Asian rodents (Rodentia, Muridae) with the first report
of B-chromosomes in the genus Mus. J Zool 279: 44–56.
97. Yu HT, Fang YP, Chou CW, Huang SW, Yew FH (1996) Chromosomal
evolution in three species of murid rodents of Taiwan. Zool Studies 35:
195–199.
98. Conroy CJ, Cook AJ (1999) MtDNA Evidence for repeated pulses of speciation
within arvicoline and murid rodents. J Mamm Evol 6: 221–245.
99. Irwin DM, Kocher TD, Wilson AC (1991) Evolution of the cytochrome b gene
of mammals. J Mol Evol 32: 128–144.
100. Chinen AA (2006) Molecular phylogeny and biogeography of Rattus sensu lato.
Unpublished doctoral thesis. Graduate School of Environmental Earth Science:
Hokkaido University.
101. Hirata DN, Nass RD (1974) Growth and sexual maturation of laboratory-
reared, wild Rattus norvegicus, R. rattus, and R. exulans in Hawaii. J Mammal 55:
472–474.
Commensalism and Dispersal History of Black Rats
PLoS ONE | www.plosone.org 20 November 2011 | Volume 6 | Issue 11 | e26357