permitting setbacks for wind turbines and the blade...
TRANSCRIPT
Permitting Setbacks for Wind Turbines in California and the Blade Throw Hazard PREPARED BY
Scott Larwood California Wind Energy Collaborative University of California, Davis DATE
16 June 2005 REPORT NUMBER
CWEC-2005-01 PREPARED FOR
California Wind Energy Collaborative, sponsored by the California Energy Commission Public Interest Energy Research (PIER) program
CWEC-2005-001
Table of Contents 1 Summary ..................................................................................................................... 1 2 Glossary ...................................................................................................................... 1 3 Introduction................................................................................................................. 2 4 California Zoning Ordinances for Wind Energy ........................................................ 2
4.1 Example Wind Farm and the Problem with Setbacks ........................................ 3 4.2 Current Wind Energy Ordinances....................................................................... 6 4.3 Wind Turbine Setback Comparison.................................................................... 6 4.4 County Wind Energy Ordinances in the Literature ............................................ 8
4.4.1 Alameda County Ordinance........................................................................ 8 4.4.2 Contra Costa County Ordinance ................................................................. 8 4.4.3 Kern County Ordinance .............................................................................. 8 4.4.4 Riverside County Ordinance....................................................................... 8 4.4.5 Solano County Ordinance ........................................................................... 9
5 Blade Failure Probabilities.......................................................................................... 9 5.1 Blade Failures in the Literature......................................................................... 10 5.2 Alameda County Turbine Failure Data............................................................. 11 5.3 WindStats Turbine Failure Data ....................................................................... 12 5.4 Remarks on Blade Failure Probabilities ........................................................... 12
6 Blade Throw Analyses.............................................................................................. 12 6.1 Background of Blade Throw Models................................................................ 12
6.1.1 Parked Turbines ........................................................................................ 12 6.1.2 Ballistics Models....................................................................................... 13 6.1.3 Rotor Overspeed ....................................................................................... 15 6.1.4 Impact Probabilities .................................................................................. 16 6.1.5 Multiple Turbines...................................................................................... 19 6.1.6 Overall Probability.................................................................................... 19
6.2 Blade Throw Analyses in the Literature ........................................................... 20 6.2.1 Eggwertz, Sweden 1981............................................................................ 20 6.2.2 Macqueen, United Kingdom 1983............................................................ 21 6.2.3 Sørensen, Denmark 1984.......................................................................... 22 6.2.4 Eggers, United States 2001 ....................................................................... 24
6.3 Comparisons of Blade Throw Analysis ............................................................ 24 7 Recommendations for Further Study ........................................................................ 25
7.1 Blade Failure Rate............................................................................................. 25 7.2 Turbine Sizes .................................................................................................... 25 7.3 Position of Blade Break .................................................................................... 26 7.4 Operating Conditions at Failure........................................................................ 26 7.5 Aerodynamic Model ......................................................................................... 26 7.6 Impact Modeling............................................................................................... 26 7.7 Slope Effects ..................................................................................................... 26 7.8 Validation Effort ............................................................................................... 26
8 Conclusions............................................................................................................... 27 9 References................................................................................................................. 27
________________________________________________________________________ Permitting Setbacks for Wind Turbines in California and the Blade Throw Hazard i

CWEC-2005-001
List of Figures Figure 1. Wind Turbine Dimensions ................................................................................. 3 Figure 2. Layout for V-47 Wind Turbines Based on Setback Requirement of Three
Times Total Turbine Height........................................................................................ 4 Figure 3. Layout for GE 1.5s Machines Based on Setback Requirements of Three Times
Total Turbine Height................................................................................................... 5 Figure 4. Blade Throw Schematic ................................................................................... 14 Figure 5. Probability of Impact Within an Annular Region ............................................ 17 Figure 6. Target Annular Sector ...................................................................................... 18 Figure 7. Probability of Impact in Annular Sector .......................................................... 18 Figure 8. Throw Distances in Sørensen Conference Paper with 10-4 Probability Hazard
Range ........................................................................................................................ 23 Figure 9. Comparison of Blade Throw Analyses for Maximum Range at Nominal
Operating Conditions ................................................................................................ 25
List of Tables Table 1. Setback References in California County Ordinances......................................... 6 Table 2. Safety Setback Comparison ................................................................................. 7 Table 3. IEC Peak Gusts .................................................................................................. 13 Table 4. Sensitivity Studies by Sørensen in Wind Engineering Paper ............................ 22
________________________________________________________________________ Permitting Setbacks for Wind Turbines in California and the Blade Throw Hazard ii
CWEC-2005-001
1 Summary The California Wind Energy Collaborative has been tasked to look at barriers to new wind energy development in the state. Due to the visibility of wind energy and its community impact, planning commissions in the state have developed setback standards to reduce the hazard of blade failures resulting in projectiles. These standards are usually based on overall turbine height. New developments with larger, modern wind turbines can be “squeezed out” of parcels thus reducing the economic viability. Current setback standards and their development are reviewed. The blade failure probability is discussed and public domain statistics are reviewed. The available documentation shows blade failure probability in the 1-in-100 to 1-in-1000 per turbine per year range. There is no indication of improvement of this statistic with new technology. The analysis of the blade throw event is discussed in simplified terms. The range of the throw is highly dependent on the release velocity, which is a function of the turbine tip speed. The tip speed of wind turbines do not tend to increase with turbine size, thus offering possible relief to setback standards. Four independent analyses of the blade throw hazards were reviewed. The analyses do not particularly provide guidance for setbacks. Recommendations are made to use models from previous analyses for developing setbacks with an acceptable hazard probability.
2 Glossary Specific terms and acronyms used throughout this paper are defined as follows: Acronym Definition
CD Coefficient of Drag
CL Coefficient of Lift
CWEC California Wind Energy Collaborative
DOE U.S. Department of Energy
EIR Environmental Impact Report
IEC International Electrotechnical Commission
kW Kilowatt (1000 Watts)
m Meters
m/s Meters per second
MW Megawatt (1,000,000 Watts)
NREL National Renewable Energy Laboratory
RPM Revolutions per minute
SERI Solar Energy Research Institute (predecessor of NREL)
WECS Wind Energy Conversion System
________________________________________________________________________ Permitting Setbacks for Wind Turbines in California and the Blade Throw Hazard 1
CWEC-2005-001
3 Introduction California has played a pivotal role in the creation and evolution of the wind power industry. Wind power is unique in the visibility and exposure to the public as compared to other forms of power generation. By necessity, communities have become involved in planning for the development of wind power in their jurisdiction. Both the regulation and technology of wind power evolved together in the last two decades. Particular attention was made to protect the public from hazards. With the advent of a new technology, the probability of failure is high because the physics are not well understood. The engineering of the technology must also be balanced with economics, and the balance is very tenuous at the beginning of a new venture. Equipment and business failures plagued the industry in the last two decades, and legacy equipment still fails at a high rate today. One hazard possibility of wind turbines is the failure of the blade resulting in projectiles. Concerns over public exposure to this risk led the counties to develop setbacks from adjacent properties and structures. The development of county ordinances took place independently of each other; however in most cases the fledgling wind power industry was involved in the development (McClendon and Duncan 1985). In general, the setbacks were based on the heights of the turbines. Utility scale turbines installed in California have evolved from 50 kW machines of 25 m overall height to 1.8 MW machines of 100 m overall height. The nature of that evolution, in general, is that manufacturers stop production of smaller turbines due to improved economics of the new larger turbines. With increased overall height, the setback is increased, and modern turbines can be “squeezed out” of developments. The California Wind Energy Collaborative (http://cwec.ucdavis.edu/), through its “Windplant Optimization” task, has been directed to prepare this white paper on permitting issues in regards to the blade throw hazard. The concern over restrictions on development was the impetus to study current ordinances and the blade throw hazard. Two possibilities offer the potential for relief in this area. Modern wind turbines might offer higher reliability, thus lowering the risk of blade failure. Second, in the event of a blade failure, the hazard area is governed by the blade tip speed. This tip speed has not changed, and in some cases is reduced for modern turbines. Therefore, more appropriate setbacks might be a fixed distance, and not a function of the turbine size. These possibilities, along with background research, are discussed in this report.
4 California Zoning Ordinances for Wind Energy One objective of this white paper was to report on current permitting issues with regards to setback issues. Research was conducted to document the current setback requirements and determine how they were developed. The research was narrowed to counties with a history of wind energy development and with future projects in the planning stages.
________________________________________________________________________ Permitting Setbacks for Wind Turbines in California and the Blade Throw Hazard 2
CWEC-2005-001
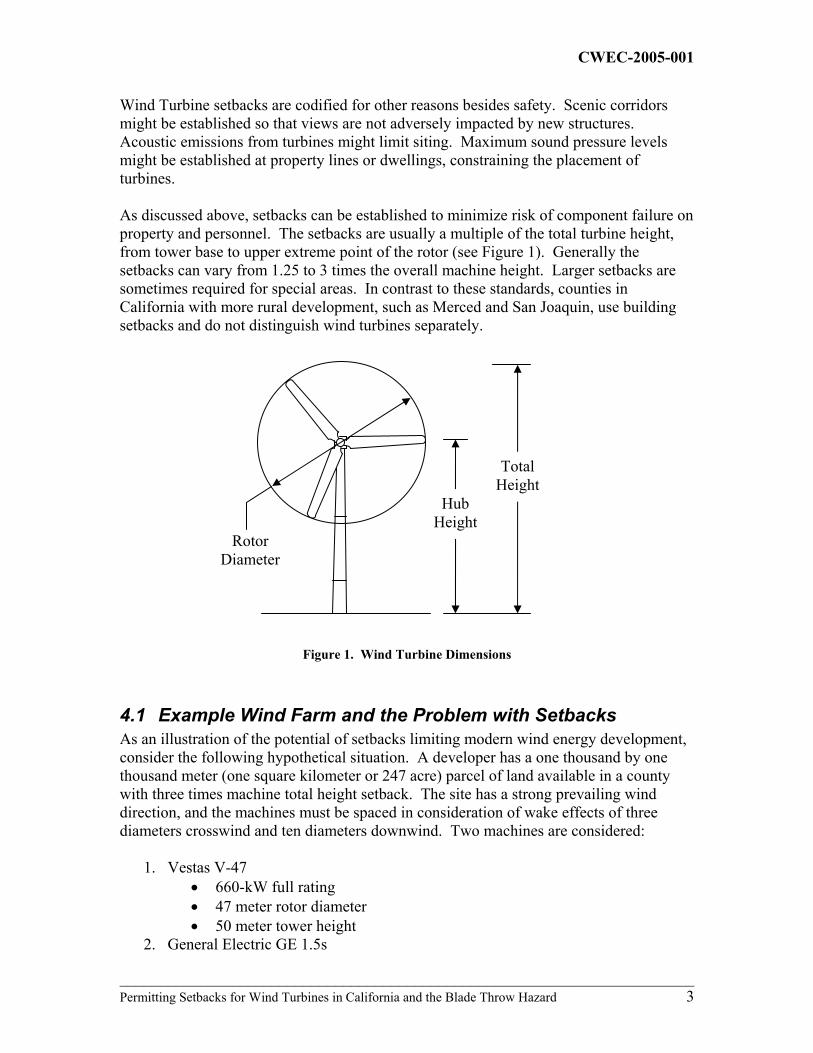
Wind Turbine setbacks are codified for other reasons besides safety. Scenic corridors might be established so that views are not adversely impacted by new structures. Acoustic emissions from turbines might limit siting. Maximum sound pressure levels might be established at property lines or dwellings, constraining the placement of turbines. As discussed above, setbacks can be established to minimize risk of component failure on property and personnel. The setbacks are usually a multiple of the total turbine height, from tower base to upper extreme point of the rotor (see ). Generally the setbacks can vary from 1.25 to 3 times the overall machine height. Larger setbacks are sometimes required for special areas. In contrast to these standards, counties in California with more rural development, such as Merced and San Joaquin, use building setbacks and do not distinguish wind turbines separately.
Figure 1
Figure 1. Wind Turbine Dimensions
Total Height
Hub Height
Rotor Diameter
4.1 Example Wind Farm and the Problem with Setbacks As an illustration of the potential of setbacks limiting modern wind energy development, consider the following hypothetical situation. A developer has a one thousand by one thousand meter (one square kilometer or 247 acre) parcel of land available in a county with three times machine total height setback. The site has a strong prevailing wind direction, and the machines must be spaced in consideration of wake effects of three diameters crosswind and ten diameters downwind. Two machines are considered:
1. Vestas V-47 • 660-kW full rating • 47 meter rotor diameter • 50 meter tower height
2. General Electric GE 1.5s
________________________________________________________________________ Permitting Setbacks for Wind Turbines in California and the Blade Throw Hazard 3

CWEC-2005-001
• 1500-kW full rating • 70.5 meter rotor diameter • 65 meter tower height
The layouts are shown in and , with shaded zones representing the setback areas.
Figure 2
Figure 2. Layout for V-47 Wind Turbines Based on Setback Requirement of Three Times Total Turbine Height
Figure 3
1 km
Setback 3D in-row
spacing 3X overall
height
10- V47 turbines 1 km 50 meter Towers 10D row
spacing Total Rating 6.6 MW
Setback 3X overall
height
Prevailing Wind
________________________________________________________________________ Permitting Setbacks for Wind Turbines in California and the Blade Throw Hazard 4

CWEC-2005-001
1 km
3- GE1.5s turbines 65 meter towers Total Rating 4.5 MW
Setback 1 km 3X overall
height 2.9D in-row spacing
Setback 3X overall
height
Prevailing Wind
Figure 3. Layout for GE 1.5s Machines Based on Setback Requirements of Three Times Total Turbine Height
For the V47 machine, the spacing requirements and setbacks allow for ten machines with total rating of 6.6 MW. In contrast, the requirements allow only three GE 1.5 turbines with total rating of 4.5 MW. The crosswind spacing in this case had to be reduced slightly. Downwind spacing requirements would force a second row of turbines off the parcel. The setback requirements for this example result in lower energy production with the application of larger, modern machines. The options available to a developer are further constrained with the current trend of manufacturers producing larger machines.
________________________________________________________________________ Permitting Setbacks for Wind Turbines in California and the Blade Throw Hazard 5
CWEC-2005-001
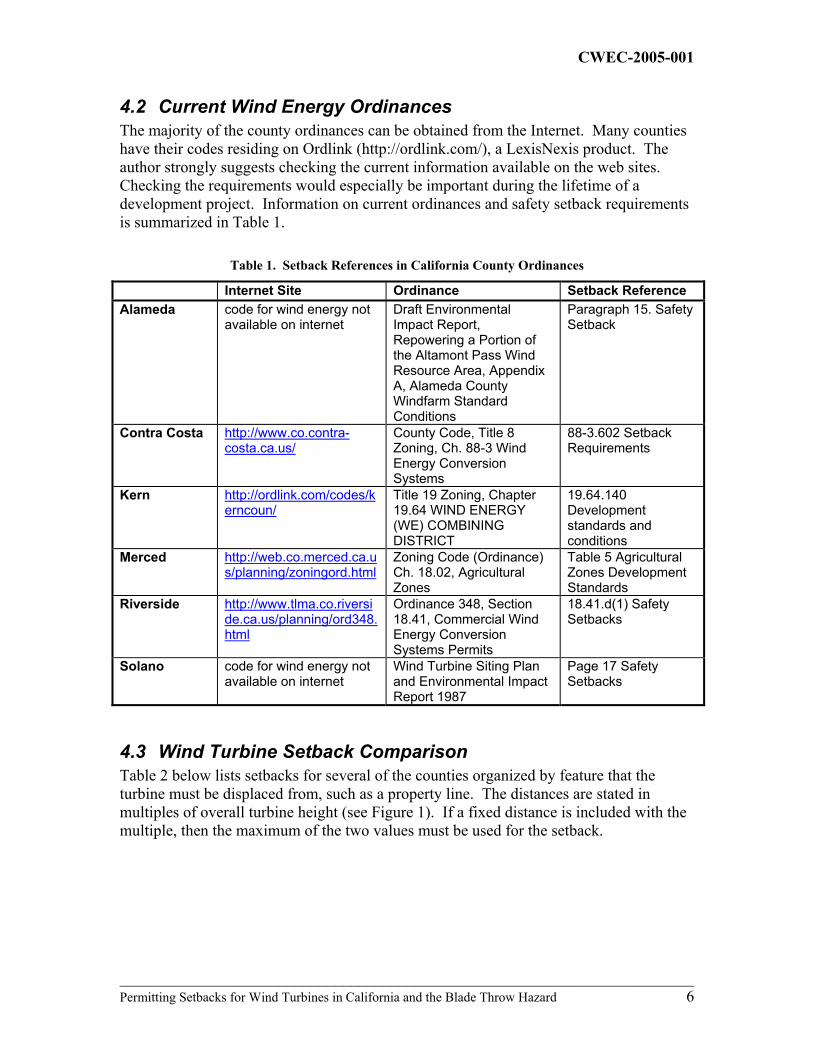
4.2 Current Wind Energy Ordinances The majority of the county ordinances can be obtained from the Internet. Many counties have their codes residing on Ordlink (http://ordlink.com/), a LexisNexis product. The author strongly suggests checking the current information available on the web sites. Checking the requirements would especially be important during the lifetime of a development project. Information on current ordinances and safety setback requirements is summarized in Table 1.
Table 1. Setback References in California County Ordinances
Internet Site Ordinance Setback Reference Alameda code for wind energy not
available on internet Draft Environmental Impact Report, Repowering a Portion of the Altamont Pass Wind Resource Area, Appendix A, Alameda County Windfarm Standard Conditions
Paragraph 15. Safety Setback
Contra Costa http://www.co.contra-costa.ca.us/
County Code, Title 8 Zoning, Ch. 88-3 Wind Energy Conversion Systems
88-3.602 Setback Requirements
Kern http://ordlink.com/codes/kerncoun/
Title 19 Zoning, Chapter 19.64 WIND ENERGY (WE) COMBINING DISTRICT
19.64.140 Development standards and conditions
Merced http://web.co.merced.ca.us/planning/zoningord.html
Zoning Code (Ordinance) Ch. 18.02, Agricultural Zones
Table 5 Agricultural Zones Development Standards
Riverside http://www.tlma.co.riverside.ca.us/planning/ord348.html
Ordinance 348, Section 18.41, Commercial Wind Energy Conversion Systems Permits
18.41.d(1) Safety Setbacks
Solano code for wind energy not available on internet
Wind Turbine Siting Plan and Environmental Impact Report 1987
Page 17 Safety Setbacks
4.3 Wind Turbine Setback Comparison Table 2 below lists setbacks for several of the counties organized by feature that the turbine must be displaced from, such as a property line. The distances are stated in multiples of overall turbine height (see ). If a fixed distance is included with the multiple, then the maximum of the two values must be used for the setback.
Figure 1
________________________________________________________________________ Permitting Setbacks for Wind Turbines in California and the Blade Throw Hazard 6

CWEC-2005-001
Table 2. Safety Setback Comparison
NOTE: For reference only- check counties for current zoning requirements.
Property Line Dwelling Roads Reductions in Setbacks
Alameda County 3x/300 ft (91 m), more on slope
3x/500 ft (152 m), more on slope
3x/500 ft (152 m), 6x/500 ft from I-580, more on sloped terrain
maximum 50% reduction from building site or dwelling unit but minimum 1.25x, road setback to no less than 300 ft (91 m)
Contra Costa County 3x/500 ft (152 m)
1000 ft (305 m) None exceptions not spelled in ordinance can be filed with county
Kern County 4x/500 ft (152 m) <40 acres or not wind energy zone, 1.5x >40 acres
4x/1000 ft (305 m) off-site
1.5x With agreement from adjacent owners to no less than 1.5x
Riverside County 1.1x to adjacent Wind Energy Zones
3x/500 ft (152 m) to lot line with dwelling
1.25x for lightly traveled, 1.5x/500 ft (152 m) for highly traveled.
None
Solano County 3x/1000 ft (304 m) adjacent to residential zoning, 3x from other zonings
3x/1000 ft (304 m)
3x Setback waived with agreement from owners of adjacent parcels with wind turbines
There is quite a mixture of requirements amongst the counties. Riverside County maintains the minimum setback distances to properties with adjacent wind energy zoning. Also note that Alameda County has adjustments for sloping terrain. If the ground elevation of the turbine is two or more times the height of the turbine above the feature, the setback distance increases from three times to four times. All with exception of Riverside County allow for reduction of the setback distance with special consideration. An example of reduced setback can be found in the Altamont Repowering EIR (Alameda County 1998b), where a developer submitted a blade throw analysis as substantiation for the reduction. Merced County, as stated before, with some wind energy development in the Pacheco Pass area, utilizes standard building setbacks for wind turbines in agricultural districts.
________________________________________________________________________ Permitting Setbacks for Wind Turbines in California and the Blade Throw Hazard 7

CWEC-2005-001
4.4 County Wind Energy Ordinances in the Literature With exception to Solano County, the ordinances are not explanatory documents; no background information is provided. The most comprehensive paper on the subject of wind energy permitting in California comes from McClendon (1985). Although this paper was written in 1985, it captures the essence of the process at the time and generally not much has changed in the interim. Another paper by Throgmorton (1987) focuses on Riverside County development exclusively. Further clues to the development of standards can be found in Environmental Impact Reports written for the counties on specific developments. The counties will be discussed separately below. References in the literature to safety setbacks are scarce. One can be found in Taylor (1991). Taylor proposed setbacks for a 30-meter diameter rotor machine, but no tower height is mentioned. The proposed setbacks were 120-170 meters from a habitation or village, 50 meters from a lightly traveled road, and 100 meters from a heavily traveled road. Another mention of setbacks for safety can be found in a Windpower Monthly article regarding a rotor failure in Denmark (Møller 1987). A setback of 90 meters plus 2.7 times the rotor diameter was proposed. No guidance can be obtained from the Wind Energy Permitting Handbook available from the National Wind Coordinating Committee (NWCC 2002). In all the above references, there is no discussion of the technical basis for the setbacks.
4.4.1 Alameda County Ordinance Alameda County, encompassing most of the Altamont pass, was one of the first regions in the world to have large-scale wind energy development. The Altamont Pass area has until recently been isolated from population centers, lowering the possibility of conflict with the community. The McClendon paper (1985) reports concerns over safety and reliability of wind turbines resulted in an ad-hoc public/industry group to develop new standards. The setbacks as they stand today can be found in Resolution Number Z-5361 of the Zoning Administrator of Alameda County from 5 September 1984. There is no known technical description on how the setbacks were developed.
4.4.2 Contra Costa County Ordinance Contra Costa encompasses the northern portion of the Altamont pass. The zoning language is much less specific than Alameda County, but the setbacks are similar.
4.4.3 Kern County Ordinance According to county personnel and from McClendon (1985), the standards for Kern County were developed with an ad-hoc committee of wind energy people and other interests, as in the case with Alameda County. Kern has stricter setbacks for properties not zoned for wind energy development, but is less restrictive for roads (see ). Table 2
4.4.4 Riverside County Ordinance Riverside County can always be viewed as an area of intense development. Regulations were established after an extensive EIR by Wagstaff and Brady (Riverside County California, United States Bureau of Land Management. et al. 1982). Clues to the
________________________________________________________________________ Permitting Setbacks for Wind Turbines in California and the Blade Throw Hazard 8
CWEC-2005-001
majority of the setback distances can be found in the report. Although there is no technical basis for the original setback of three times the total height of the turbine, one can infer that this distance arose from the discussion of wake effects. It was expected that in-row spacing for wake effects would be six diameters, and adjacent wind energy parcels would require a spacing of at least half this distance. The report also mentions an estimate of the throw distance for the MOD-0A, an early Westinghouse machine. The stated value of 500 ft (152 m) translates to three times overall height for this turbine. Evolution of the ordinance resulted in reduction of some of the setbacks, which now seem to offer a buffer for the possibility of tower collapse.
4.4.5 Solano County Ordinance Solano County also developed wind turbine requirements with industry involvement in 1985. The outcome of this work was the Solano County Wind Turbine Siting Plan (Solano County 1987), which remains as the guide for permitting in the county. The plan supercedes the current language in the zoning ordinance that has setbacks of 1.25 times the overall turbine height. This plan was also developed by the authors of the Riverside County EIR, and proposes a “three times” setback. The estimated blade throw of the MOD-0A is again mentioned. There is a comparison of the setbacks with the potential blade throw of the MOD-2 turbine. The blade throw of this turbine in a vacuum was estimated at 1300 feet (396 m, 3.7 times overall turbine height) for a broken tip and 700 feet (213 m, 2 times overall turbine height) for the whole blade. There is no technical discussion for these values and they are not tied into the proposed spacing. Also amongst the county literature is the Montezuma Hills EIR (Solano County and Earth Metrics 1989), where a three times diameter safety setback was proposed, with no consideration for turbine height. Neither reference provides a technical basis for the setback distance.
5 Blade Failure Probabilities We now turn to the probability of a blade failure occurring. Probabilities will be discussed in terms of ratios. For example, a coin toss with heads has a one in two probability, represented equally as 0.5, ½, 5 × 10⁻¹. A probability of something occurring once in one-hundred trials can be represented as 10-2. The probability applied to blade failures will be stated as the probability of failure for a turbine in one year of operation. A probability of 10-2 can then be understood that on average there will be one blade failure in a year for every 100 turbines. Reporting on turbine failures is very limited, most likely due to the sensitivity of the industry; however there are a few accounts in the literature. Also, there are statistics in the public domain of blade failures in Alameda County and from the WindStats newsletter for Denmark and Germany. Types of blade failures are as follows:
• Root connection full blade failure • Partial blade failure from lightning damage • Failure at outboard aerodynamic device • Failure from tower strike • Partial blade failure due to defect
________________________________________________________________________ Permitting Setbacks for Wind Turbines in California and the Blade Throw Hazard 9
CWEC-2005-001
• Partial blade failure from extreme load buckling Some of the causes of blade failures:
• Unforeseen environmental events outside the design envelope • Failure of turbine control/safety system • Human error • Incorrect design for ultimate loads • Incorrect design for fatigue loads • Poor manufacturing quality
Not surprisingly, most failures are a combination of these factors, which points to the complexity of the technology. And, the probabilities of some events are highly correlated with each other. For example, loss of grid power is highly correlated with high wind events. The potential then exists for a control system malfunction due to loss of power to coincide with a high loading event. Thus the turbine designer must plan for both events occurring simultaneously.
5.1 Blade Failures in the Literature One of the earliest documented blade failure events comes from one of the first applications of utility-scale wind energy (Putnam 1948). It is also one of the few accounts with a published distance. The Smith Putnam 1.25 MW turbine suffered a blade failure in its test campaign resulting in a blade throw of 750 ft (230 m), or 3.7 times the overall height. The failure was attributed to lack of knowledge of the design loads for the turbine. The blade throw was probably exacerbated by siting on a slope (approximately ten degrees). The blade was of steel construction, with a weight of eight tons (7260 kg). That is at least 50% heavier than modern construction. A heavier blade could fly farther due to a reduced drag-to-weight ratio (Eggers, Holley et al. 2001). The next period of literature deals with the analysis of large-scale turbines under development in the 1970s and early 1980s. Although the possibility of failure was discussed, no mention of the probability was placed forward for the Department of Energy (DOE) MOD series turbines such as the General Electric MOD-1 (General Electric 1979) and Boeing MOD-2 (Lynette and Poore 1979). The Solar Energy Research Institute (SERI) conducted a preliminary study of wind turbine component reliability (Edesess and McConnell 1979). Using an analysis of the individual failure rate estimates and inspection intervals of the rotor and braking systems, the authors predicted a failure rate for the wind turbine rotor at 1.2 × 10⁻² per year. A strong early wind program in Sweden prompted studies of the subject (Eggwertz, Carlsson et al. 1981) where the first attempts at analyzing the blade throw hazard was attempted. The blade throw analysis is discussed below. The first guess at the probability of failure was made, at one in 100,000 (10-5) failures per turbine per year. The evolution of the wind industry back to smaller turbines brought large scale manufacturing and experience was gained with failures of equipment. In a 1989 paper, De Vries (1989) conducted a blind survey of manufacturers that reported on 133 turbine
________________________________________________________________________ Permitting Setbacks for Wind Turbines in California and the Blade Throw Hazard 10
CWEC-2005-001
failures in the industry. De Vries also placed probabilities at 2 × 10⁻² rotor failures per turbine per year for the Netherlands, 3 to 5 × 10⁻³ for Denmark and 3 × 10⁻³ for the United States. This is two to three orders of magnitude higher than predicted by Eggwertz, but came closer to the SERI analysis. Reports of failures can be found occasionally in Windpower Monthly; for example a rotor overspeed failure in Denmark (Møller 1987) and full-blade failures in Spain (Luke 1995). A report in the technical literature comes from Germanischer Lloyd (Nath and Rogge 1991), one of the certification bodies for wind energy. The paper describes two medium-size turbine blade failures. The rotor diameter and tower height were not reported. One failure was attributed to insufficient shutdown braking force resulting in overspeed, and blades were thrown to 150 and 175 meters. The other failure was attributed to poor manufacturing quality and blade fragments were thrown 200 meters. Updates to certification requirements were made as a result of the failure investigations. These certification requirements call for redundancy in safety shutdown systems and quality control in the blade manufacturing process. De Vries had also earlier suggested stricter certification requirements to reduce the blade failure rate. One wind turbine manufacturer has made a public testimonial of their blade failure rate. A managing engineer at Vestas, in testimony for the Kittitas Valley Wind Power Project in Washington State (Jorgensen 2003), declared that there had been only one blade failure in ten-thousand units for twelve years. The failure reported occurred in 1992 on a V39-500 kW machine and a blade was thrown 50-75 meters. If we assume an average of six years of total operation for the entire fleet, the failure rate would be estimated at 1.6 × 10-
5 blade failures per turbine per year.
5.2 Alameda County Turbine Failure Data Under Article 15 of the Alameda County Windfarm Standard Conditions (Alameda County 1998a), a windfarm operator must notify the County Building Official of any tower collapse, blade throw, fire, or injury to worker. Recent files of failure data from the county building department were compiled by the CWEC in order to determine failure rates. County representatives claim that not all operators have been diligent in their reporting, but one operator of Kenetech 56-100 machines has been. These turbines are 100 kW machines with 56 ft (17 m) diameter rotors. The majority were manufactured in the 1980s. The failure reports only indicate the failure type; no mention of blade throw distance (if it occurred at all), or the conditions at time of failure, is mentioned. The failures could have been discovered as the result of an inspection and the blade had not yet separated from the rotor. The failure data covered the year 2000 to fall of 2003. The number of Kenetech 56-100 machines in operation by this operator was obtained from the California Wind Performance Reporting System (http://wprs.ucdavis.edu/). For the time period of the reports, the blade failure rate was 5.4 × 10⁻³ failures per turbine per year. This value coincides well with that reported by De Vries (1989). As a comparison the failure rate for the tower was 6.9 × 10⁻⁴ failures per turbine per year, an order of magnitude less probable than the blade failure rate.
________________________________________________________________________ Permitting Setbacks for Wind Turbines in California and the Blade Throw Hazard 11

CWEC-2005-001
5.3 WindStats Turbine Failure Data WindStats is a technical publication for the wind industry published quarterly in Denmark. Failure data is available for wind turbines reported in Denmark and Germany. The Denmark data has been available since 1993; the Germany data from 1996. Like the Alameda County data, the data only indicates failure type; no mention of blade throw distance (if it occurred at all), or the conditions at the time of failure, is mentioned. Data up to the Spring 2004 issue was compiled. For Denmark, the failure rate for blades was 3.4 × 10⁻³ failures per turbine per year. Again, this is within the values reported by De Vries (1989) in the late 1980s. The tower failures for the same period are 1.0 × 10⁻⁴. As with the Alameda data, the tower failure probability is an order of magnitude lower than the blade failures. For Germany, the data is reported as “rotor” failures, which for the reporting period was 1.5 × 10⁻² failures per turbine per year. This is an order of magnitude higher than the Denmark data, but on the same order of the Netherlands in De Vries. There are no apparent trends in the data indicating changes in failure rates over time.
5.4 Remarks on Blade Failure Probabilities The limited available statistics show that the blade failure probability is on the order of 10-3 to 10-2 failures per turbine per year, and there seems to be no evidence showing improvement with technology. With industry experience the estimate of Eggwertz (1981) of 10-5 failures turned out to be optimistic. The failure rate of Vestas blades estimated at 1.6 × 10⁻⁵, is impressive and if the industry as a whole could attain this rate the discussion of safety setbacks would be made much simpler. However, this statistic should be independently verified before being used as an example for the industry. A report by the Energy Research and Development Administration (ERDA 1977) mentions the possibility of designing fail-safe cable retention systems to prevent blade throws, similar to the safety cable systems for race car wheels. Modern turbines have large cables for lightning protection, perhaps these can be used for this purpose also.
6 Blade Throw Analyses Analysis of potential blade throws were studied by four researchers and details of their work will be discussed below. The impetus behind these researches was to study the hazard potential of the blade failure. Blade failures can occur with the machine operating or stationary, however the operating case was only studied in the literature.
6.1 Background of Blade Throw Models
6.1.1 Parked Turbines Wind turbines are parked if the wind speed is out of the operating range, or if there is fault detected while the wind speed is within the operating limits. The typical high wind shutdown for a wind turbine is 25 m/s. The turbine is usually designed to withstand a peak gust outlined by the International Electrotechnical Commission (IEC). Peak gusts
________________________________________________________________________ Permitting Setbacks for Wind Turbines in California and the Blade Throw Hazard 12
CWEC-2005-001
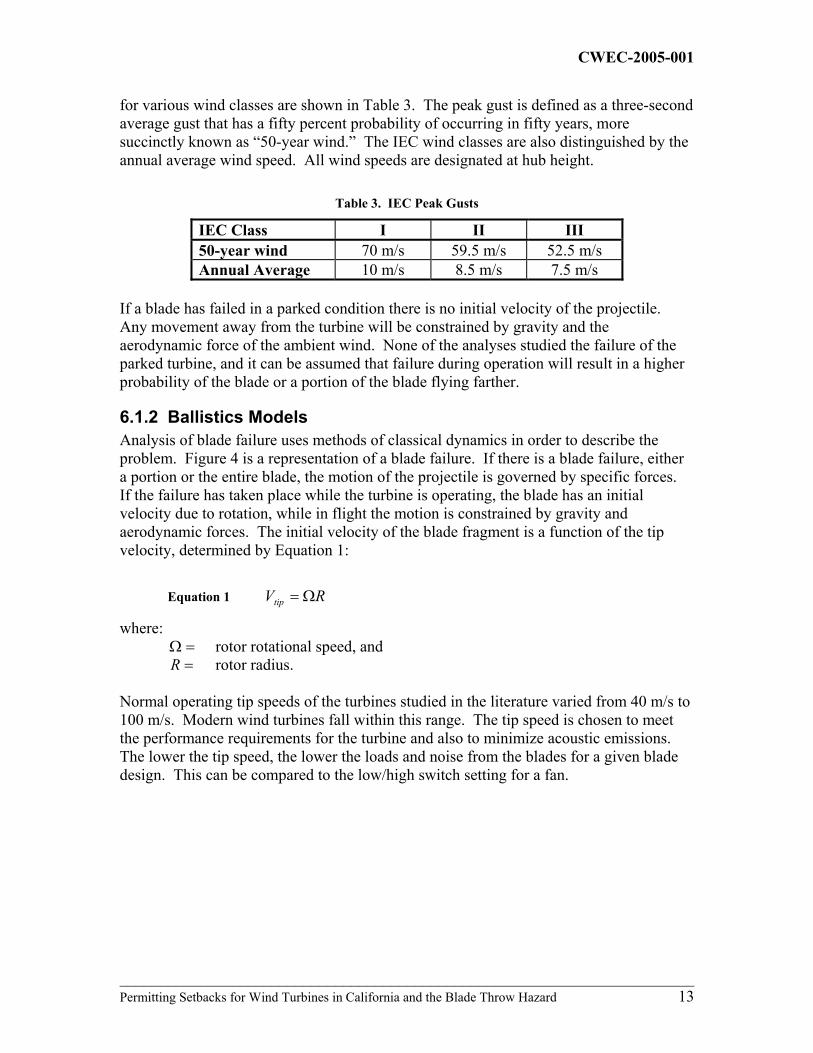
for various wind classes are shown in Table 3. The peak gust is defined as a three-second average gust that has a fifty percent probability of occurring in fifty years, more succinctly known as “50-year wind.” The IEC wind classes are also distinguished by the annual average wind speed. All wind speeds are designated at hub height.
Table 3. IEC Peak Gusts
IEC Class I II III 50-year wind 70 m/s 59.5 m/s 52.5 m/s Annual Average 10 m/s 8.5 m/s 7.5 m/s
If a blade has failed in a parked condition there is no initial velocity of the projectile. Any movement away from the turbine will be constrained by gravity and the aerodynamic force of the ambient wind. None of the analyses studied the failure of the parked turbine, and it can be assumed that failure during operation will result in a higher probability of the blade or a portion of the blade flying farther.
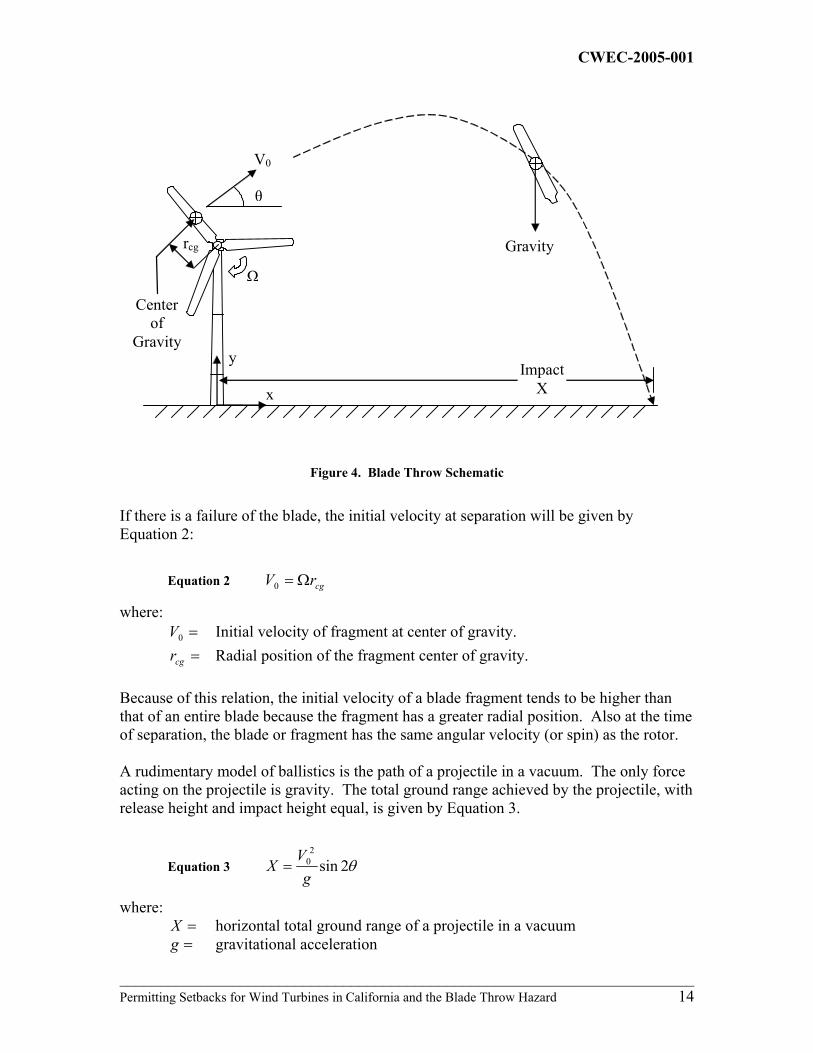
6.1.2 Ballistics Models Analysis of blade failure uses methods of classical dynamics in order to describe the problem. Figure 4 is a representation of a blade failure. If there is a blade failure, either a portion or the entire blade, the motion of the projectile is governed by specific forces. If the failure has taken place while the turbine is operating, the blade has an initial velocity due to rotation, while in flight the motion is constrained by gravity and aerodynamic forces. The initial velocity of the blade fragment is a function of the tip velocity, determined by Equation 1:
Equation 1 RVtip Ω=
where: =Ω rotor rotational speed, and =R rotor radius.
Normal operating tip speeds of the turbines studied in the literature varied from 40 m/s to 100 m/s. Modern wind turbines fall within this range. The tip speed is chosen to meet the performance requirements for the turbine and also to minimize acoustic emissions. The lower the tip speed, the lower the loads and noise from the blades for a given blade design. This can be compared to the low/high switch setting for a fan.
________________________________________________________________________ Permitting Setbacks for Wind Turbines in California and the Blade Throw Hazard 13
CWEC-2005-001
Ω
Center of
Gravity
rcg
θ
V0
Impact X x
y
Gravity
Figure 4. Blade Throw Schematic
If there is a failure of the blade, the initial velocity at separation will be given by
: Equation 2
Equation 2 V cgrΩ=0
where: =0V Initial velocity of fragment at center of gravity. =cgr Radial position of the fragment center of gravity.
Because of this relation, the initial velocity of a blade fragment tends to be higher than that of an entire blade because the fragment has a greater radial position. Also at the time of separation, the blade or fragment has the same angular velocity (or spin) as the rotor. A rudimentary model of ballistics is the path of a projectile in a vacuum. The only force acting on the projectile is gravity. The total ground range achieved by the projectile, with release height and impact height equal, is given by Equation 3.
Equation 3 θ2sin2
0
gV
=X
where: =X horizontal total ground range of a projectile in a vacuum
=g gravitational acceleration
________________________________________________________________________ Permitting Setbacks for Wind Turbines in California and the Blade Throw Hazard 14
CWEC-2005-001
=θ release angle between the velocity vector and horizontal. The release angle is directly related to the blade azimuth, which is the position of the rotor at a particular time. Because the aerodynamic forces are not modeled, the projectile is not affected by the ambient winds, and does not travel downwind. The maximum range in a vacuum is achieved when the release angle is 45°. With this value of the release angle, Equation 3 becomes Equation 4.
Equation 4 g
V 20
max =X
where: =maxX maximum horizontal range of a projectile in a vacuum.
The values of range from this simple model are not realistic because the atmosphere is not a vacuum. This simple model however, shows the importance of the release velocity because it is a squared term. For example, a 10% increase in release velocity increases the maximum range by 21%. This model also shows the dependence on the release angle. In any probability study this would have to be a random parameter, because it is assumed that a rotor failure would not be dependent on the azimuthal angle. More complex models, to be discussed below, increase on the complexity of the vacuum model. The most common approach is to assume that the aerodynamic force is proportional to the square of the instantaneous velocity. The aerodynamic force is separated into lift and drag, and the constants of proportionality are called coefficients of lift and drag (CL and CD). Both the crosswind and downwind distances are determined. The solutions for the projectile range from these models cannot be solved directly and require numerical methods. The next level of complexity assumes that CL and CD are dependent on the orientation of the projectile, and the blade is modeled as a rotating and translating wing.
6.1.3 Rotor Overspeed One particularly hazardous failure scenario is turbine overspeed. The increased velocity in overspeed will over stress the rotor blade, and, in the event of a failure, increase the range of the projectile. The rotor is usually designed with a safety factor of 1.5. If the rotor loads are approximately proportional to the rotor speed (Eggers, Holley et al. 2001), the rotor could possibly fail at 150% of nominal rotor speed. To prevent this possibility, most wind turbines are equipped with redundant safety systems to shutdown the rotor. A turbine with industry certification (e.g. Germanischer Lloyd 1993), must have a safety system completely independent of the control system. The safety system must also have two mutually independent braking systems. Usually the blades pitch to release the aerodynamic torque and a brake is applied to the shaft. In the event of a failure in one system, the other system must be able to hold the rotor speed below maximum. An emergency shutdown is typically designed to occur if the rotor speed exceeds 110% of
________________________________________________________________________ Permitting Setbacks for Wind Turbines in California and the Blade Throw Hazard 15
CWEC-2005-001
nominal. Even with redundant safety systems, rotor overspeed still occurs in industry, sometimes by human error when the safety systems have been defeated during maintenance.
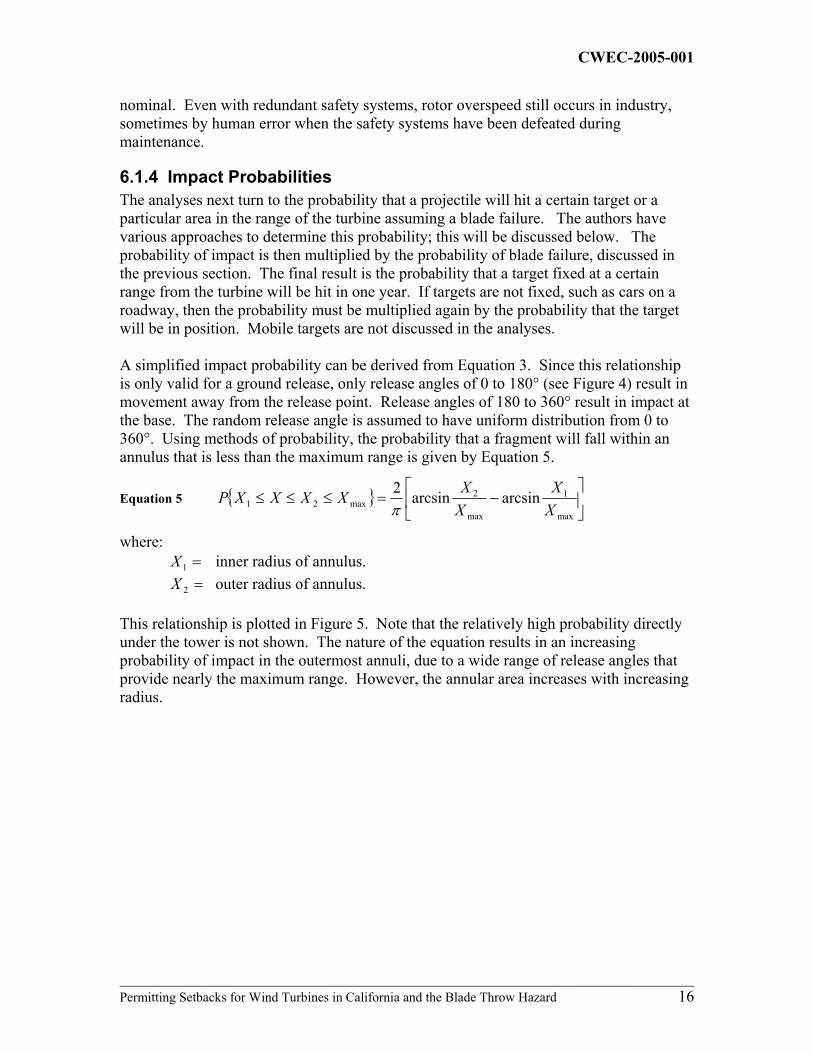
6.1.4 Impact Probabilities The analyses next turn to the probability that a projectile will hit a certain target or a particular area in the range of the turbine assuming a blade failure. The authors have various approaches to determine this probability; this will be discussed below. The probability of impact is then multiplied by the probability of blade failure, discussed in the previous section. The final result is the probability that a target fixed at a certain range from the turbine will be hit in one year. If targets are not fixed, such as cars on a roadway, then the probability must be multiplied again by the probability that the target will be in position. Mobile targets are not discussed in the analyses. A simplified impact probability can be derived from Equation 3. Since this relationship is only valid for a ground release, only release angles of 0 to 180° (see Figure 4) result in movement away from the release point. Release angles of 180 to 360° result in impact at the base. The random release angle is assumed to have uniform distribution from 0 to 360°. Using methods of probability, the probability that a fragment will fall within an annulus that is less than the maximum range is given by Equation 5.
Equation 5
−=≤≤≤
max
1
max
2max21 arcsinarcsin2
XX
XX
XXXXPπ
where: =1X inner radius of annulus. =2X outer radius of annulus.
This relationship is plotted in Figure 5. Note that the relatively high probability directly under the tower is not shown. The nature of the equation results in an increasing probability of impact in the outermost annuli, due to a wide range of release angles that provide nearly the maximum range. However, the annular area increases with increasing radius.
________________________________________________________________________ Permitting Setbacks for Wind Turbines in California and the Blade Throw Hazard 16
CWEC-2005-001
Normalized Annular Width 0.05(X2-X1)/Xmax
0
0.02
0.04
0.06
0.08
0.1
0.12
0 0.2 0.4 0.6 0.8 1 1.2
Normalized Annulus Radius
Prob
abili
ty o
f Im
pact
in A
nnul
us
Figure 5. Probability of Impact Within an Annular Region
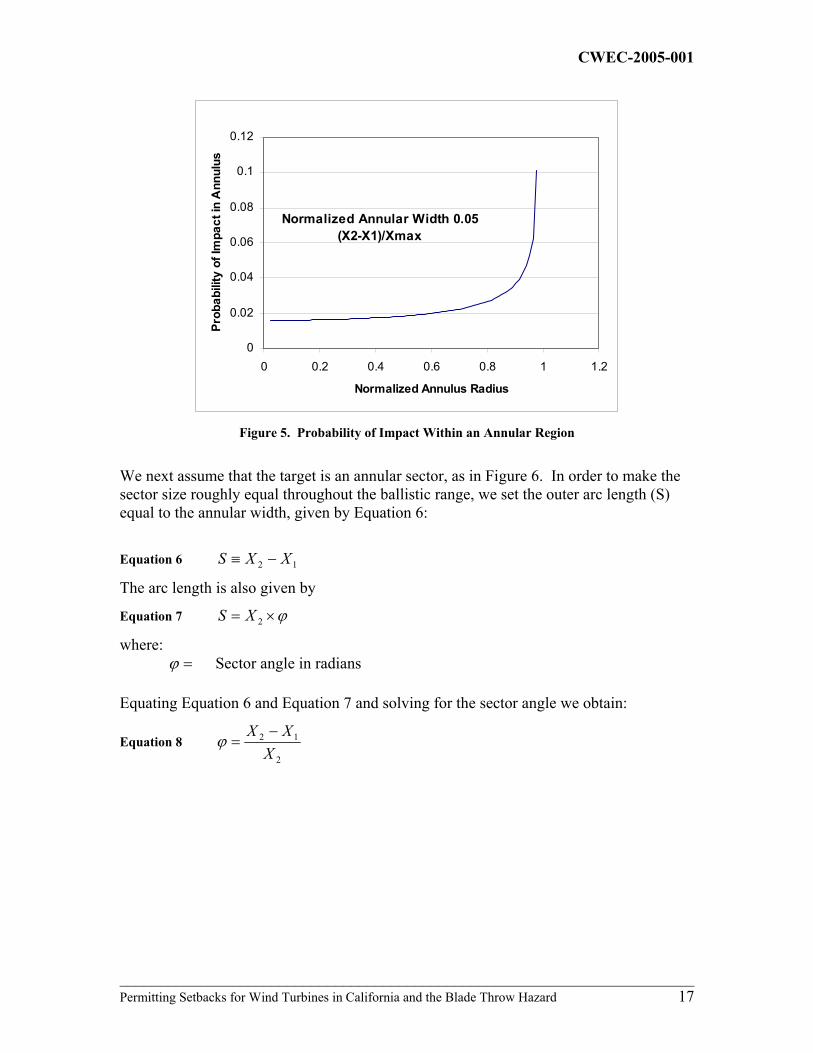
We next assume that the target is an annular sector, as in . In order to make the sector size roughly equal throughout the ballistic range, we set the outer arc length (S) equal to the annular width, given by Equation 6:
Figure 6
Equation 6 12 XXS −≡
The arc length is also given by
Equation 7 ϕ×= 2XS
where: =ϕ Sector angle in radians
Equating Equation 6 and Equation 7 and solving for the sector angle we obtain:
Equation 8 2
12
XXX −
=ϕ
________________________________________________________________________ Permitting Setbacks for Wind Turbines in California and the Blade Throw Hazard 17
CWEC-2005-001
S
X2 φ
X1
Figure 6. Target Annular Sector
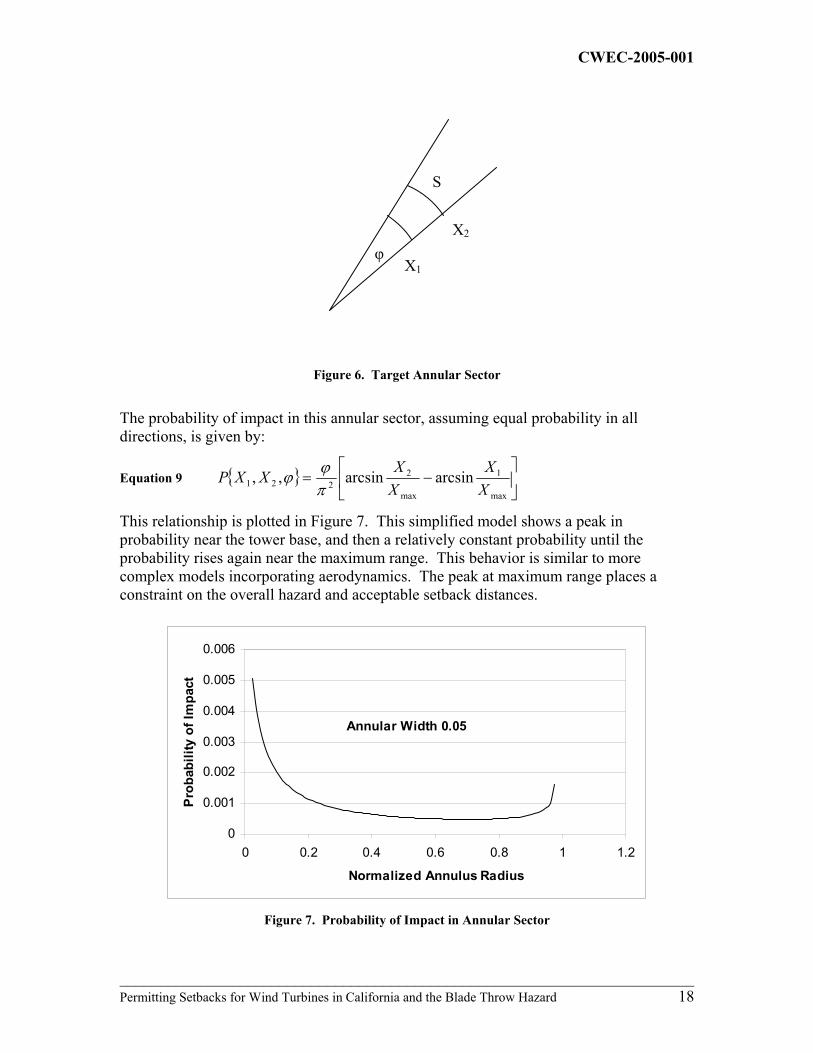
The probability of impact in this annular sector, assuming equal probability in all directions, is given by:
Equation 9
−=
max
1
max
2221 arcsinarcsin,,
XX
XX
XXPπϕϕ
This relationship is plotted in Figure 7. This simplified model shows a peak in probability near the tower base, and then a relatively constant probability until the probability rises again near the maximum range. This behavior is similar to more complex models incorporating aerodynamics. The peak at maximum range places a constraint on the overall hazard and acceptable setback distances.
Annular Width 0.05
0
0.001
0.002
0.003
0.004
0.005
0.006
0 0.2 0.4 0.6 0.8 1 1.2
Normalized Annulus Radius
Pro
babi
lity
of Im
pact
Figure 7. Probability of Impact in Annular Sector
________________________________________________________________________ Permitting Setbacks for Wind Turbines in California and the Blade Throw Hazard 18

CWEC-2005-001
6.1.5 Multiple Turbines If there is more than one turbine in the area, such as in a wind plant, then the individual probabilities must be added for a particular area. This is mentioned briefly in Macqueen (1983). The probabilities add according to the Law of Total Probability; for two turbines this is represented in Equation 10.
Equation 10 ),()()()( BAPBPAPBAP −+=+
where: Probability of A or B or both occurring =+ )( BAP
=)(AP Probability of A occurring =)(BP Probability of B occurring. =),( BAP Probability of both A and B occurring (Equation 11).
Equation 11 )/()()/()(),( BAPBPABPAPBAP ==
where: Conditional probability B occurring given A has occurred =)/( ABP
=)/( BAP Conditional probability of A occurring given B has occurred
If the events are independent, which would be the case in a random failure, the conditional probabilities are from Equation 12 and Equation 13.
Equation 12 )()/( BPABP =
Equation 13 )()/( APBAP =
The overall probabilities become Equation 14.
Equation 14 )()()()()( BPAPBPAPBAP −+=+
As an example, consider a region that has a 10-4 probability of impact from a Turbine “A” and a 10-5 probability of impact from Turbine “B”. From Equation 14, the overall probability of impact is:
4
5454
101.1)()1010(1010)(
−
−−−−
×=+
×−+=+
BAPBAP
These formulae can be expanded for multiple turbines.
6.1.6 Overall Probability The overall probability can then be compared to other risks. De Vries (1989) mentions a government policy in the Netherlands of one-in-a-million (10-6) per year risk level for new industrial activities. This is on the same order of present-day industry quality
________________________________________________________________________ Permitting Setbacks for Wind Turbines in California and the Blade Throw Hazard 19

CWEC-2005-001
programs, such as “Six-Sigma,” with a failure rate objective of three-in-a-million. Previously we discussed blade failure probabilities on the order of one-in-a-thousand (10-3) to one- in-a-hundred (10-2). If we assume a conservative value of one-in-a-hundred (10-2), this results in a required probability of impact of less than one-in-ten-thousand (10-4) per year.
6.2 Blade Throw Analyses in the Literature
6.2.1 Eggwertz, Sweden 1981 This is the first documentation of a blade throw analysis, and is a comprehensive report on turbine structural safety for the Swedish industry. At the time, megawatt-size turbines were being considered for power production in Sweden. The analysis referenced previous work in Sweden on the possibility of blade gliding due to spin; however the extension of the blade flight was considered negligible. For the examination of risk areas, the drag coefficient in the analysis was fixed at 0.5 for lateral and downwind directions, and the lift coefficient was assumed to be zero. For the probability analysis the blade and azimuth locations were divided into equal spanwise sections and equal weighting was applied to failure at these sections. This allowed for a semi-random probability of failure of the blade at a particular section and at a particular azimuth. A total of 144 throws were modeled. A discussion was made of the probability of blade failure, mentioned in the Blade Failure section, but no criteria were applied in the final analysis. The discussion of the physics and probability of impact is very detailed. The danger area included considerations of sliding and rotation of the blade fragment. The fragment was assumed to translate on the ground and come to a complete stop due to friction. The area surrounding the turbine was divided into 10-m rings and the fragment impact area within the ring was divided by the total ring area. The probability calculated assumes equal probability of launch for all wind directions. The result was the risk level that a target within a ring will be hit. The overall analysis was conducted for a 39 meter radius machine at an 80 meter hub height operating at 25 rpm in a 7 m/s wind speed. This was considered to be the most likely operating condition. Assuming that a failure had occurred, the probability was high at the tower base and then relatively even at 10-3 until 200 meters. The analysis showed the probability of impact from any fragment dropped off dramatically (below 10-5) at 220 meters. This throw distance is 1.8 times the overall turbine height. The throw distance for a probability of 10-4 is only slightly less than this value. The dramatic drop off in the probability at 220 meters was used as a basis for the safety area around the turbine; however, the calculations were made at nominal operating conditions and at a single wind speed. Failures in an overspeed conditions would increase this area. The next published work (Macqueen, Ainsilie et al. 1983) expanded on Eggwertz’s work to include failure possibilities besides those at nominal operating conditions.
________________________________________________________________________ Permitting Setbacks for Wind Turbines in California and the Blade Throw Hazard 20

CWEC-2005-001
6.2.2 Macqueen, United Kingdom 1983 This work was conducted in the United Kingdom for the Central Electricity Generating Board. As in Sweden, the United Kingdom was considering generating electricity with megawatt-size wind turbines. Macqueen starts by bounding the problem with an analysis of the maximum launch velocity of a blade fragment being limited by the approach of the speed of sound. An estimate of the maximum velocity is 310 m/s in an extreme overspeed condition for a typical turbine. The projectile distance would not exceed 10 km using classical ballistics results with no aerodynamic drag. It is unreasonable to expect setback criteria of this distance; the turbine rotor would probably fail at a much lower velocity. However this provides an upper extreme limit. The analysis followed the same lines as Eggwertz with analysis of gliding and tumbling and classical ballistics with average lift and drag coefficients. The tumbling analysis was to determine the conditions for stable, gliding flight of a fragment. Macqueen reasoned that the flight time of a fragment was several times longer than one tumbling period and therefore stable flight could not be expected. However gliding was considered as a rare case if the blade did not leave with sufficient rotational energy. For the tumbling case, Macqueen reasoned a CL of 0.0 and a CD of 1.0. For gliding, lift was chosen as CL= 0.8 and CD= 0.4. Macqueen estimated the probability of gliding occurring in a potential failure at 10-2 to 10-3. Macqueen also included a discussion of a three-dimensional model of blade flight, and concluded that the model did not show the blade achieving a stable gliding condition. Macqueen concludes that the effect of lift in the three dimensional case increases the range of flight by no more than 10%. A series of runs at equally spaced azimuthal positions were used to develop the probability distributions. The possibility of sliding after impact was not addressed in the current work. He then separated the analysis into two failure events, one at a 10% overspeed at average winds, the other at the maximum possible release velocity with an extreme gust. The turbine studied was of similar geometry to the MOD-2, with 91 m diameter rotor and 61 m hub height. The probability of impact is weighted by area (per square meter), and assumes equal distributions in all directions. Probability distributions showed peaks near the tower and at the maximum range, similar to the simplified model in . The probability of impact was then a function of the target and fragment size. Macqueen reasoned that the blade fragments would be large compared to target, making the probability independent of target size; however this would not be the case with a busy roadway, with many targets over a large area.
Figure 7
For overall probabilities Macqueen used the Eggwertz probability of 10-5 for rotor failures. Macqueen also compared the probabilities to a statistic of risk of death by lightning strike in the United Kingdom at 10-7 per year. For the turbine studied, a large 2.5 MW unit, the risk of being hit by a blade fragment within 210 m (approximately two times overall height) is equivalent to being struck by lightning. However, these results
________________________________________________________________________ Permitting Setbacks for Wind Turbines in California and the Blade Throw Hazard 21
CWEC-2005-001
were based on the blade failure probability of 10-5 and the assumption of a target size less than the overall blade area.
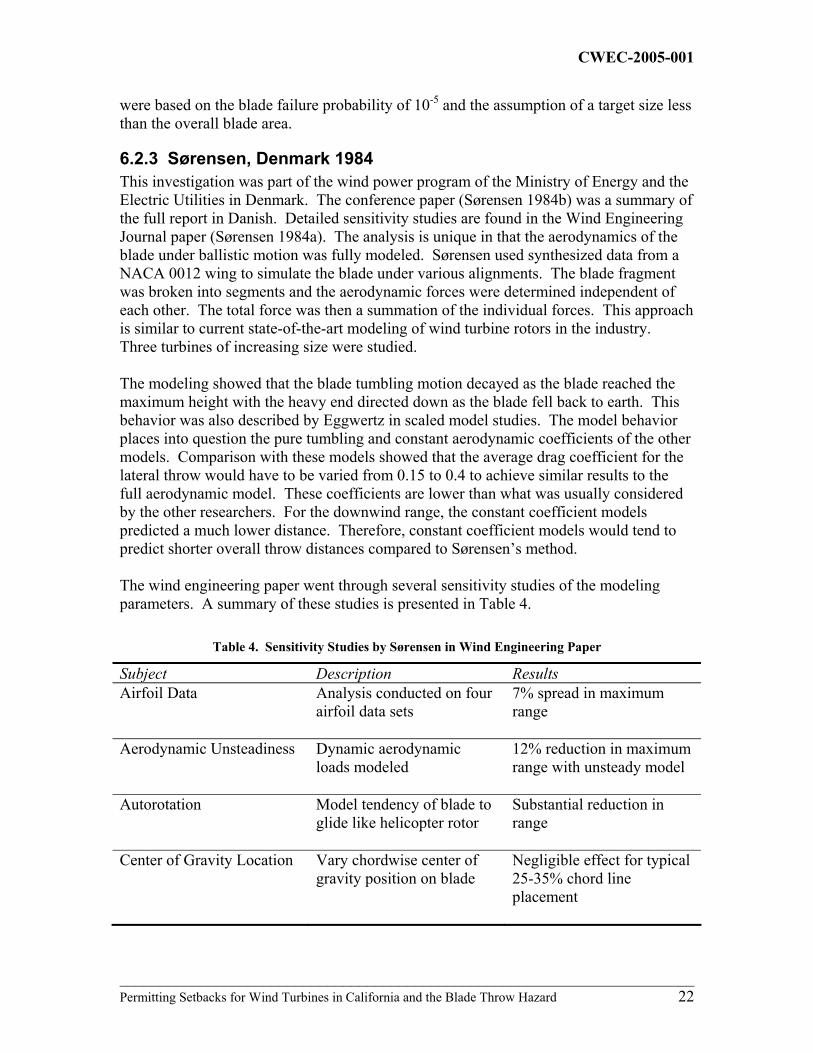
6.2.3 Sørensen, Denmark 1984 This investigation was part of the wind power program of the Ministry of Energy and the Electric Utilities in Denmark. The conference paper (Sørensen 1984b) was a summary of the full report in Danish. Detailed sensitivity studies are found in the Wind Engineering Journal paper (Sørensen 1984a). The analysis is unique in that the aerodynamics of the blade under ballistic motion was fully modeled. Sørensen used synthesized data from a NACA 0012 wing to simulate the blade under various alignments. The blade fragment was broken into segments and the aerodynamic forces were determined independent of each other. The total force was then a summation of the individual forces. This approach is similar to current state-of-the-art modeling of wind turbine rotors in the industry. Three turbines of increasing size were studied. The modeling showed that the blade tumbling motion decayed as the blade reached the maximum height with the heavy end directed down as the blade fell back to earth. This behavior was also described by Eggwertz in scaled model studies. The model behavior places into question the pure tumbling and constant aerodynamic coefficients of the other models. Comparison with these models showed that the average drag coefficient for the lateral throw would have to be varied from 0.15 to 0.4 to achieve similar results to the full aerodynamic model. These coefficients are lower than what was usually considered by the other researchers. For the downwind range, the constant coefficient models predicted a much lower distance. Therefore, constant coefficient models would tend to predict shorter overall throw distances compared to Sørensen’s method. The wind engineering paper went through several sensitivity studies of the modeling parameters. A summary of these studies is presented in . Table 4
Table 4. Sensitivity Studies by Sørensen in Wind Engineering Paper
Subject Description Results Airfoil Data Analysis conducted on four
airfoil data sets 7% spread in maximum range
Aerodynamic Unsteadiness Dynamic aerodynamic loads modeled
12% reduction in maximum range with unsteady model
Autorotation Model tendency of blade to glide like helicopter rotor
Substantial reduction in range
Center of Gravity Location Vary chordwise center of gravity position on blade
Negligible effect for typical 25-35% chord line placement
________________________________________________________________________ Permitting Setbacks for Wind Turbines in California and the Blade Throw Hazard 22
CWEC-2005-001
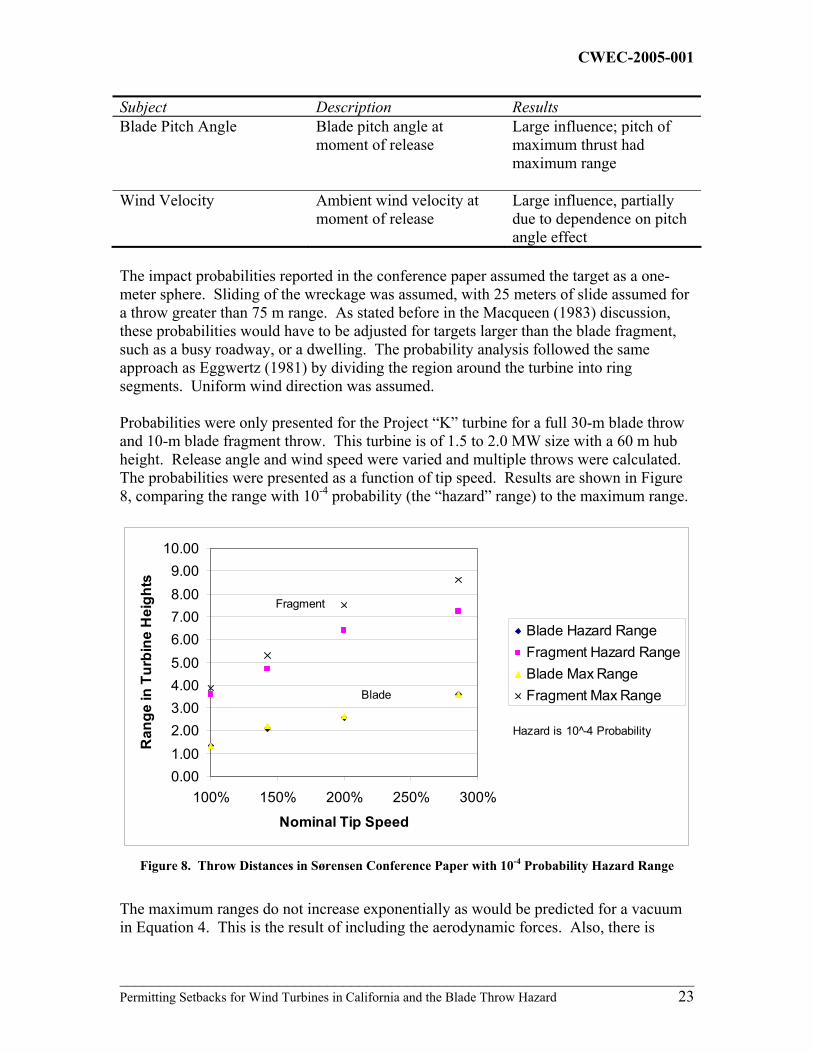
Subject Description Results Blade Pitch Angle Blade pitch angle at
moment of release Large influence; pitch of maximum thrust had maximum range
Wind Velocity Ambient wind velocity at moment of release
Large influence, partially due to dependence on pitch angle effect
The impact probabilities reported in the conference paper assumed the target as a one-meter sphere. Sliding of the wreckage was assumed, with 25 meters of slide assumed for a throw greater than 75 m range. As stated before in the Macqueen (1983) discussion, these probabilities would have to be adjusted for targets larger than the blade fragment, such as a busy roadway, or a dwelling. The probability analysis followed the same approach as Eggwertz (1981) by dividing the region around the turbine into ring segments. Uniform wind direction was assumed. Probabilities were only presented for the Project “K” turbine for a full 30-m blade throw and 10-m blade fragment throw. This turbine is of 1.5 to 2.0 MW size with a 60 m hub height. Release angle and wind speed were varied and multiple throws were calculated. The probabilities were presented as a function of tip speed. Results are shown in , comparing the range with 10-4 probability (the “hazard” range) to the maximum range.
Figure 8
Figure 8. Throw Distances in Sørensen Conference Paper with 10-4 Probability Hazard Range
0.001.002.003.004.005.006.007.008.009.00
10.00
100% 150% 200% 250% 300%
Nominal Tip Speed
Ran
ge in
Tur
bine
Hei
ghts
Blade Hazard RangeFragment Hazard RangeBlade Max RangeFragment Max RangeBlade
Fragment
Hazard is 10 -4 Probability
The maximum ranges do not increase exponentially as would be predicted for a vacuum in Equation 4. This is the result of including the aerodynamic forces. Also, there is
________________________________________________________________________ Permitting Setbacks for Wind Turbines in California and the Blade Throw Hazard 23

CWEC-2005-001
negligible difference for the full blade maximum range and range with 10-4 probability. This is not true for the fragment.
6.2.4 Eggers, United States 2001 This is the most recent analysis (Eggers, Holley et al. 2001) generated for the National Wind Technology Center in Colorado. The analysis used classical ballistic theory and assumed constant values of aerodynamic force coefficients. A discussion and analysis is made of the possibility of gliding flight assuming the blade achieves a stable gliding angle; it is assumed negligible. The low probability of this is reasoned due to the complex geometry of the blades, with varying chord, airfoil section, and twist. The mean values of drag (CD = 0.5) and normal force coefficients are considered constant during flight. Half and full-blade projectiles are analyzed. An example turbine was studied with a 15.2 meter rotor radius operating at 50 rpm in 11.2 to 22.4 m/s winds. A probability distribution, assuming equal weighting for all directions, was determined analytically and solved numerically. This method was unique in that several trials of throws were not necessary to obtain the distributions. Also assumed was that the failure was the result of an overspeed, and that the range of the overspeed failure was a Gaussian distribution between 1.25 and 1.75 times the nominal speed. Eggers, like Macqueen (1983), confirms peaks in the probability distribution near the tower and at maximum range. Two tower heights were also studied, showing higher probability at the tower base for the shorter tower. Probability values cannot be determined from the paper due to the limited resolution of figures.
6.3 Comparisons of Blade Throw Analysis Studies of example turbines were performed in all the analyses discussed previously. A comparison is shown below in . The maximum attainable lateral throw distance, normalized by overall turbine height, for a failure at nominal operating conditions is shown for the various analyses.
Figure 9
________________________________________________________________________ Permitting Setbacks for Wind Turbines in California and the Blade Throw Hazard 24

CWEC-2005-001
0.0
1.0
2.0
3.0
4.0
5.0
6.0
0 50 100 150
Turbine Overall Height (m)
Ran
ge in
Tur
bine
Hei
ghts
Full BladeBlade Fragment
Figure 9. Comparison of Blade Throw Analyses for Maximum Range at Nominal Operating
Conditions
Two observations can be made from a comparison of the analyses with failure at the nominal operating condition. The first is that as the overall turbine height increases, the range normalized by overall height decreases. This is primarily because the maximum range is dependent on turbine tip speed. As discussed previously, the tip speed has remained nearly the same as turbine size has increased. The other conclusion is that blade fragments fly farther than full blades. As stated previously, this is because the initial velocity at failure tends to be higher for the fragment than the entire blade.
7 Recommendations for Further Study The literature reviewed in this report does not specifically provide guidance for wind turbine setbacks. The following items of further study are proposed in order to obtain guidelines for setbacks.
7.1 Blade Failure Rate Unless there exists a more thorough database of blade failures, the value discussed in the Blade Failure section of 10-2 per turbine per year should be used for the blade failure probability. A lower probability might not significantly affect the results due to the peak in the impact probability near maximum range.
7.2 Turbine Sizes A mixture of turbine sizes should be studied to determine if setbacks should be a standard distance or a function of the turbine size. Turbine sizes currently marketed are 660 kW to 5 MW. Smaller turbines should be studied for stand-alone applications and review of existing hazards.
________________________________________________________________________ Permitting Setbacks for Wind Turbines in California and the Blade Throw Hazard 25
CWEC-2005-001
7.3 Position of Blade Break Since the position of the failure cannot be predicted with certainty, the approach of Eggwertz (1981) to divide the blade into sections should be used. In addition to randomizing the break position, turbines with aerodynamic devices, blade dampers, and lightning protection components on the blades should be studied as fragments.
7.4 Operating Conditions at Failure Since the throw distance is highly dependent on release velocity and ambient conditions, a probabilistic method should be developed to vary these parameters. Modern turbines with redundant braking systems should not develop an overspeed condition; however the possibility, albeit unknown, still exits. Perhaps the method of Eggers (2001) of varying the failure tip speed from 1.25 to 1.75 times nominal tip speed should be used.
7.5 Aerodynamic Model The methods of Sørensen (1984a) should be applied for the aerodynamic model. There was an effort to update his program to MATLAB at the Danish Technological University; however the status of this work is unknown. Further studies could be conducted to incorporate shear and turbulence into the model. With these effects included, the blade throw might exhibit constant CL and CD behavior which might warrant use of simpler models. The model should be built as a tool that can be used by the industry for use on any turbine to study specific cases such as permitting waivers.
7.6 Impact Modeling The methods of Eggwertz (1981) or Sørensen (1984a) should be used to model the physics at impact. Both have methods for including the effects of rotation and translation after impact.
7.7 Slope Effects Slope effects were not included in the reviewed analyses. Because of the common placement of turbines on ridgelines, as in the Altamont and the Tehachapi wind resource areas, the modification to the setback distance should be studied.
7.8 Validation Effort None of the analyses have been validated with actual failures. Validation with an actual failure can be made with the following information:
− Turbine tower height − Position of failure on rotor − Azimuth of failure (would be very hard to obtain) − Rotor speed − Pitch of blades
________________________________________________________________________ Permitting Setbacks for Wind Turbines in California and the Blade Throw Hazard 26
CWEC-2005-001
− Geometric details of the fragment (planform, airfoils, weight, cg, twist distribution)
− Wind speed, direction, and local air density − Distance and bearing of blade or fragment from tower base
Another effort would be to deliberately cause a blade failure and obtain the above information. This test could be conducted on a turbine at the end of its useful life in a clear field. Explosive bolts or a ring charge could be used to separate the blade or fragment from the turbine. The azimuth at break must be carefully determined.
8 Conclusions A study was performed on setbacks for permitting of wind energy. Counties with past and future development of wind energy have setbacks based on overall turbine height. The application and size of the setbacks varied widely across the counties. Most setbacks were established early in the development of the wind industry and were outcomes of ad hoc groups of government and industry. Reporting of wind turbine failures are scarce in the literature, but available data from Alameda County and from Europe show blade failures from one-in-one-hundred (10-2) to one-in-one-thousand (10-3) per turbine per year. Four researchers looked at modeling the blade throw risk in detail. Several authors analyzed but discounted the possibility of gliding flight, and instead used simplified models of the aerodynamics. Sørensen (1984a) used a three dimensional analysis of the blade fragment flight and showed the limitations of the simplified models. The literature, however, does not offer any guidance for applying setback distances that would be useful for wind energy planning. Items for further study are proposed in order to determine consistent standards.
9 References Alameda County (1998a). Repowering a Portion of the Altamont Pass Wind Resource Area (Draft EIR). Hayward, CA, Alameda County Community Development Agency. State Clearinghouse #98022024.
Alameda County (1998b). Repowering a Portion of the Altamont Pass Wind Resource Area (Final EIR). Hayward, CA, Alameda County Community Development Agency. State Clearinghouse #98022024.
De Vries, E. T. (1989). "The Safety of Wind Energy." EWEC '89 : European Wind Energy Conference and Exhibition; 10-13 July 1989; London. Peregrinus; pp. 355-357.
Edesess, M. and R. D. McConnell (1979). A general reliability and safety methodology and its application to wind energy conversion systems. Golden, Colo., Solar Energy Research Institute. SERI/TR-35-234. 51 p.
________________________________________________________________________ Permitting Setbacks for Wind Turbines in California and the Blade Throw Hazard 27
CWEC-2005-001
Eggers, A. J., W. E. Holley, et al. (2001). "Exploratory Study of HAWT Blade Throw Risk to Nearby People and Property." 2001 ASME Wind Energy Symposium; January 8-11, 2001; Reno, Nevada. AIAA and ASME; pp. 355-367.
Eggwertz, S., I. Carlsson, et al. (1981). Safety of Wind Energy Conversion Systems with Horizontal Axis (HA WECS). Stockholm, Flygtekniska Försöksanstalten (FFA- The Aeronautical Research Institute of Sweden). Technical Note HU-2229. 170 p.
ERDA (1977). Solar program assessment : environmental factors. Washington, D.C., Energy Research and Development Administration, Division of Solar Energy, Enviromental and Resource Assessments Branch. ERDA 77-47/1-8. 8 p.
General Electric (1979). MOD 1 Wind Turbine Generator Failure Modes and Effects Analysis. Philadelphia, PA, General Electric Co. Space Division. NASA CR-159494. 91 p.
Germanischer Lloyd (1993). Regulations for the Certification of Wind Energy Conversion Systems. Hamburg, Germanischer Lloyd.
Jorgensen, H. K. (2003). Applicant's Prefiled Direct Testimony In the Matter of Application No. 2003-01: SAGEBRUSH POWER PARTNERS, LLC; KITTITAS VALLEY WIND POWER PROJECT; EXHIBIT 37 (HKJ-T) [online]. Available: http://www.efsec.wa.gov/kittitaswind/adj/prefiled/App%20prefile/Exhib%2037%20Jorgensen.pdf.
Luke, A. (1995). "Blades Snap off in Tarifa", Windpower Monthly, December 1995, p. 15.
Lynette, R. and R. Poore (1979). MOD-2 failure modes and effects analysis. Cleveland, Ohio, NASA Lewis Research Center. NASA CR-159632.
Macqueen, J. F., J. F. Ainsilie, et al. (1983). "Risks associated with wind-turbine blade failures." IEE Proceedings 130, Part A(9): pp. 574-586.
McClendon, R. E. and R. A. Duncan (1985). "Permitting Windfarms in California: Environmental Impacts, Local Regulations, Developer Responsibility." Windpower '85; August 27-30, 1985; Washington, D.C. AWEA; pp. 305-314.
Møller, T. (1987). "Runaway Prompts Safety Talks", Windpower Monthly, May 1987, p. 18.
Nath, C. and J. Rogge (1991). "Experiences Gained from WECS Failures." European Wind Energy Conference, EWEC '91; October 14-18, 1991; Amsterdam. Elsevier; pp. 307-310.
NWCC (2002). Permitting of Wind Energy Facilities [online]. Available: www.nationalwind.org.
________________________________________________________________________ Permitting Setbacks for Wind Turbines in California and the Blade Throw Hazard 28

CWEC-2005-001
________________________________________________________________________ Permitting Setbacks for Wind Turbines in California and the Blade Throw Hazard 29
Putnam, P. C. (1948). Power from the wind. New York, D. Van Nostrand Co.
Riverside County California, United States Bureau of Land Management., et al. (1982). San Gorgonio wind resource study. Berkeley, Calif., Wagstaff and Brady ; Robert Odland Associates. 523 p.
Solano County (1987). Solano County Wind Turbine Siting Plan and Environmental Impact Report. Fairfield, CA, Solano County Dept. of Environmental Management.
Solano County and Earth Metrics (1989). Final environmental impact report for the Montezuma Hills Wind Park. Fairfield, CA, Solano County Dept. of Environmental Management.
Sørensen, J. N. (1984a). "On the Calculation of Trajectories for Blades Detached from Horizontal Axis Wind Turbines." Wind Engineering 8(3): pp. 160-175.
Sørensen, J. N. (1984b). "Prediction of Site Risk Levels Associated with Failures of Wind Turbine Blades." European Wind Energy Conference 1984; 22-26 October 1984; Hamburg, Germany. H.S. Stephens & Associates; pp. 344-349.
Taylor, D. and M. Rand (1991). "How to plan the nuisance out of wind energy." Town & Country Planning 60(5): pp. 152-155.
Throgmorton, J. A. (1987). "Community Energy Planning: Winds of Change from the San Gorgonio Pass." Journal of the American Planning Association 53(3): pp. 358-367.