perpustakaarj ump
TRANSCRIPT

PERPUSTAKAArJ UMP
111111111111111111111111111111111111111111 0000092771
AN INVESTIGATION ON THE USE OF OEDOMETER METHOD FOR
DETERMINATION OF LIQUID LIMIT VALUE OF SOIL
VICKRAM ALAKUVENTHAN
*Thesis submitted in partial fulfillment of the requirements
for the award of the degree of
B. ENG (HONS.) CIVIL ENGINEERING
FACULTY OF CIVIL ENGINEERING AND EARTH RESOURCES
UNIVERSITY MALAYSIA PAHANG
JUNE 2014

ABSTRACT
Consistency limits are extensively used in geotechnical engineering practice. These limits are commonly referred to the Atterberg Limits and the limits are the liquid limit, plastic limit and shrinkage limit. Consistency limits is potentially useful as an index property for predicting the behaviour of clay soils. The liquid limit in particular is used in many correlations with engineering properties. It provides a good basis form predicting the soil properties such as deformability, expansion, hydraulic conductivity and strength. Therefore, liquid limit has strong links to underlying mechanical behaviour. However, the determination of the liquid limit by Casagrande Liquid Limit Device and Cone Penetration Method which are in international standards have their own limitation as they requires several points to determine liquid limit of soil as these both methods uses trial and error method. This study presents the investigation on the use of oedometer method as an alternative way to determine the liquid limit of zeolite from saturated slurried condition by using a small consolidation pressure of 0.9 kPa and 6 kPa. Thus by doing this, one can determine the liquid limit by one point determination technique as the equilibrium water content reached from the consolidation will be equivalent or nearer to the liquid limit of soil under the consolidation pressure either 0.9 kPa or 6 kPa. The physical properties of zeolite were determined and the liquid limit of zeolite was determined from cone penetration method. The test results shows that by using a consolidation pressure of 0.9 kPa, the value of liquid limit obtained from oedometer method is much nearer to the value of liquid limit obtained from the cone penetration method and the difference between those values obtained is less than 1%. Meanwhile, the liquid limit value obtained by using consolidation pressure of 6 kPa does not tally and far away from the value of liquid limit obtained from cone penetration method. Hence, by using consolidation pressure of 0.9 kPa, oedometer method can be used to determine the liquid limit of soil and for consolidation pressure of 6 kPa, other methods or different soil should be used and applied for determination of liquid limit value.
Vi

VII
ABSTRAK
Had ketekalan adalah luas digunakan di dalam amalan kejuruteraan geoteknikal. Had-had mi biasanya dirujuk kepada had Atterberg dan had tersebut adalah had cecair, had plastik dan had pengecutan. Had ketekalan berpotensi untuk digunakan sebagai hartanah indeks untuk meramalkan kelakuan tanah hat. Had cecair khususnya digunakan dalam banyak korelasi dengan ciri-ciri kejuruteraan. la menyediakan satu bentuk asas yang baik meramalkan sifat-sifat tanah seperti kebolehcanggaan, pengembangan, kekonduksian hidraulik dan kekuatan. Oleh itu, had cecair mernpunyai hubungan yang kuat dengan tingkah laku mekanikal asas. Walau bagaimanapun, penentuan had cecair melalui kaedah Casagrande had cecair peranti dan kaedah tusukan kon yang dalam piawaian antarabangsa juga mempunyai had terbatas kerana kedua-dua kaedah memerlukan beberapa perkara untuk menentukan had cecair tanah kerana kedua-dua kaedah mi menggunakan kaedah percubaan dan kesilapan. Oleh iitu, kajian mi membentangkan siasatan terhadap penggunaan kaedah oedometer sebagai kaedah alternatif untuk menentukan had cecair zeolite dari tepu keadaan slurried dengan menggunakan tekanan penyatuan kecil yang bernilai 0.9 kPa dan 6 kPa. Oleh itu dengan melakukan mi, seseorang boleh menentukan had cecair dalam sam teknik penentuan sebagai kandungan air keseimbangan dicapai dari penyatuan mi akan sama atau lebih hampir kepada had cecair tanah di bawah tekanan penyatuan bernilai sama ada 0.9 kPa atau 6 kPa. Sifat-sifat fizikal zeolite telah ditentukan dan had cecair zeolite telah ditentukan melalui kaedah tusukan kon. Keputusan ujian menunjukkan bahawa dengan menggunakan tekanan penyatuan 0.9 kPa, nilai had cecair yang diperolehi daripada kaedah oedometer adalah lebih dekat dengan nilai had cecair yang diperolehi danipada kaedah tusukan kon clan perbezaan antara nilai-nilai yang diperolehi adalah kurang daripada 1%. Manakala, nilai had cecair yang diperolehi dengan menggunakan tekanan penyatuan 6 kPa adalah tidak sama dan jauh daripada nilai had cecair yang diperolehi melalui kaedah tusukan kon. Oleh itu, dengan menggunakan tekanan penyatuan 0.9 kPa, kaedah oedometer boleh digunakan untuk menentukan had cecair tanah dan manakala untuk tekanan penyatuan 6 kPa, kaedah lain atau tanah yang berbeza perlu digunakan dan diaplikasikan untuk penentuan nilai had cecair.

VIII
TABLE OF CONTENTS
PAGE
SUPERVISOR'S DECLARATION
STUDENT'S DECLARATION
DEDICATION iv
ACKNOWLEDGEMENTS v
ABSTRACT vi
ABSTRAK vii
TABLE OF CONTENTS viii
LIST OF FIGURES xi
LIST OF SYMBOLS xii
LIST OF ABBREVIATIONS xiii
LIST OF APPENDICES xiv
CHAPTER 1 INTRODUCTON
1.1 Background of the Study 1
1.2 Problem Statement 3
1.3 Objectives 4
1.4 Scope of study 4
1.5 Thesis Overview 5
CHAPTER 2 LITERATURE REVIEW
2.1 Introduction
2.2 Applications of clay
2.3 Types of clay 2.3.1 Clays and their composition structure
7
2.4 Zeolite
10
2.5 Clay Soil- Water Interaction
11
2.5.1 Hydrogen Bonding 12
2.5.2 Hydration of Exchangeable Cations
12

ix
2.5.3 Attraction by Osmosis 12
2.5.4 Charged Surface- Dipole Attraction 13
2.5.5 Attraction by London Dispersion Force 13
2.5.6 Capillary Condensation 13
2.6 Consistency of Fine-Grained Soil
2.6.1 Plastic Limit of Soil 15
2.6.2 Liquid Limit of Soil 16
2.6.3 Importance! Significance of Liquid Limit 17
2.6.4 Determination of Liquid Limit
2.6.4.1 Casagrande Liquid Limit Device Method 18
2.6.4.2 Cone Penetration Method 19
2.6.4.3 Oedometer Method 20
CHAPTER 3 METHODOLOGY
3.1 Introduction 22
3.2 Selection of Soil Sample 24
3.3 Determination of Physical Properties of Zeolite 3.3.1 Specific Gravity 25
3.3.2 Particle Size Distribution 25
3.3.3 Initial Water Content 26
3.3.4 The Atterberg Limits 26
3.4 Liquid Limit Determination
3.4.1 Cone Penetration Test27
3.4.2 Oedometer Method 29
3.4.2.1 Preparation of Slurry Specimen 29 3.4.2.2 Testing Procedure 29

x
CHAPTER 4 RESULT AND DATA ANALYSIS
4.1 Introduction 31
4.2 Physical Properties of Zeolite 31
4.2.1 Specific Gravity 31
4.2.2 Fine Analysis 32
4.2.3 Initial Moisture Content 33
4.2.4 Consistency Limits 33
4.3 Liquid Limit by Oedometer Method 34
4.4 Discussion 36
CHAPTER 5 CONCLUSION AND RECOMMENDATION
5.1 Conclusion 37
5.2 Recommendation 38
REFERENCES 39
APPENDICES A-D 42

Xi
LIST OF FIGURES
Figure No. Title Page
2.1 Basic Unit of Clay Minerals 8
2.2 Structure of Main Clay Minerals 9
2.3 Kaolinite, Illite, Smectite Sheet Structure 10
2.4 Illustration of Atterberg Limits 14
2.5 Casagrande Apparatus For Measuring The Liquid Limit 19
3.1 The Overview of The Experimental Investigation 23
3.0 ELE International Semi-Automated Cone Penetrometer 28
3.1 ELE International Oedometer Test Equipment 33
3.2 Particle Size Distribution Curve of Zeolite 32
3.3 Time-Equilibration Plot Obtained for 0.9 kPa 34
3.4 Time-Equilibration Plot Obtained for 6 kPa 35

LIST OF SYMBOLS
% Percentage
kPa kilo Pascal
kg Kilogram
Micrometer
mm millimeter
m meter
ml milliliter
g gram
N Newton
°C Degree of Celcius
s second
XII

LIST OF ABBREVIATIONS
Fig Figure
UMP Universiti Malaysia Pahang
BS British Standard
ASTM American Society for Testing and Materials
XIII

xiv
LIST OF APPENDICES
Appendix Title Page
A Specific Gravity Result 42
B Fine Analysis Test Result 44
C Atterberg Limit Test Result 47
D Oedometer Test Result 50

CHAPTER 1
INTRODUCTION
1.1 BACKGROUND OF THE STUDY
According to the Das (2010), soil is defined as the uncemented aggregate of
mineral grains and decayed organic matter which is solid particles with liquid and gas in
the empty spaces between the solid particles. In the Unified Soil Classification System
(USCS), mostly soils are divided into two categories, which are coarse- grained soils and
fine-grained soils. In coarse-grained soil, they are divided into two major divisions which
are gravels and sands meanwhile silts and clays are classified under the fine-grained soils.
Furthermore according to Das (2010), soil consistency provides a means to
describe and indicate the degree of firmness of fine-grained soil. The consistency also
describes the degree and kind of cohesion and adhesion between soil particles. The
consistency of soil can be expressed qualitatively in terms of very soft, soft, stiff, very stiff
and hard. The consistency mainly depends on water content and also soil mineral. The
water content significantly affects the properties of cohesive soils like silt and clayey soil.
The physical properties of fine-grained soil differ greatly at different water content.

According to Sridharan et al. (2000), the consistency of soil are commonly
referred to the Atterberg Limits. The consistency limits was initially proposed by Atterberg
in 1911 for agricultural purposes. It was later adopted by Terzaghi in 1925 for classification
of fine-grained soils for engineering purposes. It was Terzaghi who first realised their
engineering potential (Seed et. al, 1964). The consistency limits are the liquid limit, plastic
limit and shrinkage limit. The moisture content at which the transition from solid to
semisolid state takes place is defined as the shrinkage limit. The moisture content at the
point of transition from semi-solid to plastic state is the plastic limit, and from plastic to
liquid state is the liquid limit (Das, 2010). The liquid and plastic limits define the
transitions between liquid, plastic and brittle solid soil behaviour (Jefferson & Rogers,
1997). According to Dolinar and Skrabl (2012), as the water content is increased, the
consistency of a fine-grained soil changes from the semi-solid state, to the plastic state, and
eventually to the liquid state. The plastic limit is the soil's water-content boundary between
the semi-solid and the plastic consistency. The liquid limit is the soil's water content where
further increases in the amount of water change the consistency from the plastic to the
liquid state. The plastic limit and liquid limit are often collectively referred to as the
Atterberg Limits. The liquid limit in particular is a key of importance in soil mechanics
because they determine, in a simple way, the interaction between the solid and liquid
phases in soils, and thus provide the possibility of classifying soils into groups with similar
mechanical properties. Perhaps, the liquid limit provides a good basis for predicting other
soil properties, such as deformability, expansion, hydraulic conductivity, and strength
The liquid limit of soil is usually determined in two ways which are, Casagrande
Liquid Limit Device Method and Cone Penetration Method (Christaras, 1991) Although
these methods are standardized and in international standards, these methods requires
several points and uses trial and error method to determine the liquid limit of soil. Hence, it
can be said the progress of determining the liquid limit of soil using these methods are slow
and there is no other well-known or other standardize methods to determine the liquid limit
of soil using one point determination technique.
3
However, Sridharan et.al (2000), investigated and found out that the equilibrium
water content, which is very near to the liquid limit water content of the soil, can be
reached under a small consolidation pressure of 0.9 kPa. Wroth and Wood (1978), on the
basis of earlier investigations has indicated that all fine-grained soils tend to equilibrate
from the same high initial water-content state to their respective liquid limit water contents
at an applied suction of the order of 6 kPa. So, an investigation needs to be done using
oedometer method to determine liquid limit value of soil using consolidation pressure of
0.9 kPa and 6 kPa. It is believed that this study will fills an important gap in the literature
where the oedometer method can be used as an alternative way to determine the liquid limit
of soils in prior to the Casagrande Liquid Limit Device Method and Cone Penetration
Method and this will provides a new data and approach for the researchers and engineers to
determine liquid limit of soil using oedometer method.
1.2 PROBLEM STATEMENT
In geotechnical engineering practice, consistency limits are used extensively to
determine the liquid limit of a fine-grained soil, currently there are two methods which are
popular in practice and widely used and accepted as they are in international standards.
They are, Casagrande Liquid Limit Device Method and Cone Penetration Method. And
there are also many methods to determine the liquid limit of soil. But most of them require
trial and error method. The values of liquid limit determined from Casagrande Method and
Cone Penetration Method make use of a semi-logarithmic graph as these both methods
requires several points to get the liquid limit value. It is clearly seen that the process of
determining the liquid limit using these two standardize methods are tedious and
cumbersome. However by knowing the pressure at liquid limit, the liquid limit of soil can
be determined easily by one point determination. An investigation needs to be done using
the oedometer method to determine the value of liquid limit of soil and this value will be
checked and compared with liquid limit obtained from cone penetration method.

4
1.3 OBJECTIVES OF THE STUDY
The objectives of this research can be outlined as follow:
1. To determine the value of liquid limit of zeolite using oedometer method
and cone penetrometer method
2. To compare using oedometer method to determine the value of liquid
limit of soil with commonly used methods.
1.4 SCOPE OF THE STUDY
The scope of study is to determine the value of liquid limit of soil consisting
zeolite as clayey soil using cone penetration method and oedometer method. The zeolite
was used as the soil sample and only experimental investigation is considered and the
samples are tested in Soil & Geotechnical Laboratory, UMP. The values of liquid limit
were determined from the cone penetration method and oedometer method.
1.5 THESIS OVERVIEW
Chapter 2 presents the explanation and the information of clay minerals including
its applications in engineering field, clays and their types, zeolite, clay soil-water
interaction and consistency limits of fine grained soils and determination of liquid limit
methods are presented along with the review of reported studies and related books of
various investigator and writer.

S
Chapter 3 presents the methodology of the whole study are presented and well
explained in terms of the determination of physical properties of zeolite and the
determination of liquid limit of zeolite using oedometer method.
Chapter 4 presents results and data analysis, the laboratory data obtained is
analyzed and the results are presented through the tables and graphical method.
Chapter 5 presents conclusion and recommendation, the results are concluded and
checked whether the objectives of this study well achieved or not and recommendation and
suggestions are discussed to improve the results obtained.

CHAPTER 2
LITERATURE REVIEW
2.1 INTRODUCTION
In this chapter, a brief explanation and information of clay minerals including its
applications in engineering field, clays and their types, zeolite, clay soil-water interaction
and consistency limits of fine grained soils are presented along with the review of reported
studies and related books of various investigator and writer. Furthermore, the reviews of
studies and investigations about the determination of liquid limit methods are presented at
the end of this chapter.
2.2 APPLICATION OF CLAYS
It is well known that clay minerals have many applications and uses in worldwide.
However, the most famous of clay minerals application in worldwide and in engineering
field is the use of clay minerals as liner system in landfill (Das, 2010). Solution for waste
disposal that being used today is landfihling and landfihling is the only waste disposal
method that can deal with all kinds of materials in the solid waste stream and it is also the

7
simplest and cheapest way of disposing solid waste (Choong, 2001). Landfill is designed
with liner system to protect groundwater quality from the disposed wastes. The liner system
consist of low permeable materials (viz.compacted clay, geo-membrane, geo-synthetic clay
liner) and must contain the disposed wastes effectively (Sharma & Reddy, 2004). The
essential function of bottom line of the landfill is to provide stability and to support the
total waste mass as well as to prevent from pollution of groundwater with the landfill
leachate. Leachates consist of water and water soluble compounds in the refuse that
accumulates as water moves through landfill. This water maybe from the landfill and
contaminate soil and ground water, thus presenting a risk to human health and
environmental (Das, 2010).
So, clay can be used as cost effective bottom liners. Clay liners at the landfill body
play a very important part in the whole barrier system for retaining pollutants. Porosity of
clay is 40-70% and the clay has the property of swelling, plasticity, cohesion and adhesion.
2.3 TYPES OF CLAY
2.3.1 Clays and their composition structure
Clays are important constituent of soils, which evolve mainly from chemical
weathering of rock forming minerals, and regarded as fine-grained soils in geotechnical
engineering (Aksoy et. al, 2008). Weems (1993) stated that clay is a substance which is
known as a deposit which is extensively distributed over the surface of the earth. It is found
almost everywhere, but differs greatly in purity. Pure clay is a silicate of aluminum and
when found in large quantities, it is called kaolin. Das (2007) explained that clay minerals
are primarily hydrous aluminum silicates composed of two basic units, silica tetrahedron
and alumina octahedron. Each tetrahedron unit consists of four oxygen atoms surrounding a
silicon atom. The combination of tetrahedral silica units forms a silica sheet. Three oxygen
atoms at the base of each tetrahedron are shared by neighboring tetrahedral. The octahedral
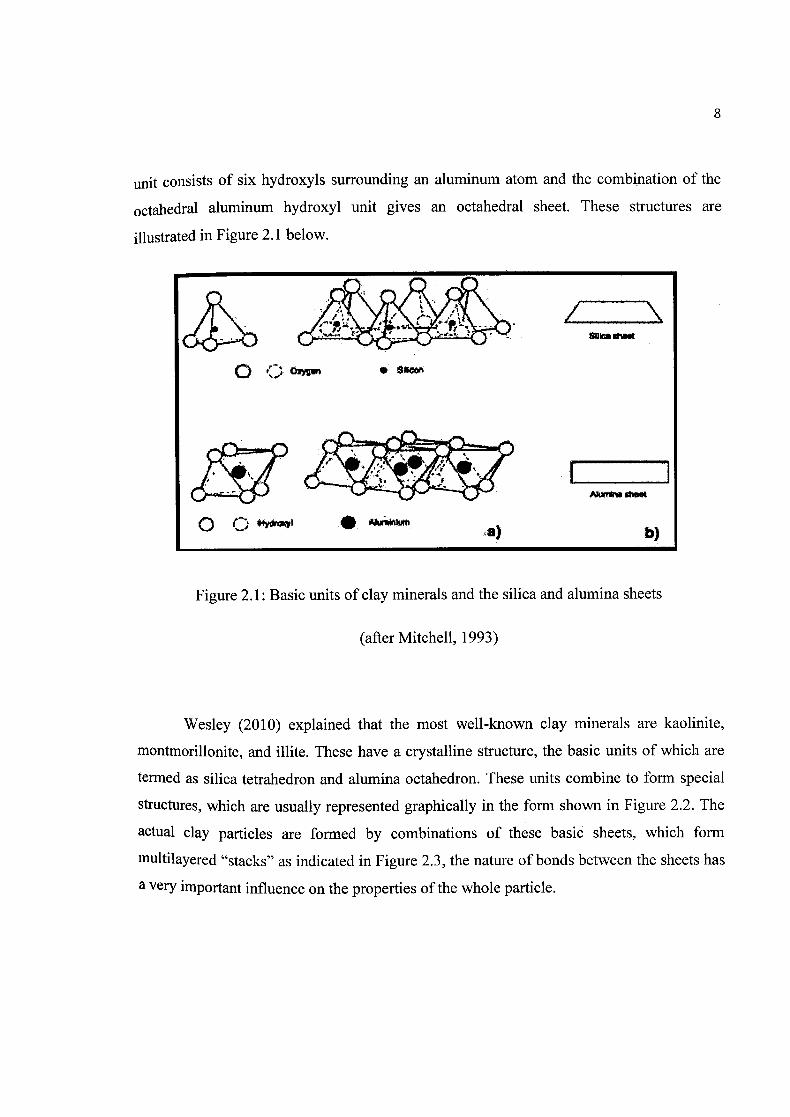
8
unit consists of six hydroxyls surrounding an aluminum atom and the combination of the
octahedral aluminum hydroxyl unit gives an octahedral sheet. These structures are
illustrated in Figure 2.1 below.
0 0 Oxygu'i •
Figure 2.1: Basic units of clay minerals and the silica and alumina sheets
(after Mitchell, 1993)
Wesley (2010) explained that the most well-known clay minerals are kaolinite,
montmorillonjte, and illite. These have a crystalline structure, the basic units of which are
termed as silica tetrahedron and alumina octahedron. These units combine to form special
structures, which are usually represented graphically in the form shown in Figure 2.2. The
actual clay particles are formed by combinations of these basic sheets, which form
multilayered "stacks" as indicated in Figure 2.3, the nature of bonds between the sheets has
a very important influence on the properties of the whole particle.

• • $- -
•• ,
IH- —
bond: __________________
Figure 2.2: Structure of the main clay minerals: (a) kaolinite, (b) illite and (c)
montmorillonite, based on combined sheets (after Craig, 1990)
Kaolinite particles have a basic structure consisting of a single sheet of silica
tetrahedrons and a single sheet of alumina octahedrons. These combined effects are then
held in a stack fairly tightly by hydrogen bonding. Illite particles have a basic structure
made up of central alumina sheet combined with silica sheets above and below. The
combined sheets are in turn linked together by potassium ions sandwiched between them.
This is a fairly weak form of bond. Montmorillonite is made up of the same basic unit as
illite but the form of bond between these basic units is different. Water and exchangeable
cations provide this bond which is a much weaker bond than that in illite particles.
9

10
Figure 2.3: Kaolinite, Illite and Smectite Sheet Structure (after Wesley, 2010)
This special structures means that these clay particles are not inert as the rock
particles. The term "active" is used to describe clay minerals, meaning that they are capable
of swelling and shrinking by taking in water or losing it, depending on the environment
surrounding them.
2.4 ZEOLITE
Auerbach et al. (2003) describe and explained that the zeolite is microporous
crystalline aluminosilicates. Zeolite are found in nature and it was first discovered in 1756
by the mineralogist, Cronstedt. Most zeolite are known to occur in nature of are of lower
Si/Al ratios, and sometimes this natural zeolites are found as a large single crystals as
though it is very difficult to make large crystals in the laboratory.

11
From this zeolite, there are many interesting properties which are thermal
stability, acidity, adsorption, and ion exchange property. Zeolites are extensively used in
primarily three applications which are adsorbents, catalysts, and ion exchange. In adsorbent
application, zeolite is used on removal of small polar or polarizable molecules as a
purification process and bulk separation. In catalyst application, zeolite is used for
synthesis of organic intermediates and fine chemicals which will be used for easy
separation formwork, doping with metals for selective oxidation chemistry, and ease of
regeneration of catalysts. The major use of zeolite in ion exchange agents is for water
softening applications in the detergent industry and substitute use of phosphate. Apart from
these applications, the zeolite is also used as an odor removal, plastic additives, fertilizers,
soil conditioners, lightweight aggregate and pozzoolanic cements and concrete and etc.
Zeolite is also used in molecular sieve applications such as separation of oxygen and
nitrogen from air and ion exchangers in pollution abatement processes.
However, zeolite has a unique property that the internal surface is highly
accessible because of the ion exchange property. This ion exchange property provides a
measure of the selectivity of one ion over another. Ion exchange property also provides
information regarding phase transformations during exchange because of exclusion of a
cation. Because of this unique property, the zeolite is selected and used as the soil specimen
in this study.
2.5 CLAY SOIL-WATER INTERACTION
All clays have high affinity to water (Aksoy et. al, 2008). Similar observations
were also made by Lambe (1949). According to Lambe (1949), water is strongly attracted
to soil mineral surfaces particularly to clay. Dried clay adsorb water from the atmosphere
even at low relative humidity, many soils swell when given access to water and
temperatures above 100°C is needed to remove all the water from a soil. Several possible
mechanisms for water adsorption have been proposed (Low, 1961).

12
2.5.1 Hydrogen Bonding
Surface of soil minerals are composed of a layer of either oxygen or hydroxyl, so
hydrogen bonds can form easily with oxygen attracting the positive corners and hydroxyl
attracting the negative corners of water molecules . Early concepts of the structure of
adsorbed water suggested an ice-like character because of the similarity between the
hexagonal symmetry of the oxygen and hydroxyls in clay surfaces and the structure of ice;
however, subsequent studies have shown that the structure cannot be that of ice.
2.5.2 Hydration of Exchangeable Cations
Mitchell and Soga (2005) said that because cations are attracted to the
negatively charged clay surfaces, so is their water of hydration.
2.5.3 Attraction by Osmosis
Cations concentration increases as negatively charged clay surfaces are
approached. This increased concentration means that water molecules tend to diffuse
toward the surface in an attempt to equalize concentrations.

13
2.5.4 Charged Surface-Dipole Attraction
Mitchell and Soga (2005) stated that clay particles can be viewed as negative
condenser plates. Water dipoles then orient with their positive poles directed toward the
negative surfaces with the degree of orientation decreasing with increasing distance from
the surface. However, at the mid —plane between parallel plates, there would be adjacent to
each other. Ingles (1968) suggested that because of high hydration number and energy of
aluminum in the clay structure, water is so strongly attracted to the surfaces that it
interposes itself between the surfaces and the counter ions with the counter ions removed as
far as possible from the surface that is to the mid-plane between opposing parallel sheets.
2.5.5 Attraction by London Dispersion Force
Van der Waals attractive forces could bond water molecules to clay surfaces. In
phase fluctuations of electron clouds form temporary dipoles and induce displacements in
neighboring molecules so that dipole-dipole attraction occurs. Because such bonds would
be non- directional, the water structure would be closely packed and more fluid than the H-
bonded structure.
2.5.6 Capillary Condensation
A range of pore sizes and distributions usually exists in a soil. The pores
may fill with liquid water and water vapor. At saturation less than 100 percent, the water is
retained in micro and mini pores through the combine effects of surface tension and
attraction to particle surfaces (Mitchell & Soga, 2005)

14
Atterberg limits are the limits of water content used to define soil behavior.
According to the findings of Andrade et.al (2010), Albert Atterberg (1846-1916), a
Swedish chemist and agricultural scientist, found that plasticity is a particular characteristic
of clay. The consistency limits was called as Atterberg limits and it was explained that
there is a defined amount of water at which the clay is easily moldable. With lower
moisture content, the clay cracks when molded. The Atterberg plastic limit is the lowest
water content (expressed in mass percent of the clay dried at 120 °C) at which the clay can
be rolled into threads without breaking (Bergaya et al., 2006). The Atterberg liquid limit is
the water content at which the clay begins to flow, using Casagrande Liquid Limit Device.
The difference between both values is called the plasticity (or plastic) index. The liquid and
plastic limits define the transitions between liquid and plastic behavior. Arthur Casagrande
standardized the method to determine such limits in soil consisting of clayish and non-
clayish materials. These limits can give significant information about the behavior of clay
(Jefferson & Rogers, 1998). Illustration of Atterberg limits are shown in Figure 2.4.
Behavior Conditions
n creasing water content nd becoming
weaker
viscous liquid state
plastic state
liquid limit, LL
plastic Index P1= LL - PL
- plastic limit, P semi-solid state
shrinkage Limit solid state
limit
Figure 2.4 Illustration of Atterberg Limits