personnel decisions research institutes, inc.. army research institute for the behavioral and social...
TRANSCRIPT

tW
AD-A239 842Technical Report 928 AD- A239 842
Costs and Errors in Survey SampleDesign: An Application to ArmyProspect and Recruit Surveys
Eugene Borgida, John L. Sullivan,and Dennis P. McGuireUniversity of Minnesota
David DuBoisPersonnel Decisions Research Institutes, Inc.
April 1991
DTCS AUG20.1991JU
B
United States Army Research Institutefor the Behavioral and Social Sciences Acu0
Approved for public release; distribution is unlimited.

U.S. ARMY RESEARCH INSTITUTE
FOR THE BEHAVIORAL AND SOCIAL SCIENCES
A Field Operating Agency Under the Jurisdiction
of the Deputy Chief of Staff for Personnel
EDGAR M. JOHNSON JON W. BLADESTechnical Director COL, IN
Commanding
Research accomplished under contract forthe Department of the Army
Dr. Eugene Borgida & Associates, University of Minnesota
Technical review by
Curtis L. GilroyMary Sue Hay
NOTICES
IS RI ION' 'mary tibun of this rt h been m ad by lease, dresorr po d ce c nc in di b io of repr to: S. y'letarW Ins tute, fo theceh ioal d cia S *nce, PE I-P I 1 how r Ive, ean ir
FINAL DISPOSITION: This report may be destroyed when it is no longer needed. Please do notreturn it to the U.S. Army Research Institute for the Behavioral and Social Sciences.
NOTE: The findings in this report are not to be construed as an official Department of the Armyposition, unless so designated by other authorized documents.

UNCLAS S IF IEDSECURITY CLASSIFICATION OF THIS PAGE
~Form Approved
REPORT DOCUMENTATION PAGE OMNo. 0704-0188
la. REPORT SECURITY CLASSIFICATION lb. RESTRICTIVE MARKINGSUnclassified I2a. SECURITY CLASSIFICATION AUTHORITY 3. DISTRIBUTION /AVAILABILITY OF REPORT-- __Approved for public release;
2b. DECLASSIFICATION / DOWNGRADING SCHEDULE distribution is unlimited.
4. PERFORMING ORGANIZATION REPORT NUMBER(S) S. MONITORING ORGANIZATION REPORT NUMBER(S)
ARI Technical Report 928
6a. NAME OF PERFORMING ORGANIZATION 16b. OFFICE SYMBOL 7a. NAME OF MONITORING ORGANIZATION
Dr. Eugene Borgida & Associates (If applicable) U.S. Army Research Institute
6c. ADDRESS (City , State, and ZIP Code) 7b. ADDRESS (City, State, and ZIP Code)University of Minnesota 5001 Eisenhower Avenue75 East River Road Alexandria, VA 22333-5600Minneapolis, MN 554558a. NAME OF FUNDIbG/SPOfNSORING 8b. OFFICE SYMBOL 9. PROCUREMENT INSTRUMENT IDENTIFICATION NUMBER
ORGANIZATION u.S. Army Research (If applicable)Institute for the Behavioral DAAL03-86-D-0001and Social Sciences PERI-R
8c. ADDRESS (City, State, and ZIP Code) 10. SOURCE OF FUNDING NUMBERS
5001 Eisenhower Avenue PROGRAM PROJECT TASK WORK UNIT
Alexandria, VA 22333-5600 ELEMENT NO. NO. NO.
62785A 791 2105 C7
11. TITLE (Include Security Classification)Costs and Errors in Survey Sample Design: An Application to Army Prospect and RecruitSurveys
12. PERSONAL AUTHOR(S)Borgida, Eugene; Sullivan, John L.; McGuire, Dennis P. (U of Minn.); and DuBois, David (PDRI)
13a. TYPE OF REPORT i13b. TIME COVERED 114. DATE OF REPORT (Year, Month, Day) 15, PAGE COUNTFinal I FROM 90/05 TO 91/03 1991, April
16. SUPPLEMENTARY NOTATIONThis research was performed under subcontract from Battelle Memorial Institute, 505 King Ave.Columbus, OH 43201. Contracting Officer's Representative, Timothy W. Elig.
17. COSATI CODES 18. SUBJECT TERMS (Continue on reverse if necessary and identify by block number)FIELD GROUP SUB-GROUP Survey Sampling errors
05 09 Sampling Survey costs
05 08 Recruiting Survey design
19, ABSTRACT (Continue on reverse if necessary and identify by block number)" This report discusses the implications of survey costs and sampling errors for the
design of marketing, program evaluation, and sales satisfaction surveys used in Army recruit-ing. The first section gives an overview of relevant research on the recruitment process,describes survey populations at different stages of recruiting, and identifies majorvariables that affect sample designs and survey content. The second section examines theeffect of seasonality on survey response and sampling and presents results of data analyses.The third section presents a general model of costs and errors in survey sampling for fourstages of the recruiting process: initial appointments, applications, contracts, and acces-sions. The fourth section discusses application of the model to ongoing surveys at all fourstages of the recruitment process. In particular, the costs, benefits, errors, applicabilityand practicability of alternative sampling plans are described.
This report is the first of two reports on this subject.-- The second (McGuire, 1991; inpreparation) contains the User's Manual for a prototype Lotus 1-2-3 spreadsheet designed toexamine tradeoffs between survey costs and sampling errors.
20. DISTRIBUTION/AVAILABILITY OF ABSTRACT 21. ABSTRACT SECURITY CLASSIFICATION0 UNCLASSIFIEDIUNLIMITED (3 SAME AS RPT. ODTIC USERS Unclassified
22a. NAME OF RESPONSIBLE INDIVIDUAL 22b. TELEPHONE (Include Area Code) 22c. OFFICE SYMBOLMary Sue Hay (703) 274-56101 PERI-RG
DD Form 1473, JUN 86 Previous editions are obsolete. SECURITY CLASSIFICATION OF THIS PAGEUNCLASSIFIED

Technical Report 928
Costs and Errors in Survey Sample Design: AnApplication to Army Prospect and Recruit Surveys
Eugene Borgida, John L. Sullivan, and Dennis P. McGuireUniversity of Minnesota
David DuBoisPersonnel Decisions Research Institutes, Inc.
Manpower and Personnel Policy Research GroupCurtis L. Gilroy, Chief
Manpower and Personnel Research LaboratoryZita M. Simutis, Director
U.S. Army Research Institute for the Behavioral and Social Sciences5001 Eisenhower Avenue, Alexandria, Virginia 22333-5600
Office, Deputy Chief of Staff for PersonnelDepartment of the Army
April 1991
Army Project Number Manpower, Personnel, and20162785A791 Training
Approved for public release; distribution is unlimited.
iii

FOREWORD
The U.S. Army Research Institute for the Behavioral andSocial Sciences (ARI) conducts research to enhance recruiting ofArmy personnel and to develop more cost-effective recruitingpolicies and practices for the Army. Survey researc is animportant source of information to achieve these objectives.
This report documents research that examines possible sam-pling plans and strategies for use in Army surveys of recruitsand prospects. It provides an overview of the recruiting pro-cess, summarizes previous research, and discusses the advantagesand disadvantages of alternative survey methods and samplingstrategies. The report also describes the results of analysesconducted to investigate issues of sample representativeness inthe ongoing New Recruit Surveys.
This work is part of the mission of the Manpower and Per-sonnel Policy Research Group (MPPRG) to conduct research toimprove the Army's recruiting capabilities. The project wasprioritized by the U.S. Army Recruiting Command (USAREC) CommandStudies Advisory Group, and requested by Colonel Heimericks,Director of Program Analysis and Evaluation, USAREC. Preliminaryresults were briefed to Major Bradford, Advertising Research andAnalysis, USARCPAE, on 20 September 1990.
The results reported here will aid USAREC in designing thebest survey sampling methods. They will ensure that surveys ofArmy recruits and prospects provide the most accurate informa-tion, in the most cost-effective manner, fcr Army policy makersand personnel planners.
ED ARM J;SONTechnical Director
Ao0ession For
7NTiS GRA&I-
OTIC TAAB
VuAt 1.'2,'t.
l ai
ACKNOWLEDGMENTS
We gratefully acknowledge the assistance and informationprovided by Dr. Timothy W. Elig and Ms. Mary Sue Hay of the U.S.Army Research Institute for the Behavioral and Social Sciencesand Major Don F. Bradford of the U.S. Army Recruiting Command.We also wish to thank Ms. Hay and Kathy Lillie for their invalu-able assistance in securing and organizing the data for analyses.Finally, we wish to thank Dr. Paul Novak and Deb Skophammer ofPersonnel Decisions Research Institutes, Inc., for their admin-istrative assistance.
vi

COSTS AND ERRORS IN SURVEY SAMPLE DESIGN: AN APPLICATION TO ARMY
PROSPECT AND RECRUIT SURVEYS
EXECUTIVE SUMMARY
Requirement:
Maintaining high standards of military recruiting requiresup-to-date information concerning prospects' and recruits' atti-tudes toward recruiting advertisements, incentives, and prac-tices. One important approach to gathering this information hasbeen the use of prospect and recruit surveys. To ensure thatinferences based on survey information are accurate and reliable,surveys need to employ scientific sampling designs. The purposeof this project was to examine alternative survey methods andsampling procedures.
Procedure:
First we conducted a literature search and review of theArmy recruitment process. Next, in order to examine seasonalvariations in characteristics and responses of Army accessions,we extended previous analyses of data from the New Recruit Sur-veys to a third year. The third stage of the project involved acareful consideration of the costs and errors of surveys at fourpoints of the recruitment process: appointments, applications,contracts, and accessions. Finally, we developed a general ap-proach to specifying costs and errors for specific combinationsof survey methods and sampling strategies.
Findings:
The literature review organized the extant literature intoconsiderations of recruiting outcomes (dependent variables),recruit activities (independent variables), and market segments(moderating variables). The significant effects of many of thesevariables upon enlistment outcomes strongly suggest that thesevariables be monitored and controlled in studies of enlistmentdecisions, including studies involving surveys. Further, theliterature review identified several major variables and issuesto consider when sampling prospect and recruit populations.
Analyses of data from the New Recruit Surveys detectedseveral important seasonal variations in Army accessions. Thesepresent additional issues to consider in designing surveys ofArmy prospects and recruits.
vii

We considered applicability, practicability, costs, errors,and benefits to isolate sets of possible sampling designs forprospect and recruit surveys. These general considerations wereincorporated into a prototype spreadsheet. The spreadsheet pro-totype is intended to be used to examine tradeoffs between surveycosts and sampling errors for specific combinations of surveymethods and sampling plans.
Utilization of Findings:
The information presented in this report and in the spread-sheet prototype will be used by survey designers in the U.S. ArmyResearch Institute for the Behavioral and Social Sciences and theU.S. Army Recruiting Command to assess alternative approaches togathering survey information and to aid and support decisionsregarding specific survey designs.
viii

COSTS AND ERRORS IN SURVEY SAMPLE DESIGN: AN APPLICATION TO ARMYPROSPECT AND RECRUIT SURVEYS
CONTENTS
Page
AN OVERVIEW OF THE ARMY RECRUITING PROCESS ..... ........ 2
Background 2.................... 2Organization and Structure 3............... 3Recruiting Process ........... ................... 3
LITERATURE REVIEW OF THE ARMY RECRUITMENT PROCESS ... ..... 7
Enlistment Decisions (Dependent Variables) .... ....... 8Recruiting Activities (Independent Variables) ... .... 10Market Segmentation (Moderating Variables) ........ 14Summary .......... ........................ 19
SAMPLE REPRESENTATIVENESS AND SEASONALITY EFFECTS:DATA ANALYSES AND DISCUSSION ..... ............... 19
Review of Previous Research ..... .............. 20Methodology ......... ...................... 21Results .......... ........................ 22Conclusions ......... ...................... 46
A GENERAL MODEL OF PROSPECT AND RECRUIT SURVEYSAMPLING ........ .................... ..... 49
Survey Methods ......... ..................... 49Costs and Benefits ....... ................... .... 52Assessing Tradeoffs between Costs and Errors:A Methodological Note ...... ................. 55Overview of Potential Sampling Strategies . ....... 56Selecting Sampling Strategies by RecruitmentStage ........... ......................... 59
REFERENCES .......... ........................ 62
APPENDIX A. INTERVIEW PROTOCOL ..... .............. A-1
B. EXAMPLE ITEMS FOR SCALING TRADEOFFSBETWEEN COSTS AND ERRORS ... ........... . B-I
LIST OF TABLES
Table 1. Selection of survey administration methods . . . 50
ix

CONTENTS (Continued)
Page
LIST OF FIGURES
Figure 1. Organizational structure for USAREC ... ...... 4
2. Recruiting activities for the U.S. Army . . .. 6
3. Enlistment decision process ..... .......... 9
4. Percent in each AFQT category, for allNPS recruits combined ... ............. . 24
5. Mean enlistment term, for all NPS recruitscombined ....... ................... 26
6. Percent planning to use GI Bill, selectingthose who know of the GI Bill and who havenot had counseling .... .............. . 27
7. Recruit educational aspirations, for allNPS recruits combined ... ............. . 28
8. First contact with an Army recruiter, forall NPS recruits combined .. ........... . 31
9. Circumstances of first recruiter contact,for all NPS recruits combined .......... .. 33
10. Mean age at time of DEP contract, for allNPS recruits combined ... ............. . 35
11. Mean number of days in the DEP, for allNPS recruits combined ... ............. . 36
12. Gender composition, for all NPS recruitscombined ....... ................... 37
13. Percent ethnic composition, for all NPSrecruits combined .... ............... . 39
14. Percent from each geographic region, forall NPS recruits combined .. ........... . 40
15. Percent from each hometown type, for allNPS recruits combined ... ............. . 42
16. Enlistment reason scales, for all NPSrecruits combined .... ............... . 44
x

CONTENTS (Continued)
Page
Figure 17. Enlistment reason items, for all NPSrecruits combined .... ............... . 45
18. Effect of loss of recruitment incentiveson those receiving the incentive, if noService offered the incentive .......... .. 47
19. Effect of loss of recruitment incentiveson those who received the incentive, if theMOS did not offer the incentive ......... .. 48
20. Decision tree for selecting a samplingdesign ....... .................... 61
xi

COSTS AND ERRORS TN SURVEY SAMPLE DESIGN:AN APPLICATION TO ARMY PROSPECT AND RECRUIT SURVEYS
The overall goal of this research effort is to developsampling models that could be used to design sampling frames andspecifications for Army surveys of prospects making initialappointments with recruiters, formally applying for enlistment,and contracting for service, and accessioning into the Army.These sampling models incorporate survey costs and samplingerrors that could affect survey design decisions.
The purpose of this report is to discuss sampling designsfor Army prospect and recruit surveys and to discuss theimplications of these designs for the development of a compr*-erspreadsieet that incorporates a model for surveying Armyprospects and recruits. These tasks include (1) a generalassessment of the costs and errors in survey sampling for thefour points in this process (initial appointments, applications,contracts, and accessions); (2) a general assessment of thecosts, errors, benefits, applicability, and practicability ofsurvey methods and techniques for prospect and recruit samplesurveys; (3) application of the general model to the specifics oftwo situations: on-going surveys of accessions at all eight Armyentry points, and contemplated computer-administered surveys atall Army recruiting stations; and (4) the development of specificmodels for at least two sampling points that can be used toestimate costs and errors of sample sizes, sampling techniques,and data collection methodologies. The model is incorporatedinto a Lotus 1-2-3 spreadsheet and documented in a user's manual(McGuire, in preparation).
The first section of this report provides an overview of therecruitment process and the research literature related to it.The purpose of this section is to describe the generalbackground, constraints, and results of previous Army recruitmentsurvey research. Next, the results of data analyses examiningissues of representativeness of survey samples across seasons arepresented and discussed. The report then discusses a generalmodel of costs and errors in survey sampling for initialappointments, applications, contracts, and accessions. Severalissues are generally addressed: the relative importance ofsurvey research on the recruitment process, sources of surveycosts by stage of survey sampling, and sources of errors by stageof survey sampling. The next section discusses the applicationof the model to on-going surveys at all four stages of therecruitment process. In particular we consider the costs,benefits, errors, applicability, and practicability ofalternative sampling plans. The final section of this reportpresents and discusses a prototype spreadsheet that eventuallywill be a.le to generate estimates of the economic costs andsampling errors of a given survey using a given sampling design.
1

An Overview of the Army Recruiting Process
In this section, we review the background, organizationalstructure, and recruitment process of the U.S. Army RecruitingCommand (USAREC). The purpose of this overview is to describethe context in which Army survey research occurs and therebyidentify factors that are important to sampling designdecisions. The selection of sampling designs for personnelsurveys depends critically upon situational constraints withinthe Army and the survey purposes of USAREC. Additionally, thisinformation may serve as an introductory primer about Armyrecruiting practices for other researchers.
Background
Recruiting qualified personnel into entry level positions isan important challenge for any organization. As one of thelargest employers of the nation's youth, recruiting for the U.S.Army is especially challenging. The Army, through its recruitingcommand, must enlist about 200,000 new recruits each year(including active duty and the Army Reserves) into dozens ofdifferent entry level jobs (USAREC, 1989). The Army is thelargest of the nation's military services, maintaining an activeduty strength of about 770,000 (USAREC, 1989).
There are several factors that contribute to the complexityof the Army's recruiting mission. In addition to the sheervolume of recruits needed, changes in military strategy, tactics,and technology produce changes in the job requirements andrecruiting objectives for specific job types (e.g., the number ofnurses needed). The size of the Army can vary considerably,increasing with rises in world tensions and potential conflictsand decreasing with reductions in the nature of the securitythreats. These changes, set by congressional policy, can occuron relatively short notice.
There are several exogenous variables that also affectrecruiting policies and practices. The economic conditions ofthe country produce marked effects upon the supply of potentialrecruits. Strong levels of employment and comparatively higherlevels of pay in the private sector significantly increase thechallenge associated with recruiting the requisite quality andquantity of recruits (Cotterman, 1986; Polich, Dertouzos & Press,1986). Additionally, the availability of quality prospectsvaries with the season of the year (Hay, 1990).
In order to meet the challenges of attracting sufficientnumbers of quality recruits, the U.S. Congress has authorizedseveral enlistment incentive programs. For example, cash bonusesand college scholarships are available for enlisting high qualityrecruits into certain job specialties (Polich et al., 1986;Polich, Fernandez, & Orvis, 1982).
2
In summary, the size, complexity, and cost of recruitingcombined with strong competition for potential recruits makesrecruiting a challenging endeavor. Obtaining accurate, up-to-date information about the availability, circumstances, andmotivations of Army prospects and recruits is important foradapting advertising and incentive programs to the changing needsand conditions of the labor market. Hence, survey information isan essential component of sound, cost-effective management of therecruiting process. In order to understand how survey researchcan influence the recruiting process, we need to take intoconsideration the structure and management of the recruitmentprocess.
Organization and Structure
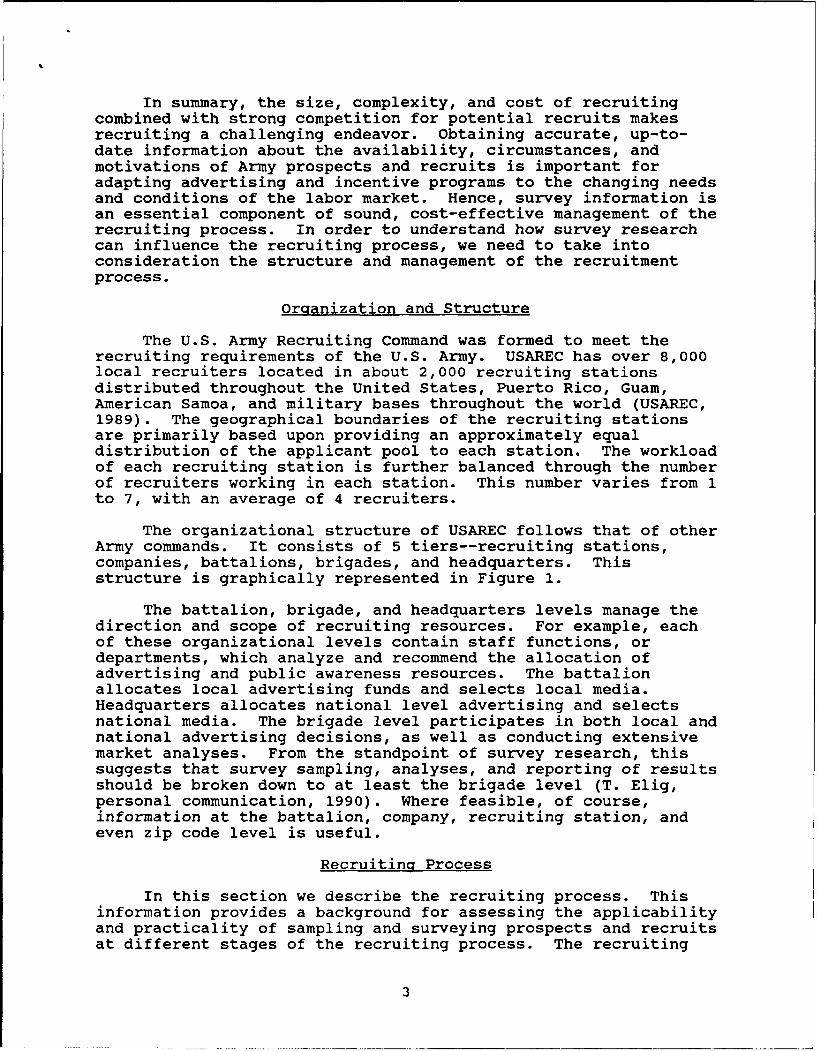
The U.S. Army Recruiting Command was formed to meet therecruiting requirements of the U.S. Army. USAREC has over 8,000local recruiters located in about 2,000 recruiting stationsdistributed throughout the United States, Puerto Rico, Guam,American Samoa, and military bases throughout the world (USAREC,1989). The geographical boundaries of the recruiting stationsare primarily based upon providing an approximately equaldistribution of the applicant pool to each station. The workloadof each recruiting station is further balanced through the numberof recruiters working in each station. This number varies from 1to 7, with an average of 4 recruiters.
The organizational structure of USAREC follows that of otherArmy commands. It consists of 5 tiers--recruiting stations,companies, battalions, brigades, and headquarters. Thisstructure is graphically represented in Figure 1.
The battalion, brigade, and headquarters levels manage thedirection and scope of recruiting resources. For example, eachof these organizational levels contain staff functions, ordepartments, which analyze and recommend the allocation ofadvertising and public awareness resources. The battalionallocates local advertising funds and selects local media.Headquarters allocates national level advertising and selectsnational media. The brigade level participates in both local andnational advertising decisions, as well as conducting extensivemarket analyses. From the standpoint of survey research, thissuggests that survey sampling, analyses, and reporting of resultsshould be broken down to at least the brigade level (T. Elig,personal communication, 1990). Where feasible, of course,information at the battalion, company, recruiting station, andeven zip code level is useful.
Recruiting Process
In this section we describe the recruiting process. Thisinformation provides a background for assessing the applicabilityand practicality of sampling and surveying prospects and recruitsat different stages of the recruiting process. The recruiting
3

cc)
Coc
CCc
oc C
Co
040
z
I h.
ILI -I a;CIlL I ~ 'I"
~aii~jII~2
4,r. -

process is described in terms of the activities conducted by theU.S. Army Recruiting Command.
The recruiting process consists cf seven stages--fromproviding prospective recruits with an awareness of Armyopportunities through accessing at the reception battalion fortheir first day of Army service. These stages are depicted inFigure 2.
The first stage of the recruitment process is creating anawareness of Army opportunities in the eligible population. Thetarget audience is primarily 17 to 24 year old males (additionaldemographic information concerning Army prospects is provided inthe next section). This awareness is created through a varietyof advertising and public relations methods. As previouslymentioned, USAREC Headquarters coordinates an extensive nationaladvertising campaign, consisting of television and radiocommercials, magazine advertisements and inserts, direct mail,and an 800 number telephone information service. USAREC brigadesand battalions direct similar efforts on the regional and locallevels. They utilize local newspaper and radio advertising andcoordinate public relation efforts such as technical displays,Army medical team visits, and Golden Knight parachute teamexhibitions at air shows. A primary purpose of all publicrelations activities is to generate leads for the recruiters.For example, when inquiries are received from the 800 telephonenumber or from direct mail or magazine cards, these leads areprovided to local recruiters.
Recruiters follow-up the leads by contacting prospects bytelephone. Lead generation activities are also conducteddirectly by recruiters. They obtain referrals from prospects,high school counselors and coaches, and from other sourcesdeveloped through community involvement activities. Theseactivities can include school presentations, awards (UnitedStates Army Reserve Scholar/Athlete Award, Junior ReserveOfficers Training School, etc.), or scheduling the administrationof the Armed Services Vocational Aptitude Battery (ASVAB) at theschool. The objective of these initial contacts, known as'prospecting', is to schedule appointments for sales interviews.
Sales interview appointments, the third stage of theprocess, can be conducted at the prospect's home, a neutral site,or at the recruiting station. Recruiters utilize standard salesprocedures of determining the prospects' needs and interests,presenting features and benefits of Army enlistment, pre-qualifying, handling objections, and closing the sale.
For those interested in enlisting, the application processbegins with the recruiter pre-screening the prospect for mental,physical, and moral qualifications. From this information, therecruiter prepares the prospect's enlistment packet. Thisinformation is verified by the recruiter through, for example,
5

Recruiting Activities
Public Relationsr
Notional Local IAwareness" TV - Special Events" Radio - School Programs" Magazines * Awards* 800 number * ExhibI13/DiSplays" Direct Mail * Posters
"Telephone"Face to Face Contacts
" School Program" ASVAB Program
Sales Presentation" Establish Rapport" Determine Needs and Interests Appointment*" Pre-Oualify" Present Features and Benefits" Handle Objections and Close ______
Recruiter Processing" Check Eligibility I Applications" Prepare Packet
MEPS Processing" MentalTesting Processing and Contracts" Physical Exams" Guidance Counselor" Administrative" Enlistment
DEP E" Initial Orientation" Follow-up Contacts
Accession
"Check Qualifications Accsson* Transport to Reception Battalion
Figure 2. Recruiting activities for the U.S. Army
6

checking education records with the school, checking the socialsecurity number, etc.
The next recruiting step is to schedule the prospect for themental examinations--the Armed Services Vocational AptitudeBattery, or ASVAB. Scores from the ASVAB are used to determineminimum qualifications, and eligibility for Army jobs and certainenlistment incentives. Recruiters can schedule prospects to takethis test at a mobile testing station, their school, or at theMilitary Entrance Processing Station (MEPS). After successfulcompletion of the ASVAB, additional processing is conducted bythe MEPS. Recruits undergo a physical examination, and meet witha guidance counselor (GC) to discuss job opportunities andenlistment options (e.g., bonuses, educational scholarships).
It is important to note that the MEPS is part of a separateDepartment of Defense command, USMEPCOM, which is staffed by allfour military branches. MEPS processing involves travel for manyprospects, since there are about 80 MEPS stations to serve thethousands of recruiting stations for all of the services.
After discussing enlistment options, the guidance counselorpresents the prospect with an enlistment contract. The contractspecifies the term of enlistment, the job (military occupationalspecialty, or MOS) the recruit will be trained for, and the dateof entry. The recruit can enter immediately (direct accession),or can delay entry for a few weeks or months, up to as much as ayear. This latter option is known as the delayed entry program,or DEP.
When recruits enter the DEP, the recruiter provides themwith an initial orientation, usually within the first three daysof entry. This orientation discusses their enlistment optionsand provides additional information about basic training, Armylife, etc. Recruiters maintain regular contact with theirrecruits in DEP and serves, in effect, as their squad leader.
The seventh and final stage in the recruiting process is inaccessing recruits into active duty. These arrangements are madeby the MEPS and involve re-checking qualifications (including amedical inspection) and documentation, and arrangingtransportation to the appropriate Army reception battalion.Given this basic description of the recruitment process, wereview relevant research on Army recruitment in the next secti-l.
Literature Review of the Army Recruitment Process
In this section, we summarize research on the Armyrecruitment process. This research summary provides importantbackground for what is known about the variables which affectArmy recruitment and which therefore need to be identified andconsidered in survey and sampling design decisions. Furthermore,the literature review provides a framework for identifying
7

possible sources of error to consider when interpreting surveyresults.
The studies on recruitment are organized into three sub-sections: (1) enlistment decisions; (2) recruiting activities;and (3) market segmentation. This organization corresponds tothree key activities for managing the recruiting process--monitoring recruiting outcomes, directing recruiting activitiesand resources, and adapting the approach and resources to marketsegments. From the scientific perspective, this is the familiarorganization of reviewing the dependent, independent, andmoderating variables, respectively. The literature searchactivities involved: (a) conducting several computerizedsearches of the PSYCHINFO databases (the psychology and NTISindexes); (b) checking reference sections of relevant journalarticles and technical reports; and (c) contacting Armyrecruiting experts (MAJ Bradford of USAREC, Dr. Elig and Ms. Hayof ARI, and Dr. Borman of PDRI).
Enlistment Decisions (Dependent Variables)
The focus of most Army recruitment research is upon theenlistment outcome--whether a person enlists or does not enlist.From the organization's perspective, the purposes for this focusinvolve interests in improving the efficiency of recruiting(e.g., reducing costs) and in identifying potential sources foradditional recruits among the qualified losses (Berryman, Bell, &Lisowski, 1983).
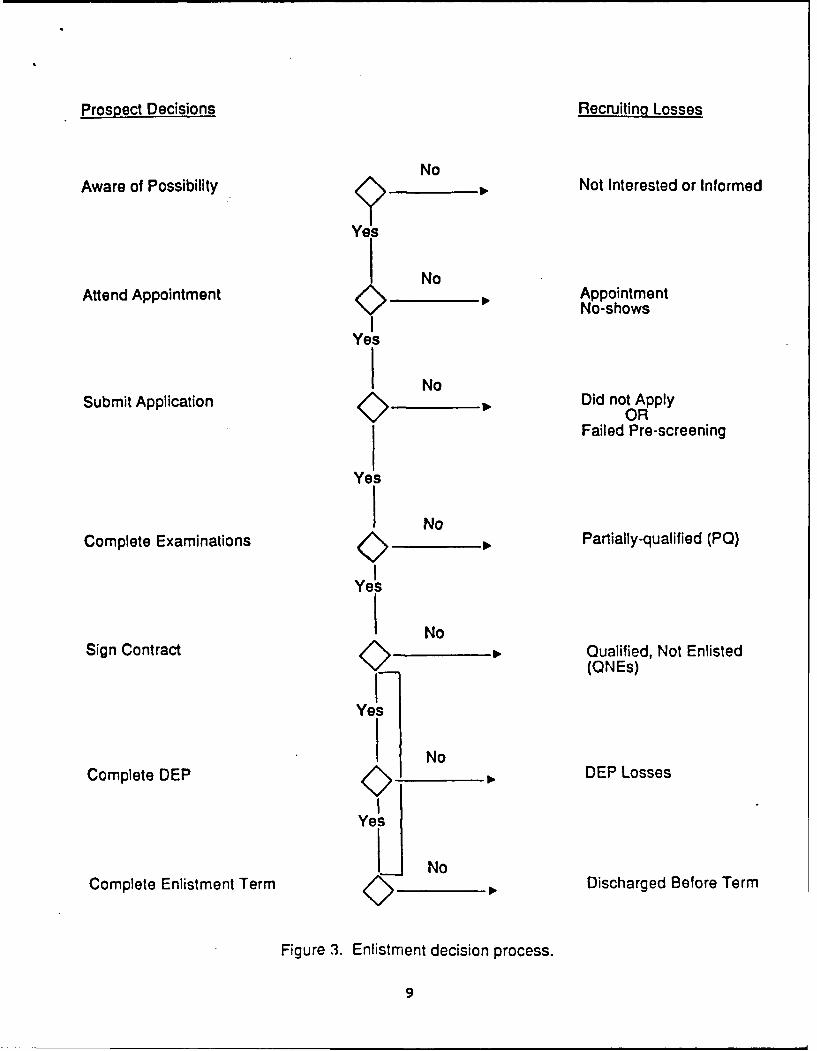
Conceptually, enlistment outcomes can be differentiatedbased upon the stage of the recruiting process and upon thenature of the outcome (i.e., accession, recruiting loss, orfailure to qualify). These outcomes are depicted in Figure 3.Each stage of the process involves a decision, either on behalfof the individual or the Army (e.g., medical or Armed ForcesQualifying Test [AFQT] rejections), of whether to continue therecruitment process.
Accordingly, each decision point in Figure 3 defines anoutcome group(s) and involves a population with differingdemographic characteristics. For example, Berryman et al. (1983)examined the demographic composition of seven of these outcomegroups using information on the 1977 cohort of applicants. Whencomparing the multivariate means of several demographic variables(age, AFQT score, educational attainment, etc.), discriminantanalyses indicated that AFQT failures and individuals who werefully qualified but did not enlist (QNEs) were the mostdissimilar to other outcome groups. AFQT failures were much morelikely to be high school dropouts, poorer, younger, and from aminority group. QNEs, in contrast, were more likely to be older,have dependents, have had some college, and live in ametropolitan area. They also noted that partially qualifiedlosses (i.e., those who qualify on the AFQT exam, but did notcontinue, or 'PQ's) are quite similar to direct accessions, but
8
Prospect Decisions Recruiting Losses
NoAware of Possibility _____ • Not Interested or Informed
Yes
NoAttend Appointment Appointment
No-shows
Yes
I NoSubmit Application _ __ Did not Apply
NJ ORFailed Pre-screening
Yes
I NoComplete Examinations 0_ _ Partially-qualified (PQ)
Yes
NoSign Contract p Qualified, Not Enlisted
Ni (ONEs)
Yes
No
Complete DEP _ __ DEP Losses
Yes
JNoComplete Enlistment Term _ Discharged Before Term
Figure 3. Enlistment decision process.
9

differ in terms of better civilian employment and educationalopportunities. With respect to these last two groups, theseanalyses are especially interesting for the clues they provideabout what kinds of incentives or changes in recruiting practicesmay be necessary to attract additional enlistees from theselosses.
In addition to cross-sectional demographic differences,longitudinal differences also exist across the stages of theenlistment process. For example, Orvis (1982) found that only50% of a sample of eligible youth who expressed a positiveintention to enlist, had in fact enlisted about five years later.More dramatically, Hosek and Peterson (1990) report that about2/3 of the women recruits in the two years following a 1980survey had expressed a negative propensity to enlist.
From the research point of view, these results provide astrong rationale for using great care in selecting samples tostudy, in formulating dependent variables, and in interpretingdata. For example, assessments of advertising effectivenesswould ideally be made using information collected from the mostrelevant group--the eligible population (ie., 17-24 year-olds).Advertising probably exerts its influence most strongly byincreasing the number of eligible youth who begin the recruitingprocess. That is, advertising alerts eligible youth to Armyopportunities, thereby increasing the likelihood that they willcontact the Army, or when contacted, will respond by attending anappointment with a recruiter. Hence, sampling eligible youth orfirst contacts would be the more relevant populations.
When this is not feasible, due consideration should be givento systematic differences in composition between the sample usedand the population to which inferences are made. Errors in datainterpretation and decision-making due to non-representativesampling can be reduced when sample biases can be specified.This can best be accomplished by regularly sampling these outcomegroups to identify demographic and other characteristics whichmay systematically affect the inferences which need to be made.Descriptive information about the populations at each point ofthe recruiting process (e.g., Berryman et al, 1983) is essentialfor evaluating the size and direction of biases in the dataintroduced by selection biases in the samples.
Recruiting Activities (Independent Variables)
During the 1980s, the Department of Defense sponsoredstudies on three major interventions used to increase the qualityand quantity of Army enlistments. These studies were conductedby researchers at the Rand Corporation. They are: RecruitingEffects of Army Advertising (Dertouzos, Polich, Barmezai, &Chesnutt, 1989); Enlistment Effects of Military EducationalBenefits (Polich et al., 1982); and The Enlistment BonusExperiment (Polich et al., 1986). In addition to the effects ofadvertising, scholarships, and bonuses, these studies measure and
10

discuss the effects of recruiter effort, a fourth major categoryof interventions which impacts the level of Army enlistments.The objectives and findings of these studies are summarizedbelow.
Advertising
The Army spends about $40 to $45 million dollars annuallyfor recruiting advertising in major media (Dertouzos et al.,1989). Additionally, the Department of Defense spends about $15to $20 million on joint service recruitment advertising. At thenational media level, these funds are utilized on television(69%), network radio (18%), and magazines (13%). About 10 to 16%of overall advertising resources are allocated for localadvertising. These funds are distributed to local radio (57%),daily newspapers (27%), and high school and weekly newspapers (8%each).
While the advertising purpose is to increase enlistments,the strategy differs between national and local media. The focusof national media advertising is to enhance the organizationalimage and to describe the general character of Army training andwork. Local media efforts, in comparison, tend to provide moredetail, such as current job opportunities, enlistment options,and the telephone number of the local recruiter.
The effects of advertising are significant and immediate. A100% increase in television advertising was estimated to increaseenlistments by 2% in that month (Dertouzos et al., 1989).Furthermore, the effects extend for as long as six months,declining each month about 42%. Among types of media, nationalTV and magazines were found to produce the largest effects.However, when costs were factored in, this ordering changed. Themost cost effective media for increasing high quality recruitsare, in order: weekly newspapers, magazines, daily newspapers,network radio, and national TV, respectively.
These results were based upon econometric analyses ofmonthly data, collected at the MEPS level, for a three yearperiod. The study controlled for the effects of the number ofrecruiters, their recruiting goals, local economic conditions,and levels of other recruiting sources. This study extendedprevious research by differentiating between media types and byincluding the effects of local advertising. However, the datadid not permit an assessment of other important issues,including: whether enlistment increases were drawn from thecivilian sector or other services; what long-term effects theremight be on the public, on military morale, and on reenlistmentbehaviors.
Educational Benefits
Educational benefits for military personnel represent animportant enlistment incentive. Unlike previous "GI Bills",
11

programs for educational assistance examined here are targeted to'high quality' (i.e., high school graduates with AFQT scores ator above the 50th percentile) individuals in critical skills. In1981, an experiment was conducted to investigate the effects offour alternative educational assistance plans upon enlistment.These four plans, formulated by Congress and DoD, included:
The experimental control. The basic Veterans EducationalAssistance Program (VEAP) provided two-for-one matching funds forcontributions made by service personnel, up to a combined maximumof $8100. The Army provided an additional $6000 ('kicker') foreligible recruits in selected jobs.
Noncontributory VEAP. This was the same program as thecontrol, with the exception that no contribution was required ofthe participant.
Tuition/stipend. This program increased the benefits, up to$15,600 indexed for inflation, and was available to eligiblerecruits in all services. Under this plan, all services providedthe same program (e.g., there were no kickers for the Army).
Ultra VEAP. This program expanded Army kickers to $12,000for eligible recruits (i.e., 'high-quality' recruits).
These plans were offered by recruiting stations in balancedsets of geographical areas for the period from December 1980 toSeptember 1981. The experimental design utilized regressionanalyses with controls for unemployment, civilian wage rates,program advertising, number of recruiters, and trends over time.
The results indicated that educational assistance programscould produce substantial increases in enlistments (Polich etal., 1982). The Ultra VEAP program produced a 9% increase inArmy enlistments. The Tuition/Stipend plan increased Navy andAir Force enlistments by 5 to 8%, but decreased Army enlistmentsby 6%. The Noncontributory plan had nonsignificant effects.
Bonuses
Cash bonuses, paid to high quality new recruits in targetedjobs, represent a flexible and important enlistment incentive.Congress, in the early 1980s, directed a test of expanded bonusoptions as a means of attracting additional, high quality youthinto the Army. The options were as follows:
Experimental control. A $5000 bonus for a four yearenlistment was available at 70% of the recruiting stations.
Plan 1. An $8000 bonus for a four year enlistment wasavailable at 15% of the recruiting stations.
12

Plan 2. An $8000 bonus for a four year enlistment or a$4000 bonus for a three year enlistment was available at 15% ofthe recruiting stations.
The test was conducted from July 1982 through June 1984.MEPS areas were assigned to each plan in the percentagesindicated. Assignments were randomized under constraints ofbalancing the test sites in terms of geographical distribution,previous enlistment rates, civilian economic conditions, and Armyrecruiting goals. Test data were collected monthly for a oneyear base period and during the two year test period. Data werecollected on selected control variables, including: national andlocal advertising expenditures, unemployment rate, civilian wagerate, number of recruiters, and recruiter quotas for high and lowquality recruits.
The data were examined for three possible effects: (1)market expansion (i.e., increase in total enlislments); (2) skillchanneling (shifts of recruits to targeted jobs); and (3) term ofenlistment (changes in choices between 2, 3, and 4 year options).The results showed a significant market expansion effect (Polichet al., 1986). Plan 1 ($8,000 bonus) increased overallenlistments 4.1% and plan 2 ($8,000 bonus for 4 years, $4,000 for3) increased enlistments by 5%.
The skill channeling effect of the bonus options was alsosubstantial (Polich et al., 1986). Plan 1 produced a 31.7%increase in eligible skills, while plan 2 produced a 41.5%increase. The bonus plans also produced significant shifts inthe term of enlistment contracts. Plan 1 increased 4 yearenlistments by 15.3% but with a 28.5% reduction in 3 yearenlistments. Plan 2 increased 3 year enlistments by 87% with nochange in 4 year enlistments. The combined effects of marketexpansion and shift in enlistment terms generated increases of 6%and 8% in obligated man-years of military service for plans 1 and2, respectively.
Recruiter Effects
A fourth approach to affecting recruiting outcomes involvesthe allocation of recruiter resources--the number of recruiters,and their level and direction of effort. Although no large-scaleexperiments were directed to this important component ofrecruiting effectiveness, several studies did include recruiternumbers or effort as control variables. Estimates of recruitereffects in these studies confirm the importance of recruiters andtheir activities for achieving recruiting success.
The relative number of recruiters working plays a centralrole in meeting service goals of quality and quantity ofrecruits. However, the marginal utility of increasing the numberof recruiters versus other alternatives for increasing enlistmentsupply is difficult to assess. Comparing coefficients of thesevariables across studies is problematic because differences in
13

levels of data aggregation, methods used, variables included,etc., can strongly affect parameter estimations.
However, the rank order of recruiter levels compared t3other variables affecting the supply of enlistments consistentlyshows it to be one of the more important factors in recruitment.In two studies (Cotterman, 1986; Polich et al., Press, 1986), thecoefficient for recruiter levels ranked second to unemploymentrate for its effect upon enlistment supply, and in one study(Dertouzos et al., 1989), it was ranked first.
Although less important than the number of recruiters, thedirection and level of recruiter effort also significantlyinfluence the quality and quantity of recruits. The recruitmentof high versus low quality recruits often requires differentrecruiting activities with differing levels of effort associatedwith them. Recruiters typically must spend more time to attracthigh quality prospects. This time is spent talking withprospects; talking with their parents, coaches, and high schoolguidance counselors; attending science fairs and career days,etc. In contrast, recruiters can more easily increase the numberof low quality recruits with the less time consuming activity ofenlisting those who walk-in at the recruiting station or byobtaining youth counselling referrals (Polich et al., 1986).
Direct assessment of the direction and level of recruiterseffort is not feasible. However, Polich et al. (1986) estimatedthese effects by utilizing information about recruiters quotasfor high and low quality recruits and their performance relativeto these quotas. Their results appeared to confirm thesubstantial additional effort required to enlist high qualityrecruits. Their data also indicated that increases in enlistmentsupply can produce a decline in recruiter effort, if quotas orother measures are not taken to ensure that a high level ofeffort is maintained.
Market Segmentation (Moderating Variables)
The efficient utilization of recruiting resources dependsupon targeting these resources to appropriate market segments.Market segments vary considerably in enlistment propensities andin their receptivity to differing types of media, advertisingcontent, and enlistment incentives. Additionally, the accuracyof inferences made from survey information depend critically uponhow representative samples are of the desired population(s).This requires precise knowledge about the composition anddefining characteristics of the relevant population.
From a scientific point of view, this can be viewed asvariables which moderate the impact of recruiting interventions(independent variables) on the recruiting outcomes (dependentvariables). Identifying and controlling for the effects of thesevariables is essential to estimating precisely the effects of theindependent variables.
14

Three types of moderating variables have been studied:psychological, economic, and demographic. We discuss the effectsof each these next.
Psychological Variables
Examination of psychological variables holds some promisefor providing more precise explanations of enlistment decisions.While demographic variables tend to describe characteristics cfgroups which distinguish differential probabilities forenlistment, psychological variables provide information aboutindividuals. Most enlistment studies analyze data at anaggregate level of analysis and organize market segments basedupon group status. To the extent that organizing market segmentsbased upon individuals' characteristics improves ourunderstanding of enlistment decisions, targeting recruitmentresources to market segments based upon psychological variablescould improve recruiting effectiveness.
Enlistment motivation pattern. Recruits' motivation toenlist includes both psychological as well as economic reasons(Elig, Johnson, Gade, & Hertzbach, 1984; Pliske, Elig, & Johnson,1986). U.ing a large sample survey of 1982 and 1983 recruits,enlistment motivation was assessed using two different questionformats--a forced-choice format (10 response options) and amultinomial approach (15 to 28 options, depending upon surveyversion). Consistent with previous results, the top reasons forenlisting across three cohorts of recruits (1979, 1982, 1983)were, in order: chance to better myself, get trained in a skill,money for college education, to serve my country, and to escapeunemployment. Given the sharp increases in unemployment in theearly 1980s, it is not surprising that significant increases werefound for escaping unemployment (from 4% in 1979 to 10% in 1982)and for obtaining money for a college education (from 7% in 1979to 15% in 1982).
To explore the structure of enlistment motivations,principal components analyses were conducted, yielding sixdistinct motivational factors underlying the 28 multinomialenlistment responses. These were: self improvement, economicadvancement, military service, time out (i.e., to decide futureplans or to escape personal problems), travel, and educationmoney. The usefulness of a more clear understanding of thepsychological determinants of enlistment is illustrated by oneapplication of these findings. When examining term ofenlistment, recruits who enlisted for four years were primarilymotivated by military service, compared to motivations of traveland obtaining money for education for recruits enlisting for twoyear terms.
AFOT. Applicants are classified into one of six categoriesbased upon their scores on the Armed Forces Qualifying Test.These categories are as follows (Berryman et al., 1983):
15

Category I 93 - 99th percentileCategory II 65 - 92nd percentileCategory IIIA 50 - 64th percentileCategory IIIB 31 - 49th percentileCategory IV 10 - 30th percentileCategory V 1 - 9th percentile
Categories I-IIIA constitute the priority, 'high quality', groupsfor recruiting. Applicants from Categories IIIB and IV areaccepted, but not applicants from Category V. As previouslymentioned, AFQT failures were much more likely to be high schooldropouts, poorer, younger, and from a minority group.
In general, the higher the AFQT score, the less likely it isthat an individual will enlist. This pattern is evident acrossPQ losses, medical failures, and QNE losses (Berryman et al.,1983). However, DEP losses show no relation to AFQT scores. Amajor exception to this trend is for graduates who expect moreeducation--their enlistment probability increases with AFQTscore.
Educational expectations. Within the market segments ofhigh school graduate/nongraduate, Hosek, Peterson, and Eden(1986) found educational expectations to be an important sub-segment which defines enlistment outcomes and the effectivenessof enlistment interventions. Specifically, among graduates whoexpect more education, enlistment probability increases with AFQTscore. This is in sharp contrast to graduates who do not expectmore education. Their enlistment probability decreases withhigher AFQT scores, as do seniors, regardless of educationalexpectations.
Economic Variables
Unemployment rate. Unemployment rates play a significantrole in determining the level and quality of enlistment supply.The effects of unemployment levels have been estimated in studiesof various enlistment interventions (i.e., bonuses, educationalbenefits), where unemployment is included as a covariate insystems of linear equations developed to evaluate the impact ofthese interventions. Estimates of the effects of unemployment onenlistment supply vary considerably, but in all cases aresubstantial. In terms of relative magnitude, it is comparableto the substantial effects of enlistment bonuses and educationalbenefits and is much larger than effects of civilian pay rates,recruiter effort (i.e., assigned goals), number of recruiters,and levels of national and local advertising (Cotterman, 1986;Polich et al., 1986).
The inconsistency in estimation of the size of theunemployment effect is apparently a result of the differingapproaches to its measurement and to the quantitative methodologyused for modeling enlistment supply. Unemployment has beenoperationalized as the unemployment rate and as the deviation
16

from trends in business cycles. Further, modeling approacheshave differed with respect to whether observations are consideredstatistically independent or dependent [for a discussion of theseissues, see Cotterman (1986)].
Wacies. Increases in civilian pay, compared to military pay,produce declines in enlistments. This responsiveness to wagedifferentials is characterized in econometric modeling by anelasticity, or the "effect of a 1 percent increase in the hourlywage on the percentage change in the enlistment probability" (p.17, Hosek et al., 1986). Elasticity values vary, depending uponthe sample and methods used. However, estimates of wagedifferential elasticities are more consistent than those forunemployment, although the size of the effect is much less.
Importantly, wage responsiveness also varies according tomarket segment. Analyses by Hosek et al. (1986) indicate thatenlistment probabilities for seniors who do not expect furthereducation are very sensitive to prevailing wage rates. In theirstudy, the elasticity for this group was -3.3 (i.e., a 1%increase in hourly wage produces a 3.3% drop in enlistments)compared to -1.1 for graduates who expect more education, -.65for graduates who do not, and -.59 for seniors who do.
These analyses demonstrate the usefulness of marketsegmentation and the importance of using more than one variableto define the segment. Without these analyses, the sensitivityto wage rates of high school seniors not expecting additionaleducation would have been masked in the overall averageelasticity across groups of -1.45. The practical application ofthese results is in targeting recruiter activities andadvertising resources to the seniors not expecting futureeducation, when local conditions show that civilian wages arecomparatively less favorable with respect to military wages.
Demographic Variables
Gender. Women represent a substantial, and increasing,segment of active duty military personnel. Their participationhas grown from 1% in 1970 to almost 11% currently (Hosek &Peterson, 1990). The range of jobs available to them has alsoincreased, but combat and combat-related positions remainexcluded. Because women represent a large potential source ofrecruits, research was conducted to assess the determinants ofenlistment decisions for women. The determinants examinedinclude career (earnings and employment opportunities), personal(marriage), and education variables (academic ability, theability to finance further education, education plans). Theresults indicated ". . that for most variables the coefficientsare statistically equivalent for male and female seniors and formale and female graduates" (p. vii, Hosek & Peterson, 1990).Some differences were identified. These included a smallereffect for labor force variables and a lower enlistmentprobability for women who intend to marry within five years (vs.
17

no effect for men who intend to marry). These results suggestthat current advertising, incentives, and recruiting practicesperform about as well for women as for men. However, theresearchers recommended additional work on the responsiveness ofwomen to initiatives targeted specifically to them.
Race. In terms of applicants and accessions, blacks havegenerally been overrepresented and whites and Hispanicsunderrepresented with respect to the youth population. In 1977,blacks comprised 12% of the population of 18 to 24 year olds, 23%of the applicants, and 21% of the accessions. Eighty percent ofthe youths in the 1977 population were white and 76% of theaccessions were white. Hispanics comprised 6% of the youthpopulation and 2% of the accessions (Berryman et al., 1983).
Blacks were also overrepresented in terms of AFQT failures,failing at triple the rate of whites. This could result fromdifferences in educational attainment and from the interaction ofeducational attainment with AFQT standards [in 1977, AFQTstandards were higher for high school dropouts than for graduates(Berryman et al., 1983)].
Age. Youth, aged 16 to 18, comprised 60% of the 1977accessions. Nineteen to twenty-one year olds accounted for 29%,22-24 for 7%, 25-29 for 3%, and 30 to 39 year olds for .4%(Berryman et al., 1983). Furthermore, age showed consistenttrends of increasing losses with increasing age for PQ and QNElosses and for medical failures. There were no age-relatedtrends for DEP losses, but AFQT failures declined with increasedage, except for the 16-18 year old group.
Marital and dependency status. Over 90% of the 1977accessions were single. For those who were married, PQ, QNE, andmedical failure losses were positively associated with the numberof dependents (Berryman et al., 1983).
Educational status. Educational status is one majordistinguishing variable that defines two important marketsegments--the high school senior vs. the high school graduate(Hosek et al., 1986; Hosek & Peterson, 1990). Seniors'enlistment probabilities are more affected by education-relatedvariables such as ability to finance further education, andparental and personal educational expectations. In contrast,graduates' enlistment probabilities depend more upon work-relatedvariables. Enlistment probabilities increase when unemploymentincreases and when civilian pay, work experience and job tenuredecrease. With respect to recruiting losses, high schoolnongraduates had triple the AFQT failure rate and even one yearof college substantially increased PQ and QNE loss rates(Berryman et al., 1983).
Ability to finance education. Family income is negativelyrelated to enlistment probability for high school seniorsexpecting more education (Hosek et al., 1986). Surprisingly,
18

family income shows no relationship to enlistment probability forgraduates, even for those who do expect to further theireducation.
Summary
We organized the review of recruitment studies according torecruiting outcomes (dependent variables), recruiting activities(independent variables), and market segmentation (moderatingvariables). This organization is useful to survey researchers byidentifying important variables that must be estimated andcontrolled when interpreting survey results and by identifyingvariables that define the composition of survey populations.With an understanding of this recruitment process in mind, wenext present a general model of survey sampling that can beapplied to different points in the recruitment sequence.
Sample Representativeness and Seasonality Effects:Data Analyses and Discussion
In this section, we present the results of data analysesconducted to determine the representativeness of seasonal samplesof Army recruits in the New Recruit Survey (NRS). These analysesextend previous results (Hay, 1990) that examined therepresentativeness of samples obtained from existing procedures.
We also examined the feasibility of using weightingstrategies to represent an entire year of accessions from dataobtained during three months of the year. Our goal was todetermine whether full-year NRS results can be reliably estimatedfrom single-trimester data. Such estimation is possible ineither of two cases: First, if there is no variation in surveyresponses across trimesters then one trimester is representativeof the full year and surveying need be done only during onetrimester. Second, even when variation across trimesters exists,full-year NRS responses can be estimated if the variation followsa predictable pattern. Such an extrapolation, of course,requires that social, economic and political conditions duringthe new survey be unchanged from those under which theextrapolation equations were derived.
These analyses were conducted using data provided by theArmy Research Institute (ARI) and included survey responses ofnon-prior service (NPS) recruits to the New Recruit Surveysconducted during 1987, 1988, and the first two trimesters of1989.
Our analyses indicate that full-year responses for some NRSquestions can be predicted from single-trimester data, othersneed not be predicted, and still others cannot be predicted atall. Some of the most important questions could not be predictedfrom single-trimester data; those items should be surveyed atleast every trimester. These results are discussed in detail
19

below, following a brief description of previous research and a
presentation of the research methodology.
Review of Previous Research
Two existing reports relate directly to this project:recent work by Hay (1990) on seasonality effects in NRSresponses, and a hierarchical log-linear analysis of NRS data(Barnes, Crawford and Minadeo, 1990).
Hay (1990) analyzed two years of NRS data (1987-1988) "todetermine if there are substantial seasonal variations incharacteristics of accessions". She found that AFQT category,age at contract, gender, geographic region, enlistment term,length of time in DEP, first contact with an Army recruiter, andcircumstances of that first contact "appear to have substantialseasonal effects". Based on her work we see that these NRS itemsmust be surveyed during the full year unless predictable seasonalpatterns can be identified. It is therefore worthwhile askingwhether statistical equations exist that could explain thoseseasonal effects.
Barnes et al. (1990) investigated whether "all threetrimesters of the New Recruit Survey must be sampled to insureaccuracy of the survey results". Their hierarchical log-linearanalyses investigated whether categorical items representing fivemajor areas of concern (first contact, college fund, reason forenlistment, school status and work status) varied acrosstrimester, gender and/or year of survey. Barnes et al. concludedthat "all three trimesters are needed in the survey" becausestatistically significant relationships were identified in theirstudy.
Apparently Barnes et al. were not aware that the existenceof statistically significant relationships implies twoconclusions, their own and one other. First, it is true thatsingle-trimester data are not representative of full-year data,but, second, three-trimester data are related to single-trimesterdata through the statistically significant log-linear equationsthat Barnes et al. computed (but did not report). That secondconclusion points toward the possibility of predicting full-yearNRS responses from single-trimester data.
Earlier in this report we described the recruitment processand noted that, in order to address certain questions (such asthe importance of enlistment incentives to those who choose notto enlist), surveys of prospects must be conducted prior toaccession. We noted that responses to certain survey questions(such as percent planning to use the new GI Bill) are dependentupon the efforts of recruiters, which are themselves dependentupon administrative and legislative direction. Results of dataanalyses (discussed below) reinforce this observation.
20

Since survey responses for some items depend on legislativeand/or administrative efforts, any estimation of full-year NRSresults from single-trimester data must consider whether thesurvey is being conducted under conditions identical to thoseunder which the estimation equations took place. Consideringrecent social and political changes (economic recession; war inthe Persian gulf), it is clear that some past predictionequations will not be usable in the future. Althoughrelationships have existed in the past, new ones will need to bedetected and quantified for future use.
In summary, Hay (1990) established that systematic patternsexist across trimester for a number of NRS questions. Barnes etal. (1990) showed that statistically significant relationships(and therefore predictable patterns) also exist for certain NRSitems. Estimation equations can therefore be created to usesingle-trimester data in place of full-year data for some NRSitems if and only if survey conditions remain constant fromtrimester to trimester and from year to year. However,political, social and economic conditions have not remainedconstant and so prediction equations are somewhat problematic.Results to be discussed below illustrate the degree to whichsurvey results may change trimester by trimester in contradictionto historical patterns, as well as reporting data that may beestimated. We have presented estimation equations for thosevariables that appear to be predictable at this time.
Methodology
Data analysis started on this project after three magnetictapes containing NRS data (as SAS files) were received from ARIduring July, 1990. The tapes were converted from an IBM-specificformat to the VAX-compatible SAS Data Transfer Format at theUniversity of Minnesota St. Paul Computing Center, after whichnew data tapes could be written to transport the SAS data sets tomicrocomputer. Our original plan was to use SAS/PC version 6.03for data analysis, but a bug in SAS required that we upgrade toversion 6.04 before being able to transfer the data sets. Wewere able to work around a second bug in the SAS data transferroutines. Analyses were primarily performed using SAS/PC(version 6.04) starting during August, 1990. Microcomputers wereused for data analysis to reduce computing expenses.
The first step in data analysis was to create a subset ofvariables for further analyses. More variables were selected forthis subset than were expected to be analyzed. Selectedvariables included: most important reasons to enlist; firstcontact with recruiter; circumstances of first contact; term ofenlistment; effect of loss of incentives; demographic variables;and contract variables.
21

The analysis data set included data for over 17,000 non-priorservice recruits, as follows:
Summer Fall Winter Total1987 3,029 2,420 1,556 7,0051988 1,859 2,285 1,719 5,8631989 1,960 2,215 -- 4,175Total 17,043
After creating the analysis data set, the 1987-88 resultsobtained by Hay (1990) were replicated and extended by includingthe two 1989 trimesters. Those results are discussed and plottedin the next section of this report. We also considered severalrelated questions that Hay did not address. One question waswhether the three-trimester data could be separated into monthlydata, a desirable outcome since monthly data should be more ableto detect time-series trends than is trimester data. Theusability of monthly data is problematic because monthlydifferences exist within each trimester resulting from the methodof surveying. Those differences were caused by surveyingdifferent reception battalions during different months.
A second question we considered is whether the number ofrecruits could be analyzed in addition to the percent respondingto each item in each way. It was not possible to analyze rawcounts in this manner because of the varying number of surveyscompleted during each trimester and the unknown total number ofrecruits passing through each reception battalion each trimester.
Results
This project is concerned with determining whether full-yearNRS results can be reliably estimated from single-trimestersurvey results. Hay (1990) and Barnes et al. (1990) establishedthat differences across trimester do exist: single-trimesterdata are not representative of full-year responses. We have alsoreached that conclusion. It is still be possible (theoretically)to identify statistical relations to allow prediction of full-year results from single-trimester data when across-trimesterdifferences are consistent across years.
We have found that the predictability of NRS responsesdepends upon the individual item, and have grouped NRS items intothree classes:
Items which cannot be predicted at all;Items for which prediction is possible; andItems for which seasonality effects are unimportant.
The items which cannot be predicted are those which are sensitiveto changes in administrative and/or legislative direction (suchas plans to use the G.I. Bill), even though they may havedemonstrated seasonality patterns in the past. Items for whichprediction appears possible are those which show consistent
22

patterns across all eight trimesters analyzed, and includequestions such as the circumstances of first contact with Armyrecruiter. Items for which seasonality effects are unimportantinclude questions such as loss of recruitment incentives, whichmay show seasonal variation that is highly statisticallysignificant, but whose variation is so small that the rank-orderof importance of items does not change.
The discussion that follows focuses on these three types ofitem predictability and analyzes the percent of recruitsselecting different responses to each item. We have generallycompared or contrasted our results to those of Hay (1990) sincehers is the most recent and the most directly applicable researchon this topic. It could have been surmised from Hay's work thatall items showing seasonal variation could be predicted fromsingle-trimester data since the seasonal patterns were consistentacross the two years analyzed (1987-88). When different patternsappeared in the 1989 data, we realized that some of the itemswere not predictable.
Items Which Cannot Be Predicted
Non-predictable items do not vary randomly acrosstrimesters. Random variation would imply that one trimesterwould be representative of a full year. Instead, these itemsfollow patterns, but the patterns can be disrupted by social,economic or political changes. They can also be changed bylegislative and/or administrative efforts.
Actually, the full-year responses to these items can bepredicted from single-trimester data if those social, economic,political, legislative and/or administrative influences areincluded in the prediction model. Creating a model of such acomprehensive relationship is far beyond the limits of the dataavailable for this study.
Percent in each AFOT category. Figure 4 shows that theresponses to this item vary widely from year to year. There is apattern showing a small percent of recruits accessing duringspring and summer who are classified as AFQT-I, and a largerpercentage in the winter. But that larger percentage is sovariant from year to year that a prediction would not bemeaningful. The percent of AFQT-I recruits varies by a factor oftwo from year to year, making prediction errors large. Thoseerrors are magnified when it is noted that the percent of AFQT-Iin spring and summer (the data upon which a prediction would bebased) also varies by more than a factor of two.
Mean enlistment term. Hay (1990) identified a pattern inmean enlistment term, with recruits accessing in spring havingthe shortest term and those in winter the longest. Meanenlistment term also increased from 1987 to 1988. However, thatpattern was reversed in 1989: Summer accessions had shorter meanenlistment terms than spring accessions, and overall terms
23

87.1 87.2 67.3 E38.1 88.2 aaa3 89.1 E3.2 89.3Ttmoestei
Category II = 65-92 PercnileCategoy If-A = 50-64 PerCEnU1eCateoy =l-B = 31-49 PerCentil
Figure 4. Percent in each AFQT category for all NPS recruitscombined.
24

started to decrease (See Figure 5). The changes in this variableillustrate the unpredictability that is (presumably) caused byadministrative and/or legislative action.
Percent planning to use GI Bill. We see patterns acrossthree trimesters for 1987-88 data for this variable, but thosepatterns are contradicted in 1989 (See Figure 6). Althoughinitial results would suggest full-year responses to this itemcould be estimated from single-trimester data, we now see thatthis is not possible, presumably the result of changed socialvalues of youth or changed recruiting efforts by the Army. Thechanges across trimester are too large to consider a singletrimester representative of the full year, and there is noconsistent pattern of responses to allow creation of anestimation equation.
Recruit educational aspirations. This item appears to besomewhat predictable at first glance, but less so when examinedin detail (Figure 7). Although the percentage of recruitsplanning to complete a GED or a bachelor's degree is fairlyconstant across time, the percentages of recruits aspiring tocomplete other degrees follow unpredictable patterns.
Items considered together. When creating a statisticalmodel of any social process, it is necessary to consider theinteractions and relationships between items as well as the itemsthemselves. There is often additional information containedwithin item relationships that illuminate the model. When weconsider AFQT category, plans to use the GI Bill, and recruiteducational aspirations together, we see a contradiction. Thehuge percentage of AFQT-I recruits in winter 1988 should have haddifferent (more ambitious) educational aspirations and/or plansto use the GI Bill than was seen in other trimesters. Infact, no such relationship was seen.
Educational aspirations remained nearly unchanged from 1987to 1988, with a smaller percentage desiring a post-graduatedegree in 1988 (the opposite of what should be expected). We caneither conclude there is an error in the data set or that thesevariables just cannot be predicted over these changingconditions. We could find no such error in the data set and ininterviews with researchers involved in earlier analyses, wefound no reason to suspect data errors. That leaves theconclusion that full-year responses to these items cannot beestimated from single-trimester data. It is possible that theseresults are the consequence of an unusual data gatheringsituation, some peculiarity in the sampling method. If that isthe case, then even three-trimester data may beinadequate;monthly data might be needed to gain accurateestimates of recruit characteristics and attitudes.
25

4.0
n
1
e
e 32r'a 3 4 ....... .......S............... .....31 -.........................................................
30n 6.3 ... ..........7....2 ................................ 86.......2.......... .3......... 9.1........ 69.2.........69.3.......
yhise
Fiue . Mea enlistment.................. term........... for....... all................. recruits............... combined..............
a2

iOCr%
7 9 y ..... .... .... ..... ..................
.N
87.1 87.2 67.3 668.1 66.2 EB3 69.1 89.2 69.3Trimester
MUYes MNo fflBDant Kno
Figure 6. Percent planning to use GI Bill, selecting those whoknow of the GI Bill and who have not had counseling.
27

67.1 87.2 87.3 66.1 66.2 66.3 69.1 69.2 69.3Trimester
EE Ncrie M GED. H S. DipIay
SAssciate Degree Bachelor's Degree M Ister's/Doftorate
Figure 7. Recruit educational aspirations, for all NPS recruitscombined.
28

Items For Which Prediction May Be Possible
Two types of NRS item are included in this category:certain demographic items and certain enlistment process items.Survey results are graphed in Figures 8 through 15:
Enlistment process items:Fig. 8: First contact with Army recruiterFig. 9: Circumstances of first contactFig. 10: Mean age at time of DEP contractFig. 11: Mean number of days in DEP
Demographic items:Fig. 12: Gender composition of recruit populationFig. 13: Ethnic composition of recruit populationFig. 14: Percent from each geographic regionFig. 15: Percent from each home town type
The predictions described below were performed as simpleregressions: the prediction of full-year responses from summertrimester data. Only the 1987-88 NRS data were used for thesepredictions because full-year data for 1989 are not yetavailable. The prediction equations should certainly beestimated again with 1987-89 data if possible. In a fewinstances, responses were constant and estimates are presented asconstant values. In those cases, data from summer and fall 1989trimesters were also used in the estimation.
It is sometimes preferable not to use simple regressions toanalyze percentages. Many of the estimation equations presentedhere do relate to percentages. The decision was made to useregressions for these analyses for two reasons. First, thepredictions are for the "natural" percentage variable and,second, for the percentages being analyzed (not too close to 0%or 100%), regressions will give good answers.
The effect of survey sampling error is largely ignored inthese estimates. The equations assume, for instance, thatapproximately the same number of recruits will be surveyed eachtrimester in order for the variables to be predicted asaccurately as the stated standard errors suggest. If the numberof respondents decreases, then the survey sampling error maydominate the error from the regression equation.
All of the following equations predict responses to NRSitems for enlistees within single reception battalions. Twomethodological reasons led us to structure the predictions inthis way. First, we had full-year data only for two year, 1987and 1988. All prediction equations require multiple data pointsfor meaningful calculation, so it was necessary to break down theoverall yearly results into smaller pieces in some way. Second,it is likely that enlistees at different reception battalionswill be somewhat similar since reception battalions processdifferent military occupational specialties (MOSs). If that is
29

the case, then reception battalions are "natural" units ofanalysis and using them will improve the quality of theprediction.
We could also have used the enlistees' MOS as a "natural"unit of analysis for these predictions, but did not do so becauseof one practical consideration. When estimating the full-yearresponse to a NRS item for all recruits combined, it is necessaryto compute the estimates for each reception battalions separatelyand then average those estimates. The averages need to becomputed as weighted means, with the number of recruits beingprocessed at each reception battalion being the weighting factor.If we use MOS as the unit of analysis, there are far more unitsthat need to be averaged when computing the full-year, totalsample estimates. A moderate amount of work is involved incomputing those averages when eight reception battalions areinvolved, but that amount of work becomes inordinate when MOSsare considered as the unit of analysis.
It might be worth comparing the quality of prediction whenthe equations are based on reception battalions compared to MOSs.The computer programming needed for this comparison are outsideof the time constraints of this project. If the Army implementssummer-only surveying in the future, however, then thatcomparison should certainly be performed.
First contact. The first contact variable is quite "well-behaved", and patterns detected by Hay (1990) continued into1989. The percent of recruits whose first contact was initiatedby the recruiter decreases from summer accession to fall tospring, and the opposite pattern exists for enlistee contacts(greatest for winter accessions). Referrals from other servicesor the Army Reserve/National Guard are nearly constant acrosstime and affect very few recruits. A pattern also exists forthose whose first contact was with a friend. While economic,social and political conditions are constant and the number anddirectives of Army recruiters remain unchanged, full-yearresponses to this variable can be predicted from a singletrimester's data.
Estimation of the percent of full-year responses to eachoption of the first contact variable is estimated from the summertrimester data by:
First contact through Army Reserve or National Guard:AR/NG = 1.9
First Contact with a friend meeting the recruiter:Friend = 8.4 + (0.286 * TFriend)Std. Error = 1.0R2 = 0.365
30

621v 62 7 . 2 3 6. 92 6.
7 T / .... ..... ......... .. .... .. ..... . ................
i~ ~ ~ ~~--- ---h~ ....... ------t cntc~~ ~ritrC~iat
LI]O .a Wit .n r .... .h g .... ... . /...N... ...
Figur 8. Frst cntactwith n Arm-recriterfor-al-NP
re ru t combined. ..... ... ..............
31/A

First Contact initiated by a recruiter:Recr = 14.5 + (0.474 * TRecr)Std. Error = 3.8R2 = 0.386
First contact initiated by the enlistee:Enlistee = 27.7 + (0.511 * Tenlistee)Std. Error = 3.9R2 = 0.447
Contact on advice of recruiter for another service:Other = 3.8
These estimates of responses and standard error representpercentages of enlistees within a single reception battalion.Estimates for all new recruits combined must be computed byaveraging the separate full-year estimates for the eightreception battalions. Those estimates should be weighted by thenumber of recruits at each reception battalion.
Circumstances of first contact. Responses to this questionalso are "well-behaved" and the 1987-88 pattern continued into1989. First contacts at the recruiting station were lowest forsummer accessions and greatest for winter accessions; the reversewas true for first contact at school. This pattern should beexpected since recruiting efforts directed at high schoolstudents should result in more accessions right after graduation(first contact at school encourages accession after graduation).Other circumstances of first contact appear fairly constantacross trimesters and years.
The percent of recruits choosing each alternative to this"under what circumstances did you first talk with an Armyrecruiter" question can be estimated from summer trimester datafor each reception battalion by:
Talked by phone:Phone = 21.6 + (0.477 * TPhone)Std. Error = 1.5R2 = 0.570
Talked at a recruiting station:RecrSta = 18.8 + (0.545 * TRecrSta)Std. Error = 2.5R2 = 0.504
Talked at a job fair:JobFair = 0.5
Talked at school:School = 5.7 + (0.525 * TSchool)Std. Error = 1.8R2 = 0.443
32

871 8.20. 6. 62 68 90692 6.
7 5 O ............. ... .... .................. ................................
~ f~ ~ ~ uiin tai~- tJo7Pi
Figre/. Cic.tne of first. rerie contact for.. al -NP--re ru t co..mb.ined.. ... .............
--- ----- ---- -- ---3-

Talked at an Army Reserve unit:ArmyReserve = 1.0
Other:Other = 2.0 + (0.540 * TOther)Std. Error = 0.3R2 = 0.854
Mean age at DEP. The recruit's average age in years at timeof contract follows a pattern of being lowest for summeraccessions (18 to 18.5 years) and greatest for winter accessions(20 to 20.5 years). This pattern should be expected fromrecruiting efforts: most high school graduates (youngerenlistees) would be expected to access during the summer.
Age was averaged separately within each reception battalionfor this prediction, so the equation applies to each receptionbattalion separately. An estimate of the full-year mean age attime of contract, for all recruits combined, can be found as themean of the ages for the eight reception battalions, weighted bynumber of recruits surveyed at each reception battalion.
The mean age in years for enlistees (Age) for the full yearis predicted from single-trimester data (AgeT) at each receptionbattalion by:
Age = 15.5 + (0.199 * TAge),
with an error of estimate of approximately 0.27 years (R2=0.085).
Mean number of days in DEP. The mean number of days arecruit spends in the DEP follows a pattern that should beexpected from recruiting efforts: The highest number of days isfor those who accessed during the summer trimester. Presumably,those enlistees signed a contract during high school and requiredtime to graduate before enlistment. Only five trimesters' dataexist for this variable, so no prediction should be made at thistime. If the pattern seen is replicated in the future, then itwould be reasonable to create an equation to predict full-yeardata from single-trimester data. Such an equation should beaccurate to about +/- 40 days or better, if conditions remainunchanged.
Gender composition. This demographic variable is quite"well-behaved", with the percent of women enlisting beinggreatest in the fall trimester and least in the summer. Thelarge standard error of this prediction equation, however,suggests that its use may not as practical as the assumption thatannual recruit populations have a nearly constant composition of88.9% male. As in other estimation equations, this one predictsfull-year survey responses within reception battalions. Tocompute the full-year overall estimate, the eight averages fordifferent reception battalions must be computed and then averaged(sample-size weighted average).
34
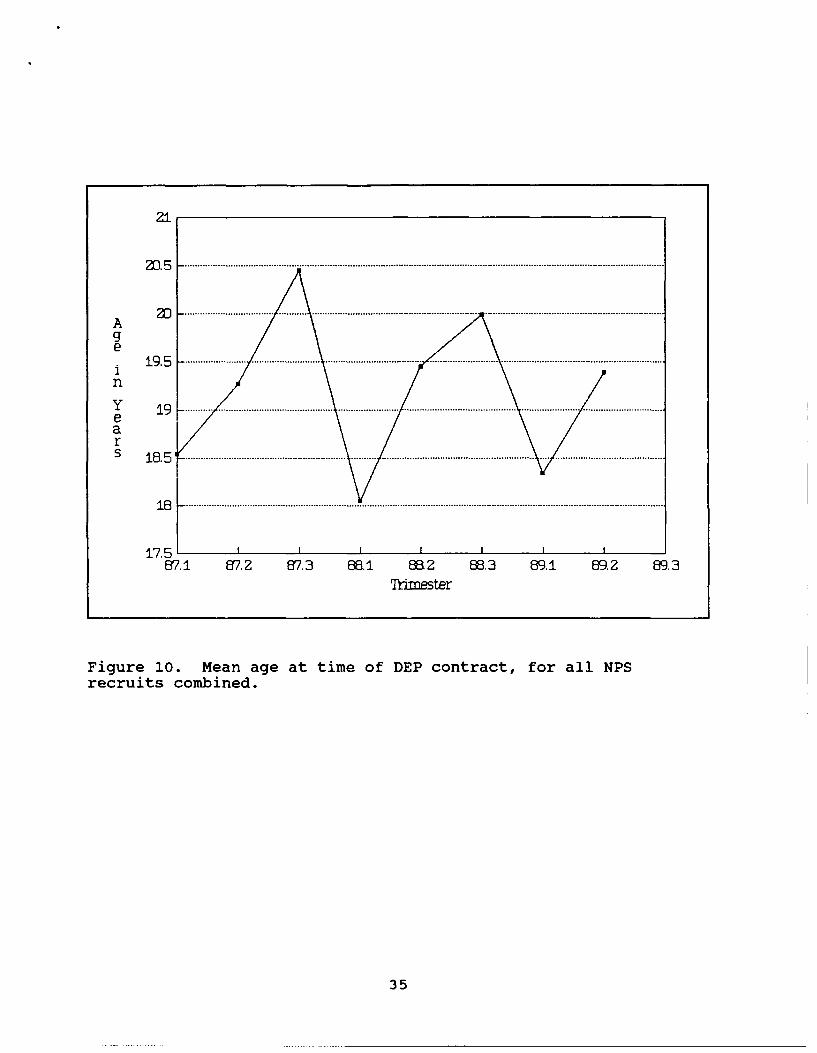
21
2
1 9 5 .............1............. ................ .. ............. ................................n
y 9 ....... ....................... . ..........19 -.................... ........... ...............ear
S 1.5-L................................................................................. .... .............................
18 ................................................................................................................
871 87.2 873 61 BR 2 883 81 892 89.3Trimester
Figure 10. Mean age at time of DEP contract, for all NPSrecruits com!bined.
35

30
DEp 3 ... ............... ... ... ......... ... ......... ........................ ....... ..... ....... .T1
n
DD i m ............................ ............... ................. .... . ..
S
97A 672 87.3 88A 8.2 EE3 69A 89.2 89.3Thrreter
1987 Tinne m DEP dta are riot available
Figure 11. Mean number of days in the DEP, for all NPS recruitscombined.
36

I~af%
-L. L 7. I7. 661 662.3 8.1 6,2 6
.... ......... .... .... .... ................
~ t~e ~Feixal
Fiur 12 ... ... ... iin for.. all.. NPS.. rerut combined.............
...........3...7............
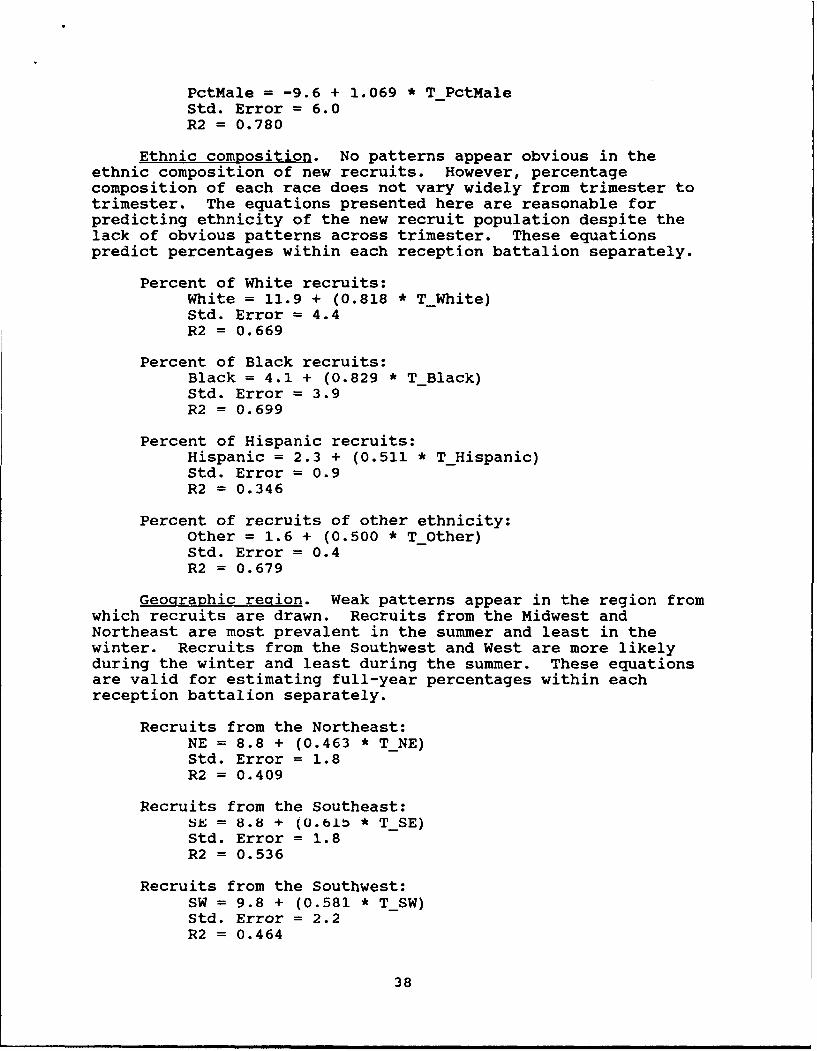
PctMale = -9.6 + 1.069 * TPctMaleStd. Error = 6.0R2 = 0.780
Ethnic composition. No patterns appear obvious in theethnic composition of new recruits. However, percentagecomposition of each race does not vary widely from trimester totrimester. The equations presented here are reasonable forpredicting ethnicity of the new recruit population despite thelack of obvious patterns across trimester. These equationspredict percentages within each reception battalion separately.
Percent of White recruits:White = 11.9 + (0.818 * TWhite)Std. Error = 4.4R2 = 0.669
Percent of Black recruits:Black = 4.1 + (0.829 * T_Black)Std. Error = 3.9R2 = 0.699
Percent of Hispanic recruits:Hispanic = 2.3 + (0.511 * THispanic)Std. Error = 0.9R2 = 0.346
Percent of recruits of other ethnicity:Other = 1.6 + (0.500 * TOther)Std. Error = 0.4R2 = 0.679
Geographic reqion. Weak patterns appear in the region fromwhich recruits are drawn. Recruits from the Midwest andNortheast are most prevalent in the summer and least in thewinter. Recruits from the Southwest and West are more likelyduring the winter and least during the summer. These equationsare valid for estimating full-year percentages within eachreception battalion separately.
Recruits from the Northeast:NE = 8.8 + (0.463 * TNE)Std. Error = 1.8R2 = 0.409
Recruits from the Southeast:SE = 8.8 + (0.61b * TSE)Std. Error = 1.8R2 = 0.536
Recruits from the Southwest:SW = 9.8 + (0.581 * TSW)Std. Error = 2.2R2 = 0.464
38

871 872 EA38. 62 E3 6. 92 8.
Thiie-ster
Ml Vlte ED Black 03 I1flsMic M CtbEr
Figure 13. Percent ethnic composition, for all NPS recruitscombined.
39

I I
87.1 87.2 97.3 66.1 8.2 ffi3 89.1 69.2 69. 3Trimester
SNorthffst M southwest EE Infdst -%es saith
Figure 14. Percent from each geographic region, for all NPSrecruits combined.
40

Recruits from the Midwest:Midw = 4.7 + (0.704 * TMidw)Std. Error = 2.2R2 = 0.753
Recruits from the West:West = 6.7 + (0.679 * TWest)Std. Error = 1.8R2 = 0.537
Home town type. Patterns are visible in the percent ofrecruits from different types of home town. Recruits from largecities are more prevalent during the winter trimester and lesslikely during the summer. Recruits from rural or farm areas showthe opposite pattern (most likely during the summer). Thepattern seen here may be tied to the pattern seen in geographicregion: Midwest, Northeast, and large city recruits are morelikely to access during the winter trimester while recruits fromthe Southwest, West and Rural/farm areas are more likely toaccess during the summer trimester.
Recruits from large cities:City = 10.5 + (0.533 * TCity)Std. Error = 2.1R2 = 0.416
Recruits from medium-sized cities:Med.City = 12.9 + (0.288 * TMed.City)Std. Error = 1.7R2 = 0.128
Recruits from suburban areas:Suburb = 13.2 + (0.167 * TSuburb)Std. Error = 0.8R2 = 0.148
Recruits from small towns:Town = 13.6 + (0.437*TTown)Std. Error = 1.7R2 = 0.312
Recruits from rural areas:Rural = 10.5 + (0.455 * TRural)Std. Error = 2.0R2 = 0.501
As is the case with the estimation of full-year values forother variables, the estimation equations for geographical regionare valid within reception battalions. Full-year estimates forall recruits combined are found as the weighted average of theeight separate estimates for the reception battalions.
41

. . 4I
LN4 -. .
637. 1 67.2 67.3 66.1 66.2 EB 3 69.1 e9.2 69.3Thrmster
E2 R~1a/Ftrm Area - Town E SAub
m Ie~iumx City Large City
Figure 15. Percent from each hometown type, for all NPS recruitscombined.
42

Items For Which Seasonality Effects Are Unimportant
Enlistment reason items and scales. Hay (1990) foundstatistically significant patterns in recruit responses to theseitems across trimester, but concluded that the magnitude of thosepatterns was so small that the patterns were unimportant. Weagree with her conclusion, and offer an additional reason for thesame conclusion: the order of importance of the enlistmentreasons almost never changes from trimester to trimester.Enlistment for self-improvement is always the most importantreason, followed by the opportunity to gain money for education.Equal opportunity for women is always the least importantenlistment reason (even for women). Figures 16 and 17 displaythe mean response to these questions. We rank the importance ofthe different enlistment reasons as:
1. Self-improvement2. Money for education3. Physical training4. Benefits
Be soldier6. Leadership training7. Chance for high-tech work8. Gain job skills
Opportunity for travel10. Equal opportunity for women
Further research into enlistment reasons. It is importantto know as much as possible about the enlistment reasons of high-AFQT enlistees. For that reason, we examined trends inenlistment reasons across trimester and across AFQT category.
The enlistment reason scales were scored from l=Not at allimportant to 4=Would not have enlisted without this, a rathercondensed measurement scale. The scale is seen to be evenfurther condensed if (as seems likely) very few items will berated as 4's, and not too many will be rated as l's. As aresult, much of the differentiation between recruits will takeplace at scores between 2 and 3. A numerically small differencecould have a large practical impact, but it is hard to determinethat impact unequivocally.
There was no consistent pattern across AFQT levels for theimportance of Benefits, Travel, Morny for education, Leadershiptraining, or Physical training. There is, however, a gradualdecrease in importance of the other enlistment reasons as AFQTscores increase. There was a slight decrease (perhaps 0.10) inthe importance of self-improvement and a clear decrease (0.30 to0.40) in both the Importance of being a scldier and in Workingwith high-tech equipment. A large decrease in importance (0.40,possibly more) was seen in Gaining job skills and Equalopportunity for women as AFQT scores increased.
43

e
n
Sc
e
S
re
EP.1. 872 87.3 881 882 883 89.1 89.2 89.3Thnxester
Self -1n:,r.-- Berjetits -*-Be Soldier -s Job SkillsX Ravel Educ. Mdir~y -b-Wmaer s Oppor.
1=Not at all imprtant4--Wuchd' enhst except for this
Figure 16. Enlistment reason scales, for all NPS recruitscombined.
44

an
It
C
r
87.1 872 6.3 881 88. 883 89.1 892 89.3Ihmster
-*- fgh-eb. WorkC
1=Not at afl Lnportant4=-Wouldr t enflst exce-pt for this
Figure 17. Enlistment reason items, for all NPS recruitscombined.
45

It appears that high-AFQT recruits give the same importanceto a number of enlistment reasons as lower-AFQT recruits, butless importance to gaining job skills, working with high-techequipment, being a soldier, or equal opportunity for women.High-AFQT soldiers apparently come for self-improvement andeducation money and don't expect to receive useful job training.Benefits, leadership training and physical training arereasonably important for all recruits, and the opportunity fortravel is somewhat less important (see Figure 17).
It was striking that equal opportunity for women was such alow-importance reason for recruitment. It was necessary todetermine how women and men rated this reason separately in orderto judge whether the low importance was a result of the fact thatsome 90% of all recruits are men (who would not be expected tocare about equal opportunity for women). To our surprise, equalopportunity for women was also the least important enlistmentreason for women.
Effect of loss of recruitment incentives. Three loss-of-incentive items were written for the MOS (effect if this MOS didnot offer the incentive) and for all services (effect if noservice offered the incentive). Removing cash bonuses had theleast effect on likelihood of enlisting, and deleting theKicker/ACF benefit had the greatest effect. Not offering thetwo-year option was almost as important as the Kicker/ACF benefit(see Figures 18 and 19). The effect on recruiting was moresevere (would not enlist at all) if no service offered thebenefit, as would be expected.
Conclusions
We have computed a set of prediction equations to allowestimation of certain NRS variables from summer trimester data.Those equations give fairly good estimations, but it must beremembered that if the social, economic or political environmentwithin the United States changes substantially, then theseequations may be rendered obsolete.
Other NRS variables could be predicted when conditions aremore stable. Equations to predict full-year data from single-trimester data will need to be computed at that time. It ispossible that the effect of the Persian Gulf war upon enlistmentmotivation could be estimated by comparing current data withtransitional (the Gulf war) data and with future (stable) data.Such a future research project would not involve unusualstatistical tools but would generalize only to conditions similarto the Persian Gulf war.
Thus the greatest obstacle to predicting full-year NRSresponses from single-trimester data is our changing economic,social, political and recruiting environment. The effects ofthese changes were visible even in the 1987-89 data analyzedhere, well before the Persian Gulf war. We can estimate full-
46

a
C0r
e I ..................... ................. ... ....................... ..........
87. 1 87.2 87.3 88.1 88.2 6a83 89.1 892 e9.3Thineter
No Eevice: locker --- No Smv~ 2-Yr.Optlm-- No mv Cah Bmntz
Itarrs wre scre from :1 to 4 but werereaodea I-to-S to rmtch I'MM" scores:5="Not ernbsted at all1'
Figure 18. Effects of loss of recruitment incentives on thosereceiving the incentive, if no Service offered the incentive.
47

n
0r
2 . . .. .. .. . . .. . . .. . . .. . . . . . .. .. .. . . .. .. .. . ... . .. . . .. . .. .. . . .. .. .. . . .. . . .. .. . . .. . ..
871 872 87.3 88L1 88.2 883 891 89.2 89.3Thn~eter
-No Eermce, Kicker --4 No Sev 2-Yr. Optaon--*- No Eer Cash Biz
itm e scored fiam I to 4 but werereode I-to-S to mtch "1-LrS' scores:5="Not enlisted at all'.
Figure 19. Effect of loss of recruit -nt incentives on those whoreceived the incentive, if the MbOS di, not offer the incentive.
48

year responses from single-trimester data, but only whenconditions are stable. Under our current conditions, even three-trimester data may be inadequate to fully measure new recruitcharacteristics such as AFQT category.
Some variables may not need predicting--their relationshipsare nearly constant across time. Enlistment reasons fall in thiscategory, although their relative importance might be expected tochange with, for instance, the Persian Gulf war. High-AFQTrecruits are similar to other recruits in their enlistmentreasons, except that they give less importance to gaining jobskills, working with high-tech equipment, being a soldier, orequal opportunity for women. The most important enlistmentreasons from 1987-1989 were self-improvement and gaining moneyfor education.
A General Model of Prospect and Recruit Survey Sampling
As discussed in our section on the recruiting process, afterrecruiter contact, the recruitment management flow begins with aninitial appointment at the recruiting station, moves to theapplication stage at a recruiting station, then proceeds to thecontract stage at MEPS and ends with accession at the receptionbattalions.
Survey Methods
Data can be collected at each of these stages usingdifferent methodologies: group administered; telephone; mailsurveys; and computer assisted surveys. Moreover, for each ofthese data collection methodologies at each stage of therecruitment flow, it is possible to evaluate their applicability,preferability, and practicability.
As Table 1 suggests, certain data collection methods willnot be applicable, preferable or practicable at variousrecruitment sampling points. Moreover, certain data collectionmethods, while applicable, may not be either preferable orpractical.
Appointments and Applications
Turning to the first two sampling points in the recruitmentprocess--initial appointments and applications--the realities ofthe recruitment process preclude the administration of group datacollection methods; hence the "no" cell entries in Table 1. Allthree of the other methods are theoretically applicable. Whiletelephone and mail surveys would be possible at these first twostages, computer-assisted surveys would be preferable because theresponse rate will be higher when respondents are immediatelyavailable. Respondents typically find it more difficult torefuse a face-to-face request to complete the survey.
49

TABLE ISelection of Survey Administration Methods
Recruiting AdministrationProcess Method Applicable Preferable Practical
I Group No NA NAjAppointment Computer I Yes Yes No
Telephone Yes Possibly YesMail Yes Possibly Yes
IIII Group No NA NAlApplication Computer Yes Yes No
Telephone Yes Possibly YesMail Yes Possibly Yes
Group Yes Yes YesIContract Computer Yes Yes I
Telephone Yes Yes* YesMail Yes Yes* Yes
Group Yes Yes YesAccession Computer Yes Yes ?
Telephone No NA NAMail No NA NA
* These methods are preferred for those who do not contract (i.e.,PQs & QNEs). Group and computer methods are preferred for thosewho do contract.
NA - Not applicable ? - Based on computer availability
50

While computer-assisted surveys would be theoreticallypreferable to mail or telephone surveys, the realities of therecruitment process at the initial appointment and applicationstages make such a method impractical. Specifically, recruiterswould be hard-pressed, given the stressfulness of their workload,to administer surveys to samples of potential recruits.Furthermore, attempts to collect additional data at these pointscould have adverse consequences for the success of therecruitment process. By contrast, both telephone and mailsurveys are practical--neither would add to the burden of therecruiters, nor would they jeopardize the likelihood of recruitsproceeding to the next stages of the recruitment process.Therefore, our sampling models for the initial appointment andapplication stages include only mail or telephone data collectionmethods. (It should be noted, however, that the spreadsheet willallow for the estimation of costs and errors associated withcomputer-assisted surveys at these stages.)
Contracts
For the contract stage of the recruitment process, theanalysis becomes more complex. First, all four data collectionmethodologies are theoretically applicable at the contract stage.Furthermore, it is desirable to distinguish among surveys ofpartially qualified respondents, qualified but not enlistedrespondents, and those who actually sign contracts at the MEPS.With these distinctions in mind, the preferability of datacollection methods can be assessed. For example, among those whodo sign contracts, it is preferable to use either groupadministered or computer-assisted surveys for several reasons.First, the convenience and availability of new recruits in onelocation would in principle facilitate data collection by eithermethod. Second, there is a great deal of variability in the timebetween contract and accession, and the use of either telephoneor mail surveys would result in sampling bias against those witha short time until accession.
Among those who qualify but do not sign a contract, however,the preferable data collection methods will be different. Sincerecruiting personnel are trying to convince potential recruits tosign contracts throughout their visit to the MEPS, attempting toadminister a survey to them at the MEPS is administratively notfeasible. It would therefore be preferable to contact themlater, by mail or by telephone.
In terms of practicability, only computer-assisted surveyspose a potential problem. The availability of sufficientcomputers and their use for Army surveys at the MEPS isproblematic. As a result, the group administered option may bemore practical at this point in time, although telephone and mailsurveys can be done. The advantage of group administered--relative to telephone or mail--surveys in this context hasalready been described.
51

Accessions
At the accession point, only group or computer-administereddata collection methodologies would be applicable. Neithertelephone nor mail surveys would be applicable because of thenature of the accession process, these methodologies would bebetter suited to following respondents post accession. As aresult, either group administered or computer-assisted surveyswould be preferable at the accession sampling point. Group-administered surveys would be more practicable, particularly inthe absence of sufficient computers. These data collectionmethodologies must be considered in terms of different samplingpoints and by weighing costs and benefits. The next sectionaddresses these issues.
Costs and Benefits
The previous analysis has narrowed our focus to the use oftelephone and mail surveys at the first two sampling points;group administered (for those who contract) and telephone or mailsurveys (for those who are partially qualified and who choose notto contract) at the contract stage; and group administeredsurveys at the accession point. As a consequence, our discussionof the general model of the recruitment process will onlyconsider the costs, errors, and benefits of these combinations ofsampling points and data collection methods for prospect andrecruit sample surveys. We will hereafter refer to thesecombinations as "viable sampling strategies."
First, it is important to consider the costs and non-sampling errors associated with each viable sampling strategy.For each strategy, there are several categories of costs that wehave incorporated into the spreadsheet: survey projectmanagement; survey creation; survey publication; surveyadministration; and data capture. Each of these cost categoriescan be broken down further. Survey management, for example,includes: selection of survey sampling plan; soliciting bids forall or part of the survey project; awarding contract(s) for theproject; ongoing project management; other project managementexpenses; data analysis; and project report. Survey creationincludes: instrument design; pilot testing of the survey; andsurvey revision. Survey publication includes: creating physicalcopies of the survey or the cost of creating computerized copies.Survey administration includes: sending the survey toadministrators; administering the survey; shipping it back to thesurvey manager. Finally, data capture includes: data entry,codebook creation, and data transport.
With these cost categories in mind, let us consider thebasic costs associated with telephone and mail surveys at theinitial appointment and application stages. When comparing costeffectiveness of telephone versus mail surveys, only twocategories of cost are particularly relevant. First, as samplesize increases, the survey administration costs of telephone
52

interviews will increase rapidly if there is a need to have moreCATI stations, supervisors, and trained interviewers. These areexpensive items. Second, however, the data capture costs forCATI interviews are much smaller than those for mailquestionnaires, which must be coded and entered into thecomputer. A CATI system, however, provides for immediate andcheap data capture when the interviewing takes place. Thesecompeting cost considerations are explicitly taken intoconsideration by our spreadsheet prototype, described in thisreport. The more cost effective method can be determined byapplying the model incorporated in this prototype.
With regard to costs associated with viable samplingstrategies at the contract stage, let us first consider those whobecome new recruits. First, it should be noted that the use ofcomputer-assisted data collection at the MEPS is predicated onthe availability of sufficient computers to handle the largesamples ordinarily employed by USAREC. If a large capitalinvestment is required, then the costs of this method of datacollection would be prohibitive. Assuming availability, the datacapture costs and survey administration costs of this methodwould be far less than the group-administered option.
Second, considering those who qualify but decide not toenlist as well as those who are partially qualified, we haverecommended the use of mail or telephone data collectionmethodologies. The cost considerations are therefore identicalas those described above for the initial appointment andapplication stages. For these individuals and for those whodecide to contract, the most cost effective method can bedetermined by applying the model incorporated into the prototypespreadsheet.
As with the contract stage, cost assessments for theaccession stage must begin with a caveat about the availabilityof computers at the reception battalions in order to employcomputer-assisted data collection. Assuming availability of theappropriate hardware (and software), under most circumstancesthis method would be more cost effective for the reasons we havealready discussed. Again, cost estimates can be generated by thespreadsheet prototype.
In addition to cost considerations, both sampling and non-sampling errors are important to include in any assessment ofviable sampling strategies at each stage of the recruitmentprocess. Sampling errors are quantitative and can easily beincorporated into the model implemented in our spreadsheet. Non-sampling errors, however, are qualitative and although they areimportant, are extremely difficult to model and therefore notincorporated in the spreadsheet. Non-sampling errors such asresponse bias, ease of contact, data entry errorb, mobility ofthe population of interest, all have a bearing on the viabilityof a particular sampling strategy for a particular samplingpoint.
53

Benefits by Sampling Point
In this brief section we will focus explicitly on thebenefits for valid scientific inferences provided by collectingdata at each of the four potential sampling points. In allcases, the purpose of the survey is the key element. The typesof inferences desired and the definition of the population ofprospects determines which point in the recruitment process isoptimal.
Collecting data at the initial appointment stage providesseveral potential benefits. First, surveying the pre-commitmentpopulation provides better assessments of the effectiveness ofadvertising and marketing strategies than later sampling points.As prospects progress to each successive stage of the recruitmentprocess, a variety of social and psychological factors conspireto create distortions in the accuracy of self-reports about thenature of pre-commitment decision-making. Furthermore, at eachsuccessive stage in the recruitment process, the population issystematically narrowed. The population of prospects is closestto the target population, but it shrinks at the applicationstage, shrinks further by the contract stage, and yet further bythe accession stage. The result is that vital information aboutthe pre-commitment information environment is even more distortedby the self-selection inherent in this process. In other words,the control group is slowly disappearing.
Second, collecting data at initial appointments wouldprovide an important baseline to compare those who eventuallyaccess with those who drop out along the way. Only by collectingsuch data can systematic improvements in marketing andadvertising strategy be made. In general, the principle ofsampling directly from the population affected by an interventionshould be followed as much as is practical. For example, themost appropriate sampling population for evaluations of marketingand advertising effectiveness is the population of eligibleyouth.
Collecting data at the application stage involves winnowingthe prospect population. Those who were not serious aboutpotentially joining the Army are unlikely to proceed beyond theinitial appointment. However, those who seek additionalinformation about careers and benefits--who proceed to theapplication stage--may better reflect the population of interestto the Army Recruitment Command. Thus a potential benefit ofsampling at this stage is that a target popula ion ripe forpersuasion has been identified. This provides a better base foranalyzing the recruitment process per se, although it is not ashelpful as the initial appointment stage would be in assessingthe effectiveness of marketing and advertising strategies.
Collecting data at the contract stage has a potentiallyimportant role in evaluating why some prospects decide to opt outof the recruitment process and why others decide to proceed. If-
54

-as we recommend--mail or telephone surveys of the partiallyqualified or qualified but not enlisted are conducted, it wouldbe possible to gain incisive information about those variablesthat contribute to an understanding of the role of therecruitment process per se. In addition, it would contribute toan understanding of the role of those preexisting demographic andpsychographic factors which may predispose the partiallyqualified or qualified but not enlisted to exit the recruitmentprocess.
Another benefit of sampling at the contract stage is that itwould allow researchers to evaluate the differences between therecruits who access and those who do not. This comparison may beeven more valuable than that between those who contract and thosewho do not. The population of interest at this stage is evenmore narrowly focused on post-decision pre-action prospects whoappear to be headed toward accession. As such, the roughly 15%who contract but do not access may be the subject of intensiveinquiry for purposes of improving the efficiency of therecruitment process. Because prospects who have gone this far inthe process are more likely to go further than those who havemerely met an initial appointment, funds spent at this stage mayhave a far greater impact on the overall success of the processthan similar funds expended earlier in the process.
Finally, continuing to collect data at the accession stagehas obvious benefits. First, it allows continued comparisons fortime series analysis with the NRS data base already collected byUSAREC. Second, it can continue to serve as a baseline forevaluating the effectiveness of Army policies which apply to newrecruits. Recruits who access can then be studied as cohortsthroughout their Army career, particularly if panel designs areadopted. Third, data collected at this point can providecritical comparisons with data collected at earlier stages of therecruitment process aimed at assessing marketing and advertisingstrategies, as well as evaluating specific characteristics of therecruitment process.
AssessinQ Tradeolfs between Costs and Errors:A Methodological Note
A critical factor in assessing the optimal tradeoff betweencosts and errors for the design of surveys concerns identifyingthe size of a practical difference for changes in surveyresponses. Because of the large potential size of the sample forprospect and new recruit surveys, very small differences inresponses can be detected. Given this fact, the criterion ofstatistical significance can lose its importance as a reliableindicator of meaningful differences.
Therefore, we suggest that other strategies must be employedfor the determination of a criterion of practical significance.For example, two such strategies were identified in semi-structured interviews that we conducted with Army recruiting
55

experts (the protocol is included in Appendix A). One criterionis to determine the amount of change in responses needed in orderto change the rank order of response alternatives, then setsampling error to just below that amount. Another strategy is todetermine the amount of change in responses needed to achieve afinancial breakeven point for the enlistment incentive orrecruiting practice being assessed by the survey. Otherstrategies are undoubtedly possible and can be identified byadditional study of the objectives and strategies of decisionmakers.
A complete study of these alternative approaches todetermining the size of a practical difference in surveyresponses is beyond the scope of this project. However, thisissue can be further pursued in one of two ways. One approach tothis issue is to havE decision makers scale alternative decisionsituations. Two example situations are described in Appendix B.A second approach is to study decision makers' use of theprototype survey spreadsheet in making their evaluation of thetradeoffs between costs and errors.
Overview of Potential Sampling Strategies
To further develop our recommendations for sampling models,in this section we provide an overview of sampling str.tegiesavailable for each of the four stages of the recruiting process.Researchers could select one of five basic models: simple randomsampling (SRS), stratified proportional (SP), stratifieddisproportional (SD), cluster (C) or stratified cluster (SC).Each of these models and their advantages and disadvantages isdefined and discussed in basic texts on survey research andsampling (Benedict, 1987; Benedict, 1988). Here we will provideonly an overview of these sampling models.
Random Sampling
In an SRS, each element--and all combinations of elements--in the population have an equal probability of being included inthe sample. Ordinary inferential statistics as presented inintroductory statistics textbooks assume that the data analyzedwere generated by an SRS. We have found very few examples of theuse of SRS in military surveys or in surveys commissioned by themilitary (Sullivan, Borgida, and Carter, 1988). With theincreasing use of CATI systems, however, and the development andfeasibility of random digit dialing (RDD) methods, it becomesincreasingly plausible for the military to do random sampletelephone surveys.
In systematic random sampling, the size of the population isdivided by the desired sample size to obtain a skip interval, k.Then a random digit is selected between 1 and k as the startingpoint. This random digit is the first case selected, and thenevery k-th subsequent individual is selected for the sample.
56

Stratified Sampling
Stratified sampling represents another major samplingstrategy. It involves obtaining random samples from subgroups,or strata, of the population of interest. This approach canincrease sampling efficiency and precision when there issufficient information available to identify and sample thestrata. For example, because Army recruits are predominantlyyouth (e.g., in 1977, over 95% of the recruits were younger than25), subgrouping and sampling the population based upon age is amore efficient sampling strategy than randomly sampling thepopulation as a whole. Effective stratified sampling proceduresrequire dividing the population in some meaningful way (e.g., byage for Army recruiting) and having the required information tosample individuals within each strata. There are two generalapproaches to stratified sampling: proportional anddisproportional.
In proportional stratified samples, the number of casesselected within each stratum is proportional to the stratum'ssize. So if one stratum is 25% of the population, then 25% ofthe sample is drawn from that particular stratum. Some militarysamples are proportional stratified samples, done in order toincrease sampling efficiency. Currently, most militaryresearchers sample systematically within strata, with a randomselection of the last two digits of the Social Security numberused to identify the respondents to be surveyed.
In disproportional stratified sampling, the number of casesis not proportional to the size of the stratum in the population.Disproportional stratified sampling is used for several purposesin military surveys. First, it has often been used to studysmall subpopulations, to make comparisons with the rest of thepopulation. So, for example, in studies focused on whether womenofficers differ from other officers and enlisted personnel onsome set of variables, the sampling design will be stratified tooversample women officers because there are so few of them. Inan SRS, unless it was a very large SRS, there would be so fewwomen officers that their results could not reliably be comparedwith those obtained from other subpopulations (the margin oferror would be too large). In studies using disproportionalstratified sampling, the results should be weighted during dataanalysis so that when strata are pooled for an overall analysis,the sample will reflect each stratum's proportion of the totalpopulation.
A second use for disproportional stratified sampling hasbeen to correct for differential response rates across strata.For example, for many of the Defense Manpower Data Center (DMDC)surveys which cover all four service branches, sampling isdisproportionally stratified by branch because response rates inthe Air Force are generally higher than in the Army. An SRSwould, in the final analysis, underrepresent the Army in crossbranch surveys, and would underrepresent enlisted personnel in
57

surveys done within a particular branch. In these instances,then, disproportional sampling is used to compensate for unequalpropensities to respond to surveys, with the target being a setof completed questionnaires that reflect each stratumproportionately.
Cluster Samplina
Cluster samples represent another major strategy forsampling large populations. Similar to stratification, itinvolves dividing the large population into sub-groups, calledclusters. In contrast to stratification, the sub-groupingstrategy is based upon geographical convenience rather than thesubstantive variables used for stratifying populations. Clustersampling is not as efficient or precise with respect to samplingerror as is stratified sampling. However, it is an efficient,practical approach when insufficient information exists forstratified sampling and when natural sub-groups are available(e.g., MEPS or reception battalions).
In cluster sampling, the population is divided into adjacentclusters of units, and a random sample of clusters is taken.Researchers then choose some proportion of the elements in eachrandomly selected cluster. It could include all of therespondents or some specified percentage of them. The selectionof units within clusters can be done in different ways, includingrandomly. The purpose of cluster sampling is usually cost-effectiveness and it is done when the population under study islarge, heterogeneous, and dispersed. Clustering should thereforebe done so as to maximize heterogeneity within clusters. Eachcluster should ideally be as heterogeneous as the population, torepresent its diversity. Cluster samples are generally lessefficient than SRS in terms of sampling error. To the extentthat the heterogeneity assumption is violated, this loss ofefficiency is increased.
Cluster sampling can be combined with stratified samplingwhen referring to the process of selecting subgroups withinclusters. Cluster sampling is most common among military studiesof the general population, reservists, veterans, or youthstudies. Research that involves telephone interviewing does notrequire cluster sampling. Cluster sampling is ordinarily usedwhen face-to-face interviewing among dispersed populations is anecessity, and it will be increasingly rare. Most military andcivilian personnel are already clustered together in commonlocations, rather than spread out as is the general population.
In the next section of this report we discuss how thesedifferent sampling strategies may be utilized at the differentstages of the recruitment process.
58

Selecting Sampling Strategies by Recruitment Stage
Examining first the initial appointments and applicationstages of the recruitment process, for which we have recommendeddata collection by mail or telephone, it is likely that an SRSwould be preferable because conventional formulae for calculatingstandard errors assume SRS (although correction formulae areavailable in several texts for non-SRS samples). The prototypefor our spreadsheet model, at this stage, assumes SRS. Assumingthat a list of the population is available with name, address,and phone number, it would be a simple matter to merely selecteither a pure SRS or a systematic random sample with a skipinterval designed to produce the required sample size.
We can identify no obvious reason to select a stratifiedsampling method, unless the purpose of the survey requiresresearchers to study a subgroup that makes up a small proportionof the total population. For example, if a smaller percentage ofsome targeted subgroup such as women or AFQT-I are actuallyproceeding from initial appointment to application, researchersmay wish to oversample these subgroups to identify the predictorof success for individuals in each subgroup. In this case, anSRS model would not apply and a disproportionate stratifiedsampling model would be required. If this sampling model isadopted, the formulae for estimating standard errors would haveto be adjusted.
If telephone or mail surveys are utilized, we can identifyno particular need for proportionate stratified or any form ofcluster sampling models.
Examining next the contract stage of the recruitmentprocess, we have recommended the use of group or computer-assisted administration methods (at the MEPS) for new recruits,and the use of telephone or mail for those who are partiallyqualified and qualified but not enlisted. The recruitment flowat the MEPS in large part dictates that individuals be testedwithin groups. As a result, when studying new recruits, SRS andstratified sampling models are less feasible; they would requirethe presence of both a full time administrator to randomly drawsubjects for surveys and some way of building into the system thepossibility of an individual's being selected to complete asurvey. Instead, entire populations will probably be tested enmasse, or some form of cluster sampling might be employed. Ifso, each MEPS should contain as diverse a sample as possible,reflecting the diversity of the population as a whole.
For the partially qualified and those who qualify but do notenlist, SRS would be preferable for the reasons given in ourdiscussion of sampling at the appointment and application stages.
Finally, for the accession stage of the recruitment process,we have recommended the use of group-administered data collection(depending upon availability, computer-assisted data collection
59
also may be a viable strategy). As with data collection at theMEPS, data collection from new recruits at the receptionbattalions is most conducive to group testing. As a result,either using the entire population or some type of clustersampling would be appropriate at this final sampling point.
While a discussion of viable sampling strategies for eachstage of the recruitment process is crucial to understanding thegeneral model we have developed, it is also useful to evaluatedifferent sampling strategies as a function of research goals anddesign considerations. As may be seen in Figure 20, differentresearch design considerations can suggest different decisionrules for the selection of sampling methods. For example, if itis most practical and efficient to survey the entire population,then no sampling method would be required. On the other hand, ifone wishes to use sampling methods to estimate populationparameters, then unless one wishes to analyze responses bymultiple subgroups then one should attempt to use SRS orsystematic random sampling.
Along these lines, as shown in Figure 20, if one wishes toanalyze responses by AFQT, race, and gender simultaneously, thenone would be well-advised to consider the use of disproportionatestratified sampling. This of course assumes that one canrandomly select people within strata. If this is not possible,then one may be forced to randomly select clusters of individualsrelying on either stratified cluster sampling or pure clustersampling. For example, in a study of new recruits, one couldrely on cluster sampling methods if the reception battalions eachcontain sufficient diversity. If this condition is met, then onecould select fewer than eight reception battalions for researchpurposes. A similar arrangement could be applied to sampling atthe MEPS or sampling at the recruitment stations.
60

Design Decision SamplingConsiderations Rules Method
Survey everyone? YesPracticality Conduct census.CostPrecision needed
No
Estimate population values? t NoSurvey purpose Use non-probabilityPrecision needed sampling.Population size
Yes
Analyze responses by subgroups? No(by AFQT, race, sex, etc.) C> 1 Use simple or systematic
Survey purpose random sampling.No. & importance
of subgroupsSubgroup homogeneityOrganization, size Yes
of populationAdministrative ease
Can randomly select units at Yeseach level of stratification? Use stratified sampling.(eg, recruits within battalions)
PracticalityAvailability of No
unit listsCost
Can randomly select some units, Yesbut not all, at each level of Use stratified-clusterstratification? sampling.
PracticalityEfficiencyCost
No0> o 'Use cluster sampling.
Figure 20. Decision tree for selecting a sampling design.
61
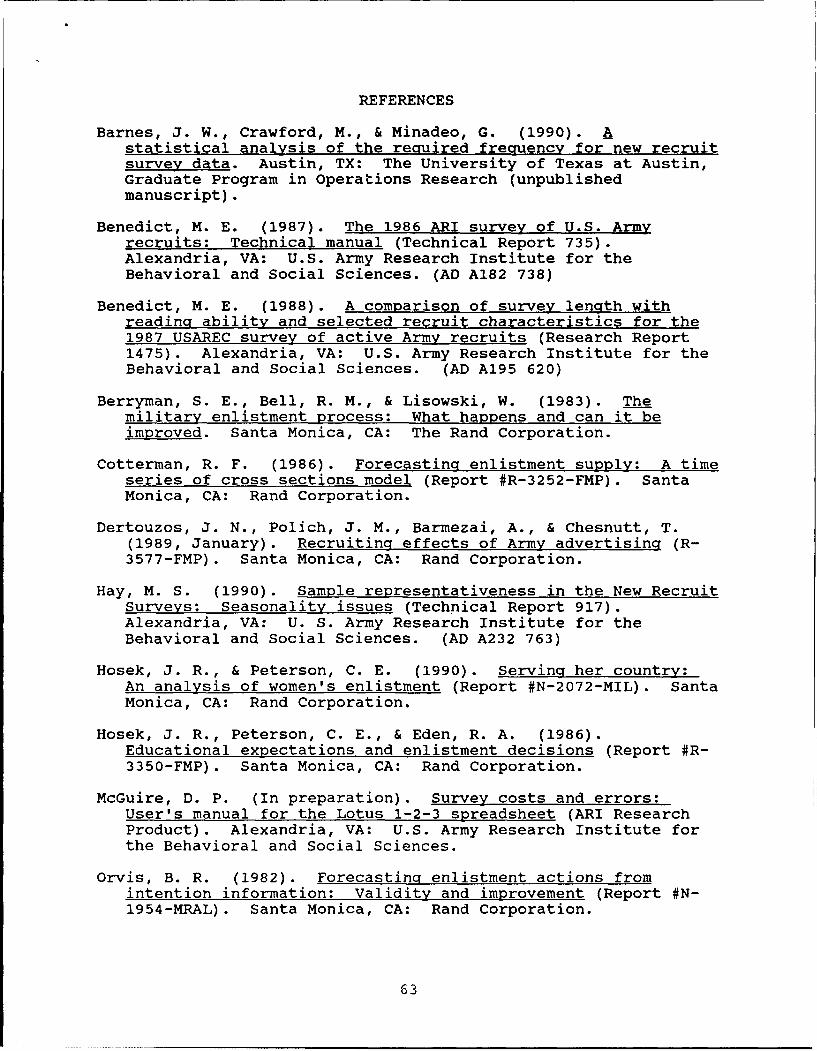
REFERENCES
Barnes, J. W., Crawford, M., & Minadeo, G. (1990).statistical analysis of the recruired frequency for new recruitsurvey data. Austin, TX: The University of Texas at Austin,Graduate Program in Operations Research (unpublishedmanuscript).
Benedict, M. E. (1987). The 1986 ARI survey of U.S. Armyrecruits: Technical manual (Technical Report 735).Alexandria, VA: U.S. Army Research Institute for theBehavioral and Social Sciences. (AD A182 738)
Benedict, M. E. (1988). A comparison of survey length withreading ability and selected recruit characteristics for the1987 USAREC survey of active Army recruits (Research Report1475). Alexandria, VA: U.S. Army Research Institute for theBehavioral and Social Sciences. (AD A195 620)
Berryman, S. E., Bell, R. M., & Lisowski, W. (1983). Themilitary enlistment process: What happens and can it beimproved. Santa Monica, CA: The Rand Corporation.
Cotterman, R. F. (1986). Forecasting enlistment supply: A timeseries of cross sections model (Report #R-3252-FMP). SantaMonica, CA: Rand Corporation.
Dertouzos, J. N., Polich, J. M., Barmezai, A., & Chesnutt, T.(1989, January). Recruiting effects of Army advertising (R-3577-FMP). Santa Monica, CA: Rand Corporation.
Hay, M. S. (1990). Sample representativeness in the New RecruitSurveys: Seasonality issues (Technical Report 917).Alexandria, VA: U. S. Army Research Institute for theBehavioral and Social Sciences. (AD A232 763)
Hosek, J. R., & Peterson, C. E. (1990). Serving her country:An analysis of women's enlistment (Report #N-2072-MIL). SantaMonica, CA: Rand Corporation.
Hosek, J. R., Peterson, C. E., & Eden, R. A. (1986).Educational expectations and enlistment decisions (Report #R-3350-FMP). Santa Monica, CA: Rand Corporation.
McGuire, D. P. (In preparation). Survey costs and errors:User's manual for the Lotus 1-2-3 spreadsheet (ARI ResearchProduct). Alexandria, VA: U.S. Army Research Institute forthe Behavioral and Social Sciences.
Orvis, B. R. (1982). Forecasting enlistment actions fromintention information: Validity and improvement (Report #N-1954-MRAL). Santa Monica, CA: Rand Corporation.
63

Pliske, R. M., Elig, T. W., & Johnson, R. M. (1986). Towards anunderstanding of Army enlistment motivation patterns(Technical Report 702). Alexandria, VA: U.S. Army ResearchInstitute for the Behavioral and Social Sciences. (AD A173 817)
Polich, J. M., Dertouzos, J. N., & Press, S. J. (1986, April).The enlistment bonus experiment (R-3353-FMP). Santa Monica,CA: Rand Corporation.
Polich, J. M., Fernandez, R. L., & Orvis, B. R. (1982,February). Enlistment effects of military educationalbenefits (N-1783-MRAL). Santa Monica, CA: Rand Corporation.
Sullivan, J. L., Borgida, E., & Carter, G. (1988). Assessmentand evaluation of military survey sampling strategies(Technical Report No. 158). San Diego, CA: Navy PersonnelResearch Development Center.
U.S. Army Recruiting Command. (1989, September). Recruiting(USAREC Manual 100-5). Fort Sheridan, IL: Author.
64

APPENDIX A
INTERVIEW PROTOCOL
Project Purpose:
To assist the Army in identifying the costs and errorsassociated with alternative designs of marketing, programevaluation, and sales satisfaction surveys.
Meeting Objective:
To improve survey designs by learning more about how surveyinformation is used in management decision-making.
Method:
A semi-structured interview protocol will be employed toexplore how survey information is used. Viewing USAREC decision-making as a systems process, we will discuss outputs (e.g., thetypes of decisions such as choice of advertising mediums),decision processes, and inputs (i.e., survey information). Thenwe will discuss ways in which survey costs and design expertisecan best be structured in a spreadsheet product to assist USARECpersonnel. These topics are summarized below.
Meeting Topics:
1. Description of decisions affected by survey information.
2. Relative importance between types of information availablefrom the new recruit survey.
3. Description of the possible problems associated withconducting new recruit surveys using alternative approaches(differing sites, methods, sampling procedures, etc.).
4. Description of possible end uses of, and modifications to,the Survey Spreadsheet which is being developed for this project.
5. Discussion of logistics of questionnaire exercise.
A-1
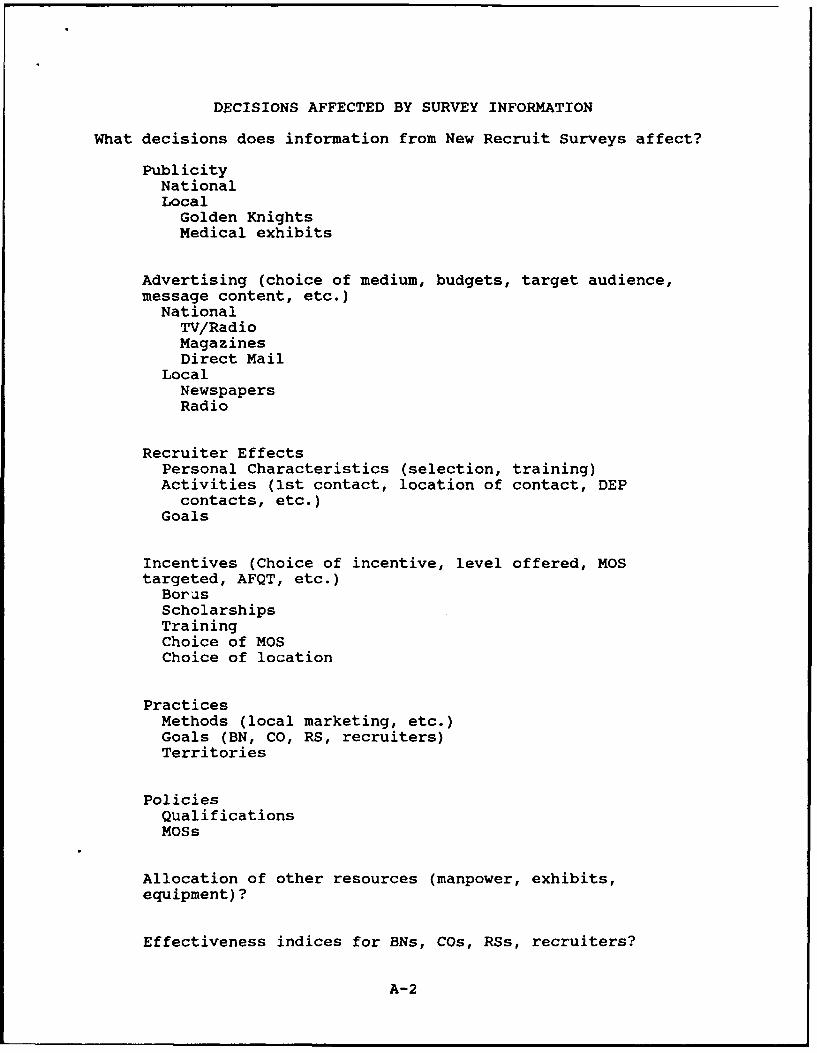
DECISIONS AFFECTED BY SURVEY INFORMATION
What decisions does information from New Recruit Surveys affect?
PublicityNationalLocalGolden KnightsMedical exhibits
Advertising (choice of medium, budgets, target audience,message content, etc.)National
TV/RadioMagazinesDirect Mail
LocalNewspapersRadio
Recruiter EffectsPersonal Characteristics (selection, training)Activities (1st contact, location of contact, DEP
contacts, etc.)Goals
Incentives (Choice of incentive, level offered, MOStargeted, AFQT, etc.)
BorusScholarshipsTrainingChoice of MOSChoice of location
PracticesMethods (local marketing, etc.)Goals (BN, CO, RS, recruiters)Territories
PoliciesQualificationsMOSs
Allocation of other resources (manpower, exhibits,equipment)?
Effectiveness indices for BNs, COs, RSs, recruiters?
A-2

Others?
Please rank order the importance of survey information for eachof the variables listed above (i.e., publicity, ads, incentives,etc.).
In what ways is survey information important to these decisions?
What other information is NRS information combined with in orderto be useful for management decisions? (e.g., AFQT scores, jobperformance, etc., YATS, demographic data, economic data)
What other types of information are used?
What are the external factors that typically constrain thesedecisions? (e.g., Congressional mandates, budgets, DOD policies,etc.)
What other events have shaped policy?
How else is NRS information used? (e.g., to monitor demographicor psychographic changes, to assess effectiveness)
How important is each type of survey information (please rate ont)7- next page)?
How much of a difference in survey responses is needed before it
is noticed and considered important?
Before actions are taken?
Before changes in policies or practices are made?
A-3
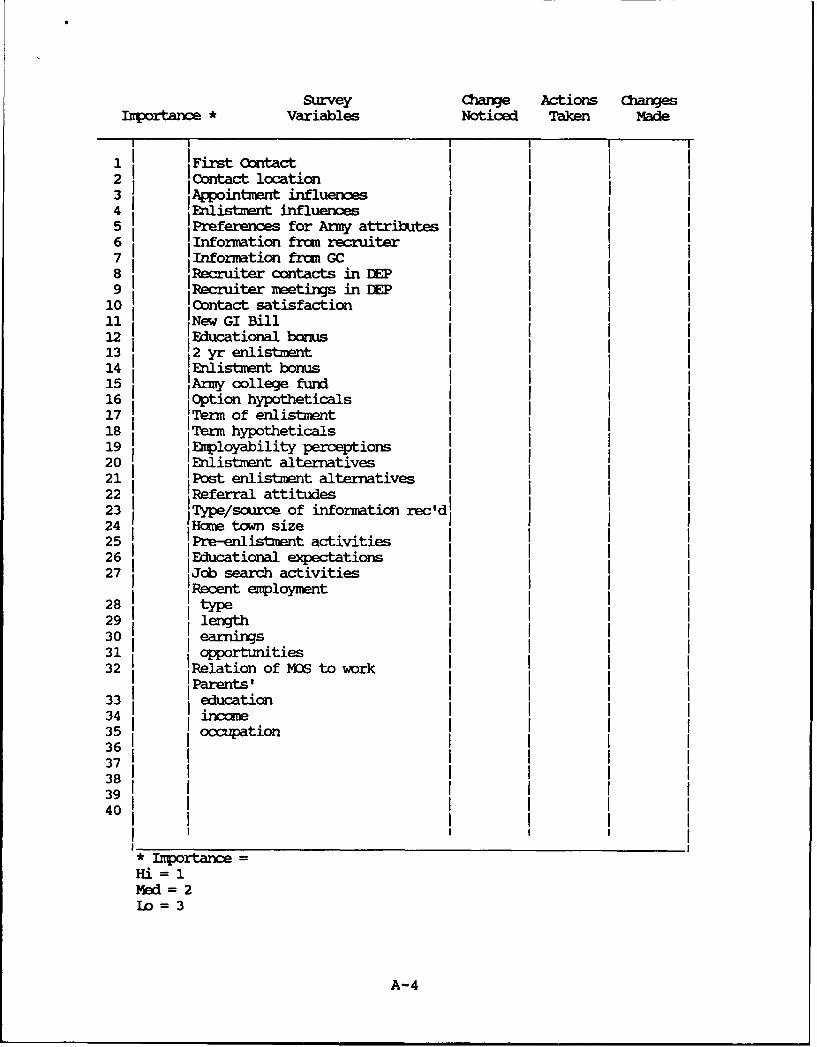
Survey Change Actions ChagesImportance * Variables Noticed Taken Made
I I t ~ n ~ c I I I I--1 First Contact
2 Contact location31 Appointment influencs4 Enlistment influences5 Preferences for Army attributes6 Information fram recruiter7 Information from GC8 Recruiter contacts inIEP9 Recruiter meetins in DEP10 Contact satisfaction11 New GI Bill12 Educational bonus13 2 yr enlistment14 Enlistment bonus15 Army college fund16 Option hypotheticals17 Term of enlistment18 Term hypotheticals19 Ehloyability perceptions20 Enlistment alternatives21 Post enlistment alterntives22 Referral attitudes23 Type/s of information rec'dI24 Home town size25 Pre-enlistment activities26 Educational expectations27 Job search activities
Recent enployment28 type29 lengrth30 eanngs31 opportunities32 Relation of MOS to work
Parents'33 education3435 occupation3637383940
• Importance =Hi= 1Med = 2la = 3
A-4
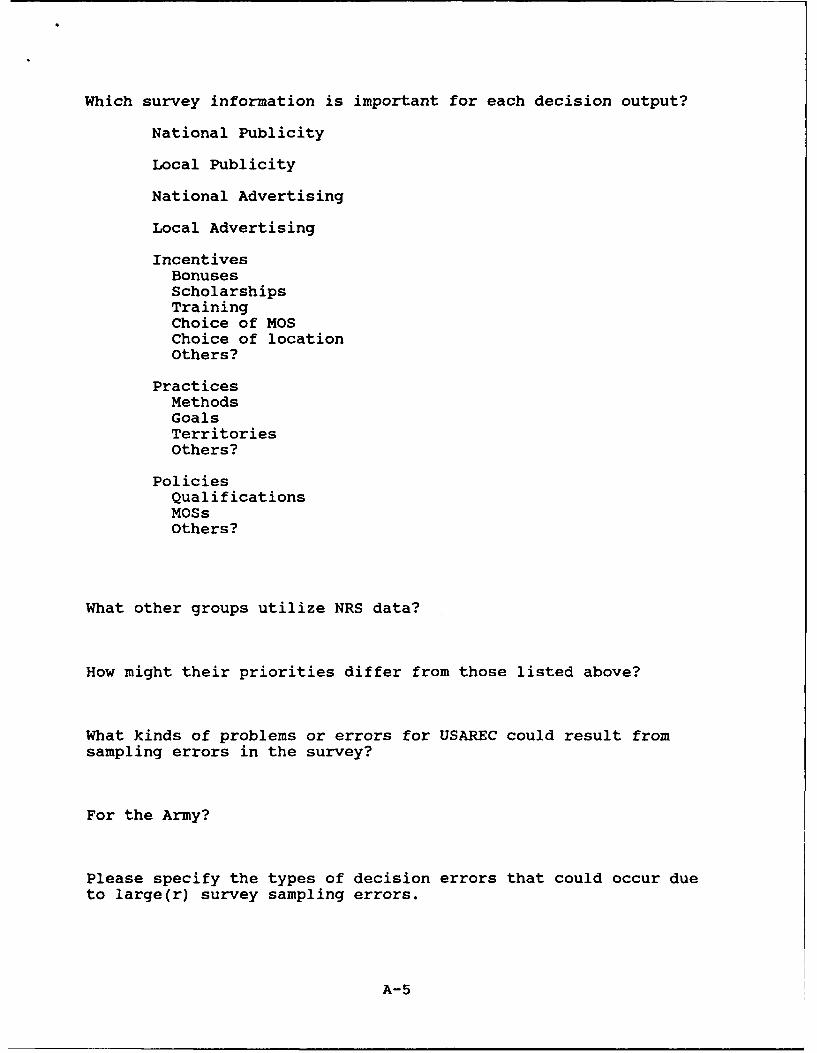
Which survey information is important for each decision output?
National Publicity
Local Publicity
National Advertising
Local Advertising
IncentivesBonusesScholarshipsTrainingChoice of MOSChoice of locationOthers?
PracticesMethodsGoalsTerritoriesOthers?
PoliciesQualificationsMOSsOthers?
What other groups utilize NRS data?
How might their priorities differ from those listed above?
What kinds of problems or errors for USAREC could result fromsampling errors in the survey?
For the Army?
Please specify the types of decision errors that could occur dueto large(r) survey sampling errors.
A-5

Sampling Errors Managementfor Survey Topics Decision Errors
1st Contact Inappropriate recruitergoalsAppointment influences Wrong ad/publicity methodsEnlistment influences Wrong ad content/emphasisAttitudes Wrong sales emphasisInformation available Inappropriate recruiter
goalsIncentives to enlist Lower
effectiveness/vacanciesJob alternatives Ineffective level of
incentivesEmploymentEducational expectations Wrong emphases in
ads/incentivesParents' work/educ./income Wrong placement of
ads/info
Other errors?
For each type of credible decision error, list the types of costsincurred from that error.
What types of benefits could occur due to improved surveyaccuracy?
For each cost category outlined above, estimate the range ofcosts that could result from errors and benefits,
A-6

RELATIVE IMPORTANCE OF DIFFERING TYPES OF SURVEY INFORMATION
On a scale of 1 (very low) to 10 (very high), rank the importanceof the following survey purposes:
Sales satisfaction-_ Program evaluation
Marketing
Briefly explain the rationale.
What other purposes are made of survey information?
Survey information is usually reported and examined according tovarious categories (i.e., AFQT, age). For example, reasons forenlisting may be examined for each of the AFQT categories, foreach sex, by age group, or by geographical region of the country.
To design a good sampling plan, it is useful to know the relativeimportance of these categories to those who use the information.Please rank order the importance of the following categories:
Command level (i.e., BDE, BN, CO, RS)AFQTMOSAgeRaceSexGeographical areaSenior/GradEducational expectations
Are any other categories important? Which ones?
Does importance vary as a function of policy goals? Please givean example.
A-7

What improvements in the following areas would make this
information more useful?
survey content -
methods -
sampling -
analyses -
data presentation -
What future events or needs might change the type, timing, ormethod of collecting survey information? (e.g., reduction inforce, sustained conflict in Iraq, computers in RS, MEPS, etc.)
How important is the timing of when survey information is
received?
What problems are associated with the use of survey information?
What problems are associated with survey sites?
At reception battalion?
At MEPS?
At recruiting stations?
What problems are associated with different survey methods?
Group administered?
Mail forms?
Telephone?
What problems are associated with sampling procedures?
A-8

What options are available for surveying individuals who do notcontract?
QNEs?
PQs?
Appointments not tested?
A-9

SURVEY SPREADSHEET
How would it be useful to you?
estimating costs of additional surveys,
choosing alternative sampling plans and survey methods,
estimating sampling errors associated with alternativeapproaches
providing graphs, numbers to communicate decision
rationales
evaluating competing contractor proposals
other reasons?
Who else may wish to use it and for what reasons?
What additional information do you need included in the
spreadsheet?
What changes would make it easier to use?
Which features are most important?
Should a help-line tutorial be developed?
A-10
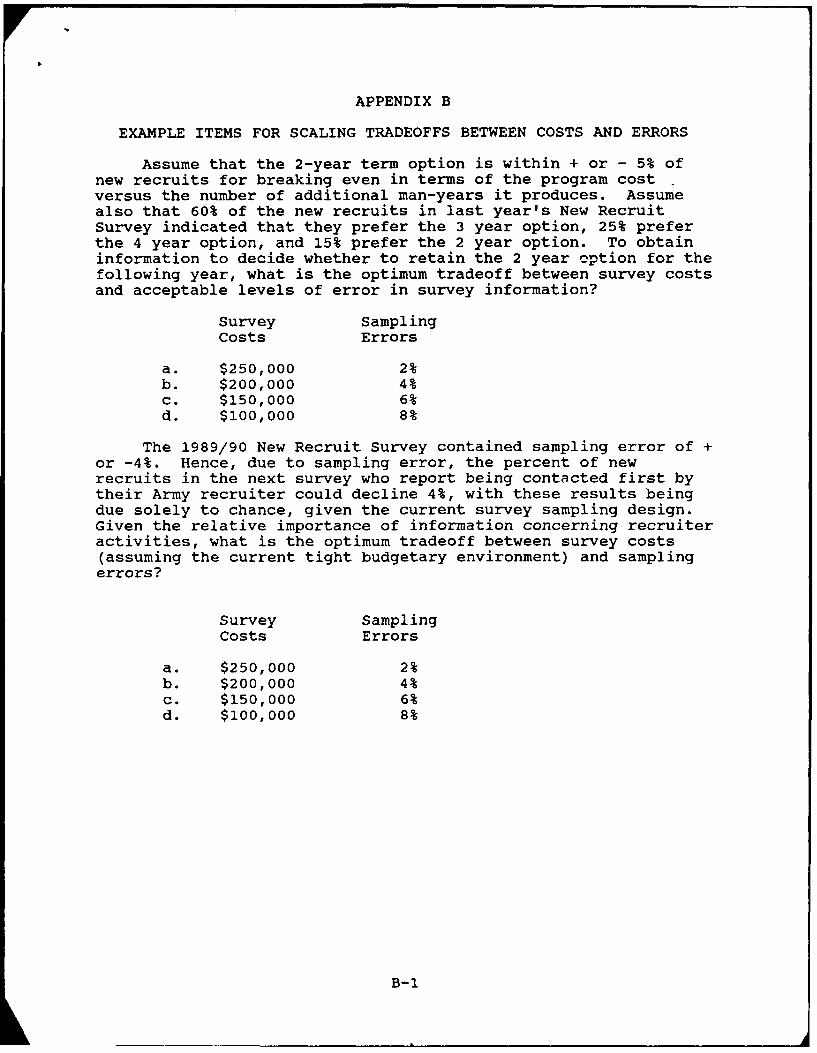
APPENDIX B
EXAMPLE ITEMS FOR SCALING TRADEOFFS BETWEEN COSTS AND ERRORS
Assume that the 2-year term option is within + or - 5% ofnew recruits for breaking even in terms of the program cost -
versus the number of additional man-years it produces. Assumealso that 60% of the new recruits in last year's New RecruitSurvey indicated that they prefer the 3 year option, 25% preferthe 4 year option, and 15% prefer the 2 year option. To obtaininformation to decide whether to retain the 2 year option for thefollowing year, what is the optimum tradeoff between survey costsand acceptable levels of error in survey information?
Survey SamplingCosts Errors
a. $250,000 2%b. $200,000 4%c. $150,000 6%d. $100,000 8%
The 1989/90 New Recruit Survey contained sampling error of +or -4%. Hence, due to sampling error, the percent of newrecruits in the next survey who report being contacted first bytheir Army recruiter could decline 4%, with these results beingdue solely to chance, given the current survey sampling design.Given the relative importance of information concerning recruiteractivities, what is the optimum tradeoff between survey costs(assuming the current tight budgetary environment) and samplingerrors?
Survey SamplingCosts Errors
a. $250,000 2%b. $200,000 4%c. $150,000 6%d. $100,000 8%
B-1