perspectives for an integrated 1g+2g biorefinery · 2g parameters parameter value steam explosion...
TRANSCRIPT

Perspectives for an Integrated Perspectives for an Integrated
1G+2G Biorefinery1G+2G Biorefinery
São Paulo Advanced School on the Present and Future of Bioenergy – ESPCA 2014
Division of Integrated Assessment of Biorefineries
Brazilian Bioethanol Science and Technology Laboratory - CTBE
Brazilian Center for Research in Energy and Materials - CNPEM
October 2014

Straw
Recovery?
Integrated x Standalone?
Fermentation or biodigestion
of C5?
IntroductionAlternatives for 2G
Technology
Option Selection
(best technical, economic,
environmental and social impacts)
Feedstock?
of C5?
In-house production of
enzymes?
Virtual Sugarcane Biorefinery
(VSB)

Virtual Sugarcane Biorefinery
pre planting
operations
soil
preparationplanting cultivation harvesting
sugarcane
transport
economic analysisproduction cost
IRR
...
biorefinery
1G
biorefinery
2G
CanaSoft
biorefinery
simulation
usage
model
social analysismanpower
wages
...
environmental analysis
(life cycle assessment)global warming
acidification
eutrophication
ecotoxicity
ozone layer depletion
energy balance
water use
land use
...
AspenPlus®
Other
Biorefineries
Sorghum
Juice conc.
Butanol
FDCA
PLA
SimaPro®
input-output
matrix
economic
engineering
transport
and use
logistics
...

• Assess different routes and technologies
• Assess stage of development of new technologies
• Optimize concepts and operations in the Biorefinery
Model
Virtual Sugarcane Biorefinery
Sustainability impacts:
economic, environmental and social
Model integration
Process simulation
Mathematical models

CanaSoft
• Agricultural
operations
• TransportScenarios
• Transport
• Inputs
• Irrigation
• General
aspects
Scenarios Description

80%
100%
CanaSoft Outputs
19%
4%
Other
Fossil depletion
Agricultural land
Environmental results Economic results
SimaPro (Single Score) % of sugarcane production cost
0%
20%
40%
60%
80%
Manual
harvesting
Mechanized
harvesting
Agricultural operations Inputs
Transport Vinasse spreading
Land Taxes
41%
24%
11%
1%
Agricultural land
occupation
Particulate matter
formation
Climate change on
human health

Biorefinery Simulation
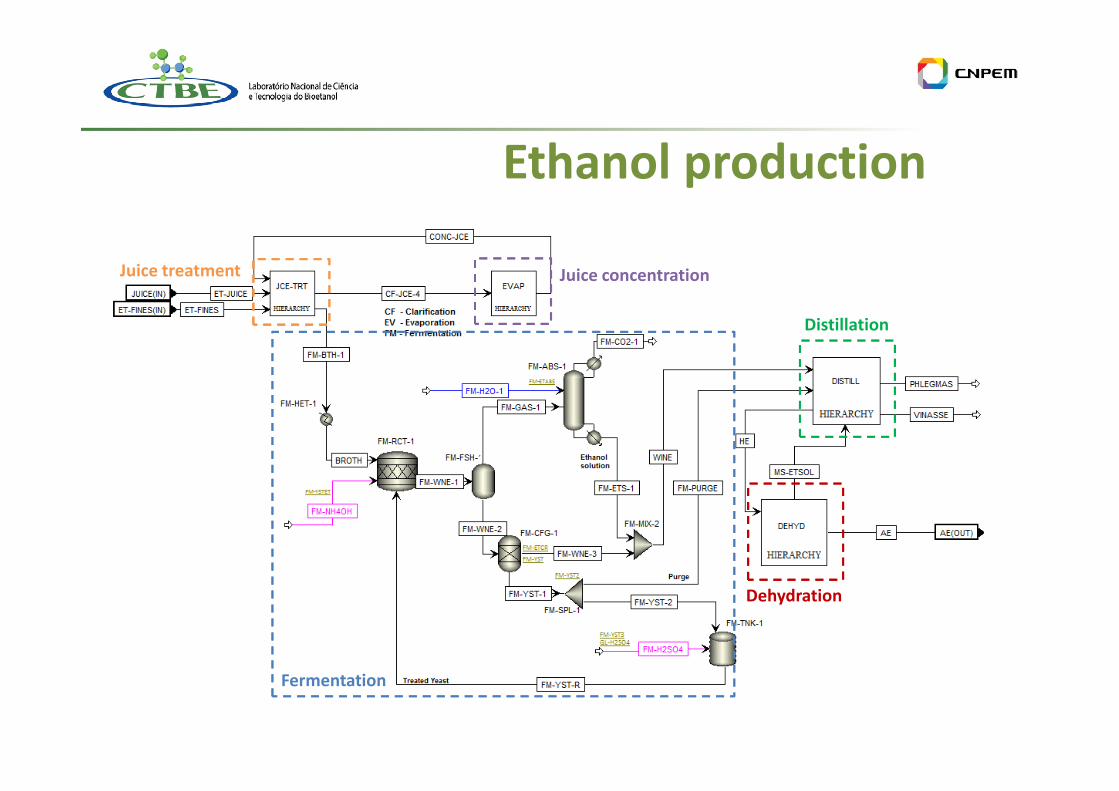
Distillation
Juice treatment Juice concentration
Ethanol production
Dehydration
Fermentation

terminal fuel station
Ethanol Distribution System
distances transport system
terminalbiorefinery
transference
terminalport
truck
rail
pipeline
barge

Internal Rate of Return (% per year)1
Decision-making:
Financial analysis
Ethanol production cost (R$/L)2
Minimum ethanol selling price (MESP, R$/L)3

Internal Rate of Return (IRR)1
25 years0 1 2 3 ...
IRR is the interest
rate at which
Net Present Value 0
Revenues - OPEX
Financial analysis
25 years0 1 2 3 ...Net Present Value
is zero
IRR < MARR
Minimally Acceptable Rate of Return (M.A.R.R)
NPV =
IRR > MARR NPV = +
Business goal:
maximizing IRR
0
CAPEX NPV = 0
-

Ethanol production cost (R$/L)2
IRR = 0 Price = Production cost
It doesn’t pay the cost of capital
Financial analysis
It doesn’t pay the cost of capital
Public policy goal:
minimizing
Production cost

IRR = MARR Minimum selling price
(MESP)
Minimum ethanol selling price (R$/L)3
Financial analysis
(MESP)It pays the cost of capital at
the minimum acceptable rate
of returnPublic policy goal:
minimizing
MESP

Revenues ($)
OPEX ($)
CAPEX ($)
300
210
620
Technology 2
260
185
490 Decision making:
Technology 1
Financial analysis
CAPEX ($)
IRR115%
0.96MESP10.95
Production cost10.79
14%
0.78
Business side:
not satisfied
Policymaker side:
satisfied
Business and policy:
not satisfied
decrease
decrease
increase
Decision making:

Agricultural production
Transport
SugarcaneStraw
Land use, inputs,
machinery, fertilizer,
agrochemicals,
industrial residues,…
Machinery, diesel...
Residues Local emissions(pre harvesting burning,
soil emissions…)
Local emissions
Life Cycle Assessment
Industry
Distribution
Use
Ethanol
Machinery, diesel...
Equipment, buildings,
inputs, electricity,
diesel,…
Machinery, diesel,
storage...
Steel, engine
efficience...
Local emissions(diesel use…)
Local emissions(bagasse burning,
fermentation…)
Local emissions(diesel use…)
Local emissions(ethanol use…)
Ethanol, electricity,
co-products,…

Straw Recovery
(reduction and traffic control)
Proposed mechanization Existing mechanization
Straw recovery systems
Integral harvesting
Advantages: - reduced losses during harvest
- possibility of separation of sugarcane tops.
Disadvantages: - reduction of truck load density
- investment in dry cleaning station.
Baling
Advantages: - better economics for long distances.
Disadvantages: - additional mechanized operations
- higher mineral impurities
- cost and destination of wires.
Straw recovery systems

economic assessment
40
50
reco
ve
ry c
ost
Integral harvesting system Baling system
Transport distance = 30 km
Straw Recovery Systems
10
20
30
40
20% 30% 40% 50% 60% 70% 80%
stra
w r
eco
ve
ry c
ost
(US
$/T
S)
straw recovery fraction
Transport distance = 30 km

90
100
95 TC ha-1 83 TC ha-1 70 TC ha-1
economic assessment
Straw Recovery Systems
30
40
50
60
70
80
90
20% 30% 40% 50% 60% 70% 80%
dis
tan
ce (
km
)
trash recovery fraction
Integral harvesting
system
Baling system
Lines of equal costs

Integrated 1G2G ethanol production

• Feedstock available in the plant (bagasse) or close to it (straw)
• Share part of the infrastructure of 1G plant
– concentration, fermentation, distillation, storage and cogeneration
• Dilution of potential fermentation inhibitors present in
Why integrate 2G to 1G plant?
• Dilution of potential fermentation inhibitors present in
hydrolyzed liquor when mixed to 1G juice
• Increase of thermal integration possibilities when considering
overall 1G2G process
• Improvement of C5 and C6 fermentations adding C12
• Increase of flexibility for CHP operation

Process flow diagramEthanol production
1G optimized configuration
• Straw use (50%)
• Molecular sieves for dehydration
• 90 bar boilers
• 20% reduction on steam demand
2G configuration
• Steam explosion pretreatment
• Hydrolysis: 48h, 15% solids
• C5 use: fermentation to ethanol
• Use of solid residues as fuel in the
boilers

1G parameters
Parameters Value
Plant capacity – sugarcane processed (million tonnes/year) 2.0
Efficiency – sugar extraction in the mills (%) 96
– fermentation (%) – annexed/autonomous plant 90
– boiler 90 bar (LHV basis) (%) 87– boiler 90 bar (LHV basis) (%) 87
LHV – bagasse (50% moisture)/straw (15% moisture) (MJ/kg) 7.5/14.9
Energy demand of the process – electricity (kWh/TC) 30
Steam – process/molecular sieves – pressure (bar) 2.5 / 6
– molecular sieves (kg/L EtOH) 0.6
Anhydrous ethanol purity (wt%) 99.6

2G parameters
Parameter Value
Steam explosion – hemicellulose conversion (%) 70
– cellulose conversion (%) 2
Enzymatic hydrolysis – cellulose conversion (%) 70Enzymatic hydrolysis – cellulose conversion (%) 70
– solids loading 15
– reaction time 48h
Fermentation – C6 conversion (%) 90
– C5 conversion (%) 80

Integrated 1G2G - convergence
Cogeneration
2G Process
Concentration,
Fermentation e Sugars
Solid residues
Surplus bagasse
and straw
Steam
Straw
Steam demand
of the process
Calculation of
the available LM
Calculation of the
generated steam
Iterative calculation until generated energy = process demand
1G Process
2G Process Fermentation e
Purification
Sugars
Bagasse
Ethanol

Base case plant:
� 2,000,000 TC/year
� 22 bar boiler
� Azeotropic distillation
Autonomous distillery:
Total investment R$ 300 million (~US$150 million) – Dedini (2010)/Sousa and Macedo
1G Investment
Technological improvements (optimized
1G):
� + 40 % on distillation sector
(molecular sieves)
� + 40 % on cogeneration sector (90 bar
boilers)
� + 10% on distillation sector (heat
exchanger network)
Total investment R$ 300 million (~US$150 million) – Dedini (2010)/Sousa and Macedo
(2010)
Transmission lines – electricity credit
� Costs (R$/km): R$ 480,000/km
� Length: 40 km
� R$ 19.2 million for transmission lines
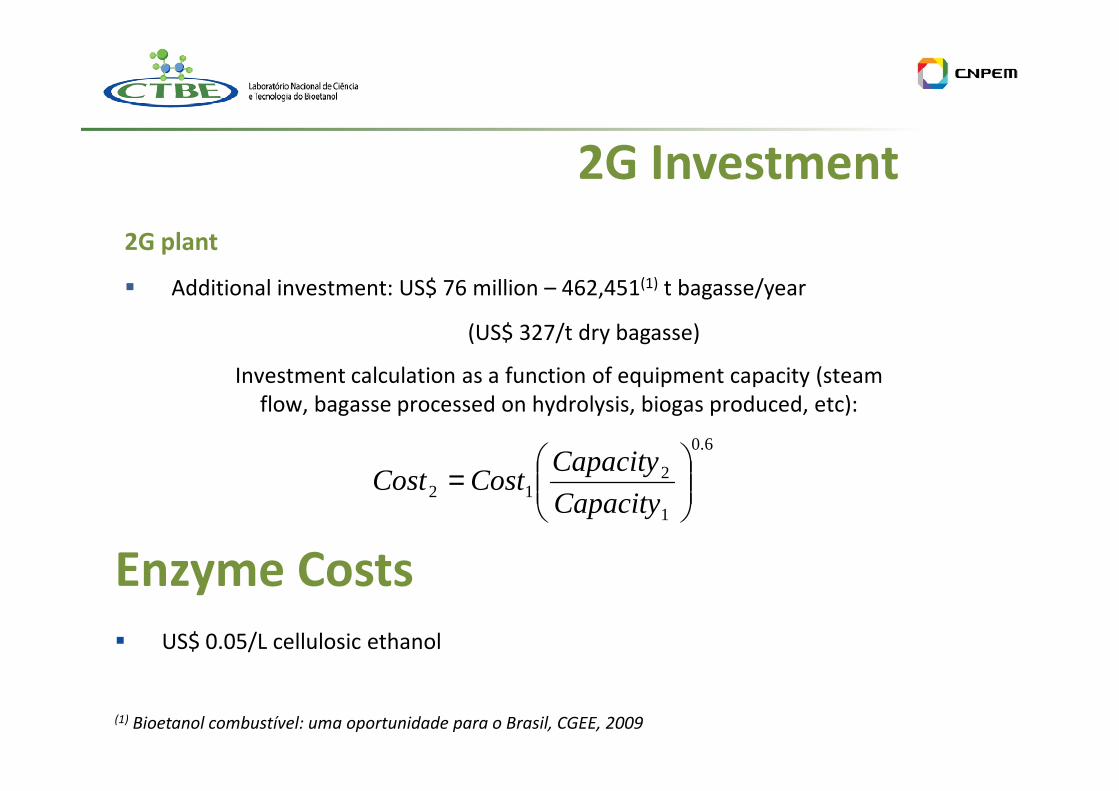
2G plant
� Additional investment: US$ 76 million – 462,451(1) t bagasse/year
(US$ 327/t dry bagasse)
Investment calculation as a function of equipment capacity (steam
flow, bagasse processed on hydrolysis, biogas produced, etc):
2G Investment
(1) Bioetanol combustível: uma oportunidade para o Brasil, CGEE, 2009
6.0
1
212
=
Capacity
CapacityCostCost
flow, bagasse processed on hydrolysis, biogas produced, etc):
Enzyme Costs
� US$ 0.05/L cellulosic ethanol

Technical Results
82
116
173
81
Ethanol (L/TC) Electricity (kWh/TC)
1G2G or
1G+2G1G (optimized)
82 81
Dias et al., 2012. Integrated versus stand-alone second generation ethanol production from
sugarcane bagasse and trash. Bioresource Technology

16.8%
Economic Assessment
14.9%
0.37 $/L 12.7% 0.36 $/L0.33 $/L
Integrated 1G2G
0.37 $/L
Ethanol costIRR
1G+2G
12.7% 0.36 $/L
1G (optimized)
Dias et al., 2012. Integrated versus stand-alone second generation ethanol production from
sugarcane bagasse and trash. Bioresource Technology

Environmental Impacts
1G ethanol 1G2G ethanol
0.39
0.47
0.42
EutrophicationKgPO4
-3eq/kgethanol
Energy
BalanceRenew out/fossil in
Global Warming
Potential KgCO2eq/kgethanol
10.6
0.39
0.35
0.42
11.8

Flexibility ethanol 2G vs electricity
17,5%
18,0%
18,5%
IRR
(p
er
ye
ar)
(no condensing turbine)
(50% of LM used in 1G2G
(depending on
market trends)
16,0%
16,5%
17,0%
17,5%
1G2G (+electricity) 1G2G (+ethanol) 1G2G (flex)
IRR
(p
er
ye
ar)
(50% of LM used in 1G2G
+ethanol is sent to CHP)
Source: Dias et al., 2013. Biorefineries for the production of first and second generation ethanol
and electricity from sugarcane. Applied Energy

Thank [email protected]