perspectives on redemption patterns across intermediary-sold distribution platforms september 15,...
TRANSCRIPT
Perspectives on Redemption Patterns Across Intermediary-Sold Distribution Platforms
September 15, 2011
Dennis Bowden, Senior Research [email protected]
2
Evolving Considerations in Intermediary-Sold Space – Growth vs. Stability
Continued expansion of fee-based advisory programs Within this, recent growth of Rep-as-PM programs, as well as
increasing influence of RIAs
Increasing consideration around asset stability features across platforms Evolving economics of intermediary-sold fund distribution
Asset velocity differences across platform and FA types Platform and FA characteristics Demand trends Portfolio construction methodology
Assessing holistic, long-term opportunity sets across different intermediary-sold distribution avenues
3
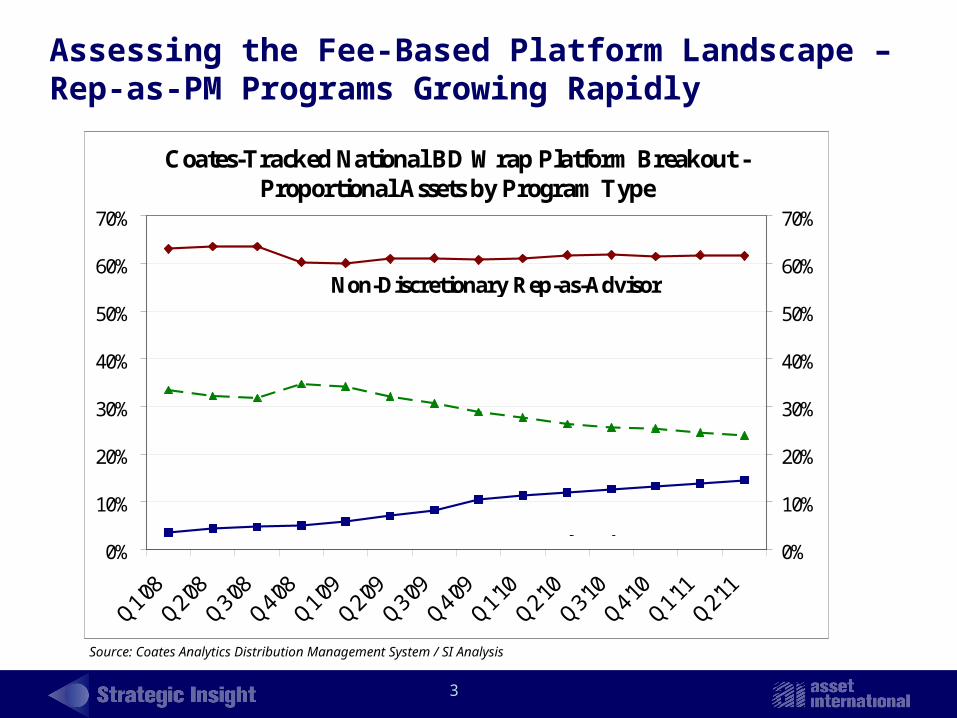
Assessing the Fee-Based Platform Landscape – Rep-as-PM Programs Growing Rapidly
Source: Coates Analytics Distribution Management System / SI Analysis
Coates-Tracked National BD Wrap Platform Breakout - Proportional Assets by Program Type
0%
10%
20%
30%
40%
50%
60%
70%
Q1'08
Q2'08
Q3'08
Q4'08
Q1'09
Q2'09
Q3'09
Q4'09
Q1'10
Q2'10
Q3'10
Q4'10
Q1'11
Q2'11
0%
10%
20%
30%
40%
50%
60%
70%
Non-Discretionary Rep-as-Advisor
Discretionary Rep-as-PM
Home Office Model Portfolio-Based
4
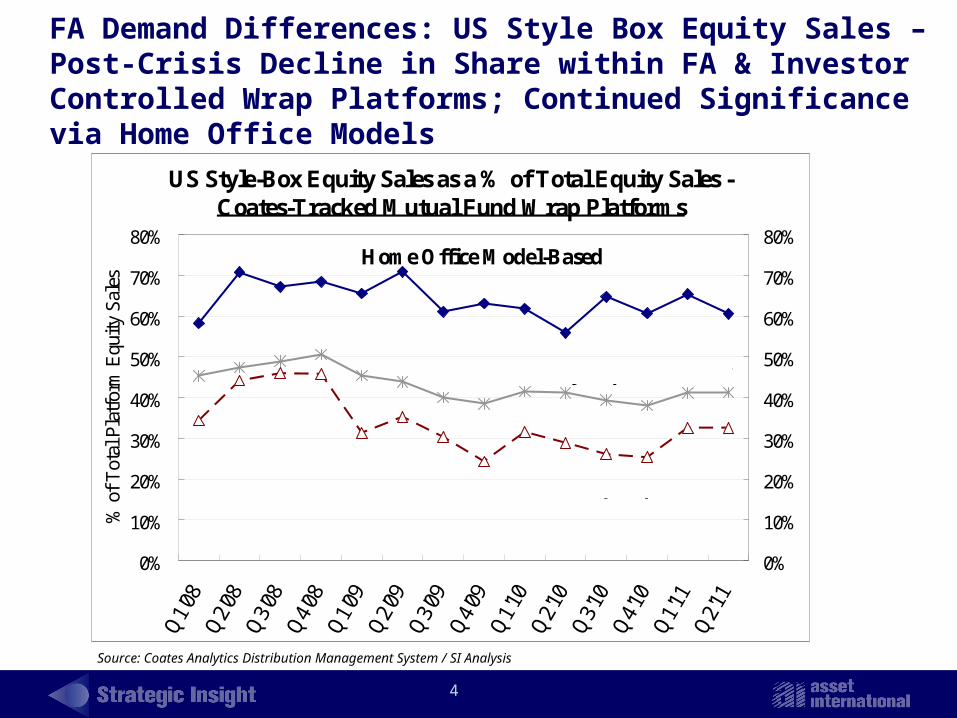
FA Demand Differences: US Style Box Equity Sales – Post-Crisis Decline in Share within FA & Investor Controlled Wrap Platforms; Continued Significance via Home Office Models
Source: Coates Analytics Distribution Management System / SI Analysis
US Style-Box Equity Sales as a % of Total Equity Sales - Coates-Tracked Mutual Fund Wrap Platforms
0%
10%
20%
30%
40%
50%
60%
70%
80%
Q1'
08Q
2'08
Q3'
08Q
4'08
Q1'
09Q
2'09
Q3'
09Q
4'09
Q1'
10Q
2'10
Q3'
10Q
4'10
Q1'
11Q
2'11
% o
f T
otal
Pla
tfor
m E
quit
y Sa
les
0%
10%
20%
30%
40%
50%
60%
70%
80%Home Office Model-Based
Discretionary Rep-as-PM
Non-Discretionary Rep-as-Advisor
5
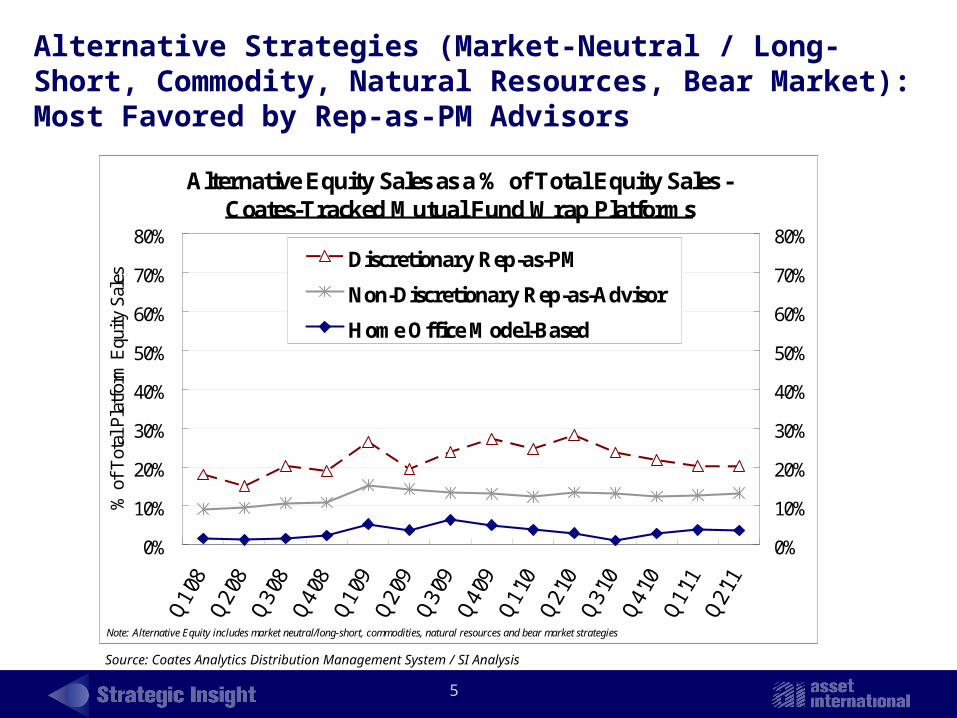
Alternative Strategies (Market-Neutral / Long-Short, Commodity, Natural Resources, Bear Market): Most Favored by Rep-as-PM Advisors
Source: Coates Analytics Distribution Management System / SI Analysis
Alternative Equity Sales as a % of Total Equity Sales - Coates-Tracked Mutual Fund Wrap Platforms
0%
10%
20%
30%
40%
50%
60%
70%
80%
Q1'
08Q
2'08
Q3'
08Q
4'08
Q1'
09Q
2'09
Q3'
09Q
4'09
Q1'
10Q
2'10
Q3'
10Q
4'10
Q1'
11Q
2'11
% o
f T
otal
Pla
tfor
m E
quity
Sal
es
0%
10%
20%
30%
40%
50%
60%
70%
80%Discretionary Rep-as-PM
Non-Discretionary Rep-as-Advisor
Home Office Model-Based
Note: Alternative Equity includes market neutral/long-short, commodities, natural resources and bear market strategies
6
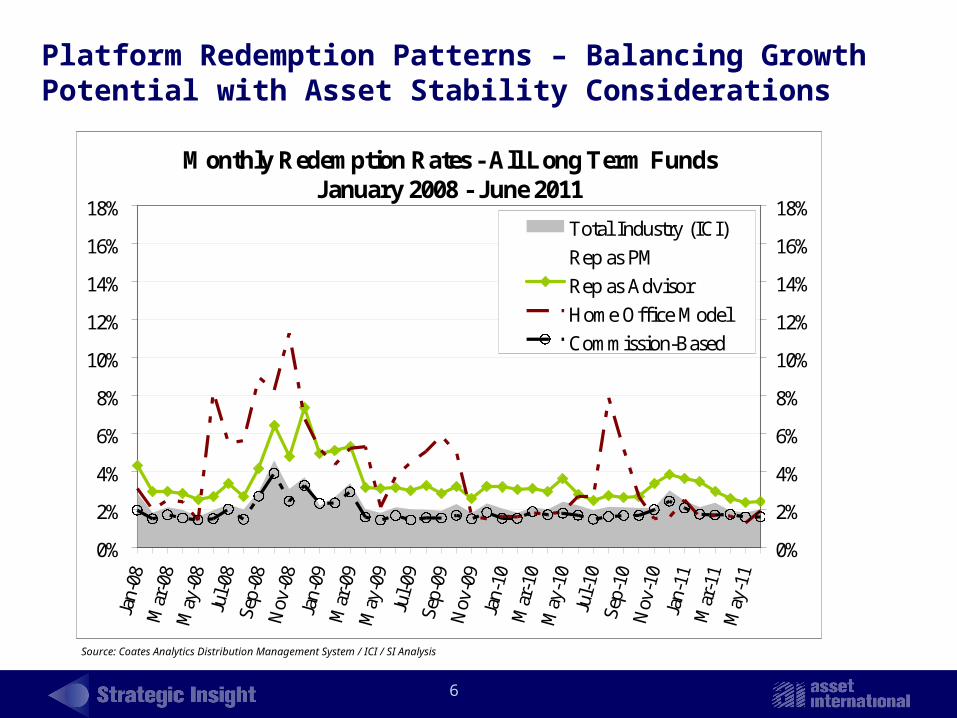
Source: Coates Analytics Distribution Management System / ICI / SI Analysis
Platform Redemption Patterns – Balancing Growth Potential with Asset Stability Considerations
Monthly Redemption Rates - All Long Term FundsJanuary 2008 - June 2011
0%
2%
4%
6%
8%
10%
12%
14%
16%
18%
Jan-
08M
ar-0
8M
ay-0
8Ju
l-08
Sep-
08N
ov-0
8Ja
n-09
Mar
-09
May
-09
Jul-
09Se
p-09
Nov
-09
Jan-
10M
ar-1
0M
ay-1
0Ju
l-10
Sep-
10N
ov-1
0Ja
n-11
Mar
-11
May
-11
0%
2%
4%
6%
8%
10%
12%
14%
16%
18%Total Industry (ICI)
Rep as PM
Rep as Advisor
Home Office Model
Commission-Based
7
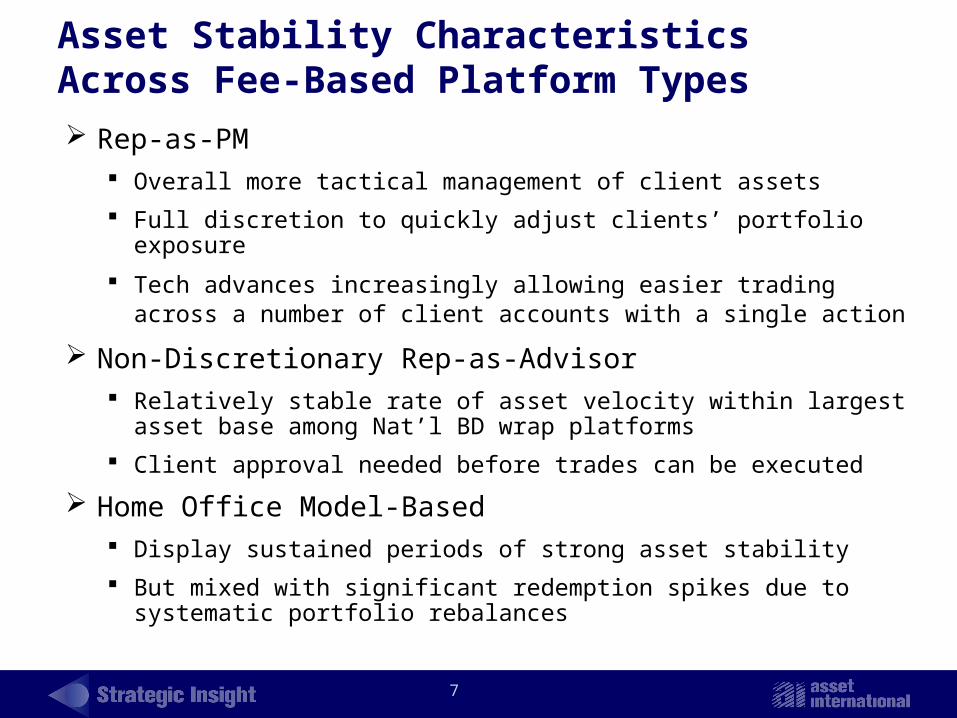
Asset Stability Characteristics Across Fee-Based Platform Types
Rep-as-PM Overall more tactical management of client assets
Full discretion to quickly adjust clients’ portfolio exposure
Tech advances increasingly allowing easier trading across a number of client accounts with a single action
Non-Discretionary Rep-as-Advisor Relatively stable rate of asset velocity within largest asset base
among Nat’l BD wrap platforms
Client approval needed before trades can be executed
Home Office Model-Based Display sustained periods of strong asset stability
But mixed with significant redemption spikes due to systematic portfolio rebalances
8
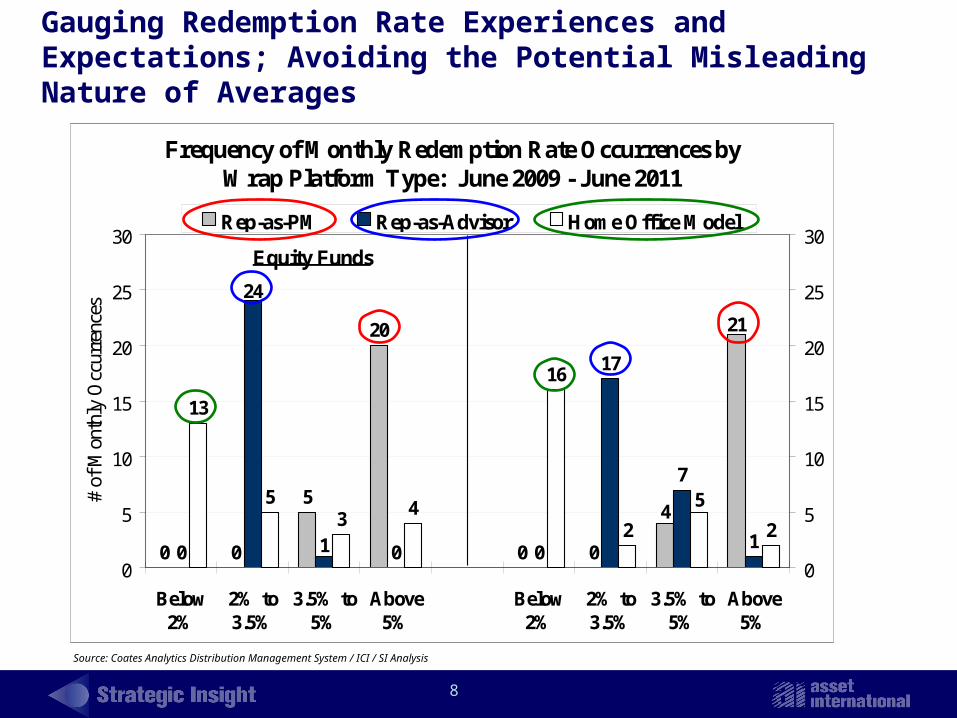
Source: Coates Analytics Distribution Management System / ICI / SI Analysis
Gauging Redemption Rate Experiences and Expectations; Avoiding the Potential Misleading Nature of Averages
Frequency of Monthly Redemption Rate Occurrences by Wrap Platform Type: June 2009 - June 2011
0 0
5
20
0 00 0
17
7
1
13
53
4
16
2 2
21
4
1 0
24
5
0
5
10
15
20
25
30
Below2%
2% to3.5%
3.5% to5%
Above5%
Below2%
2% to3.5%
3.5% to5%
Above5%
# of
Mon
thly
Occ
urre
nces
0
5
10
15
20
25
30Rep-as-PM Rep-as-Advisor Home Office Model
Equity Funds Bond Funds
9
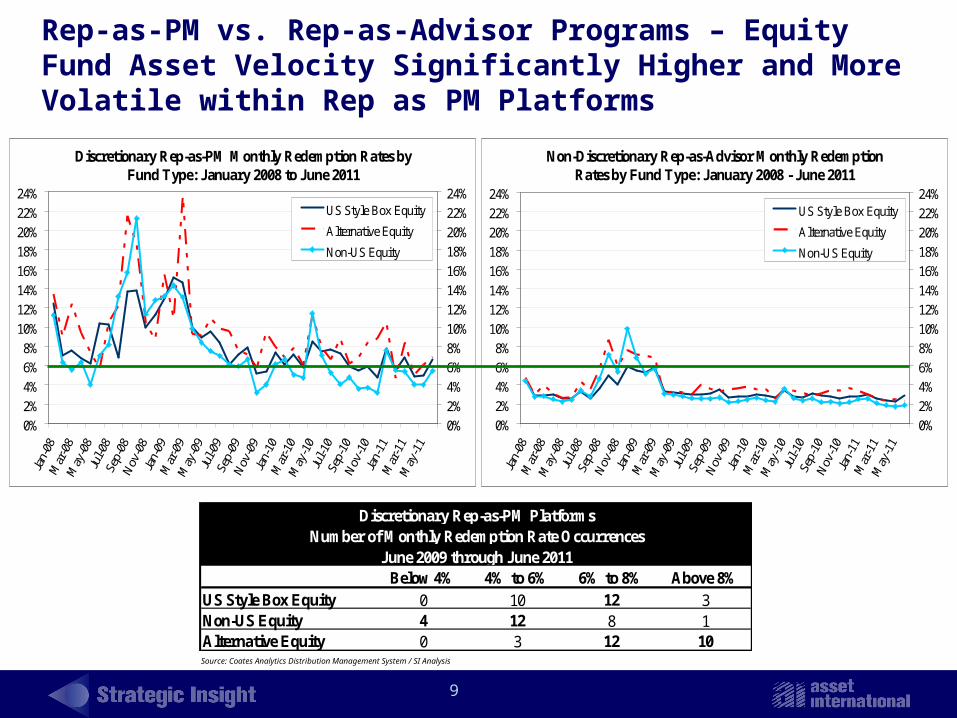
Rep-as-PM vs. Rep-as-Advisor Programs – Equity Fund Asset Velocity Significantly Higher and More Volatile within Rep as PM Platforms
Discretionary Rep-as-PM Monthly Redemption Rates by Fund Type: January 2008 to June 2011
0%
2%
4%
6%
8%
10%
12%
14%
16%
18%
20%
22%
24%
0%
2%
4%
6%
8%
10%
12%
14%
16%
18%
20%
22%
24%US Style Box Equity
Alternative Equity
Non-US Equity
Non-Discretionary Rep-as-Advisor Monthly Redemption Rates by Fund Type: January 2008 - June 2011
0%
2%
4%
6%
8%
10%
12%
14%
16%
18%
20%
22%
24%
0%
2%
4%
6%
8%
10%
12%
14%
16%
18%
20%
22%
24%US Style Box Equity
Alternative Equity
Non-US Equity
Below 4% 4% to 6% 6% to 8% Above 8%US Style Box Equity 0 10 12 3Non-US Equity 4 12 8 1Alternative Equity 0 3 12 10
Discretionary Rep-as-PM PlatformsNumber of Monthly Redemption Rate Occurrences
June 2009 through June 2011
Source: Coates Analytics Distribution Management System / SI Analysis
10
Source: Coates Analytics Distribution Management System / SI Analysis
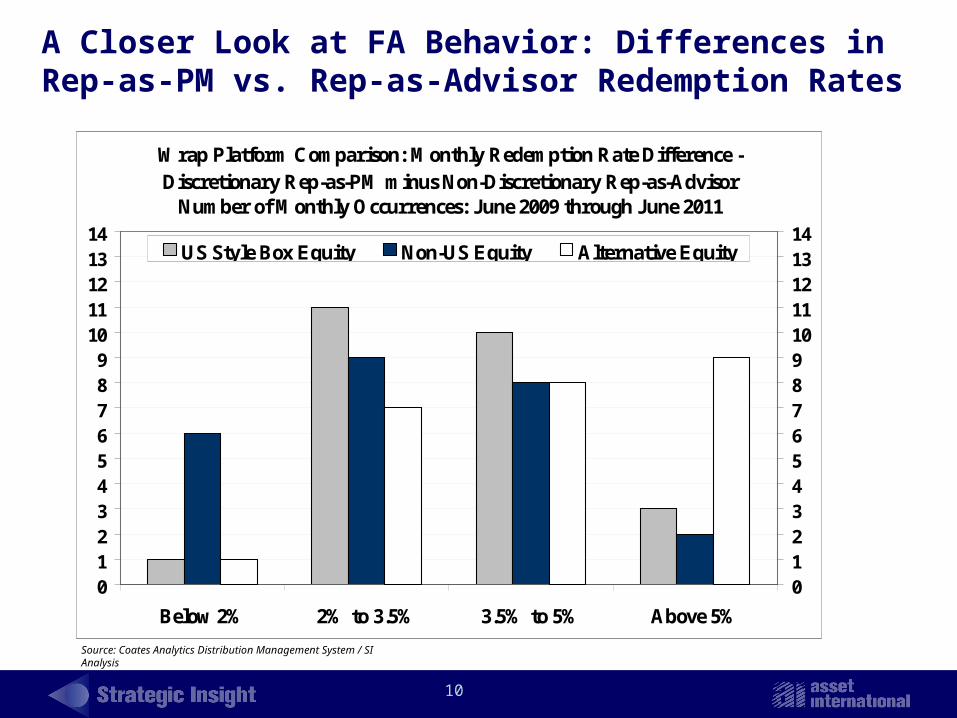
A Closer Look at FA Behavior: Differences in Rep-as-PM vs. Rep-as-Advisor Redemption Rates
Wrap Platform Comparison: Monthly Redemption Rate Difference -Discretionary Rep-as-PM minus Non-Discretionary Rep-as-Advisor
Number of Monthly Occurrences: June 2009 through June 2011
0123456789
1011121314
Below 2% 2% to 3.5% 3.5% to 5% Above 5%
01234567891011121314
US Style Box Equity Non-US Equity Alternative Equity
11
Source: Coates Analytics Distribution Management System / SI Analysis
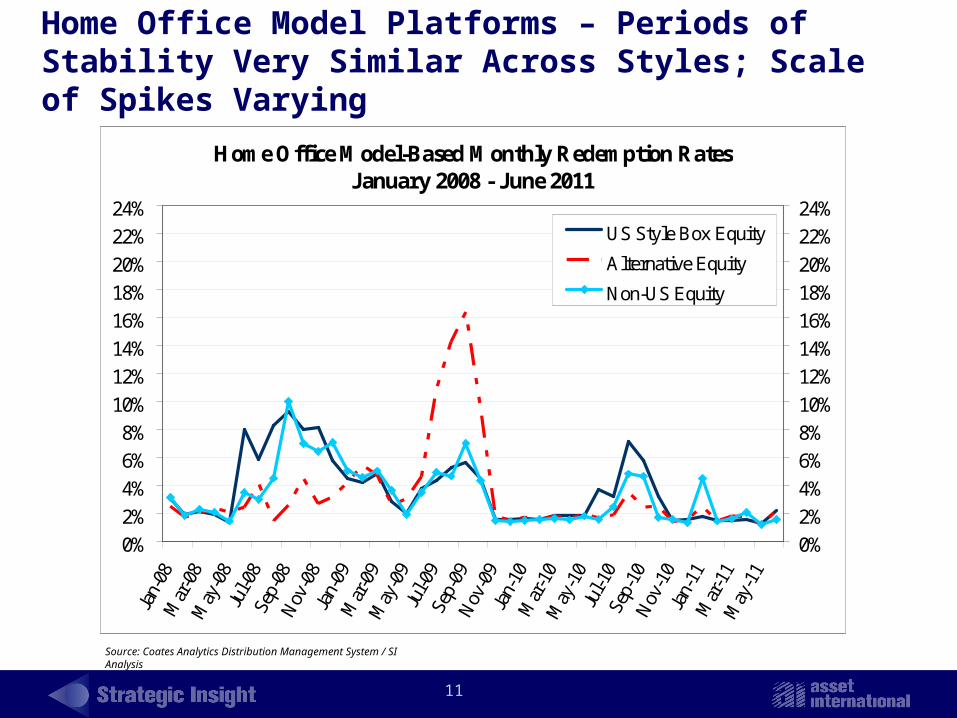
Home Office Model Platforms – Periods of Stability Very Similar Across Styles; Scale of Spikes Varying
Home Office Model-Based Monthly Redemption RatesJanuary 2008 - June 2011
0%
2%
4%
6%
8%
10%
12%
14%
16%
18%
20%
22%
24%
Jan-
08M
ar-0
8M
ay-0
8Ju
l-08
Sep-
08N
ov-0
8Ja
n-09
Mar
-09
May
-09
Jul-0
9Se
p-09
Nov
-09
Jan-
10M
ar-1
0M
ay-1
0Ju
l-10
Sep-
10N
ov-1
0Ja
n-11
Mar
-11
May
-11
0%
2%
4%
6%
8%
10%
12%
14%
16%
18%
20%
22%
24%US Style Box Equity
Alternative Equity
Non-US Equity
12
Source: Coates Analytics Distribution Management System / SI Analysis
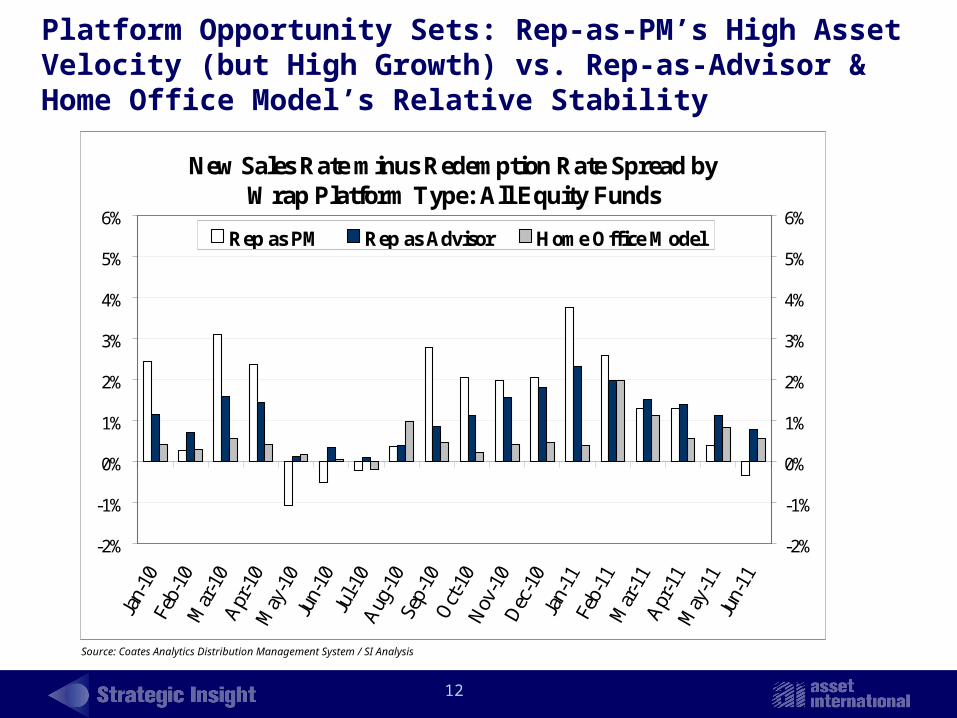
Platform Opportunity Sets: Rep-as-PM’s High Asset Velocity (but High Growth) vs. Rep-as-Advisor & Home Office Model’s Relative Stability
New Sales Rate minus Redemption Rate Spread by Wrap Platform Type: All Equity Funds
-2%
-1%
0%
1%
2%
3%
4%
5%
6%
Jan-
10Fe
b-10
Mar
-10
Apr
-10
May
-10
Jun-
10Ju
l-10
Aug
-10
Sep-
10O
ct-1
0N
ov-1
0D
ec-1
0Ja
n-11
Feb-
11M
ar-1
1A
pr-1
1M
ay-1
1Ju
n-11
-2%
-1%
0%
1%
2%
3%
4%
5%
6%Rep as PM Rep as Advisor Home Office Model
13
Source: Coates Analytics Distribution Management System / SI Analysis
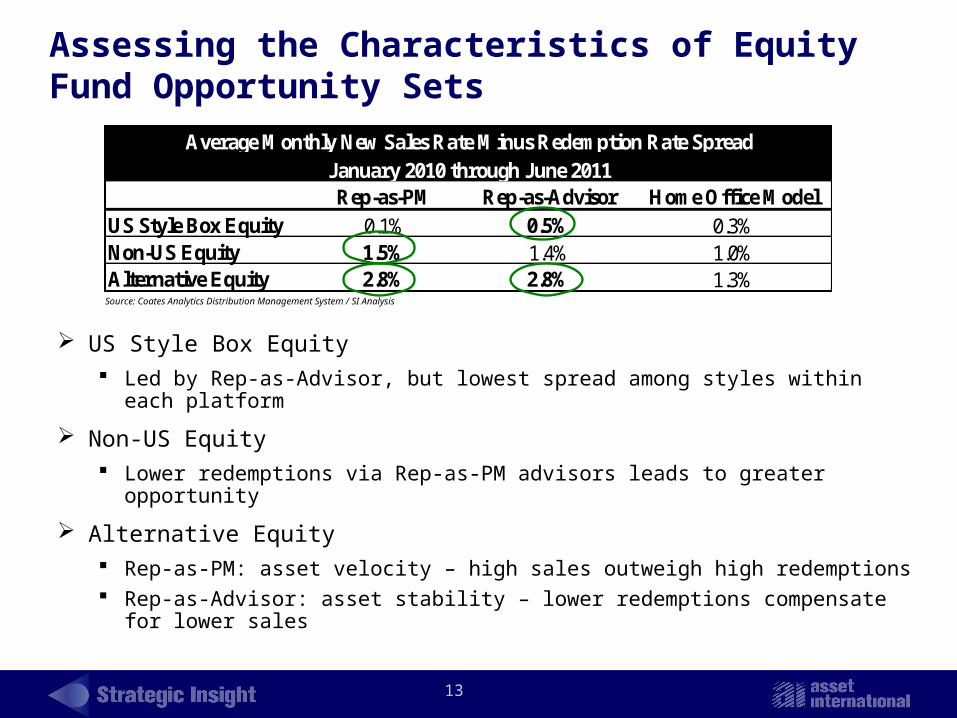
Assessing the Characteristics of Equity Fund Opportunity Sets
Rep-as-PM Rep-as-Advisor Home Office ModelUS Style Box Equity 0.1% 0.5% 0.3%Non-US Equity 1.5% 1.4% 1.0%Alternative Equity 2.8% 2.8% 1.3%
Average Monthly New Sales Rate Minus Redemption Rate SpreadJanuary 2010 through June 2011
US Style Box Equity Led by Rep-as-Advisor, but lowest spread among styles within each
platform
Non-US Equity Lower redemptions via Rep-as-PM advisors leads to greater opportunity
Alternative Equity Rep-as-PM: asset velocity – high sales outweigh high redemptions Rep-as-Advisor: asset stability – lower redemptions compensate for lower
sales
14
Implications Moving Forward
Expansion of fee-based advisory programs continues to bring higher asset velocity features to growing segments of fund business
Increasingly converse relationship between growth and asset stability within expanding segments of the FA-sold marketplace
Implications around product focus and development, sales force compensation, and other aspects of overall distribution strategy
Growing importance in analyzing holistic combination of new business and asset stability considerations
15
How Can Fund Firms Respond?
Aggregate redemption stats alarming, but Rep-as-PM advisors (and RIAs) can still represent valuable relationship opportunities
Influence of such advisors growing rapidly as trend toward greater FA discretion continues
High-net-worth client base
Increased importance of FA segmentation and targeting around both growth and asset stability considerations Particularly within high-velocity segments such as Rep-as-PM and RIA
Segments of these advisor bases with strong asset stability characteristics in your firm’s core strategies?
Ability to rethink / retool certain aspects of revenue sharing arrangements with key distribution partners?
Potential to tie payment levels more directly to redemption/holding period metrics?
Revenue sharing grid based on FA holding period?
16
© Copyright 2011 Strategic Insight, an Asset International company, and when referenced or sourced Coates Analytics, Morningstar Inc. and Lipper Inc. All rights reserved. The information, data, analyses and opinions contained herein (a) include confidential and proprietary information of the aforementioned companies, (b) are provided solely for information purposes, and (c) are not warranted or represented to be correct, complete, accurate, or timely. Past performance is no guarantee of future results. The aforementioned companies are not affiliated with each other.
This report has been prepared using information and sources we believe to be reliable; however,
we make no representation as to its accuracy, adequacy or completeness, nor do we assume responsibility for any errors or omissions or for any results obtained from the use of this report, including any action taken with respect to securities referred to in this report. Our employees may from time to time acquire, hold or sell a position in securities mentioned herein. We may from time to time perform services for any company mentioned in this report. This report is not a prospectus or representation intended to use in the purchase or sale of any securities mentioned in this report.
Strategic Insight is available by subscription and by single copy upon request to the publisher.
17
SI Research Services Already Used by Managers of 90% of U.S. Fund Industry Assets, B/D Distributors, Nearly All Key VA Providers, and Globally by over 100 Leading Managers, Distributors
Simfund, The World’s Databases for Mutual Fund Competitive Intelligence
Tracking ~ $25 Trillion: Flows, Innovations, and Much More
SIOnLine.com AnnuityInsight.com
StrategicInsightGlobal.com GlobalFundDistribution.com
FundInnovation.com
SimFundFiling.com
US Funds: [email protected] [email protected]@sionline.com [email protected]
15(c) and Board Research: [email protected], Subadvisory: [email protected] [email protected]
Global: [email protected] [email protected]