pertti m akel a, nat gopalswamy, and sachiko akiyama · 2 makel a et al. observations of associated...
TRANSCRIPT

Draft version September 29, 2018Typeset using LATEX default style in AASTeX62
Direction Finding Analysis of the 2012 July 6 Type II Solar Radio Burst at Low Frequencies
Pertti Makela,1, 2 Nat Gopalswamy,2 and Sachiko Akiyama1, 2
1The Catholic University of America
620 Michigan Ave., NE
Washington, DC 20064, USA2NASA Goddard Space Flight Center
8800 Greenbelt Road
Greenbelt, MD 20771, USA
(Accepted September 17, 2018)
Submitted to ApJ
ABSTRACT
The 2012 July 6 X1.1 flare at S13W59 and a halo coronal mass ejection (CME) with a space speed of
∼1900 km s−1 were associated with type III and type II radio bursts. The metric-to-decametric type
II radio burst extended down to ∼5 MHz. Simultaneously a slowly drifting feature with a harmonic
structure was observed by Wind and STEREO radio receivers around and below 1 MHz, above the
strong type III radio burst at lower frequencies. The radio direction finding analysis of this lower-
frequency interplanetary (IP) type II radio burst indicates that the radio source was located near
the nose and possibly towards the southern flank of the CME-driven shock. These results provide
an independent confirmation of the previous suggestions that when the metric and IP type II bursts
are overlapping, the lower-frequency IP type II radio burst originates near the shock nose, whereas
the source of the higher-frequency metric type II burst is closer to the Sun in the shock flank region.
These results further support the idea that the coronal and IP type II bursts are produced by the same
CME-driven shock.
Keywords: Sun: coronal mass ejections (CMEs) — Sun: radio radiation — shock waves
1. INTRODUCTION
The first observations of type II solar radio bursts ranging from metric to kilometric wavelengths were made decades
ago (Payne-Scott et al. 1947; Malitson et al. 1973). In dynamic radio spectra, type II bursts can be distinguished as
continuous or intermittent bursts of radio emission slowly drifting downward in frequency (Wild & McCready 1950).
Type II emission is caused by beams of electrons accelerated by a shock, which then generate Langmuir waves that are
converted into radio waves at the fundamental or the first harmonic frequency, or both, of the local plasma near the
shock (e.g. Melrose 1980; Nelson & Melrose 1985; Knock et al. 2001). Because the emission frequency depends on the
electron density of the local plasma, it decreases as the shock propagates from the high-density low corona into thelow-density interplanetary (IP) space. Fast coronal mass ejections (CMEs) are known to drive shocks that cause the
lower-frequency decameter-hectometric (DH; Gopalswamy et al. 2001) and the kilometric type II bursts (Cane et al.
1987). The nature of the shocks producing metric type II burst has been more controversial. Both coronal blast
waves and CME-driven shocks have been proposed as a source of metric type II bursts, and studies of metric type II
observations have provided support for both suggestions (e.g. see discussion in Claßen & Aurass 2002; Cane & Erickson
2005; Gopalswamy 2006; Vrsnak & Cliver 2008).
Another outstanding question of type II radio bursts considers the location of the radio source relative to the shock
front. Mancuso & Raymond (2004) studied 29 metric type II bursts together with coronagraphic and spectrographic
Corresponding author: Pertti Makela

2 Makela et al.
observations of associated CMEs. They found that all type II bursts could be explained by a model where the type II
radio emission originates in source locations above the nose or the flanks of the CME-driven shock. Cho et al. (2008)
compared a selected set of 19 type II bursts with simultaneous CME observations by the Mauna Loa Solar Observatory
(MLSO) MK coronagraphs and found that about half of the type II bursts were likely caused by a CME-streamer
interaction and in the rest of the events the height of the CME leading edge and the formation height of the type II
burst matched. In addition, the formation height of the type II bursts from CME-streamer interaction were below
the CME leading edge but similar to the estimated CME-streamer interaction height suggesting that the radio source
was at the flank of the shock. More recently Ramesh et al. (2012) found that most of the 41 limb CMEs associated
with a metric type II burst had a radio source at or above the CME leading edge as observed by the Gauribidanur
radioheliograph at 109 MHz. Several single event studies have found the shock-streamer interaction to be the source
of metric type II bursts (Shen et al. 2013; Feng et al. 2015; Zimovets & Sadykov 2015; Lv et al. 2017). Recently,
Al-Hamadani et al. (2017) studied a selected set of 16 IP type II bursts and found that 6 (38%) of them were due to
shock-streamer interaction.
A more specific set of type II radio bursts is composed by multi-lane bursts where type II emission lanes occur at
separate frequencies, might be partially overlapping in time and have different drift rates, but do not resemble the well-
known fundamental-harmonic or band-splitting structures (Robinson & Sheridan 1982; Gergely et al. 1984). These
multi-lane type II bursts have been studied mostly at metric wavelengths where they are more common. It has been
suggested that they originate either from separate shocks or from different regions of a single shock (Maxwell & Dryer
1982; Reiner et al. 2001; Leblanc et al. 2001; Cho et al. 2011). Raymond et al. (2000) reported on a multi-lane type
II burst on 1998 June 11, where the higher-frequency type II emission occurred at metric wavelengths and the lower-
frequency emission at decametric wavelengths. They suggest that the metric type II emission is caused by the CME-
driven shock propagating in the higher density region within the streamer overlaying the source active region and the
decametric type II emission originates from another section of the same shock propagating outside the streamer in a
lower density region. These multi type II burst with simultaneous metric and DH emission are not as common as the
complex type II bursts at metric wavelengths. Gopalswamy (2011) analyzed one such event that occurred on 2003
June 17. The two components of type II emission during this event were observed to start almost simultaneously. The
starting frequency of the m-to-DH component was around 180 MHz and that of the DH-to-km component around 6
MHz. Their analysis supports the scenario where the shock flanks in the low corona are the source of the m-to-DH
component and the shock nose higher in the corona is the source of the DH-to-km component.
The radio direction-finding (DF) techniques can be used to estimate the source location of solar radio bursts at long
wavelengths from the measurements of radio receivers onboard spacecraft. Several different DF techniques have been
suggested over the years (e.g. Fainberg & Stone 1974; Lecacheux 1978; Manning & Fainberg 1980; Santolık et al. 2003;
Cecconi & Zarka 2005; Krupar et al. 2012; Martınez Oliveros et al. 2012a). The DF analysis relies on the anisotropic
beaming pattern of the receiving antenna. The details of the DF techniques vary depending on whether the observing
spacecraft is a spin-stabilized or a three-axis stabilized (non-spinning) spacecraft. Because reliable DF analysis requires
sufficiently intense radio emission above the galactic background emission, the fast-drifting type III radio bursts that
are more intense than type II radio bursts, were the first solar radio bursts at low-frequencies to be studied using the
DF methods (e.g. Fainberg et al. 1972; Gurnett et al. 1978; Reiner & Stone 1988). Correspondingly, the more recent
DF studies of type II radio bursts have concentrated on events with periods of more intense type II emission (e.g.
Hoang et al. 1998; Reiner et al. 1998; Martınez Oliveros et al. 2012b; Magdalenic et al. 2014; Martınez Oliveros et al.
2015; Krupar et al. 2016; Makela et al. 2016). The results of these single-event studies have confirmed that inter-action of the CME-driven shocks with the pre-existing high-density structures such as streamers (Reiner et al. 1998;
Magdalenic et al. 2014; Martınez Oliveros et al. 2015; Krupar et al. 2016) or preceding CMEs (Martınez Oliveros et al.
2012b; Makela et al. 2016) result in favorable source regions for intense type II emission.
In this work, we investigate the location of the radio source of an IP type II radio burst on 2012 July 6 relative
to the CME-driven shock. This event belongs to the special set of multi-lane type II radio bursts, where the metric
and IP type II bursts are observed to overlap in time. The radio source location of the lower-frequency IP type II
lane is estimated using DF method and the results are compared with white-light images of the associated CME. We
analyse radio measurements from the WAVES investigation (Bougeret et al. 1995) on the Wind spacecraft and from
the SWAVES experiment (Bougeret et al. 2008) on the Solar Terrestrial Relations Observatory (STEREO) spacecraft.
White-light images are provided by the Large Angle and Spectrometric Coronagraph (LASCO; Brueckner et al. 1995)
2012 July 6 Type II Radio Burst 3
on the Heliospheric and Solar Observatory (SOHO) spacecraft and from the Sun Earth Connection Coronal and
Heliospheric Investigation (SECCHI; Howard et al. 2008) on STEREO spacecraft.
Mercury
Venus
Earth
Sun
AB
Flare
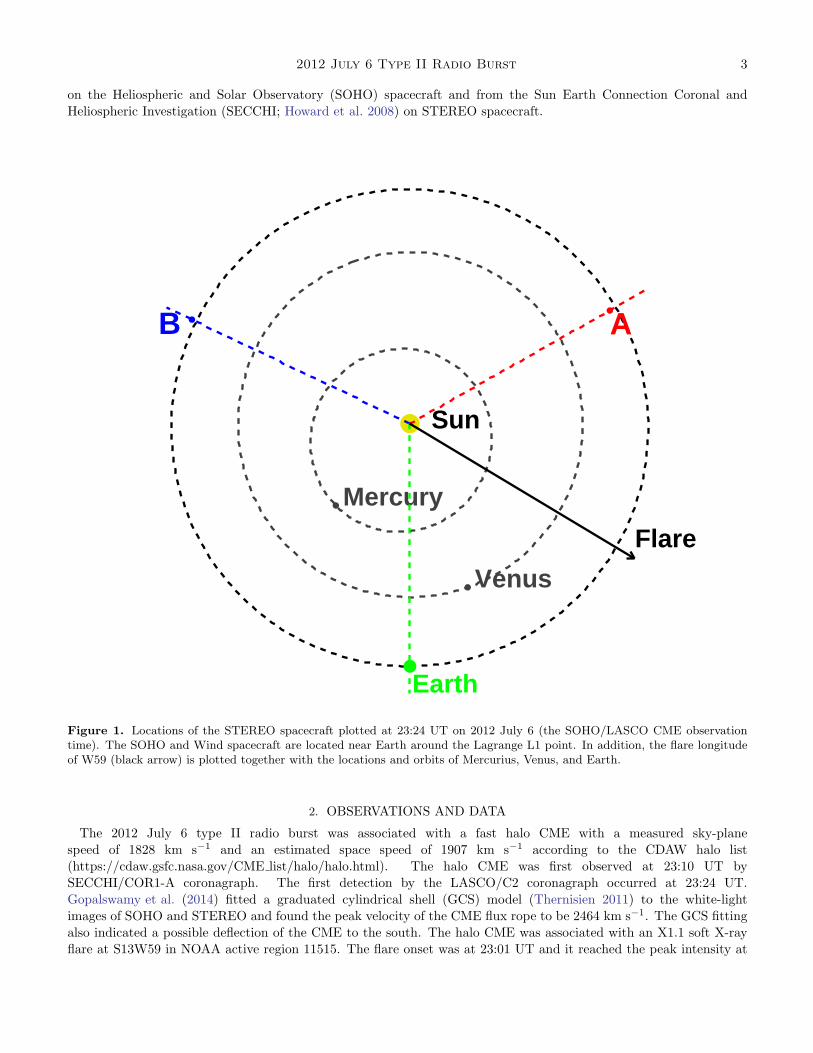
Figure 1. Locations of the STEREO spacecraft plotted at 23:24 UT on 2012 July 6 (the SOHO/LASCO CME observationtime). The SOHO and Wind spacecraft are located near Earth around the Lagrange L1 point. In addition, the flare longitudeof W59 (black arrow) is plotted together with the locations and orbits of Mercurius, Venus, and Earth.
2. OBSERVATIONS AND DATA
The 2012 July 6 type II radio burst was associated with a fast halo CME with a measured sky-plane
speed of 1828 km s−1 and an estimated space speed of 1907 km s−1 according to the CDAW halo list
(https://cdaw.gsfc.nasa.gov/CME list/halo/halo.html). The halo CME was first observed at 23:10 UT by
SECCHI/COR1-A coronagraph. The first detection by the LASCO/C2 coronagraph occurred at 23:24 UT.
Gopalswamy et al. (2014) fitted a graduated cylindrical shell (GCS) model (Thernisien 2011) to the white-light
images of SOHO and STEREO and found the peak velocity of the CME flux rope to be 2464 km s−1. The GCS fitting
also indicated a possible deflection of the CME to the south. The halo CME was associated with an X1.1 soft X-ray
flare at S13W59 in NOAA active region 11515. The flare onset was at 23:01 UT and it reached the peak intensity at
4 Makela et al.
23:08 UT. A preceding CME with a sky-plane speed of 660 km s−1 from the same AR 11515 as the primary CME
was observed at 10:36 UT by LASCO/C2. This CME had a narrow width of 67◦ and it was associated with an M1.8
soft X-ray flare at S17W42. The progress of the halo CME from the low corona into IP space could be followed
by the SOHO/LASCO C2 and C3 coronagraphs (Brueckner et al. 1995) and STEREO/SECCHI COR1 and COR2
coronagraphs and the HI1 heliospheric imager (Howard et al. 2008). The relative locations of the SOHO (near Earth)
and STEREO spacecraft are shown in Fig. 1. The heliographic longitudes of STEREO-A and STEREO-B spacecraft
were W120 and E115, respectively. The arrow in Fig. 1 indicates the flare longitude of W59. Hence, the longitudinal
separation between the solar source (assumed to be the flare site) and the SOHO and STEREO-A spacecraft were
almost the same, 59◦ and 61◦, respectively. From the viewpoint of STEREO-B spacecraft, the eruption was nearly
perfectly back-sided event with the source separation angle of 174◦.
Gopalswamy et al. (2016) reported that the initial CME acceleration was 5.87 km s−2, the second largest among
SEP-producing CMEs in cycles 23 and 24 (see their Table 2). The CME initial speed was estimated to be > 3000
km s−1. Long et al. (2017) found that the EIT wave associated with the halo CME eruption had an unusually high
mean speed of 1106 km s−1 as observed by the Atmospheric Imaging Assembly (AIA; Lemen et al. 2012) on the Solar
Dynamics Observatory (SDO) and Extreme UltraViolet Imager (EUVI) of the SECCHI instrument suite on STEREO-
A spacecraft. The high speed of the EIT wave indicate that initial acceleration of the CME must have been high as
suggested by Gopalswamy et al. (2016). The fast CME acceleration is also consistent with the report by the Palehua
Solar Observatory of the Radio Solar Telescope Network (RSTN) that reported the onset of the metric type II burst
at 23:09 UT, only about one minute after the peak time of the flare. The relative timing of the peak of the X-ray flare
and the onset of the metric type II confirms the finding by Zhang et al. (2001) that the impulsive acceleration phase
of CMEs coincides with the rise phase of the associated flares. The metric type II radio burst was observed also by the
Culgoora and Hiraiso radio spectrographs. The measurements of the 2012 July 6 type II radio burst at the DH and
kilometric wavelengths are provided by the Wind/WAVES (Bougeret et al. 1995) and STEREO/WAVES (SWAVES)
(Bougeret et al. 2008) radio experiments. The top panel of Fig. 2 shows the combined plot of the Culgoora and WAVES
dynamic spectra, and the dynamic spectrum from the SWAVES experiment on the STEREO-A spacecraft is plotted in
the top panel of Fig. 3. The WAVES spectrum shows that the metric type II continued down at least to the frequency
of 8 MHz. The metric type II ends around 23:55 UT. The Wind data are from the RAD2 (1.075–13.825 MHz) and
RAD1 (20–1040 kHz) receivers of the WAVES experiment. In the SWAVES dynamic spectrum, the measurements in
the 125 kHz – 16.025 MHz range are from the High Frequency Receiver (HFR) and in the 2.5–160 kHz range from the
Low Frequency Receiver (LFR).The specialty of this event is that a second type II radio burst with a fundamental-harmonic structure is seen to
start at lower frequencies before the end of the metric type II burst. The top panel of Fig. 2, a narrow harmonic lane
is seen first around 23:25 UT just above 1 MHz. The fundamental lane is seen superposed in the beginning with the
dominant type III radio burst until about 23:40 UT. The fundamental emission component is more intense and the
frequency range is wider than those of the harmonic emission component that fades away around 00:15 UT on 2012
July 7. We like to emphasize that we have plotted the data of different receivers in arbitrary units and especially
we have adjusted the scaling of the data so that the fainter features, especially the narrow-band harmonic lane of
the lower frequency type II is clearly visible. The fundamental drifts slowly down to 350 kHz before it disappears
around 00:52 UT on 2012 July 7. The top panel of Fig. 3 shows similar overall behavior observed by SWAVES-A.
However, the intensity and the duration of the type II emission are reduced. The harmonic emission component is
almost invisible, and the fundamental emission component is seen to drift down to 400 kHz before fading away around
00:50 UT. The weaker intensity of type II emission measured by SWAVES-A could indicate that the type II emission
was more directed towards Wind spacecraft. In addition, the lower sensitivity due to shorter antennas affects the
STEREO radio observations. Measurements of both WAVES and SWAVES-A have short-duration data gaps.
For the DF analysis of the WAVES measurements, we use data only from the RAD1 receiver. Because the Wind
is a spinning spacecraft, the source location of the radio source relative to the Wind spacecraft is calculated from
the modulation of the antenna signal due to the spacecraft spin (Fainberg et al. 1972). In the case of the SWAVES
experiment, we analyze the HFR data. Contrary to the Wind spacecraft, the STEREO spacecraft are three-axis
stabilized, therefore, the arrival direction of the radio waves is estimated using the onboard-calculated autocorrelations
and cross-correlations of the antenna signals (see Martınez Oliveros et al. 2012a).
3. RESULTS

2012 July 6 Type II Radio Burst 5
10-1
100
101
102
Fre
qu
ency
[M
Hz]
Culgoora
WAVES
Type III
m-to-DH Type II
IP Type II
-15-10-505
1015
Lat
itu
de
[deg
]
NorthSouth
23:20 23:40 00:00 00:20 00:40 01:00Start Time (06-Jul-12 23:00:00)
-10
0
10
Lo
ng
itu
de
[deg
]
WestEast
624 kHz 548 kHz 484 kHz 428 kHz
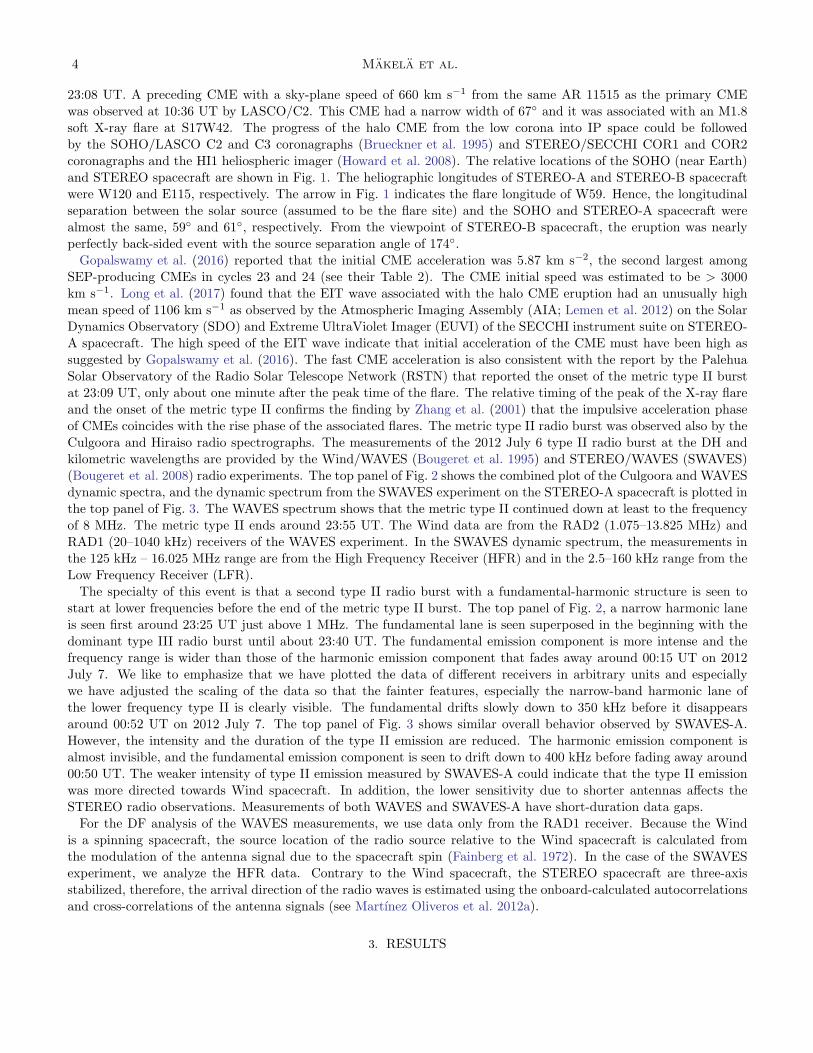
Figure 2. Results of the DF analysis of the Wind/WAVES measurements at four frequencies between 428 kHz and 624 kHz.The top-most panel shows the combined Culgoora and Wind/WAVES radio dynamic spectra. The type III, the m-to-DH andIP type II radio bursts are indicated. The white horizontal lines mark the four frequencies used in the DF analysis. The twolower panels shows the DF results for the radio source location: the latitude relative to the ecliptic plane and the longituderelative to the Sun-spacecraft direction.
6 Makela et al.
The lower panels of Fig. 2 summarize the DF results for the WAVES instrument on the Wind spacecraft. We used
four frequencies of 624 kHz, 548 kHz, 484 kHz, and 428 kHz for the DF analysis. The white horizontal lines on the top
panel of Fig. 2 mark the measurement frequencies. The middle panel shows direction of the oncoming radio emission
as the latitude relative to the ecliptic plane and the bottom panel as the longitude relative to the Sun-Wind line. In
the beginning, emission from the type III radio burst dominates at all four frequencies, but around and after the end
of the data gap at 00 UT July 7, the emissions observed at the four frequencies are mostly type II emission. Because
the accuracy and reliability of the DF analysis depends on the signal-to-noise ratio, the highest frequency of 624 kHz
is useful only for a brief period after the data gap until about 00:05 UT, whereas the signal at the lowest frequency
becomes strong enough after about 00:15 UT on July 7, and lasts until the type II bursts fade away around 00:50
UT. The middle panel of Fig. 2 reveals that the latitude of the type II source direction does not have large differences
between the four frequencies. Whereas, the longitude plot at the bottom panel of Fig. 2 shows that the type II source
has the most western location relative to the Sun-Wind line at the lowest frequency of 428 kHz. The westernmost
location is in agreement with the decrease in the electron density of the plasma as a function of the distance, which
entails that the type II radio source at the lowest frequency should have the largest distance from the Sun.
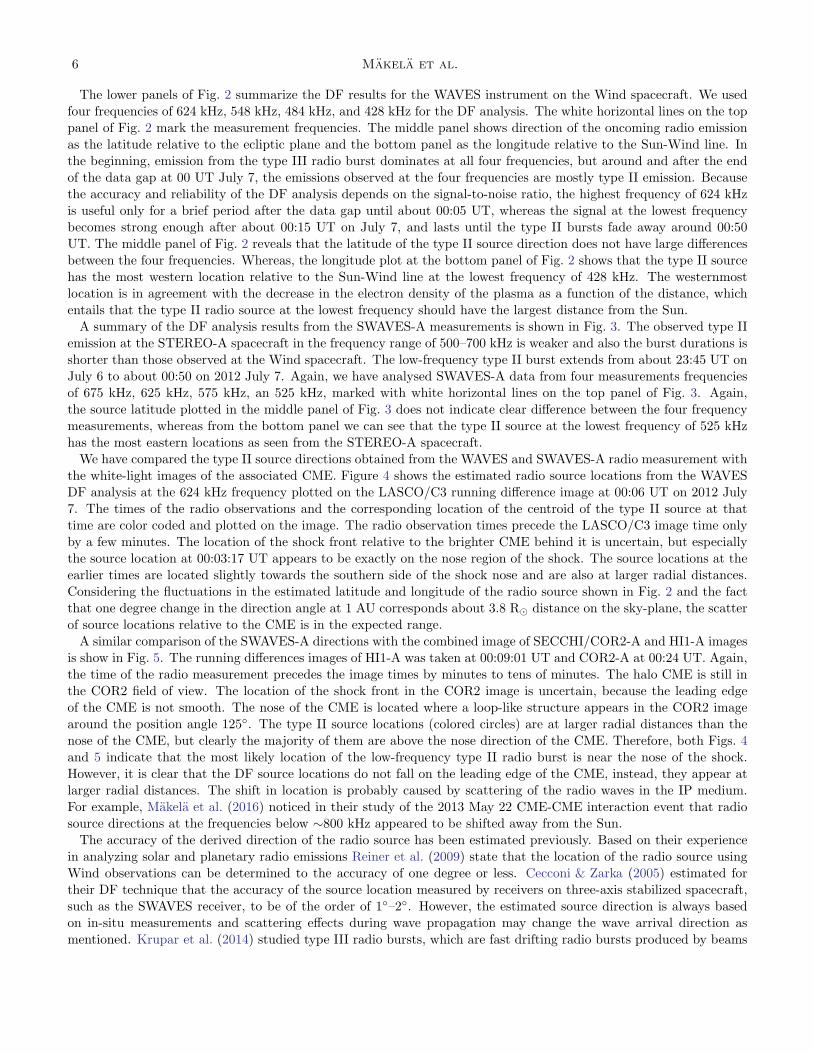
A summary of the DF analysis results from the SWAVES-A measurements is shown in Fig. 3. The observed type II
emission at the STEREO-A spacecraft in the frequency range of 500–700 kHz is weaker and also the burst durations is
shorter than those observed at the Wind spacecraft. The low-frequency type II burst extends from about 23:45 UT on
July 6 to about 00:50 on 2012 July 7. Again, we have analysed SWAVES-A data from four measurements frequencies
of 675 kHz, 625 kHz, 575 kHz, an 525 kHz, marked with white horizontal lines on the top panel of Fig. 3. Again,
the source latitude plotted in the middle panel of Fig. 3 does not indicate clear difference between the four frequency
measurements, whereas from the bottom panel we can see that the type II source at the lowest frequency of 525 kHz
has the most eastern locations as seen from the STEREO-A spacecraft.
We have compared the type II source directions obtained from the WAVES and SWAVES-A radio measurement with
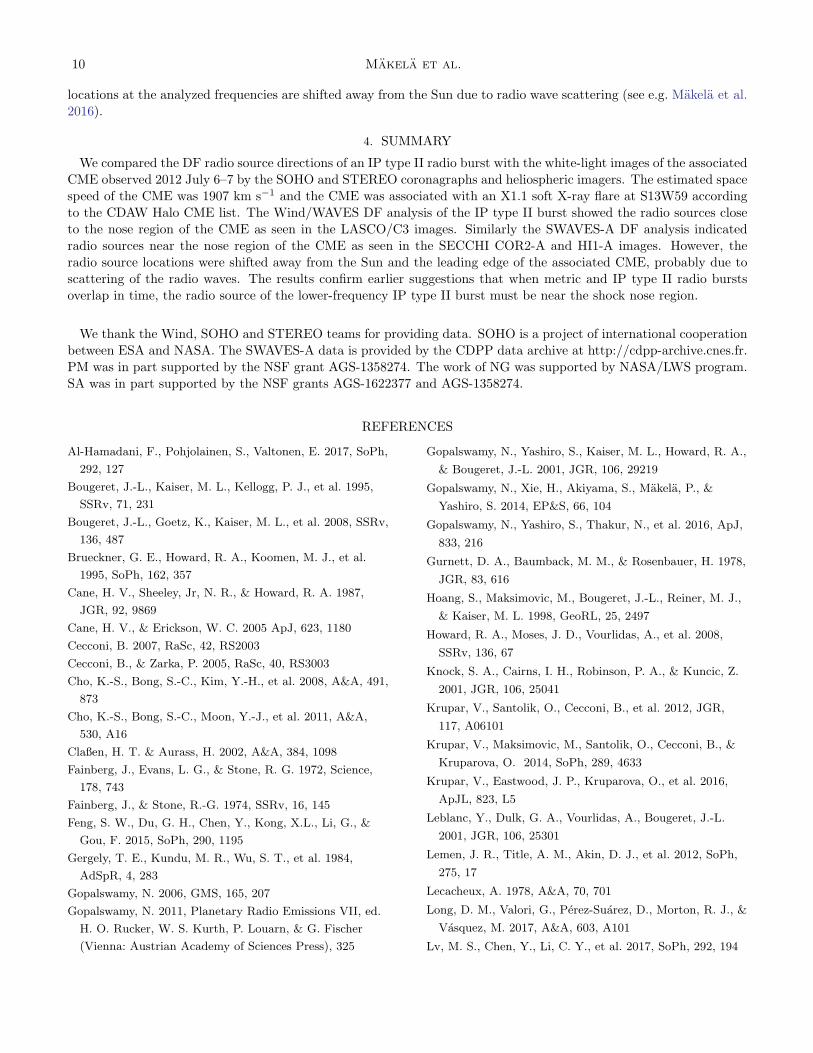
the white-light images of the associated CME. Figure 4 shows the estimated radio source locations from the WAVES
DF analysis at the 624 kHz frequency plotted on the LASCO/C3 running difference image at 00:06 UT on 2012 July
7. The times of the radio observations and the corresponding location of the centroid of the type II source at that
time are color coded and plotted on the image. The radio observation times precede the LASCO/C3 image time only
by a few minutes. The location of the shock front relative to the brighter CME behind it is uncertain, but especially
the source location at 00:03:17 UT appears to be exactly on the nose region of the shock. The source locations at the
earlier times are located slightly towards the southern side of the shock nose and are also at larger radial distances.
Considering the fluctuations in the estimated latitude and longitude of the radio source shown in Fig. 2 and the fact
that one degree change in the direction angle at 1 AU corresponds about 3.8 R⊙ distance on the sky-plane, the scatter
of source locations relative to the CME is in the expected range.
A similar comparison of the SWAVES-A directions with the combined image of SECCHI/COR2-A and HI1-A images
is show in Fig. 5. The running differences images of HI1-A was taken at 00:09:01 UT and COR2-A at 00:24 UT. Again,
the time of the radio measurement precedes the image times by minutes to tens of minutes. The halo CME is still in
the COR2 field of view. The location of the shock front in the COR2 image is uncertain, because the leading edge
of the CME is not smooth. The nose of the CME is located where a loop-like structure appears in the COR2 image
around the position angle 125◦. The type II source locations (colored circles) are at larger radial distances than the
nose of the CME, but clearly the majority of them are above the nose direction of the CME. Therefore, both Figs. 4
and 5 indicate that the most likely location of the low-frequency type II radio burst is near the nose of the shock.However, it is clear that the DF source locations do not fall on the leading edge of the CME, instead, they appear at
larger radial distances. The shift in location is probably caused by scattering of the radio waves in the IP medium.
For example, Makela et al. (2016) noticed in their study of the 2013 May 22 CME-CME interaction event that radio
source directions at the frequencies below ∼800 kHz appeared to be shifted away from the Sun.
The accuracy of the derived direction of the radio source has been estimated previously. Based on their experience
in analyzing solar and planetary radio emissions Reiner et al. (2009) state that the location of the radio source using
Wind observations can be determined to the accuracy of one degree or less. Cecconi & Zarka (2005) estimated for
their DF technique that the accuracy of the source location measured by receivers on three-axis stabilized spacecraft,
such as the SWAVES receiver, to be of the order of 1◦–2◦. However, the estimated source direction is always based
on in-situ measurements and scattering effects during wave propagation may change the wave arrival direction as
mentioned. Krupar et al. (2014) studied type III radio bursts, which are fast drifting radio bursts produced by beams

2012 July 6 Type II Radio Burst 7
0.1
1.0
10.0F
req
uen
cy [
MH
z]SWAVES A
-15-10-505
1015
Lat
itu
de
[deg
]
NorthSouth
23:20 23:40 00:00 00:20 00:40 01:00Start Time (06-Jul-12 23:00:00)
-15-10-505
1015
Lo
ng
itu
de
[deg
]
WestEast
675 kHz 625 kHz 575 kHz 525 kHz
Figure 3. Results of the DF analysis of the SWAVES-A measurements at four frequencies between 525 kHz and 675 kHz. Thetop-most panel shows the SWAVES-A radio dynamic spectra. The white horizontal lines mark the four frequencies used in theDF analysis. The two lower panels shows the DF results for the radio source location: the latitude relative to the ecliptic planeand the longitude relative to the Sun-spacecraft direction.
of flare-accelerated electrons propagating along the Parker spiral of the IP magnetic field. In addition, the radio
emission of type III bursts is more intense than that of type II bursts, which make them more suitable for DF analysis.

8 Makela et al.
LASCO/C3: 2012/07/07 00:06 UTWAVES/624 kHz00:00:14 UT00:01:00 UT00:01:46 UT00:02:31 UT00:03:17 UT
Figure 4. The radio source locations over-plotted on the LASCO/C3 running difference image at 00:06 UT on 2012 July 7suggest that the nose region of the CME propagating towards south-west in the LASCO field of view was the source of the IPtype II emission.
In their statistical study of a large set of type III bursts, Krupar et al. (2014) found a good agreement between the
Parker spiral and the source locations of type III bursts estimated at frequencies above 700 kHz. But they also suggestthat at lower frequencies the radio source locations are shifted due to scattering effects during radio wave propagation.
Another issue that might affect the source location estimates is the spatial extent of the radio source. The distribution
of the emission intensity within the source region or how it might evolve over time are also poorly known. The different
DF techniques usually assume a point-like radio source, when deriving the source direction. Because type II radio
burst are associated with CME-driven shock, which are large-scale structures, it is likely that the radio source is
extended instead of being point-like. However, Cecconi (2007) investigated the location error of extended radio sources
measured by a three-axis stabilized spacecraft and found that for radio sources with an angular half width smaller
than 5◦ the source direction errors are about 1◦ or less. These results are similar to the results obtained in the earlier
study by Cecconi & Zarka (2005), where they assumed a point-like structure. Because the apparent size of the radio
source, which can be also derived from DF analysis, includes both spatial extent and wave propagation effects, the
interpretation of the obtained result is difficult and beyond our analysis.

2012 July 6 Type II Radio Burst 9
HI1-A 2012/07/07 00:09:01 UT COR2-A 00:24 UTSWAVES-A625 kHz23:57:54 UT23:58:33 UT23:59:11 UT23:59:50 UT00:00:29 UT00:01:08 UT00:01:47 UT00:02:26 UT00:03:04 UT00:03:43 UT00:04:22 UT
Figure 5. The radio source locations over-plotted on the combined HI1-A (00:09 UT) and COR2-A (00:24 UT) runningdifference images on 2012 July 7 suggest that the nose region of the CME propagating towards south-east in the STEREO fieldof view was the source of the IP type II emission.
Triangulation can be used to estimate the source location in 3D space if one can obtain the DF source directions
from two or more spacecraft at separate locations. However, the analyzed frequencies must be close enough, otherwise
the type II emission cannot originate from the same source location, because the electron number density levels
corresponding to each frequency are too far apart. In our case, only the pair of SWAVES-A and WAVES frequencies at
625 kHz and 624 kHz are close enough for us to attempt triangulation. Unfortunately, the WAVES measurements had
a data gap before 00:00 UT on 2012 July 7. However, for the short period after the 00:00 UT until about 00:06 UT onJuly 7 both SWAVES-A and WAVES observed a strong signal of type II emission at these frequencies. The average
latitude and longitude of the radio source from SWAVES-A measurement during this time period were -5.2◦ and -6.6◦,
respectively. The minus sign indicates that the source directions was south of the ecliptic plane and towards east from
the STEREO-A-Sun line. The average latitude and longitude obtained from WAVES measurement were -4.3◦ and
2.4◦, respectively. Therefore, the source was seen from Wind spacecraft to be south of the ecliptic and towards west
of the Wind-Sun line. The lines drawn from the spacecraft along the apparent source directions do not cross each,but the nearest points of the two lines can be calculated. The radial distance of the type II source calculated from
the midpoint of the line connecting the two nearest points is about 26.9 R⊙. This is much larger distance than the
measured CME height around that time. The sky-plane height of the CME leading edge measured from LASCO/C3
image at 00:06 UT was 11.81 R⊙. If we apply a simple projection effect correction to this apparent height by dividing
it by sin(59◦), because the longitude of the solar source (flare) was at W59, we get an estimated CME height of 13.8
R⊙. Another simple method to correct the projection effects in the CME height measurements is to multiply the
measured sky-plane height by the ratio of the space speed to the sky-plane speed. If we use the CME peak speed
estimated by Gopalswamy et al. (2016) using the GCS model fitting, we obtain the corrected height of 15.9 R⊙ for the
CME leading edge. Even if we take into account the stand-off distance of the shock front, the radial distance obtained
from triangulation is larger than the CME height estimated from the white-light images. The discrepancy between
the radial distance from radio measurements and the white-light measurements likely indicates that the DF source
10 Makela et al.
locations at the analyzed frequencies are shifted away from the Sun due to radio wave scattering (see e.g. Makela et al.
2016).
4. SUMMARY
We compared the DF radio source directions of an IP type II radio burst with the white-light images of the associated
CME observed 2012 July 6–7 by the SOHO and STEREO coronagraphs and heliospheric imagers. The estimated space
speed of the CME was 1907 km s−1 and the CME was associated with an X1.1 soft X-ray flare at S13W59 according
to the CDAW Halo CME list. The Wind/WAVES DF analysis of the IP type II burst showed the radio sources close
to the nose region of the CME as seen in the LASCO/C3 images. Similarly the SWAVES-A DF analysis indicated
radio sources near the nose region of the CME as seen in the SECCHI COR2-A and HI1-A images. However, the
radio source locations were shifted away from the Sun and the leading edge of the associated CME, probably due to
scattering of the radio waves. The results confirm earlier suggestions that when metric and IP type II radio bursts
overlap in time, the radio source of the lower-frequency IP type II burst must be near the shock nose region.
We thank the Wind, SOHO and STEREO teams for providing data. SOHO is a project of international cooperation
between ESA and NASA. The SWAVES-A data is provided by the CDPP data archive at http://cdpp-archive.cnes.fr.
PM was in part supported by the NSF grant AGS-1358274. The work of NG was supported by NASA/LWS program.
SA was in part supported by the NSF grants AGS-1622377 and AGS-1358274.
REFERENCES
Al-Hamadani, F., Pohjolainen, S., Valtonen, E. 2017, SoPh,
292, 127
Bougeret, J.-L., Kaiser, M. L., Kellogg, P. J., et al. 1995,
SSRv, 71, 231
Bougeret, J.-L., Goetz, K., Kaiser, M. L., et al. 2008, SSRv,
136, 487
Brueckner, G. E., Howard, R. A., Koomen, M. J., et al.
1995, SoPh, 162, 357
Cane, H. V., Sheeley, Jr, N. R., & Howard, R. A. 1987,
JGR, 92, 9869
Cane, H. V., & Erickson, W. C. 2005 ApJ, 623, 1180
Cecconi, B. 2007, RaSc, 42, RS2003
Cecconi, B., & Zarka, P. 2005, RaSc, 40, RS3003
Cho, K.-S., Bong, S.-C., Kim, Y.-H., et al. 2008, A&A, 491,
873
Cho, K.-S., Bong, S.-C., Moon, Y.-J., et al. 2011, A&A,
530, A16
Claßen, H. T. & Aurass, H. 2002, A&A, 384, 1098
Fainberg, J., Evans, L. G., & Stone, R. G. 1972, Science,
178, 743
Fainberg, J., & Stone, R.-G. 1974, SSRv, 16, 145
Feng, S. W., Du, G. H., Chen, Y., Kong, X.L., Li, G., &
Gou, F. 2015, SoPh, 290, 1195
Gergely, T. E., Kundu, M. R., Wu, S. T., et al. 1984,
AdSpR, 4, 283
Gopalswamy, N. 2006, GMS, 165, 207
Gopalswamy, N. 2011, Planetary Radio Emissions VII, ed.
H. O. Rucker, W. S. Kurth, P. Louarn, & G. Fischer
(Vienna: Austrian Academy of Sciences Press), 325
Gopalswamy, N., Yashiro, S., Kaiser, M. L., Howard, R. A.,
& Bougeret, J.-L. 2001, JGR, 106, 29219
Gopalswamy, N., Xie, H., Akiyama, S., Makela, P., &
Yashiro, S. 2014, EP&S, 66, 104
Gopalswamy, N., Yashiro, S., Thakur, N., et al. 2016, ApJ,
833, 216
Gurnett, D. A., Baumback, M. M., & Rosenbauer, H. 1978,
JGR, 83, 616
Hoang, S., Maksimovic, M., Bougeret, J.-L., Reiner, M. J.,
& Kaiser, M. L. 1998, GeoRL, 25, 2497
Howard, R. A., Moses, J. D., Vourlidas, A., et al. 2008,
SSRv, 136, 67
Knock, S. A., Cairns, I. H., Robinson, P. A., & Kuncic, Z.
2001, JGR, 106, 25041
Krupar, V., Santolik, O., Cecconi, B., et al. 2012, JGR,
117, A06101
Krupar, V., Maksimovic, M., Santolik, O., Cecconi, B., &
Kruparova, O. 2014, SoPh, 289, 4633
Krupar, V., Eastwood, J. P., Kruparova, O., et al. 2016,
ApJL, 823, L5
Leblanc, Y., Dulk, G. A., Vourlidas, A., Bougeret, J.-L.
2001, JGR, 106, 25301
Lemen, J. R., Title, A. M., Akin, D. J., et al. 2012, SoPh,
275, 17
Lecacheux, A. 1978, A&A, 70, 701
Long, D. M., Valori, G., Perez-Suarez, D., Morton, R. J., &
Vasquez, M. 2017, A&A, 603, A101
Lv, M. S., Chen, Y., Li, C. Y., et al. 2017, SoPh, 292, 194
2012 July 6 Type II Radio Burst 11
Magdalenic, J., Marque, C., Krupar, V., et al. 2014, ApJ,
791, 115
Malitson, H. H., Fainberg, J., & Stone, R. G. 1973, ApJ,
183, L35
Makela, P., Gopalswamy, N., Reiner, M. J. 2016, ApJ, 827,
141
Mancuso, S., & Raymond, J. C. 2004, A&A, 202, 363
Manning, R., & Fainberg, J. 1980, SSI, 5, 161
Martınez Oliveros, J. C., Lindsey, C., Bale, S. D., &
Krucker, S. 2012a, SoPh, 279, 153
Martınez Oliveros, J. C., Raftery, C. L., Bain, H. M., et al.
2012b, ApJ, 748, 66
Martınez Oliveros, J. C., Raftery, C., Bain, H., et al. 2015,
SoPh, 290, 891
Maxwell, A., & Dryer, M. 1982, SSRv, 32, 11
Melrose, D. B. 1980, SSRv, 26, 3
Nelson, G. J., & Melrose, D. B., 1985, in Solar radiophysics:
Studies of emission from the sun at metre wavelengths,
ed. D. J. McLean & N. R. Labrum (Cambridge and New
York: Cambridge University Press), 333
Payne-Scott, R., Yabsley, D. E., & Bolton, J. G. 1947,
Nature, 160, 256
Ramesh, R., Anna Lakshmi, M., Kathiravan, C.,
Gopalswamy, N., & Umapathy, S. 2012, ApJ, 752, 107
Raymond, J. C., Thompson, B. J., St. Cyr, O. J., et al.
2000, GeoRL, 27, 1439
Reiner, M. J., & Stone, R. G. 1988, A&A, 206, 316
Reiner, M. J., Kaiser, M. L., Fainberg, J., & Stone, R. G.
1998, JGR, 103, 29651
Reiner, M. J., Kaiser, M. L., Gopalswamy, N., et al. 2001,
JGR, 106, 25279
Reiner, M. J., Goetz, K., Fainberg, M. L., et al. 2009,
SoPh, 259, 255
Robinson, R. D., & Sheridan, K. V. 1982, PASAu, 4, 392
Santolık, O., Parrot, M., & Lefeuvre, F. 2003, RaSc, 38,
1010
Shen, C., Liao, C., Wang, Y., Ye, P. & Wang, S. 2013,
SoPh, 282, 543
Thernisien, A. 2011, ApJS, 194, 33
Vrsnak, B. & Cliver, E. W. 2008, SoPh, 253, 215
Wild, J. P. & McCready, L. L. 1950, AuSRA, 3, 387
Zhang, J., Dere, K. P., Howard, R. A., Kundu, M. R., &
White, S. M. 2001, ApJ, 559, 452
Zimovets, I. V. & Sadykov, V. M. 2015, AdSpR, 56, 2811