pesticide risk indicators at national level and farm … risk indicators at national level and farm...
TRANSCRIPT
PMNr 6/04
Pesticide Risk Indicators at NationalLevel and Farm Level
– A Swedish Approach –
Peter Bergkvist

Pesticide Risk Indicators at NationalLevel and Farm Level
– A Swedish Approach –
Peter Bergkvist

Order No. 510 793Sundbyberg, September 2004Publisher: Swedish Chemicals InspectorateOrder address: Telefax + 46 8 735 76 98, e-mail [email protected]

CONTENT
Summary 1 Introduction 1 Methodology 2
Hazard scoring 2 Exposure scoring 4 Data on use intensity 4 Reduction factors 5 Consumer risks 5
Formula 6 PRI-Nation (Pesticide Risk Indicators at National level) 6 PRI-Farm (Pesticide Risk Indicators at Farm level) 6
Results 9 PRI-Nation 9
Figure 7. Sum of Risk Indicators compared with the number of hectare doses during 1986-2003. 9
PRI-Farm 10 Ideas for future improvements 10 Summary in Swedish 10 References 11
Appendix I - Tables and Figures 13 Table 1. Environment Toxicity Score (ET) 13 Table 2. Operator Toxicity Score (OT) 13 Table 3. Application Method Score (AME, AMO) 14 Table 4. Spray drift values sampled at bare soil at 5 meters distance from the applicator in percent of used amounts, based on 90th percentile calculations. 14 Table 5. Formulation Type Score (FT) 15 Table 6. The impact from different application methods on the absorbed dose from dermal and inhalation exposure. No personal protective equipment used. 15 Table 7. The impact from different formulations and personal protective equipment (PPE) on the absorbed dose from dermal and inhalation exposure during mixing/loading and application with a tractor-mounted/trailed boom sprayer (hydraulic nozzles). 16 Figure 1. Ratio between the dose rate and the effect level on Lemna sp. of two chemical groups of herbicides, with the best fit regression line shown. 16 Figure 2. Ratio between the dose rate and the effect level on Daphnia sp. of two chemical groups of insecticides, with the best fit regression line shown. 17 Figure 3. Persistence Score (P) 17 Figure 4. Bioaccumulation Score (B) 18 Figure 5. Mobility Score (M) 18 Figure 6. Distribution of Leaching Index Score (LI) among 232 pesticides. 19

1
Summary
This paper describes the methodology behind two pesticide1 risk indicator systems, PRI-Nation and PRI-Farm, used in Sweden. PRI-Nation is intended to monitor impact of pesticide risk reduction policies on a national scale, whereas the purpose with PRI-Farm is to follow up pesticide risk trends at individual farms. Both models are based on the same approach, where data on hazard and exposure is scored and combined with data on use intensity. The weighting procedure included is based on field data (where available), expert judgements or policy assessments. The result is aggregated to a single score for each substance or treatment with the intention to indicate environmental and operator health risks respectively. However, the indicator score or sum does not quantify actual pesticide risks. Instead, the purpose is to indicate trends in potential risks at national level and farm level.
Initial tests carried out on a number of farms have shown that the PRI-Farm model is considered user friendly and that it can be a useful tool for it purposes.
If the sum of risk indicators is compared to the use intensity during 1986 to 2003 there has been a clear decrease in the risk indicators, particularly regarding operator health risk, according to the PRI-Nation model. Several factors may explain the trend towards lower risks, for instance advisory service on integrated pest management, successful regulatory activities and product developments are pointed out as possible promoters.
Areas where future improvements of the models are particularly needed are also proposed in the paper. The two models will complement each other for the time being. However, in the long term, the intention is to aggregate results from the farm level in order to use them to express risk trends also at the national level.
Introduction
The Swedish Chemicals Inspectorate has developed two systems intended to track risk trends over time by calculating pesticide risk indicators � Pesticide Risk Indicators at National level (PRI-Nation) and Pesticide Risk Indicators at Farm level (PRI-Farm). The first system, PRI-Nation, was initiated in 1996 with the main objective to monitor impact of pesticide policies established in the national risk reduction programme (OECD, 1999a). It has been in use since 1997 with annual updating and reporting on the national progress. The second system, PRI-Farm, was developed during 2003 and 2004 with the main purpose to follow up pesticide risk trends at individual farms and to compare pesticide risks on different production systems. The aim with PRI-Farm is to use a more realistic approach by defining local exposure conditions. One important aspect is that by using these tools, farmers can check their own progress in relation to risk reduction, which may increase their awareness, interest and participation in the national risk reduction programmes.
1 The term �pesticides� is used in this paper as a synonym of plant protection products.

2
Recommendations from the 2nd OECD Workshop on Pesticides Risk Indicators (OECD, 1999b) and the European CAPER Project (CLM, 1999) have served as guidance during the development of the two indicators. During the work, focus has been given to create a system that is robust from both a scientific and an administrative point of view.
The work on the PRI-Farm model has been performed in co-operation with representatives of different interest groups such as farmers, industry, authorities and research institutions. Initial tests have been carried out on a number of so called Pilot Farms with the aim to gather experience on practical farm use. These tests were performed under the leadership of �Odling i Balans� (www.odlingibalans.com). The PRI-Farm computer programme was considered user friendly by the farmers and the results were thought to be useful to follow up pesticide risk trends at individual farms. However, some improvements of the model were also proposed, see the section on Ideas for future improvements.
Methodology During the development of PRI-Farm, the methodology used for PRI-Nation was also amended to increase coherence between the two systems. They are based on the same principal, where data on hazard and exposure is scored and combined with use intensity data. Two types of indicators are used, one related to the fate and impact on ecosystems and one related to operator health. Each of the active substances included in nationally approved pesticide products at any time during the period 1986 to 2004 (a total of 240 active substances) has been scored in accordance with the criteria described in this paper. While PRI-Nation is expressed as the nation-wide sum of environment or operator health risk indicators for all substances each year, PRI-Farm provide a risk indicator for each treatment expressed as the indicator sum of a crop or a field on a particular farm.
Hazard scoring Data sources for hazard properties are;
1. List of endpoints in finalized EU review reports 2. EU assessment reports (monographs) 3. National assessment reports
If available, mean values of the endpoints DT50, BCF, Kow and Koc are used in the scoring of persistence (P), bioaccumulation (B) and mobility (M). The calculation of the hazard score on each active substance is only made in the PRI-Nation database and the score is subsequently exported to the PRI-Farm database. This process is intended to guarantee identical hazard scoring in both systems. Persistence, bioaccumulation and mobility are properties considered to be of particular importance in the assessment of pesticide environmental hazards. The scoring of these properties is based on the Swedish policy, as expressed in the report �Principles for Identifying Unacceptable Pesticides� (Andersson et. al. 1992). Swedish policy regarding highly persistent and bioaccumulative substances is based on concerns that such substances may accumulate in various environmental compartments, including biota, and that the effects of such accumulation are unpredictable in the long-term, and that such accumulation would be practically impossible to reverse. The endpoint for mobility, sorption parameter Koc, is

3
primarily intended to be used in ranking pesticides according to their potential for leaching to ground water, see leaching index score (LI). However, it does also reflect the risk of transport of the substance outside the treated field by surface run-off or by drainage, either dissolved in water or bound to soil particles. Some active substances degrade immediately in soil to toxicological significant metabolites, which also can be described as active substances. Environmental data from these active metabolites has preferably been used instead of the corresponding parent substances. This approach has for instance been applied for furathiocarb and carbosulfan forming carbofuran and substances belonging to the benzimidazole group forming methyl-carbendazim rapidly. Missing data and poor quality data have been approached in different ways during the input work. However, cases with no data at all were limited to environmental fate and mainly old substances no longer included in any approved pesticide products. If possible, calculated theoretical values were included, based on physical and chemical properties. If not possible, average endpoint values from all substances were used instead. The environmental toxicity (ET) and operator toxicity score (OT) in the PRI-Nation and PRI-Farm model are based on the hazard labelling of the corresponding products selected to represent each active substance. The weighting of hazard properties according to classification and labelling is an area showing considerable diversity in different indicator model applications. An interesting approach is to quantify from an economic perspective the burden of disease by trying to estimate the disability that may be induced by different chemicals (Future Competence, 2004). Some of these ideas have been taken into account in the simple approach that has been used in the PRI-Nation and PRI-Farm model. However, some assumptions in the �disability estimate study� were considered not relevant to plant protection products, which made the proposed approach difficult to adopt completely. High acute toxicity, indicated by the category �Very Toxic� (T+), has been given the highest score followed by chronic toxicity, such as cancer and hazards related to reprotoxicity and genetic damage. No attempt has been made to differentiate between the different chronic toxicity hazards. Instead they are given the same weight. The hazard properties are assumed to be additive, as well as the corresponding hazard scoring for each substance. The hazard scores for an active substance are transformed to a mono-component product by a 1:1 ratio. For so called combination products consisting of more than one active substance, the hazard score for each substance is attributed to the product at a ratio of its share in the product. Example: Product X consists of 60 % of active substance A and 40 % of active substance B. The score for product X = 0,6 * (Hazard score)A + 0,4 * (Hazard score)B. For a number of pesticide products already withdrawn from the market, the classification and labelling were not updated in the registration process. However, since many of them probably would be assigned more stringent labelling provisions if the approvals instead had been renewed, these provisions have been amended afterwards to make the input data more adequate.

4
Exposure scoring In contrary to hazard factors, exposure related factors differ between the two systems. PRI-Nation is based on general assumptions on a particular representative exposure for each active substance on a large scale whereas PRI-Farm makes it possible to specify exposure conditions for each use. Therefore, PRI-Farm has a more realistic approach generating a more balanced risk indicator. The exposure scoring is related to formulation type (FT), application method (AME, AMO), the dose rate as being a part of the leaching index score (LI) and winter application (WA). The latter refers to the timing of application with the intention to indicate the impact from reduced soil temperatures on the degradation rate (Magnusson, 1997; FOCUS, 1997). The monitoring result score (MR) is used as an additional factor in the calculation of PRI-Nation, in order to reflect leaching problems at a national scale. This approach has not been required for in PRI-Farm, since site-specific soil properties related to permeability are taken into account in PRI-Farm. The application method plays a key roll in the exposure scoring of both the environment and the operator health risk indicators. Environment exposure is primarily related to estimates on spray drift values (BBA, 2004) and operator exposure is derived from estimates on absorbed dose based on field data used in an exposure model (UKPOEM, 1992). However, reliable exposure data is lacking for several different application methods, formulation types etcetera. In these cases, the exposure weighting has been based on expert judgement. The Hazard/Exposure scoring ratio is less than one (1) during average use scenarios based on substances with medium hazard scores formulated as liquid concentrates and applied with a tractor-mounted boom sprayer. This indicates that exposure related factors are generally given more weight compared with the inherent hazard properties in both models. However, in the PRI-Farm model there is an option to significantly reduce the exposure scoring if certain preventive measures are applied, see the section on Reduction factors.
Data on use intensity
In PRI-Nation, data on the use intensity of each active substance is expressed as the total number of hectare doses the annual sold amount of the substance theoretically could yield. Dividing the sales data with the recommended dose rate in the most representative crop and use situation makes the calculation. The total number of doses reflects the number of applications for each substance. This is also related to the number of exposure situations when operations such as loading, mixing and cleaning of sprayers occur. Several investigations have shown the importance of these operations in relation to unintentional exposure of operators (EUROPOEM, 2002) and the environment (surface water and groundwater) (Kreuger & Nilsson, 2001). Therefore, a risk element can be seen in this context. The treatment frequency score (TF) has been included as an additional factor in the calculation of PRI-Nation, in order to burden pesticides used repeatedly on each crop. In PRI-Farm, the actual hectare dose for a particular product is used in the calculations. However, it is only used to reflect the intensity by calculating the Dose Area Index (DAI) (Nilsson, 2001) and the Leaching Index score (LI), as it is included in the Sci-Grow formula. In general, no attempt has been made to relate the dose rates to the effect levels of non-target organisms for each substance. Instead, it is assumed that the Dose Area Index (DAI) will give

5
a reasonable indication of the risk for non-target organisms. This pragmatic approach is based on both administrative and scientific reasons. The administrative reason is that ecotoxicity data often are considerable in terms of number of endpoints and organisms tested. New studies are also frequently submitted for registration purposes. These circumstances make the ecotoxicity data very difficult to handle in the calculation of indicators. Instead, the approach taken is based on the assumption that the ratio between the dose rate and the effect levels of non-target organisms is within the same range for many substances. High-dose and low-dose herbicides have been compared in this respect. The average dose rate between phenoxy acids and sulphonyl ureas differs by a factor of 135, while the ratio between the dose rate and the effect level (EC50) on Lemna sp. are within the same range (Figure 1). A similar connection can also be seen between high-dose and low-dose insecticides (Figure 2). The approach taken may be valid for certain chemical classes of pesticides but certainly not for all pesticides. The dose rate is not used in the calculation of the operator health risk indicator. The reason is that only a few AOELs (Acceptable Operator Exposure Levels) have been established so far by using a harmonized approach, as being the case in the EU review programme of active substances. Since it is not possible to make these estimations for all substances or at least a majority of them, the use of this endpoint will be postponed for the time being. The AT (Area Treated) is used in the calculation of the operator health risk indicator with the aim to reflect the duration of the exposure during application.
Reduction factors A set of reduction factors related to different preventive measures is used in the calculation of the environment and the operator health risk indicators. Environment exposure can be reduced up to 40 % if certain practices are followed with the intention to reduce risk of surface and ground water contamination and impact on other vulnerable areas. Operator exposure can be reduced considerably, up to 90 %, if protective equipment is used consequently during mixing, loading and application. These values are derived from the United Kingdom Predictive Operator Exposure Model (UKPOEM, 1992). An additional reduction of 30 % can be achieved on environment and operator exposure if particular equipment is used with the aim to reduce the risk of spillage during the filling of the sprayer. The idea behind using significant larger reduction factors for operator exposure compared with environment exposure is to reflect the more favourable opportunities farmers have to reduce their own exposure mainly by using personal protective equipment. The same protection opportunities in general do not exist for the environment where pesticides are deliberately released.
Consumer risks
Consumer and animal health risks are not covered by the indicators. The main reason for this delimitation is that the National Food Administration considers pesticides residues in domestic produce to be of low concern regarding consumer risks. This is indicated by the fact that residues very seldom exceed the maximum residue levels (often less than 1 percent) in domestically grown fruits, vegetables and cereals. Nor has the control of pesticide residues in animal feed indicated any problem that motivates a routine based monitoring.

6
Formula
PRI-Nation (Pesticide Risk Indicators at National level)
PRI-Farm (Pesticide Risk Indicators at Farm level)
Where; Term Explanation Score
Min-Max
Referring to
Hazard scoring ET Environment Toxicity score (aquatic and terrestrial ecotoxicity)
is primarily based on the hazard labelling of the corresponding products selected to represent each active substance. The result is expressed as the sum of score for each substance.
1-11 Table 1
OT The short and long-term Operator Toxicity score related to operator hazard is primarily based on the hazard labelling of the corresponding products selected to represent each active substance. The result is expressed as the sum of score for each substance.
1-73 Table 2
P The potential Persistence score (based on lab and field DT50soil). To achieve a Persistence score between 0 and 5, the following formula is used for mean DT50 values; DT50 < 12,5 days = 0 DT50 ≥ 12,5 and ≤ 216 days = Ln (DT50 / 12,5) / 0,566 DT50 > 216 days = 5
0-5 Figure 3
Environment Risk Indicator =
Σ(SQ * RDR-1 * (ET + P + B + M) * AME * TF * MR * LI)
Operator Health Risk Indicator =
Σ(SQ * RDR-1 * OT * FT * TF * AMO)
Environment Risk Indicator =
AT * DAI * (ET + P + B + M) * AME * WA * PME * LI * (1+(PSA/AT))2
Operator Health Risk Indicator =
AT * OT * FT * AMO * PMO

7
Term Explanation Score Min-Max
Referring to
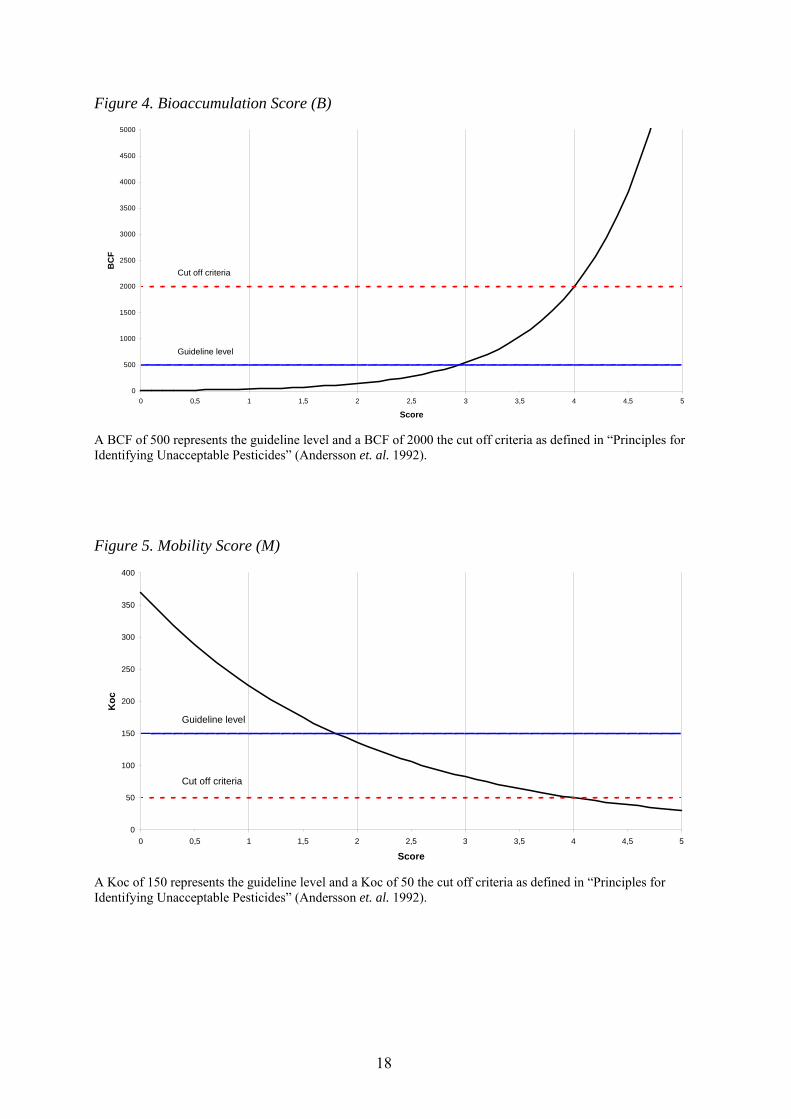
B The potential Bioaccumulation score (based on log Kow and BCF). To achieve a Bioaccumulation score between 0 and 5, the following formula is used for mean BCF and mean Kow values, expressed as the maximum of either BCF or Kow score; BCF < 11 = 0 BCF ≥ 11 and ≤ 7316 = Ln (BCF / 11) / 1,3 BCF > 7316 = 5 Kow < 1 = 0 Kow ≥ 1 and ≤ 6 = Kow � 1 Kow > 6 = 5
0-5 Figure 4
M The potential Mobility score (based on Koc). To achieve a Mobility score between 0 and 5, the following formula is used for mean Koc values; Koc > 370 = 0 Koc ≥ 30,4 and ≤ 370 = Ln (Koc / 370) / - 0,5 Koc < 30,4 = 5
0-5 Figure 5
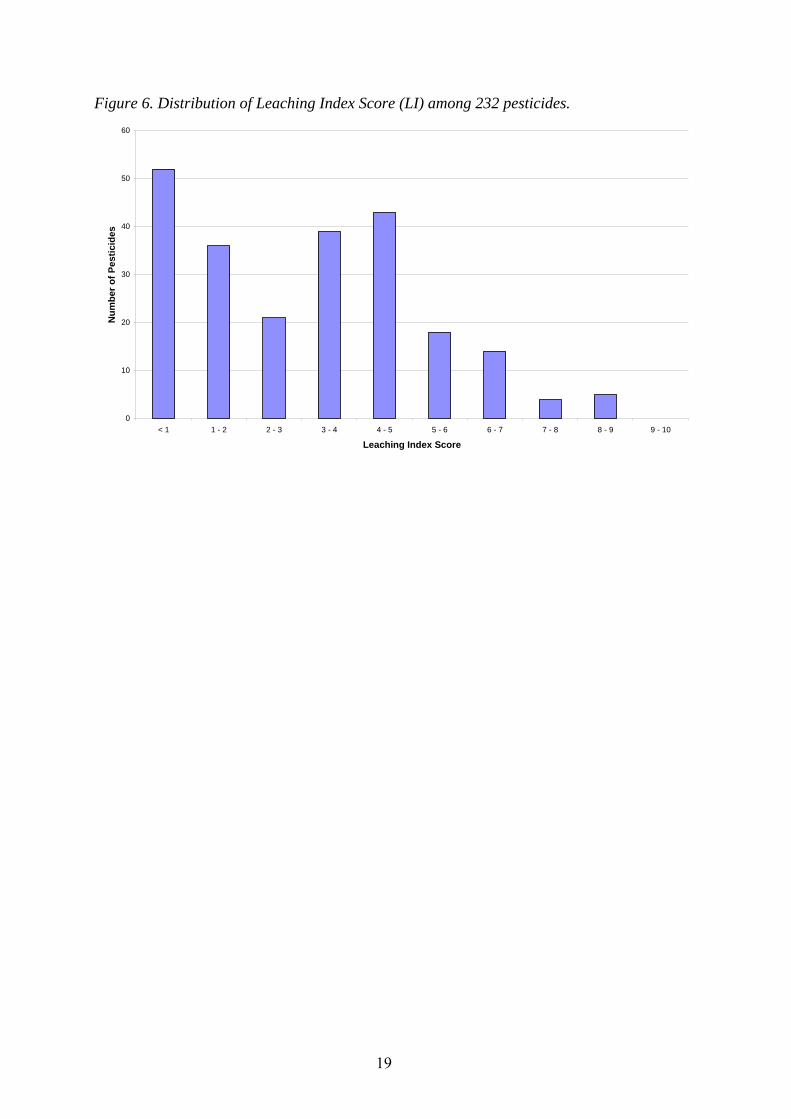
Exposure scoring AME Application Method (Environment exposure) score. 0,5-75 Table 3 and 4AMO Application Method (Operator exposure) score. 0,1-10 Table 3 and 6LI The potential Leaching Index score, derived from Sci-Grow2;
10^(-2,24+(0,61*RILP))*dose rate (in gram or ml), where RILP (Relative Intrinsic Leaching Potential) = log(DT50soil-5)*(4-log(Koc+5)), for active substances with DT50soil between 6 and 1500 and Koc less than 9995. The dose rates used in the calculation of PRI-Nation and PRI-Farm are the recommended dose rate (RDR) and the actual used dose rate (UDR), respectively. To achieve a Leaching Index score between 1 and 10, the following formula is used; Sci-Grow < 5,41 = 1 Sci-Grow ≥ 5,41 and ≤ 415000 = Ln(Sci-Grow / 1,55) / 1,25 Sci-Grow > 415000 = 10
1-10 Figure 6
FT Formulation Type score. 1-30 Table 5 MR Monitoring Result score. Substances frequently detected in
surface and ground water are assigned a score of 3. 1 or 3
WA Winter Application score refers to the timing of application. The intention is to indicate the impact from colder climate conditions on the soil degradation rate during winter. Substances being applied during the period 20 October to 15 March are assigned a maximum score of 2.
1-2
2 SCI-GROW is a screening model intended for estimation of pesticide concentrations in vulnerable ground water (US-EPA, 2003).

8
Term Explanation Score Min-Max
Referring to
Data on use intensity SQ Annual Sold Quantity of an active substance in gram. RDR The Recommended Dose Rate in the most representative crop
and use situation in gram per hectare of an active substance.
UDR Used Dose Rate in a particular crop and use situation in gram per hectare of a pesticide product.
AT Area Treated in hectares for a particular farm, crop and pesticide product.
DAI Dose Area Index = (AT/total area)*(UDR/RDR). TF Treatment Frequency score is based on the most representative
use situation for a particular active substance. Substances with more than 3 applications per season and crop are assigned a score of 3.
1 or 3
Reduction factors and other factors PME Preventive Measure (Environment exposure) regarding the
extent to which official recommendations are followed on practices intended to reduce surface and ground water contamination and impact on other vulnerable areas during spraying. If the conditions in the regulation SNFS 1997:2 and Common advice (NFS 97:3) on the spraying of pesticides and in the �Helper� to calculate wind drift related buffer zones are fulfilled, a reduction factor of 0,6 is used. If a chemical floodgate (low-level induction hopper) and/or a suction probe is used during the filling of the sprayer, an additional reduction factor of 0,7 will be applied.
PMO Preventive Measure (Operator exposure) regarding the extent to which personal protective equipment is used. If gloves are used a reduction factor of 0,5 and 0,6 is used during mixing/loading and application, respectively. Using gloves during both operations will result in a reduction factor of 0,1. If a chemical floodgate (low-level induction hopper) and/or a suction probe are used during the filling of the sprayer, an additional reduction factor of 0,7 will be applied.
Table 7
PSA Permeable Soil Area in hectares representing the part of the treated area having soil characteristics defined as highly permeable. The criteria used for this simplified approach are soils with less than 15 percent clay content as well as less than 2.5 percent organic matter.

9
Results
PRI-Nation PRI-Nation is expressed as the nation-wide sum of environment or operator health risk indicators for all substances used each year. Figure 7 shows the sum of the risk indicators compared with the total number of hectare doses during the years 1986 to 2003.
Figure 7. Sum of Risk Indicators compared with the number of hectare doses during 1986-2003.
0,00
2000000,00
4000000,00
6000000,00
8000000,00
10000000,00
12000000,00
1986 1987 1988 1989 1990 1991 1992 1993 1994 1995 1996 1997 1998 1999 2000 2001 2002 2003
Number of hectare dosesSum of Environment Risk IndicatorSum of Operator Health Risk Indicator
Since the risk indicators are expressed in relative values, the risk indicator slopes are shown together with the slope on the number of hectare doses in order to illustrate the risk trends in relation to the use intensity. For convenience, the scale of the risk indicators has been adjusted to match the scale of the number of hectare doses. This has been done in 1988, which is the first year during the period when sold quantities of pesticides fairly well correspond to the used quantities. As mentioned earlier, the number of hectare doses is based on statistics on the annual sold quantity of each active substance. As the sold quantities for certain years for different reasons may differ from the actual used quantities, it is necessary to look for long-term trends to overcome these short-term shiftings. For instance in 1986, when there were considerable hoarding activities among farmers due to the announcement of a new levy on pesticides. The sold quantities therefore did not properly reflect the used quantities of pesticides in 1986 or the following year 1987. Minor hoarding activities did also take place in 1994 and 2003. From Figure 7 it can be concluded that the risk indicators follow the shape of the slope on number of hectare doses fairly well, especially since 1993. This indicates the importance and impact of the use intensity on the risk indicators. The trends on overall reduced risks in relation to the use intensity can be attributed to several factors, for instance advisory service

10
focusing on integrated and need based crop protection, successful regulatory activities and product developments. There has for instance been a considerable decrease in the operator health risk indicator slope since the beginning of the 1990s. This is to a large extent due to the successful phase out activities carried out on the dithiocarbamates maneb and mancozeb, two substances with high hazard scores used in high volumes at that time. Another long-term trend reducing both environmental and operator health risk indicators is that the ratio between foliar application and seed treatment in cereals is shifting in favour of the latter. Even if some of the fungicides used for seed treatment have persistent properties resulting in high hazard scores they are assigned relatively low total risk scores due to reduced exposure.
PRI-Farm PRI-Farm generates a risk indicator for each treatment and is usually expressed as the indicator sum for all treatments on a farm, in a crop or in a field on a particular farm. The result of the tests performed under the leadership of �Odling i Balans� on a number of so-called Pilot Farms during 2003 and 2004 are available at www.odlingibalans.com (in Swedish).
Ideas for future improvements Risk indicators have limitations and should therefore be used in a careful manner preferably in conjunction with other relevant information. Some of the limitations can of course be improved. To facilitate continuity, however the intention is to revise the models once in a 5 years� time at the most. There are three areas where future improvements of the model are particularly important.
1. Estimation of risk of pesticide leaching to groundwater. There is for instance a clear need also to take into account the macropore flow in the soil.
2. The establishment of national surface water quality criteria for pesticides. These criteria (guideline levels) could become useful in defining the risk for the aquatic ecosystems.
3. The AOEL (Acceptable Operator Exposure Level) is essential for the estimation of the risk for operators. When AOEL-values have been established for a majority of substances it will also be possible to include them in the calculation of the operator health risk indicator.
Having slightly different purposes, the two systems will complement each other for the time being. However, in the long term, the intention is to aggregate results from the farm level in order to use them to express risk trends also at the national level. The EU-funded project HAIR (HArmonised environmental Indicators for pesticide Risks) will probably generate further ideas for improvement and will also be followed in detail (project No SSPE-CT-2003-501997).
Summary in Swedish
Denna PM beskriver beräkningsgrunden för två svenska riskindikatormodeller för bekämp-ningsmedel, PRI-Nation and PRI-Farm. Den första är ämnad att följa upp inverkan av

11
riskminskningsaktiviteter på ett nationellt plan, medans den senare främst är tänkt att följa risktrender på enskilda gårdar. Båda modellerna är baserade på samma princip där fara och exponering poängsätts och multipliceras med antal behandlingar. Viktningen baseras på fältdata, där sådana uppgifter finns tillgängliga, expertbedömningar och policyvärderingar. Resultaten vägs samman till en poängsumma för varje enskild substans eller behandling med avsikt att spegla miljö- respektive hälsorisker. Poängsumman kvantifierar dock inte reella risker utan syftet är istället att indikera trender i potentiella risker på lands- eller på gårdsnivå.
De inledande tester som utförts på ett antal gårdar har visat att PRI-Farm modellen uppfattas som användarvänlig och att den kan bli ett användbart verktyg för sina syften.
Om summan av riskindikatorerna jämförs med användningsintensiteten under åren 1986 till 2003 så uppvisar riskindikatorerna en klar minskning enligt PRI-Nation. Det gäller speciellt hälsoriskindikatorn. Flera faktorer kan förklara denna neråtgående risktrend, bl.a. riktade informations- och rådgivarinsatser, en framgångsrik reglering och en produktutveckling som varit gynnande för lägre risker.
Förslag på framtida förbättringar av modellernas svaga sidor redovisas. De båda modellerna kompletterar varandra för närvarande. I ett längre perspektiv är det önskvärt att kunna väga samman resultat från gårdsnivå så att dessa också kan användas för att beskriva risktrender på nationell nivå.
References
Andersson L, Gabring S, Hammar J & Melsäter B. (1992). Principles for Identifying Unacceptable Pesticides. The Swedish National Chemicals Inspectorate, KEMI Report No 4/92.
BBA, 2004. Aktuelle abtrifteckwerte. Biologische Bundesanstalt für Land- und Forstwirtschaft. http://www.bba.de/ap/ap_geraete/abtrift/abtrift.xls.
CLM, 1999. Comparing Environmental Risk Indicators for Pesticides. Results of the European CAPER Project. Centre for Agriculture & Environment, Utrecht.
EUROPOEM, 2002. The development, maintenance and dissemination of generic European databases and predictive exposure models to plant protection products. A Concerted Action under area 4 of FAIR, the Fourth Framework (Agriculture and Fisheries including Agro-Industry, Food Technology, Forestry, Aquaculture and Rural Development) specific Community Research and Technological Development Programme. FAIR3 CT96-1406. Final report, December 2002.
FOCUS, 1997. Soil persistence models and EU registration. The final report of the work of the Soil Modelling Work group of FOCUS (FOrum for the Co-ordination of pesticide fate models and their Use). 29 February 1997. http://europa.eu.int/comm/food/plant/protection/evaluation/guidance/soil_en.pdf
Future Competence, 2004. Working paper on the development of indicators for chemical substances as a tool for evaluating risk on a national level, Part 1: the use of health economic indexes. Report No 19-0065-009, prepared for the Swedish Chemicals Inspectorate. Linköping.

12
Kreuger J & Nilsson E. 2001. Catchment scale risk-mitigation experiences � key issues for reducing pesticide transport to surface water. In: BCPC Symposium Proceedings No. 78, Pesticide Behaviour in Soil and Water. P 319-324. Brighton.
Magnusson M, 1997. Air and soil temperatures in Europe. SMHI (Swedish Meteorological and Hydrological Institute). By contract from National Chemicals Inspectorate. Norrköping.
Nilsson C, 2001. Miljönyckeltal: Kemiska bekämpningsmedel. Fakta Jordbruk No 6, 2001. SLU, Uppsala (in Swedish).
OECD, 1999a. Swedish Risk Reduction Indicator. Published in: OECD (1999), �Results of the OECD Survey of National Pesticide Risk Indicators�, 2nd OECD Workshop on Pesticide Risk Indicators, Braunschweig, Germany 1-3 June 1999.
OECD, 1999b. Report of the 2nd OECD Workshop on Pesticide Risk Indicators. Braunschweig, Germany 1-3 June 1999.
UKPOEM, 1992. United Kingdom Predictive Operator Exposure Model - A Users Guide. Pesticide Safety Directorate, UK.
US-EPA, 2003. SCI-GROW (Screening Concentration In GROund Water), Office of Pesticide Programs (OPP) in the Environmental Protection Agency (EPA). http://www.epa.gov/oppefed1/models/water/index.htm

13
Appendix I - Tables and Figures Table 1. Environment Toxicity Score (ET) Categories of danger/risk phrase Score
N Dangerous for the environment 1
R 57 Toxic to bees 1
Very toxic to bees
(LD50 <1 µg/bee)
2
R 51 Toxic to aquatic organisms 1
R 50 Very toxic to aquatic organisms 2
R 56 Toxic to soil organisms 2
R 59 Dangerous for the ozone layer 2
R 60 May impair fertility 2
Table 2. Operator Toxicity Score (OT) Categories of danger/risk phrase Score V Moderately harmful 1
Xn Harmful 3
Xi Irritant 4
T Toxic 10
C Corrosive 10
T+ Very toxic 30
R 39 Danger of very serious irreversible effects 10
R 41 Risk of serious damage to eyes 3
R 45 May cause cancer 10
R 46 May cause heritable genetic damage 10
R 48 Danger of serious damage to health by prolonged exposure
10
R 60 May impair fertility 10
R 61 May cause harm to the unborn child 10

14
Table 3. Application Method Score (AME, AMO) Score Application method
Environment Exposure (AME)
Operator Exposure (AMO)
Application of treated seeds 0,5 0,1
Granular application 1 0,1
Fogging machine (greenhouse) 1 1
Tractor-mounted/trailed band sprayer 1,5 1,5
Tractor-mounted/trailed boom sprayer 3 3
As above, but with a crop opener1 or by using a low boom height (≤ 25 cm)
2 2
Knapsack sprayer 15 5
Tractor-mounted/trailed broadcast air-assisted sprayer
75 4,5
1. Lehnerboom or Hardi Twin type or air-assisted technique
Table 4. Spray drift values sampled at bare soil at 5 meters distance from the applicator in percent of used amounts, based on 90th percentile calculations. Crop situation Timing Spray drift Ratio
Low level field crop 0,57 3
Early season 19,89 105
Late season 8,41 45
Fruit orchard
Average 14,15 75
Home garden 2,93 15 Data derived from �Aktuelle abtrifteckwerte� (BBA, 2004).

15
Table 5. Formulation Type Score (FT) Formulation type Score Tablet 1
Water-soluble bag 1
Liquid concentrate (emulsion, suspension)
2
Granular1 1,5
Powder 8
Aerosol 30
Gas 301. Granular formulations in Sweden consist mainly of small packages containing water-soluble micro granules. A score of 1,5 has therefore been chosen to better reflect the Swedish conditions.
Table 6. The impact from different application methods on the absorbed dose from dermal and inhalation exposure. No personal protective equipment used. Application method Area
Treated Duration Total
absorbed dose (mg/day)
Ratio
Tractor-mounted/trailed boom sprayer;
hydraulic nozzles
50 ha 6 hours 11,3 3
rotary atomisers 50 ha 6 hours 7,4 2
Tractor-mounted/trailed broadcast air-assisted sprayer;
500 l/ha
15 ha 6 hours 16,8 4,5
100 l/ha 15 ha 6 hours 11,0 3
50 l/ha 15 ha 6 hours 5,9 1,5
Hand-held sprayer (15 l tank), hydraulic nozzles, outdoor, low level target
1 ha 6 hours 19,1 5
Hand-held rotary atomiser equipment (2,5 l tank), outdoor, low level target
1 ha 6 hours 42,4 11
Home garden sprayer (5 l tank), outdoor, low level target
0,01 ha 0,5 hours 2,4 1
Data derived from United Kingdom Predictive Operator Exposure Model - A Users Guide (UKPOEM, 1992).

16
Table 7. The impact from different formulations and personal protective equipment (PPE) on the absorbed dose from dermal and inhalation exposure during mixing/loading and application with a tractor-mounted/trailed boom sprayer (hydraulic nozzles).
Absorbed dose (mg/day) Formulation PPE during mix/load
PPE during application Mixing
and loading
Appli-cation
Total
Ratio Reduction factors
Liquid Conc. None None 6,3 5,0 11,3 2
Gloves None 0,3 5,0 5,3 1 0,5
None Gloves 6,3 0,8 7,1 1,2 0,6
Gloves Gloves 0,3 0,8 1,1 0,2 0,1
Water-soluble bags
None None 0 5,0 5,0 1
Water dispersible granules
None None 9,8 5,0 14,8 3
Wettable powder
None None 24,3 5,0 29,3 8
Data derived from United Kingdom Predictive Operator Exposure Model - A Users Guide (UKPOEM, 1992). Figure 1. Ratio between the dose rate and the effect level on Lemna sp. of two chemical groups of herbicides, with the best fit regression line shown.
R2 = 0,827
1
10
100
1000
10000
0,0001 0,001 0,01 0,1 1 10
EC50 Lemna
Dos
e ra
te a
.s./h
a
Sulphonylureas
Phenoxy acids

17
Figure 2. Ratio between the dose rate and the effect level on Daphnia sp. of two chemical groups of insecticides, with the best fit regression line shown.
R2 = 0,8985
1
10
100
1000
0,0001 0,001 0,01 0,1
EC50 Daphnia
Dos
e ra
te a
.s./h
a
Pyrethroids
Carbamates
Figure 3. Persistence Score (P)
0
50
100
150
200
250
0 0,5 1 1,5 2 2,5 3 3,5 4 4,5 5
Score
DT5
0 da
ys
Guideline level
Cut off criteria
A DT50 of 70 days represents the guideline level and a DT50 of 120 days the cut off criteria as defined in �Principles for Identifying Unacceptable Pesticides� (Andersson et. al. 1992).
18
Figure 4. Bioaccumulation Score (B)
0
500
1000
1500
2000
2500
3000
3500
4000
4500
5000
0 0,5 1 1,5 2 2,5 3 3,5 4 4,5 5
Score
BC
F
Guideline level
Cut off criteria
A BCF of 500 represents the guideline level and a BCF of 2000 the cut off criteria as defined in �Principles for Identifying Unacceptable Pesticides� (Andersson et. al. 1992). Figure 5. Mobility Score (M)
0
50
100
150
200
250
300
350
400
0 0,5 1 1,5 2 2,5 3 3,5 4 4,5 5
Score
Koc
Guideline level
Cut off criteria
A Koc of 150 represents the guideline level and a Koc of 50 the cut off criteria as defined in �Principles for Identifying Unacceptable Pesticides� (Andersson et. al. 1992).
19
Figure 6. Distribution of Leaching Index Score (LI) among 232 pesticides.
0
10
20
30
40
50
60
< 1 1 - 2 2 - 3 3 - 4 4 - 5 5 - 6 6 - 7 7 - 8 8 - 9 9 - 10
Leaching Index Score
Num
ber o
f Pes
ticid
es

Swedish Chemicals Inspectorate • P.O. Box 2 • SE 172 13 Sundbyberg • SwedenPhone + 46 8 519 411 00 • Fax + 46 8-735 76 98
e-mail [email protected] • www.kemi.se