pesticides & water quality
TRANSCRIPT

PESTICIDES
Pesticides is a general term that includes herbicides, insecticides and fungicides.
WATER QUALITY
Water quality refers to the chemical, physical, biological and radiological characteristics of water. It is a measure of the condition of water relative to the requirements of one or more biotic species and/or to any human need or purpose.
Improving the quality of water entering the Great Barrier Reef (GBR) is fundamental to building resilience of the ecosystems which support significant biodiversity and species of conservation concern such as turtles and dugongs, and drive fisheries productivity. It is also likely to reduce the frequency of future crown-of-thorns starfish outbreaks, with one line of evidence suggesting these are driven by elevated concentrations of nutrients1.
The science behind water quality can be complex. As farmers and advisors we are used to talking about how herbicides and insecticides affect weeds and insect pests in our cane fields; after all we are generally trying to kill them!
When it comes to understanding the impact of these pesticides on aquatic organisms that live in our creeks and in the marine environment, sometimes it seems like a different language is being used.
Here we will explain some terminology that you are likely to come across when reading about water quality or attending water quality meetings.
PESTICIDES & WATER QUALITY WHAT DOES THE TERMINOLOGY MEAN?

2 PESTICIDES & WATER QUALITY - WHAT DOES THE TERMINOLOGY MEAN?
AQUATIC ECOSYSTEM GUIDELINE VALUES
An aquatic ecosystem guideline value is the concentration of a pesticide (or other toxicant) that if exceeded in a waterway may result in harm to aquatic organisms.
HOW ARE THE GUIDELINE VALUES DEVELOPED?
Different organisms have different tolerances to pesticides, so it can be challenging to work out what concentration of a pesticide would be safe for the entire community of organisms in our waterways. To do this, scientists take a range of organisms found in freshwater or marine environments and expose them to different concentrations of toxicants (e.g. pesticides) in toxicity tests.
The results of those tests are usually expressed as concentrations of the pesticide that caused death within a specific time period (e.g. 96-hour Median Lethal Concentration or LC50) or as a harmful effect on growth or reproduction (e.g. 14-day Median Effect Concentration or EC50). For the development of a guideline, small or no effect data are used (e.g. the 10% Effect Concentration (EC10) or No Observable Effect Concentration (NOEC)).
When enough of these kinds of toxicity data are available, they are plotted on
a graph called a species sensitivity distribution, and a line of best fit is then calculated to describe the distribution (see Figure 1). The line of best fit is used to calculate low risk concentrations which are then used as guideline values.
For example, the species sensitivity distribution (SSD) in Figure 1, represents toxicity tests results for 21 different freshwater species exposed to metolachlor (the 21 species here are classified and labelled according to the six phyla to which they belong – phyla is a much broader grouping of organisms than species, genus or family).
See reference section for the source publication. It is available at waterquality.gov.au/sites/default/files/documents/metolachlor_fresh_dgv-technical-brief.pdf. Many other toxicant guidelines are available at waterquality.gov.au/anz-guidelines/guideline-values/default/water-qualitytoxicants/toxicants.
Each point on the graph represents a result of a toxicity test expressed as the concentration (on the horizontal axis) that caused either no effect (i.e. NOEC / NOEL) on the test population growth, reproduction or death, or a very small effect (i.e. EC10). The red line represents the line of best fit and this is used to set guideline values that would protect a proportion of the aquatic community (shown on the vertical axis).
The line of best fit in the metolachlor SSD shown in Figure 1 can be used to assign a protection threshold concentrations for the protection of ecosystems of different ecological value.
Most freshwater systems in the Great Barrier Reef (GBR) catchments are classified as Moderately Disturbed, and as a general rule (with some exceptions), the concentration that affects 5% of the whole aquatic community is used as a guideline for the protection of 95% of the community. This guideline is often referred to as the PC95.
Aquatic ecosystems classified as having High Ecological Value or as Slightly Disturbed, have guideline values set at a level that will protect 99% of species. At the end of each catchment, where the waterways meet the High Ecological Value GBR World Heritage Area, the accepted guideline values for pesticides in GBR waters are based on the 99% of species protection level (PC99). End-of-catchment is the estuarine area where freshwater meets the marine environment.
WHO DECIDES WHAT THE GUIDELINE VALUES ARE?
The Australian and New Zealand governments work together with states and territories to set water quality guidelines for both fresh and marine waters. This is done through the framework set in the Australian
3PESTICIDES & WATER QUALITY - WHAT DOES THE TERMINOLOGY MEAN?
and New Zealand Guidelines for Fresh and Marine Water Quality (ANZG 2018) (waterquality.gov.au/anz-guidelines), and in relevant jurisdictional legislation.
Toxicants under the ANZG are currently undergoing a major review and update process. Draft toxicant materials are being progressively released on the ANZG website for a minimum of three months for public comment to finalisation. Refer to the ANZG site for more details (waterquality.gov.au/anz-guidelines/guideline-values/default/draft-dgvs#draft-default-guideline-values).
The Queensland Department of Environment and Science (DES) is updating toxicant guidelines so they meet the requirements for accreditation as national guidelines under the ANZG. These build on the substantial technical work by DES that resulted in the derivation of proposed guidelines for 27 pesticides used within the GBR catchment. These proposed guidelines can be found at: publications.qld.gov.au/dataset/proposed-guideline-values-27-pesticides-used-in-the-gbr-catchment/resource/12e1b6af-9b71-40aa-bb50-163fe577a2c1.
WHAT UNITS OF MEASUREMENT ARE USED?
For pesticides, the Guideline Values are reported in micrograms per litre (µg/L), which is the same as parts per billion (ppb).
Guideline Type Percentage of species protected
Guideline Value (µg/L)
Guideline for protection of High Ecological Value ecosystems (PC99)
99% 0.0084
Guideline for the protection of Moderately Disturbed ecosystems (PC95)
95% 0.46
Guideline for protection of Highly Disturbed ecosystems (PC90)
90% 2.6
Guideline for protection of Highly Disturbed ecosystems (PC80)
80% 15
Herbicides
2,4-D Ametryn Atrazine Hexazinone
Diuron Fluroxypyr Haloxyfop Metribuzin
Imazapic Isoxaflutole MCPA Prometryn
Metolachlor Metsulfuron-methyl Pendimethalin Triclopyr
Simazine Tebuthiuron Terbuthylazine
Insecticides
Chlorpyrifos Fipronil Imidacloprid
Fig. 1
Tab. 1
Tab. 2
Fig. 2
100
80
60
40
20
0
100%
90%
80%
70%
60%
50%
40%
30%
20%
10%
0%
PERC
ENTA
GE
OF
SPEC
IES
POTE
NTI
ALL
Y A
FFEC
TED
ms-
PAF
METOLACHLOR (µg/L)
DAILY ms-PAF
ChlorophytaChlorophytaBacillariophyta
TracheophytaTracheophyta
Tracheophyta
Tracheophyta
Cyanobacteria
Arthropoda
Bacillariophyta
BacillariophytaBacillariophyta
BacillariophytaChordata
BacillariophytaBacillariophyta
BacillariophytaBacillariophytaBacillariophyta
Chlorophyta
Chlorophyta
Chronic EC10 Chronic NOEC Chronic NOEL Chronic Est. NOEC
0.1 1 10
1/07/2017 20/08/2017 9/10/2017 28/11/2017 17/01/2017 8/03/2017 27/04/2017 16/06/2017
100 1000 10000
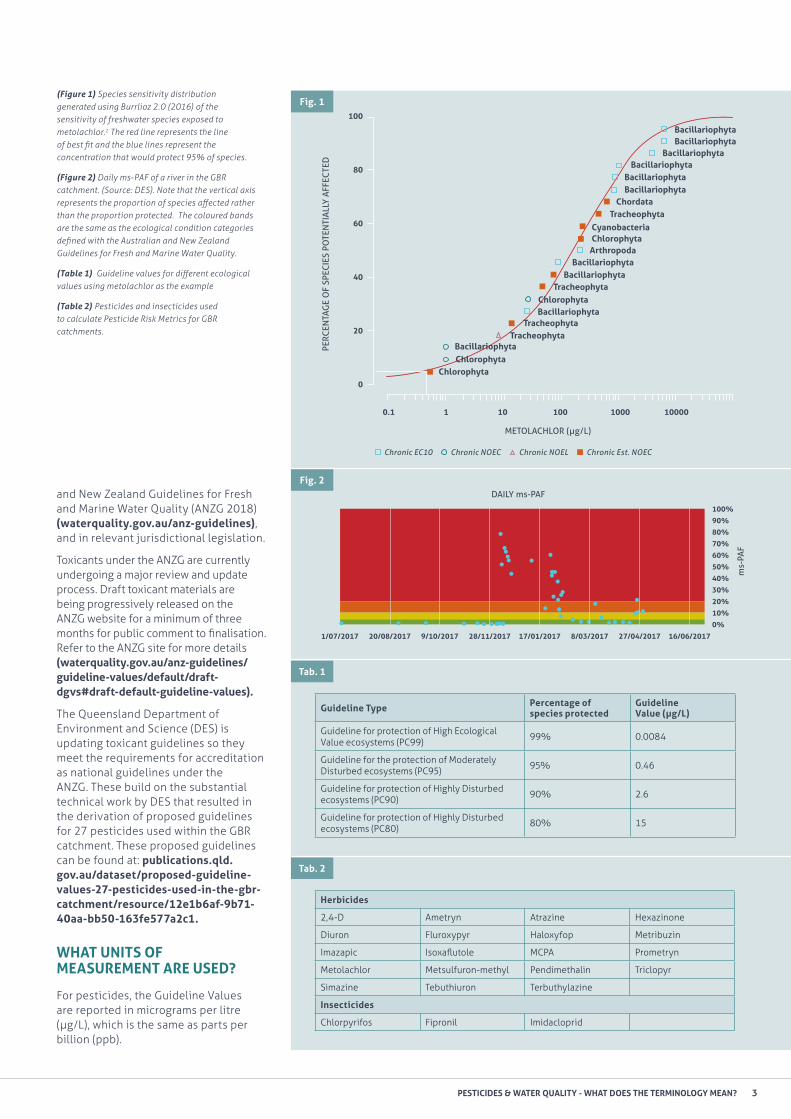
(Figure 1) Species sensitivity distribution generated using Burrlioz 2.0 (2016) of the sensitivity of freshwater species exposed to metolachlor.2 The red line represents the line of best fit and the blue lines represent the concentration that would protect 95% of species.
(Figure 2) Daily ms-PAF of a river in the GBR catchment. (Source: DES). Note that the vertical axis represents the proportion of species affected rather than the proportion protected. The coloured bands are the same as the ecological condition categories defined with the Australian and New Zealand Guidelines for Fresh and Marine Water Quality.
(Table 1) Guideline values for different ecological values using metolachlor as the example
(Table 2) Pesticides and insecticides used to calculate Pesticide Risk Metrics for GBR catchments.

PROTECTION CONCENTRATION VALUES
The Protection Concentration (PC) values are the short-hand term for those guideline values that are estimated to offer a level of protection to a given percentage of aquatic species:
• PC95: if the concentration in the water body is below this concentration, it is expected that at least 95% of species will be protected. The PC95 is most often applied as the guideline for protection of moderately disturbed aquatic ecosystems.
• PC99: if the concentration in the water body is below this concentration, it is expected that at least 99% of species will be protected. The PC99 is most often applied as the guideline for protection of High Ecological Value aquatic ecosystems.
The whole of the GBR marine park (including end-of-catchment estuarine systems) are classified as either Slightly Disturbed or High Ecological Value, both of these classifications are given a level of protection of 99% of species (PC99).
REFERENCES1 Brodie JE, Fabricius K, De’ath G, Okaji
K (2005) Are increased nutrient inputs responsible for more outbreaks of crown of thorns starfish? an appraisal of the evidence. Mar Pollut Bull 51: 266-278.
2 ANZG 2020, Toxicant default guideline values for aquatic ecosystem protection: Metolachlor in freshwater. Australian and New Zealand Guidelines for Fresh and Marine Water Quality. CC BY 4.0. Australian and New Zealand Governments and Australian state and territory governments, Canberra, ACT, Australia.
3 Warne, MSJ, Neelamraju, C, Strauss, J, Smith, RA, Turner, RDR, and Mann, RM (2020), Development of a pesticide risk baseline to permit reporting progress on reducing the risk posed by pesticides to the Great Barrier Reef, State of Queensland, Brisbane, Australia.
PESTICIDE RISK METRIC
In several Queensland reporting products, pesticide indicator scores were developed using the Pesticide Risk Metric (PRM) approach. The aim of this approach is to quantify the toxicity risk associated with exposure to a mixture of pesticides, rather than reporting separately on a number of pesticides that may be present at the same time.
The terms used are the same as those used when referring to guidelines for individual pesticides. Measured concentrations of up to 22 different pesticides in a given sample are converted to a PRM that expresses risk as either the percentage of aquatic species that may be adversely affected by the mixture of pesticides or the percentage of aquatic species that will be protected from the adverse effects of pesticide exposure.
The Reef 2050 Water Quality Improvement Plan has set a target “to protect at least 99% of aquatic species at the end-of-catchments”. In order to meet this target, the PRM needs to have a value of 99% or higher at the boundary of the GBR World Heritage Area at the end of the catchment.
Currently 22 pesticides are included when calculating the PRM for GBR catchments (Table 2).
The PRM is the annual wet season average of daily values of a calculated statistic called the multi substance – Potentially Affected Fraction (ms-PAF). The ms-PAF is a calculated representation of the toxicity of a mixture of up to 22 different pesticides. Further information about the how ms-PAF and the Pesticide Risk Metric is calculated can be found in Warne et al. (2020)3. Figure 2 shows an example of measuring ms-PAF in a river in Central Queensland.
The percentage of aquatic species affected varies over time, from almost no impact in low flow conditions (i.e. prior to the first run-off of the wet season) and increasing to around 80% of species impacted with the first summer rainfall.
The ms-PAF and the PRM can be compared over seasons to track changes in the condition of the waterway.
Though many land uses within a catchment may contribute to the pesticide load and ms-PAF results, sugarcane is often a significant land-use in catchments where pesticides are reported at potentially harmful levels. Therefore sugarcane is expected to have a significant contribution to these negative impacts.
ACKNOWLEDGEMENTS
The Pathways to Water Quality Improvement in the Myrtle Creek sub-catchment project is funded by the Queensland Government’s Reef Water Quality Program and supported by Sugar Research Australia and Sugar Services Proserpine.
The Cane to Creek II project is funded by the partnership between the Australian Government’s Reef Trust and the Great Barrier Reef Foundation and supported by Sugar Research Australia, Mossman agricultural Services, Tully Sugar, Burdekin Productivity Services, Burdekin Bowen Integrated Floodplain Management Advisory Committee, James Cook University, Herbert Cane Productivity Services and CSIRO.
The expert input and edits by scientists in the Department of Environment and Science is gratefully acknowledged.
This Information Sheet has been compiled as a joint effort between the Cane to Creek 2.0 and Pathways to Water Quality Improvement in the Myrtle Creek sub-catchment projects.
MORE INFORMATION
Belinda Billing Principle Researcher E [email protected] T 07 4056 4512
Molly O’Dea Adoption Officer E [email protected] T 07 4945 1844
4 PESTICIDES & WATER QUALITY - WHAT DOES THE TERMINOLOGY MEAN?