source water quality for aquaculture - world...
TRANSCRIPT

ENVIRONMENTALLY AND SOCIALLYSUSTAINABLE DEVELOPPMENT
LJ"U) R/t/)t! Iff)c/9/R'/Dopmeit
Work in progress 23764for public discussion March 1999
Source Water Qualityfor AquacultureA Guidlefor Assessment
-HO '- -1
~~~-~A
-o .. _ 4 r - - _
[. 3 -R i D. Z
- ~ ~ ~ ~ U -t ,,! _ - -
I -- - V -
Joh)//// 1). l1forlto/
A,I.I,/ Al Steawart
Pub
lic D
iscl
osur
e A
utho
rized
Pub
lic D
iscl
osur
e A
utho
rized
Pub
lic D
iscl
osur
e A
utho
rized
Pub
lic D
iscl
osur
e A
utho
rized
Pub
lic D
iscl
osur
e A
utho
rized
Pub
lic D
iscl
osur
e A
utho
rized
Pub
lic D
iscl
osur
e A
utho
rized
Pub
lic D
iscl
osur
e A
utho
rized


ENVIRONMENTALLY AND SOCIALLYSUSTAINABLE DEVELOPMENT
Rural Development
Source Water Qualityfor AquacultureA Guidefor Assessment
RonaldD. ZweigJohn D. MortonMaol M. Stewart
Thk World BnmkWahiMngton, D.C.
Copyright 0 1999The International Bank for Reconstructionand Development/THE WORLD BANK1818 H Street, N.W.Washington, D.C. 20433, U.S.A.
All rights reservedManufactured in the United States of AmericaFirst printing March 1999
This report has been prepared by the staff of the World Bank. The judgments expressed do notnecessarily reflect the views of the Board of Executive Directors or of the governments they represent.
The material in this publication is copyrighted. The World Bank encourages dissemination of its workand will normally grant permission promptly.
Permission to photocopy items for internal or personal use, for the internal or personal use of specificclients, or for educational classroom use, is granted by the World Bank, provided that the appropriate feeis paid directly to Copyright Clearance Center, Inc., 222 Rosewood Drive, Danvers, MA 01923, U.S.A.,telephone 978-750-8400, fax 978-750-4470. Please contact the Copyright Clearance Center beforephotocopying items.
For permission to reprint individual articles or chapters, please fax your request with completeinfornation to the Republication Department, Copyright Clearance Center, fax 978-750-4470.
All other queries on rights and licenses should be addressed to the World Bank at the address above orfaxed to 202-522-2422.
Photographs by Ronald Zweig. Clockwise from top right: (1) Marine fish culture in floating cages sur-rounded by shellfish and seaweed culture (suspended from buoys in background), which feeds onreleased fish wastes. Sea cucumbers stocked beneath the cages feed on the settled fish wastes. WeihaiMunicipality, Shandong Province, China. (2) Pump house brings water from Bay of Bengal to BanapadaShrimp Farm, Orissa, India. (3) Day-old carp hatchlings are released to a nursery cage in a fish hatcherypond prior to sale to stock fish production farms. Yixing, Jiangsu Province, China.
Ronald D. Zweig is senior aquaculturist in the East Asia and the Pacific Rural Development and NaturalResources Sector Unit of the World Bank. John D. Morton is a Ph.D. candidate in environmental and waterresource engineering at the University of Michigan. Macol M. Stewart is an international developmentanalyst in the Office of Global Programs in the US. National Oceanic and Atmospheric Administration.
library of Congress Cataloging-in-Publication Data
Zweig, Ronald D., 1947-Source water quality for aquaculture: a guide for assessment / Ronald
D. Zweig, John D. Morton, Macol M. Stewart.p. cm. - (Environmentally and socially sustainable
development. Rural development)Includes bibliographical references (p. ) and index.ISBN 0-8213-4319-X1. Fishes-Effect of water quality on. 2. Shellfish-Effect of
water quality on. 3. Water quality-Measurement. I. Morton, JohnD., 1968- . II. Stewart, Macol M., 1968- . III. Title.IV. Series: Environmentally and socially sustainable developmentseries. Rural development.IN PROCESS 1998639.3-dc2l 9841429
CIP
I The text and the cover are printed on recycled paper, with a flood aqueous coating on the cover.
Contents
Foreword v
Abstract vii
Acknowledgments viii
Abbreviations and Acronyms ix
Glossary x
Chapter 1 Assessing Source Water Quality 1
Choice of Source Water 1Source Water Quality Issues 1Guidelines for Evaluating Source Water Quality 3
Chapter 2 Phase I: Physio-chemical Water Quality Parameters 6
Basic Factors 6Other Critical Factors 18
Chapter 3 Phase II: Anthropogenic and Biological Water Quality Parameters 22
Metals 22Metalloids 31Organic Compounds 33Pathogens and Biological Contaminants 39
Chapter 4 Phase III: Field Study 42
Study Design 42Criteria for Fish Growth and Health 42Criteria for Contaminant Residues 43
Appendix Tables 44
Notes 53
Bibliography and Related Sources 55
Species Index 61

iv Source Water Quality for Aquaculture: A Guide for Assessment
Boxes
1.1 Bioaccumulation 53.1 Protecting aquaculture ponds from pesticides 37
Figure
1.1 Analytical process for evaluating source water quality for aquaculture 4
Tables
1.1 Advantages and disadvantages of common water sources 22.1 General temperature guidelines 62.2 Optimal rearing temperatures for selected species 72.3 Turbidity tolerance levels for aquaculture 82.4 Optimal salinities for selected species and general guidelines 92.5 Alkalinity tolerance levels for aquaculture 102.6 pH tolerance levels and effect for aquaculture 112.7 Hardness tolerance levels for aquaculture 112.8 Optimal ranges for total hardness 122.9 Recommended levels of dissolved oxygen for aquaculture 13
2.10 Carbon dioxide tolerance levels for aquaculture 152.11 Factors affecting the toxicity of ammonia to fish 162.12 Ammonia tolerances for aquaculture 172.13 Optimal nitrite concentrations for aquaculture 182.14 Optimal nitrate concentrations for aquaculture 182.15 Optimal mud characteristics for aquaculture 20
3.1 Maximum cadmium concentrations for aquaculture 263.2 Maximum lead concentrations for aquaculture 273.3 Maximum copper concentrations for production of salmonid fish 283.4 Maximum chromium concentrations for aquaculture 293.5 Maximum zinc concentrations for aquaculture recommended
by the European Union 313.6 Persistence of pesticides 353.7 Toxicity to aquatic life of selected chlorinated hydrocarbon insecticides 353.8 Pesticide solubility & experimentally derived bioaccumulation factors in fish 36
Appendix Tables
1 Effect of biological processes on alkalinity 442 Relative abundance categories of soil chemical variables in brackish
water ponds 453 Relative abundance categories of soil chemical variables in freshwater ponds 464 Selected biomarkers proposed in study of environmental and/or toxicological
responses in fish 475 Provisional tolerable weekly intake for selected elements 486 Import standards for contaminant residues in fish and shellfish 497 Import bacteriological standards for fish and shellfish 51
Foreword
T he United Nations Food and Agriculture velopment and growth of fish and shellfish. ItOrganization (FAO) reports that most may also degrade the quality of the productspecies subject to capture fishing are by tainting the flavor or by causing accumu-
overexploited and that the potential for in- lation of high enough concentrations of toxiccreasing yields in the long term is extremely substances to endanger human health. Thelimited. Aquaculture is an attractive alterna- importance of water quality along with thetive to capture fisheries due to its potential for growth of the World Bank's involvement inproduction expansion, effective use of process- aquaculture projects has created a need of aing facilities, and adaptability of production- guide for determining the suitability ofto-market requirements. Facing the leveling of source waters proposed for use in these pro-production of capture fisheries, aquaculture, jects. It is the goal of this report to providehas grown in production at an average annual information useful to this end.rate of over 11 percent during 1990-94 accord- This report reviews the quality standardsing to FAO-reported trends. With this growth for water and fish product, looks at the pa-the World Bank has become increasingly in- rameters of greatest importance to aquacul-volved in assisting and financing aquaculture ture, and discusses the scientific basis for theseproject requests from member governments. standards. It can provide government offi-This report is thus meant to help private and cials, field technicians, and task managers withpublic sectors and lending institutions deter- necessary information to make informed judg-mine whether the water quality at a proposed ments. The report also contains practical, step-aquaculture development site is acceptable. by-step guidelines for use by task managers inThe need for such a guide has become impor- determining whether the quality of the pro-tant and necessary with the continued degra- posed source water will present a significanttion of water resources from increases in risk to the success of a project. The prescribedindustrial and municipal wasterwater dis- procedures would be of importance to sitecharges and agro-chemical use. selection for any considered aquaculture en-
Water is the most important input for terprise and would also be of use to govern-aquaculture and thus a key element in the ments involved in formulating inland andsuccess of these projects. Source water should coastal zone development/management plansbe selected based on its suitability for efficient that would include assessment of appropri-production of high-quality aquaculture prod- ate areas for the establishment of aquacultureuct(s). Poor water quality may impair the de- facilities.
v

vi Source Water Quality for Aquaculture: A Guide for Assessment
The information provided here is limited to There are plans to revise this report aboutthat currently available in the literature and every two years to keep it current with the newfrom government standards and thus is not information being generated on the topic andexhaustive with regard to all species cultured also to make it available electronically on theand all aquacultural production systems in use. World Bank's website (www.worldbank.org).
Alexander McCallaDirector
Rural Development

Abstract
!T'lhe report provides guidance on how to organisms (mostly finfish and crustaceans) andassess the suitability of source water for upon the consumer due to the presence and/oraquaculture. Aquaculture development bioaccumulation of toxins and pathogens that
worldwide is growing rapidly due to increasing can be present in water. The current state ofdemands for its products and limited production knowledge on the acceptable limits of hazard-potential from inland and marine capture fisher- ous chemicals and pathogens in water used fories. The report reviews the different sources of fisheries and aquaculture and the acceptablewater that are or can be used for aquaculture and concentrations accumulated in the tissue ofprovides the current standards on acceptable aquaculture products are also furnished. Thesephysio-chemical, anthropogenic pollutant, and standards vary somewhat among countries.biological factors that affect the quality of source The report also suggests a step-by-step proc-water. It provides the available knowledge from ess for evaluating source water quality fora literature review on these factors and the po- aquaculture that minimizes cost to the degreetential impact on the health of various cultured possible.
vii
Acknowledgments
he authors want to express their sincere to Eileen McVey from the Aquaculture Collec-appreciation to Claude Boyd, Netty tion,tNationaleAgriculture Library; toBGertVanBuras, Hakon Kryvi, Carl Gustav Lundin, Santen as co-leader of the World Bank Fisheries
Khalil H. Mancy, Roger Pullin, and Heinrich and Aquaculture Thematic Group for his sup-Unger, who provided technical and editorial port and endorsement of the document's con-comments on the text; to the World Bank Ru- cept and importance; to Maria Gabitan andral Sector Board and Summer Intern Program Sunita Vanjani for their administrative assis-and to Maritta Koch-Weser and Geoffrey Fox tance in managing the report's preparation; tofor their support of the report's preparation; EmilyFeltforprovidingimportstandards;andto the staff of the World Bank Sectoral Li- to Sheldon Lippman, Virginia Hitchcock, andbrary for the provision of reference materials; Alicia Hetzner, whose editorial contributionsto Ken Adson, Uwe Barg, Gaboury Benoit, much improved the presentation and clarity ofMeryl Broussard, and James McVey for ref- thetext.GaudencioDizondesktoppedthisvol-erences and guidance in the text preparation; ume.
viii
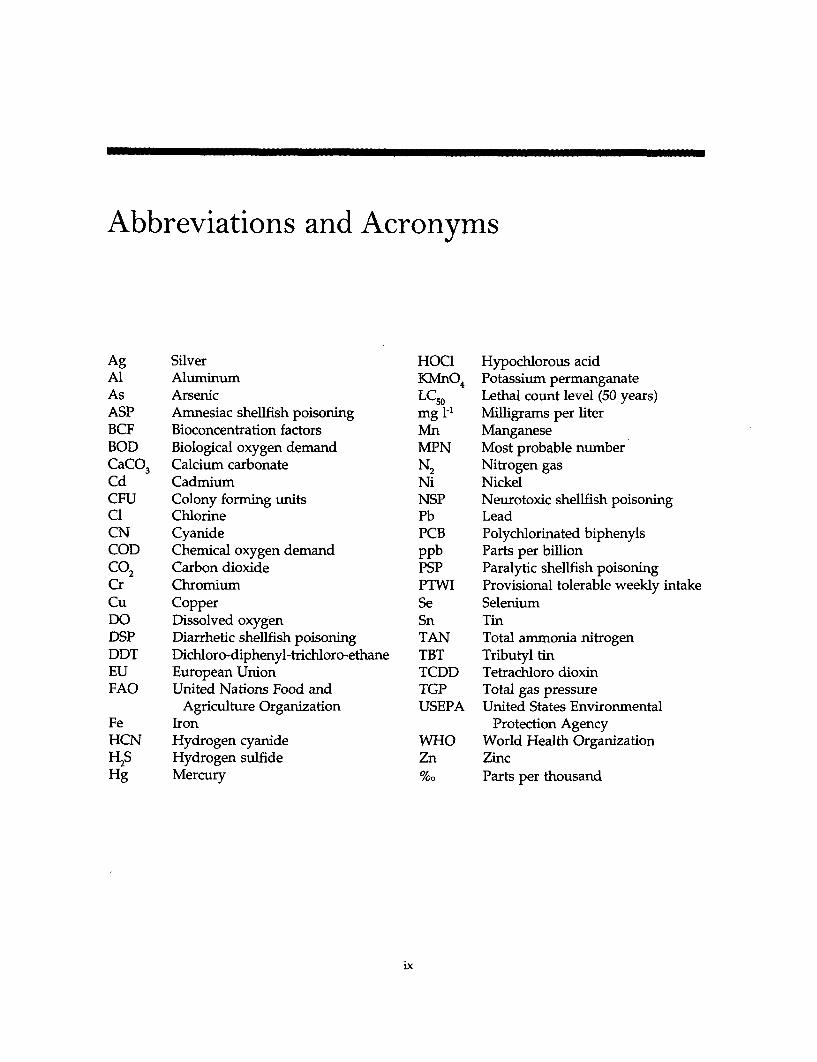
Abbreviations and Acronyms
Ag Silver HOCI Hypochlorous acidAl Aluminum KMnO4 Potassium permanganateAs Arsenic LCSO Lethal count level (50 years)ASP Amnesiac shellfish poisoning mg 1-' Milligrams per literBCF Bioconcentration factors Mn ManganeseBOD Biological oxygen demand MPN Most probable numberCaCO3 Calcium carbonate N2 Nitrogen gasCd Cadmium Ni NickelCFU Colony forming units NSP Neurotoxic shellfish poisoningCl Chlorine Pb LeadCN Cyanide PCB Polychlorinated biphenylsCOD Chemical oxygen demand ppb Parts per billionCO2 Carbon dioxide PSP Paralytic shellfish poisoningCr Chromium PTWI Provisional tolerable weekly intakeCu Copper Se SeleniumDO Dissolved oxygen Sn TinDSP Diarrhetic shellfish poisoning TAN Total amnmonia nitrogenDDT Dichloro-diphenyl-trichloro-ethane TBT Tributyl tinEU European Union TCDD Tetrachloro dioxinFAO United Nations Food and TGP Total gas pressure
Agriculture Organization USEPA United States EnvironmentalFe Iron Protection AgencyHCN Hydrogen cyanide WHO World Health OrganizationH2S Hydrogen sulfide Zn ZincHg Mercury %. Parts per thousand
ix
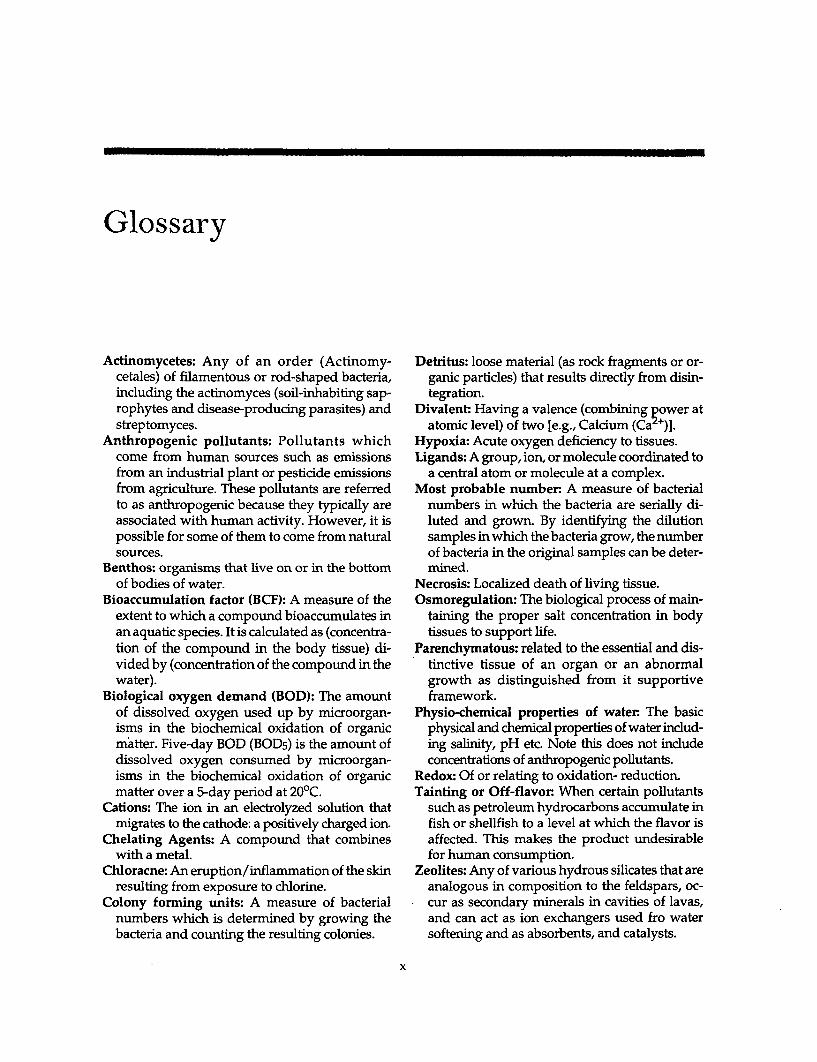
Glossary
Actinomycetes: Any of an order (Actinomy- Detritus: loose material (as rock fragments or or-cetales) of filamentous or rod-shaped bacteria, ganic particles) that results directly from disin-including the actinomyces (soil-inhabiting sap- tegration.rophytes and disease-producing parasites) and Divalent: Having a valence (combining power atstreptomyces. atomic level) of two [e.g., Calcium (Ca +)].
Anthropogenic pollutants: Pollutants which Hypoxia: Acute oxygen deficiency to tissues.come from human sources such as emissions Ligands: A group, ion, or molecule coordinated tofrom an industrial plant or pesticide emissions a central atom or molecule at a complex.from agriculture. These pollutants are referred Most probable number A measure of bacterialto as anthropogenic because they typically are numbers in which the bacteria are serially di-associated with human activity. However, it is luted and grown. By identifying the dilutionpossible for some of them to come from natural samples in which the bacteria grow, the numbersources. of bacteria in the original samples can be deter-
Benthos: organisms that live on or in the bottom mined.of bodies of water. Necrosis: Localized death of living tissue.
Bioaccumulation factor (BCF): A measure of the Osmoregulation: The biological process of main-extent to which a compound bioaccumulates in taining the proper salt concentration in bodyan aquatic species. It is calculated as (concentra- tissues to support life.tion of the compound in the body tissue) di- Parenchymatous: related to the essential and dis-vided by (concentration of the compound in the tinctive tissue of an organ or an abnormalwater). growth as distinguished from it supportive
Biological oxygen demand (BOD): The amount framework.of dissolved oxygen used up by microorgan- Physio-chemical properties of water The basicisms in the biochemical oxidation of organic physical and chemical properties of water indud-matter. Five-day BOD (BOD5) is the amount of ing salinity, pH etc. Note this does not includedissolved oxygen consumed by microorgan- concentrations of anthropogenic pollutants.isms in the biochemical oxidation of organic Redox: Of or relating to oxidation- reduction.matter over a 5-day period at 200C. Tainting or Off-flavor When certain pollutants
Cations: The ion in an electrolyzed solution that such as petroleum hydrocarbons accumulate inmigrates to the cathode: a positively charged ion. fish or shellfish to a level at which the flavor is
Chelating Agents: A compound that combines affected. This makes the product undesirablewith a metal. for human consumption.
Chloracne: An eruption/inflammation of the skin Zeolites: Any of various hydrous silicates that areresulting from exposure to chlorine. analogous in composition to the feldspars, oc-
Colony forming units: A measure of bacterial cur as secondary minerals in cavities of lavas,numbers which is determined by growing the and can act as ion exchangers used fro waterbacteria and counting the resulting colonies. softening and as absorbents, and catalysts.
x

CHAPTER 1
Assessing Source Water Quality
W ater is the most important element has become common in industrialized nations,for aquaculture. Selection of source a trend threatening the industrializing coun-water should be based on its suit- tries of Asia.
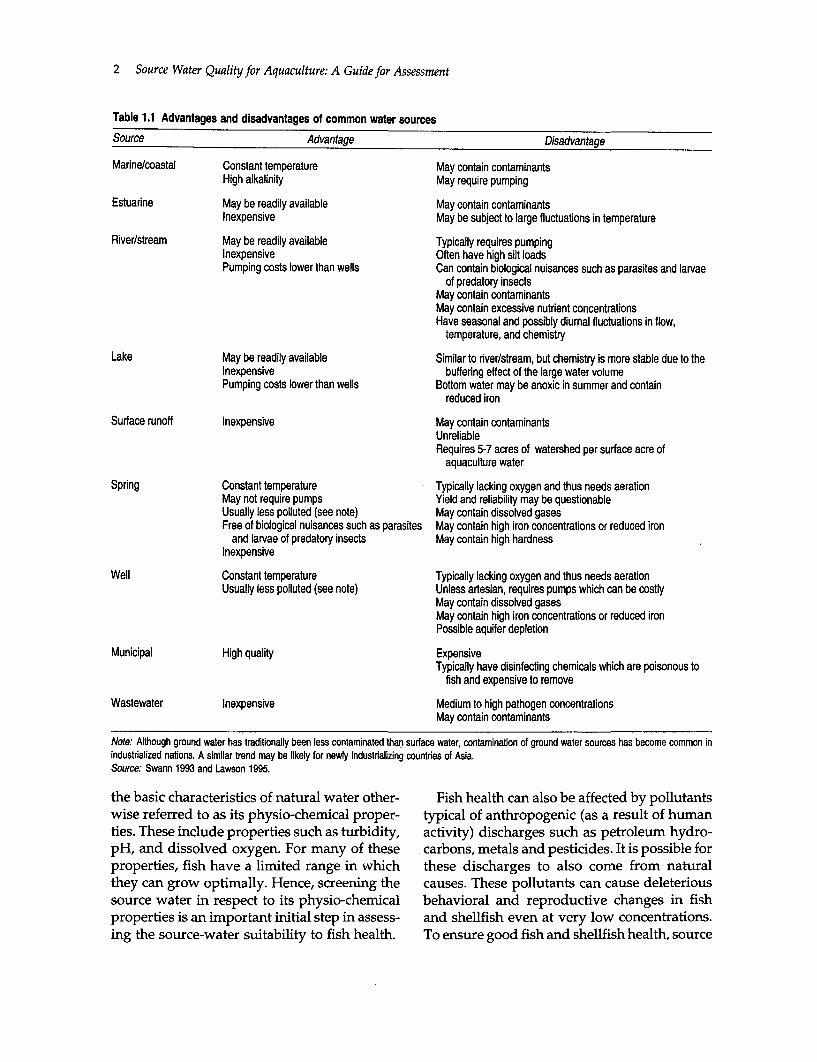
ability for efficient production of a high quality For aquaculture in salt or brackish water,aquaculture product. Poor water quality may preference is for source water that is away fromaffect fish and shellfish health through impair- any generator of pollution, such as industries,ment of development and growth or may de- tainted river mouths, or agricultural areas. Thisgrade the quality of the product by tainting its water is less susceptible to fluctuations in sa-flavor or by causing accumulation of high con- linity and other chemical properties and is lesscentrations of toxic substances which could en- likely to be contaminated by coastal dischargesdanger human health. The importance of water (Lawson 1995, 52). The most common advan-quality has created a need for guidelines for tages and disadvantages of each type of sourcedetermining the suitability of source waters are shown in table 1.1.proposed for use in these projects.
Source Water Quality IssuesChoice of Source Water
Once potential source waters are identified, itThe first step is identification of the most prom- is imperative to insure the water quality is suit-ising source water by carefully considering the able for aquaculture. Poor water quality mayadvantages and disadvantages of different cause project failure by producing a producttypes of water sources. Water sources fall into either in insufficient quantity or unmarketableroughly nine categories: marine/coastal, estu- size or quality. Water quality can cause death,aries, rivers/streams, lakes, surface runoff, disease, or poor growth in fish and shellfish.springs, wells, wastewater, and municipal In addition, poor water quality can contami-water. nate the product with compounds dangerous
In general, for fresh water aquaculture, to human health.groundwater sources (springs and wells) arepreferred. They maintain a constant tempera- Fish and Shellfish Healthture, are free of biological nuisances such asfish eggs, parasites and larvae of predatory in- Fish and shellfish health is very sensitive tosects and are usually less contaminated than water quality. Water quality criteria are basedsurface water sources. Ground water has tra- on studies of growth, behavior, and health ofditionally been less contaminated than surface different species in various waters. One set ofwater. Contamination of ground water sources parameters which affect fish and shellfish are
1
2 Source Water Quality for Aquaculture: A Guide for Assessment
Table 1.1 Advantages and disadvantages of common water sources
Source Advantage Disadvantage
Marine/coastal Constant temperature May contain contaminantsHigh alkalinity May require pumping
Estuarine May be readily available May contain contaminantsInexpensive May be subject to large fluctuations in temperature
River/stream May be readily available Typically requires pumpingInexpensive Often have high silt loadsPumping costs lower than wells Can contain biological nuisances such as parasites and larvae
of predatory insectsMay contain contaminantsMay contain excessive nutrient concentrationsHave seasonal and possibly diumal fluctuations in flow,
temperature, and chemistry
Lake May be readily available Similar to river/stream, but chemistry is more stable due to theInexpensive buffering effect of the large water volumePumping costs lower than wells Bottom water may be anoxic in summer and contain
reduced iron
Surface runoff Inexpensive May contain contaminantsUnreliableRequires 5-7 acres of watershed per surface acre of
aquaculture water
Spring Constant temperature Typically lacking oxygen and thus needs aerationMay not require pumps Yield and reliability may be questionableUsually less polluted (see note) May contain dissolved gasesFree of biological nuisances such as parasites May contain high iron concentrations or reduced iron
and larvae of predatory insects May contain high hardnessInexpensive
Well Constant temperature Typically lacking oxygen and thus needs aerationUsually less polluted (see note) Unless artesian, requires pumps which can be costly
May contain dissolved gasesMay contain high iron concentrations or reduced ironPossible aquifer depletion
Municipal High quality ExpensiveTypically have disinfecting chemicals which are poisonous to
fish and expensive to remove
Wastewater Inexpensive Medium to high pathogen concentrationsMay contain contaminants
Note: Although ground water has traditionally been less contaminated than surface water, contaminabon of ground water sources has become common inindustrialized natons. A similar trend may be likely for newly industrializing countries of Asia.Source: Swann 1993 and Lawson 1995.
the basic characteristics of natural water other- Fish health can also be affected by pollutantswise referred to as its physio-chemical proper- typical of anthropogenic (as a result of humanties. These include properties such as turbidity, activity) discharges such as petroleum hydro-pH, and dissolved oxygen. For many of these carbons, metals and pesticides. It is possible forproperties, fish have a limited range in which these discharges to also come from naturalthey can grow optimally. Hence, screening the causes. These pollutants can cause deleterioussource water in respect to its physio-chemical behavioral and reproductive changes in fishproperties is an important initial step in assess- and shellfish even at very low concentrations.ing the source-water suitability to fish health. To ensure good fish and shellfish health, source

Assessing Source Water Quality 3
water must also be screened using water qual- pected, tests can be done by preparing a pilotity criteria for these chemicals. study in which fish are grown in the source
water and subsequently tested for contaminantProduct Quality and Human Health concentrations in body tissue.
The quality of the aquaculture product and its Guidelines for Evaluating Sourcesuitability for human consumption may also Water Qualitybe affected by water quality. Even if culturespecies are able to grow and thrive in a given In evaluating the suitability of the quality ofsource water, low levels of pollutants may source water for new, improved, or expandedcause the aquaculture products to be contami- aquaculture developments, a three-phasednated or have off-flavor. Off-flavor or tainting screening process is recommended. For wateroccurs when certain pollutants such as petro- quality analysis it is recommended that thoseleum hydrocarbons or metals accumulate in methods defined in Standard Methods for Ex-fish or shellfish to a level at which the flavor amination of Water and Wastewater (APHAis affected, making the product undesirable for 1995) be followed which for many factorshuman consumption. would require an expert water quality analysis
The process by which pollutants concentrate laboratory to do the assays. It is also importantin seafood is called bioaccumulation (box 1.1, to note that the water quality suitable for hatch-p. 6). Many pollutants, especially those which ery, nursery, and grow-out systems for a par-are fat soluble, collect in the tissues of aquatic ticular species vary to some degree and areanimals. This process results in higher concen- discussed in the text with the informationtrations of pollutants in body tissues of aquatic available for each type.organisms than in the surrounding water. For Phase I as illustrated in figure 1.1, the
Accumulation of contaminants in fish and water quality criteria for the basic physio-shellfish is of great concern to the aquaculture chemical properties necessary to sustain theindustry. Consumers are highly sensitive to the cultured organisms will be compared to meas-quality of food products and any potential urements made on the source water. This willhealth risks. Media reports of contamination of provide a simple means of screening the sourceseafood can seriously affect consumer percep- water without going through the more expen-tion, marketing, and production of all kinds of sive tests for anthropogenic pollutants. Ac-fisheries products. In addition, rejection of cordingly, if anthropomorphic pollution oraquaculture products which fail to meet import naturally occurring toxins (for example, arse-quality standards may have serious long-term nic, toxic algae) are not suspected and Phase Iimplications for the exporting country and pro- criteria are met, the source water can be con-ducers. sidered acceptable. If Phase I criteria are not
Quality standards established by national met in this circumstance, a Phase III field trialgovernments are the means by which humans can be pursued. If the Phase III trial cannot beare protected from contaminated seafood. In- conducted, the water should either be rejectedternational and domestic commerce is regu- or accepted if a technically feasible and costlated to prevent contaminated fish and effective water treatment is identified andshellfish from reaching the market. Thus meet- tested, bringing the source water within ac-ing these standards are an important goal for ceptable Phase I criteria.the products of a successful aquaculture pro- Phase II is designed to screen for criteria onject from both an economic and public health anthropogenic pollutants in source water andperspective. Such water quality standards can would be conducted after the source water hasbe incorporated into a water quality assess- been tested and met the Phase I criteria. Inment. In cases where bioaccumulation is sus- addition, biological contaminants such as algal

4 Source Water Quality for Aquaculture: A Guide for Assessment
Figure 1.1 Analytical process for evaluating source water quality for aquacuiture
Qualitative SitAssessment
PHASE 1: isPHASE 1:Physlco-Chemlcal a Anlo9utonai Physlco-Chemlcal
Water Quality Water Quality
1No WsQimiiy vWaerulyCurtIla Met? Criteile Met
5 7 // / ~~~~~~~~~~~~~~~~~~No
PHASE II:Acc\tSbie? Anthroprogenic Are Risk \
N k-\7// | Pollutants l /
No~~~~~~~~~~~~~~~~~~~~~~~~~~~~~~~~~~~~I
Ye WS V auab
Field Trial and ITemst DNign
Met?s MetI
Trearert Do Not AcceptAccept Source Water FY sb o SourCe Waterinanciey Suc ae
Pamible?~~

Assessing Source Water Quality 5
Box 1.1 Bioaccumulation
Bioaccumulation is a process in which chemical pol- pollutants concentrated in their tissues. There is lit-lutants that enter into the body of an organism (by tle evidence that chemicals which bioaccumulate inadsorption through the gills and intestine or by di- the fatty tissues of aquatic species high in the foodrect exposure through the skin) are not excreted, chain cause deleterious effects on these organisms.but rather collect in its tissues. However, it is thought that birds and mammals
Rates of bioaccumulation in aquatic species vary which feed on these aquatic organisms experiencegreatly depending on species behavior and physi- deleterious effects. Therefore, there are considerableology. For example, bottom feeders are more sensi- health concerns (for example, cancer, damage to thetive to pollutants associated with sediments. The nervous system) about the accumulation of suchdifferences in the mechanism of regulating salt con- substances in the tissues of fish which are con-centration between fresh and salt water fish may sumed by humans. The U.S. Environmental Protec-affect exposure to water soluble contaminants. Dif- tion Agency conducted a national study offerent species may also accumulate various pollut- accumulated toxins in fish caught in open watersants in different tissues, such as muscle, kidneys, or which documents the concern (USEPA 1992).liver. The toxicity of contaminants, bioavailability, Sometimes pollutants can be naturally cleansedand rates of bioaccumulation are also influenced by from the tissue of aquatic animals by placing themenvironmental factors such as temperature, dis- in clean water for a given period of time. The ratesolved oxygen, alkalinity, pH, redox potential, col- of cleansing, or depuration, depends upon the spe-loids, dissolved organics and suspended solids. cies and the contaminant in question. The only
Species higher in the food chain tend to accumu- other way to address the problem of bioaccumula-late higher concentrations of many pollutants be- tion is to reduce exposure of the fish to the contami-cause they are feeding on organisms which have nant through improved water quality.
toxins can also be screened. Because it is nei- criteria are met, it is not mandatory to pursuether feasible nor desirable to test for every pos- Phase m. However it is advised that Phase msible pollutant, only pollutants typical of be pursued, if possible, as a means of minimiz-current and historical industrial, municipal, ing the risk of project failure.and agricultural activities in the watershed Phase m involves a pilot study or field testshould be tested. In some cases high concen- in which fish are grown in the selected sourcetrations may occur in nature. This is common water, using similar management techniquesin areas with large deposits of a particular min- as those of the proposed project, and theneral. If large natural sources are suspected in tested for bioaccumulated pollutants and off-the area, tests should be conducted to analyze flavor. The pilot study could also be replacedfor the toxin(s). If the source water fails to meet by sampling fish and shellfish tissues from anPhase II criteria, the feasibility of pre-treating existing aquaculture facility, if available, in thethe water before use could be considered as in vicinity that uses the same planned technologyPhase I. A decision as to whether to pursue a and the source water in question. FollowingPhase III field trial or reject the source water Phase III where implemented, a final decisioncan then be made. If both Phase I and Phase II can be made on the use of the source water.
CHAPTER 2
Phase I: Physio-chemical WaterQuality Parameters
Basic Factors peraturelimits;however, suboptimaltempera-ture conditions cause stress which affects be-
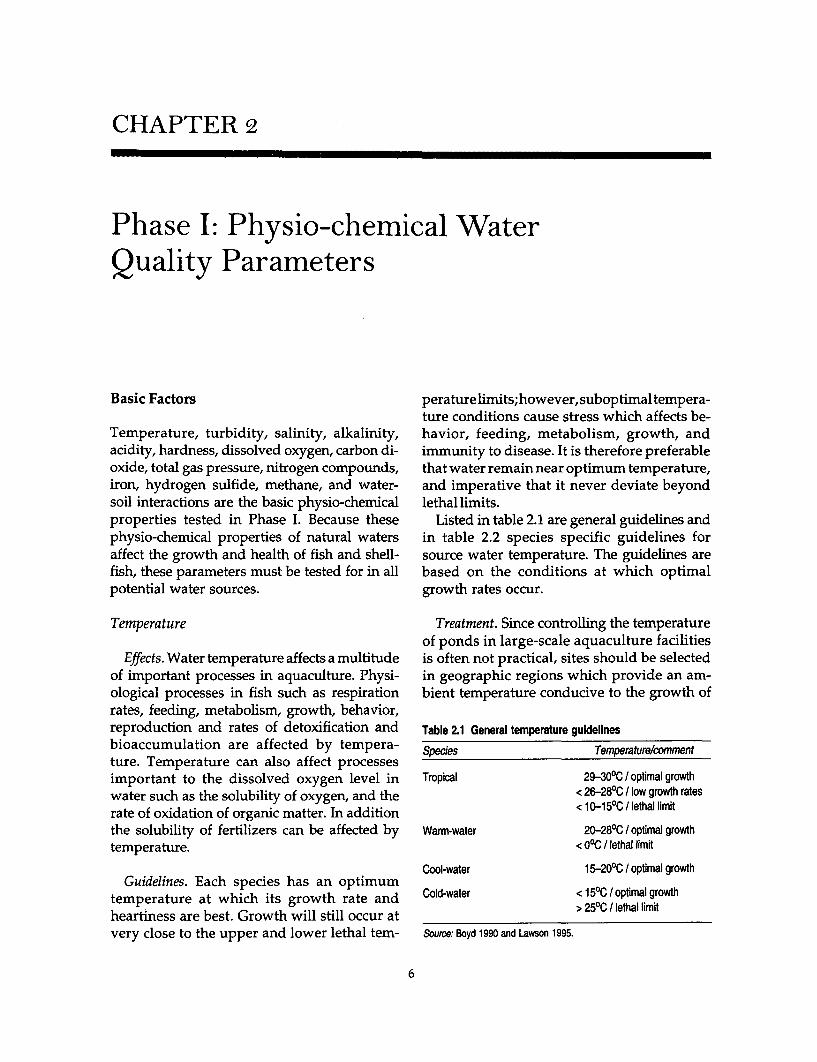
Temperature, turbidity, salinity, alkalinity, havior, feeding, metabolism, growth, andacidity, hardness, dissolved oxygen, carbon di- immunity to disease. It is therefore preferableoxide, total gas pressure, nitrogen compounds, that water remain near optimum temperature,iron, hydrogen sulfide, methane, and water- and imperative that it never deviate beyondsoil interactions are the basic physio-chemical lethal limits.properties tested in Phase I. Because these Listed in table 2.1 are general guidelines andphysio-chemical properties of natural waters in table 2.2 species specific guidelines foraffect the growth and health of fish and shell- source water temperature. The guidelines arefish, these parameters must be tested for in all based on the conditions at which optimalpotential water sources. growth rates occur.
Temperature Treatment. Since controlling the temperatureof ponds in large-scale aquaculture facilities
Effects. Water temperature affects a multitude is often not practical, sites should be selectedof important processes in aquaculture. Physi- in geographic regions which provide an am-ological processes in fish such as respiration bient temperature conducive to the growth ofrates, feeding, metabolism, growth, behavior,reproduction and rates of detoxification and Table 2.1 General temperature guidelines
bioaccumulation are affected by tempera- Species Temperaturelcommentture. Temperature can also affect processesimportant to the dissolved oxygen level in Tropical 29-300C / optimal growthwater such as the solubility of oxygen, and the < 26280C / low growth ratesrate of oxidation of organic matter. In addition < 10-150C / lethal limHthe solubility of fertilizers can be affected by Warm-water 20-280C / optimal growthtemperature. < oOC / lethal limit
Cool-water 15-200C / optimal growthGuidelines. Each species has an optimum
temperature at which its growth rate and Cold-water <150C/ optimal growth
heartiness are best. Growth will still occur at >_25°C_/_lethal_limHvery close to the upper and lower lethal tem- Source: Boyd 1990 and Lawson 1995.
6
Phase I: Physio-chemical Water Quality Parameters 7
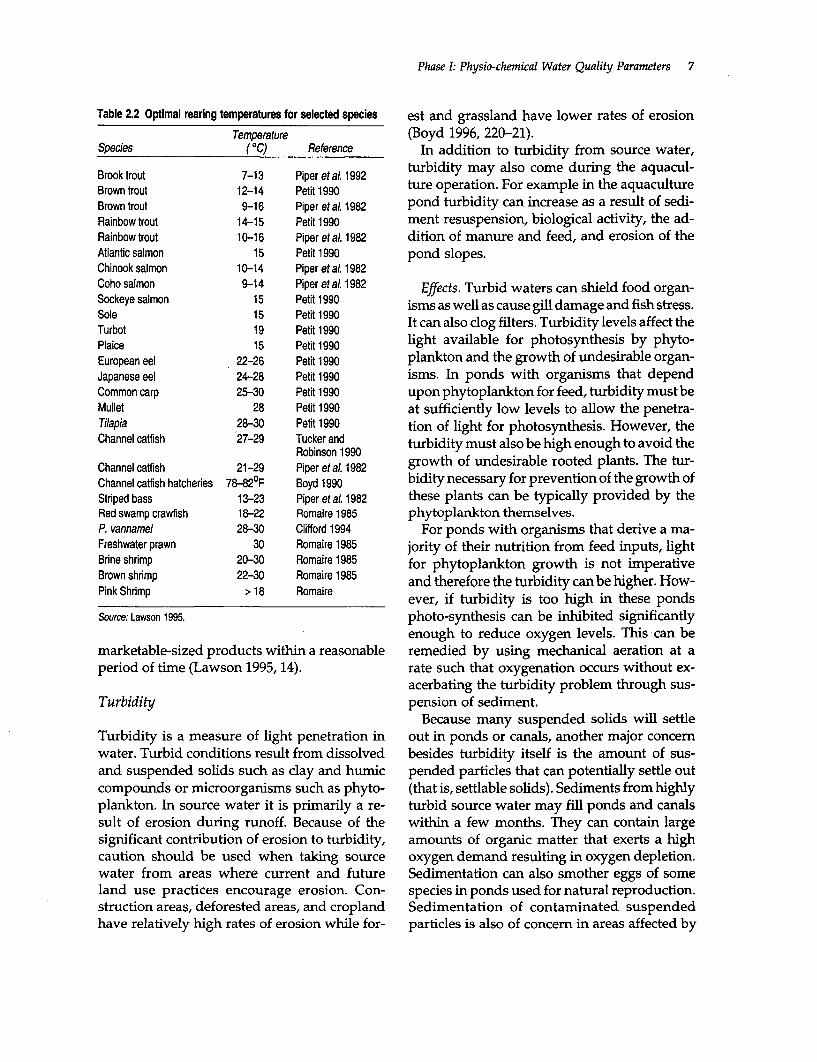
Table 2.2 Optimal rearing temperatures for selected species est and grassland have lower rates of erosion
Temperature (Boyd 1996, 220-21).Species (°C) Reference In addition to turbidity from source water,
Brook trout 7-13 Piper et aL 1992 turbidity may also come during the aquacul-Brown trout 12-14 Petit 1990 ture operation. For example in the aquacultureBrown trout 9-16 Piper etal. 1982 pond turbidity can increase as a result of sedi-Rainbow trout 14-15 Petit 1990 ment resuspension, biological activity, the ad-Rainbow trout 10-16 Piper et aL 1982 dition of manure and feed, and erosion of theAtlantic salmon 15 Petit 1990 pond slopes.Chinook salmon 10-14 Piper et aL 1982Coho salmon 9-14 Piper et aL 1982 Effects. Turbid waters can shield food organ-Sockeye salmon 15 Petit 1990 isms as well as cause gllU damage and fish stress.
Turbot 19 Petit 1990 It can also clog filters. Turbidity levels affect thePlaice 15 Petit 1990 light available for photosynthesis by phyto-European eel 22-26 Petit 1990 plankton and the growth of undesirable organ-Japanese eel 24-28 Petit 1990 isms. In ponds with organisms that dependCommon carp 25-30 Petit 1990 upon phytoplankton for feed, turbidity must beMullet 28 Petit 1990 at sufficiently low levels to allow the penetra-Tilapia 28-30 Petit 1990 tion of light for photosynthesis. However, theChannel caffish 27-29 Tucker and turbidity must also be high enough to avoid the
Channel catfish 21-29 Piperoet at. 1982 growth of undesirable rooted plants. The tur-Channel caffish hatcheries 78-82°F Boyd 1990 bidity necessary for prevention of the growth ofStriped bass 13-23 Piper et at 1982 these plants can be typically provided by theRed swamp crawfish 18-22 Romaire 1985 phytoplankton themselves.P. vannamei 28-30 Clifford 1994 For ponds with organisms that derive a ma-Freshwater prawn 30 Romaire 1985 jority of their nutrition from feed inputs, lightBrine shrimp 20-30 Romaire 1985 for phytoplankton growth is not imperativeBrown shrimp 22-30 Romaire 1985 and therefore the turbidity can be higher. How-Pink Shrimp > 18 Romaire. ..Pink____Shrimp____>_______Romaire ___ ever, ff turbidity is too high in these pondsSource: Lawson 1995. photo-synthesis can be inhibited significantly
enough to reduce oxygen levels. This can bemarketable-sized products within a reasonable remedied by using mechanical aeration at aperiod of time (Lawson 1995,14). rate such that oxygenation occurs without ex-
acerbating the turbidity problem through sus-Turbidity pension of sediment.
Because many suspended solids will settleTurbidity is a measure of light penetration in out in ponds or canals, another major concernwater. Turbid conditions result from dissolved besides turbidity itself is the arnount of sus-and suspended solids such as clay and humic pended particles that can potentially settle outcompounds or microorganisms such as phyto- (that is, settlable solids). Sediments from highlyplankton. In source water it is primarily a re- turbid source water may fill ponds and canalssult of erosion during runoff. Because of the within a few months. They can contain largesignificant contribution of erosion to turbidity, amounts of organic matter that exerts a highcaution should be used when taking source oxygen demand resulting in oxygen depletion.water from areas where current and future Sedimentation can also smother eggs of someland use practices encourage erosion. Con- species in ponds used for natural reproduction.struction areas, deforested areas, and cropland Sedimentation of contaminated suspendedhave relatively high rates of erosion while for- particles is also of concern in areas affected by

8 Source Water Quality for Aquaculture: A Guide for Assessment
pollutants such as heavy metals and pesticides end of the growing season, or dredging un-(Boyd 1990, 138). drainable ponds. Sediments removed from
aquaculture facilities may be considered an en-Guidelines. Lethal levels of turbidity have virormental hazard and, hence, be difficult
been shown to be 500-1,000 milligrams per liter and/or costly to dispose (Boyd 1990, 365-72).(mg l-l) for cold water fish (Alabaster and Lloyd1982). Channel catfish have tested more tolerant Salinitywith their fingerlings and adults survivinglong-term exposures to 100,000 mg l-l with be- Salinity is a measure of the total concentrationhavioral changes occurring above 20,000 mg l-l of dissolved ions in water and measured in(Tucker and Robinson 1990). Listed in table 2.3 parts per thousand (%.). Salinity varies de-are the ranges in which good to moderate fish pending on where the water source lies in theproduction can be obtained. Recommended spectrum from seawater to freshwater. Typicalsuspended solids concentrations for salmonid salinity values are less than 0.5%. for fresh-culture from different literature sources are: less water, 0.5 to 30%o for brackish water and 30 tothan 30 mg 1-1, less than 80 mg l-', and less than 40%. for marine water.25 mg 1-'. 1 In freshwater, the salinity and the elements
contributing most significantly to salinity canTreatment. Colloids or very small suspended vary depending on the rainfall and the geology
particles can be coagulated and precipitated by of the area. Freshwater commonly containsadding electrolytes such as aluminum sulfate relatively high concentrations of carbonate,(alum). While alum is very effective, it can cause silicic acid, calcium, magnesium and sodiumother water quality problems by reducing alka- (Stumm and Morgan 1981, 551).linity and pH (see sections on pH and alkalin- The salinity of seawater varies depending onity). Lime can be added to counteract these proximity to the coastline, rainfall, rivers, andeffects. Turbidity caused by suspended clay can other discharges. The elements contributingbe precipitated by the addition of organics such most to the salinity of seawater however doas barnyard manure, cottonseed meal, or super- not vary markedly. Chloride and sodium ionsphosphate. However organic matter is often contribute most significantly with sulfate,difficult to obtain and apply; and it exerts an magnesium, calcium, potassium, and bicar-oxygen demand when decomposing. Avoiding bonate ions contributing to a lesser degreeor addressing the source of turbidity is a better (Stunmm and Morgan 1981, 567). Optimum sa-strategy than chemical treatments which re- linities for selected species and general guide-quire frequent application and may result in lines are shown in table 2.4.other water quality problems.
Current methods of sediment (settlable sol- Effects. Salinity is tremendously importantids) control involve using sediment ponds or to fish which must maintain the concentrationcanals to reaove the bulk of sediment before of dissolved salts in their bodies at a fairlywater enters the culture area, draining ponds constant level. Through the process of osmo-and removing sediments periodically at the regulation the fish expends energy in order to
maintain this level. Each organism has a rangeTable 2.3 Turbidity tolerance levels for aquaculture of salinity in which it can grow optimally, andEffect Suspended solids concentration when it is out of this range, excess energy
needs to be expended in order to maintain theNo harmful effects on fisheries 25 mg j1 desired salt concentration. This is done at theAcceptable range 25-80 mgr Detrimental to fisheries 80 mg i" expense of other physiological functions, if the
salinity deviates too far from the optimumSource: Boyd 1990. range.
Phase I: Physio-chemical Water Quality Parameters 9
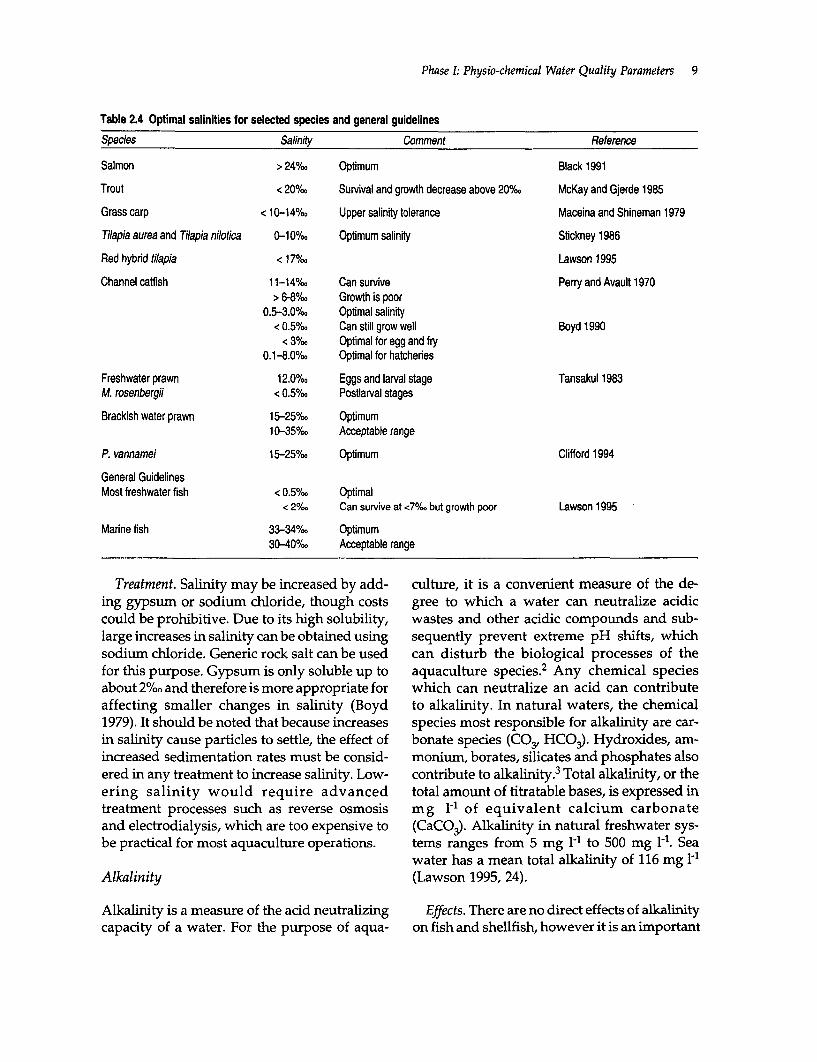
Table 2.4 Optimal salinities for selected species and general guidelines
Species Salinity Comment Reference
Salmon > 24%o Optimum Black 1991
Trout < 200/%o Survival and growth decrease above 200/%o McKay and Gjerde 1985
Grass carp < 10-140/%o Upper salinity tolerance Maceina and Shineman 1979
Tilapia aurea and Tilapia nilotica 0-10%o Optimum salinity Stickney 1986
Red hybrid tilapia < 170/% Lawson 1995
Channel catfish 1 1-14%0/o Can survive Perry and Avault 1970> 6-80/o. Growth is poor
0.5-3.00/o. Optimal salinity< 0.50/co Can still grow well Boyd 1990
< 30/o Optimal for egg and fry0.1-8.00/%o Optimal for hatcheries
Freshwater prawn 1 2.00/co Eggs and larval stage Tansakul 1983M. rosenbergii < 0.5%/o Postlarval stages
Brackish water prawn 15-250/oo Optimum1 0-350/oo Acceptable range
P. vannamei 15-250/oo Optimum Clifford 1994
General GuidelinesMost freshwater fish < 0.50/oo Optimal
< 2%o Can survive at <70/c but growth poor Lawson 1995
Marine fish 33-340/oo Optimum30-400/oo Acceptable range
Treatment. Salinity may be increased by add- culture, it is a convenient measure of the de-
ing gypsum or sodium chloride, though costs gree to which a water can neutralize acidic
could be prohibitive. Due to its high solubility, wastes and other acidic compounds and sub-
large increases in salinity can be obtained using sequently prevent extreme pH shifts, which
sodium chloride. Generic rock salt can be used can disturb the biological processes of the
for this purpose. Gypsum is only soluble up to aquaculture species.2 Any chemical species
about 2%o and therefore is more appropriate for which can neutralize an acid can contribute
affecting smaller changes in salinity (Boyd to alkalinity. In natural waters, the chemical
1979). It should be noted that because increases species most responsible for alkalinity are car-
in salinity cause particles to settle, the effect of bonate species (COy HCO). Hydroxides, am-
increased sedimentation rates must be consid- monium, borates, silicates and phosphates also
ered in any treatment to increase salinity. Low- contribute to alkalinity.3 Total alkalinity, or the
ering salinity would require advanced total amount of titratable bases, is expressed in
treatment processes such as reverse osmosis mg 1-1 of equivalent calcium carbonate
and electrodialysis, which are too expensive to (CaCO3 ). Alkalinity in natural freshwater sys-
be practical for most aquaculture operations. tems ranges from 5 mg 1-1 to 500 mg 1-1. Sea
water has a mean total alkalinity of 116 mg l-l
Alkalinity (Lawson 1995, 24).
Alkalinity is a measure of the acid neutralizing Effects. There are no direct effects of alkalinity
capacity of a water. For the purpose of aqua- on fish and shellfish, however it is an important
10 Source Water Quality for Aquaculture: A Guide for Assessment
parameter due to its indirect effects. Most im- water but to processes that occur during theportantly, alkalinity protects the organism from aquaculture operation. 5 However, sourcemajor changes in pH. The metabolism and res- water with a proper pH is imperative, and thepiration of fish and micro-organisms, particu- pH of any potential source water should belarly phytoplankton and bacteria, can produce screened.wastes and by-products which can change pH.In addition some biological processes can Effects. The pH of water used in aquaculturechange alkalinity itself by producing or con- can affect fish health directly. For most species,suming acids or bases.4 A summary of some a pH between 6.5 and 9 is ideal. Below pH 6.5processes are shown in appendix table 1. species experience slow growth (Lloyd 1992,
Alkalinity may have another indirect effect 64). At lower pH, the species ability to maintainon aquaculture through its effect on photo- its salt balance is affected (Lloyd 1992, 87) andsynthesis. If alkalinity is too low (less than 20 reproduction ceases. At approximately pH 4 ormg l-1), the water may not contain sufficient below and pH 11 or above, most species diecarbon dioxide (CC2) or dissolved carbonates (Lawson 1995, 26).for photosynthesis to occur, thus restricting The pH can also indirectly affect fish andphytoplankton growth (Lawson 1995, 24). shellfish through its effects on other chemical
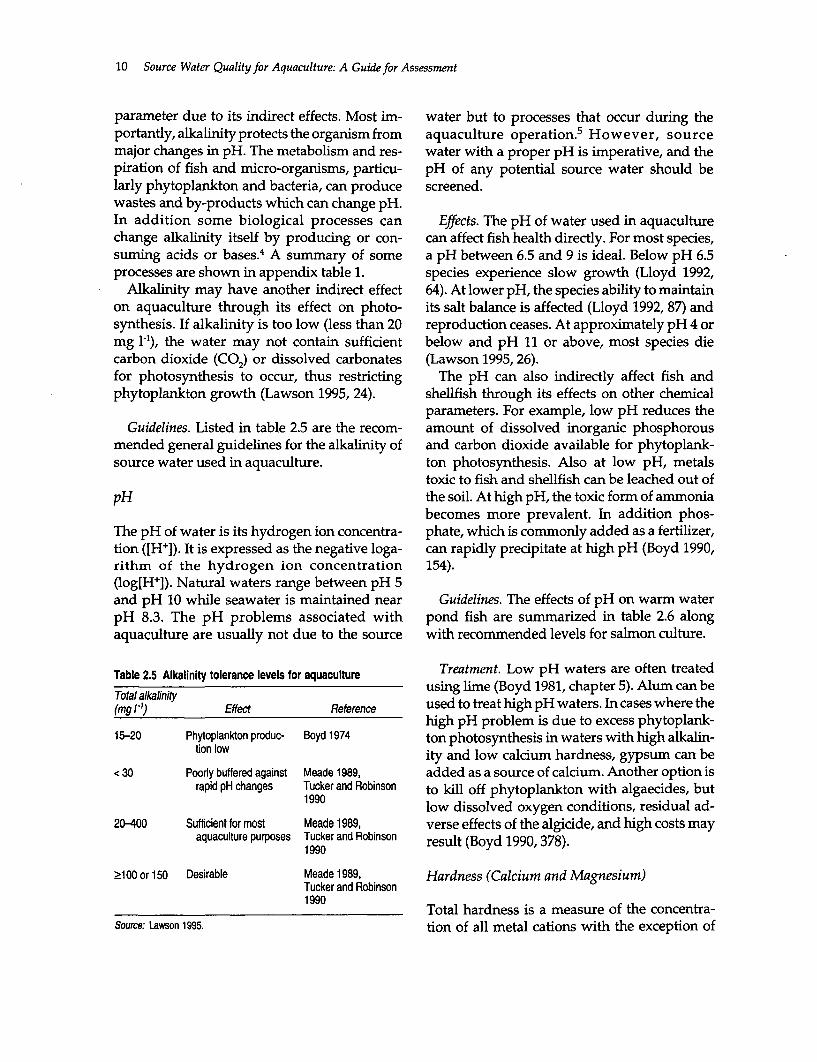
parameters. For example, low pH reduces theGuidelines. Listed in table 2.5 are the recom- amount of dissolved inorganic phosphorous
mended general guidelines for the alkalinity of and carbon dioxide available for phytoplank-source water used in aquaculture. ton photosynthesis. Also at low pH, metals
toxic to fish and shellfish can be leached out ofpH the soil. At high pH, the toxic form of ammonia
becomes more prevalent. In addition phos-The pH of water is its hydrogen ion concentra- phate, which is commonly added as a fertilizer,tion ([H+]). It is expressed as the negative loga- can rapidly precipitate at high pH (Boyd 1990,rithm of the hydrogen ion concentration 154).(log[H+]). Natural waters range between pH 5and pH 10 while seawater is maintained near Guidelines. The effects of pH on warm waterpH 8.3. The pH problems associated with pond fish are summarized in table 2.6 alongaquaculture are usually not due to the source with recommended levels for salmon culture.
Table 2.5 Alkalinity tolerance levels for aquaculture Treatment. Low pH waters are often treated
Total alkalinity using lime (Boyd 1981, chapter 5). Alum can be(mg l.1) Effect Reference used to treat high pH waters. In cases where the
high pH problem is due to excess phytoplank-15-20 Phytoplankton produc- Boyd 1974 ton photosynthesis in waters with high alkalin-
tion low ity and low calcium hardness, gypsum can be
< 30 Poorly buffered against Meade 1989, added as a source of calcium. Another option israpid pH changes Tucker and Robinson to kill off phytoplankton with algaecides, but
1990 low dissolved oxygen conditions, residual ad-20-400 Sufficient for most Meade 1989, verse effects of the algicide, and high costs may
aquaculture purposes Tucker and Robinson result (Boyd 1990, 378).1990
2100 or 150 Desirable Meade 1989, Hardness (Calcium and Magnesium)Tucker and Robinson1 9901990_______________ Total hardness is a measure of the concentra-
Source: Lawson 1995. tion of all metal cations with the exception of

Phase I: Physio-chemical Water Quality Parameters 11
Table 2.6 pH tolerance levels and effect for aquaculture for bone and exoskeleton formation and for
pH levels Effect osoregulation. Crustaceans absorb calcium
Warmn water pond fish from the water when molting, and if the water
<14.0 Acid death point is too soft their exoskeletons begin to soften and
4.0-5.0 No reproduction they may cease to molt. In addition, bone de-
4.0-6.5 Slow growth formities and reduced growth rates may resultif water is too soft.6
6.5-9.0 Desirable range for fish Hardness also affects aquaculture species
production and operations through its chemical interac-
9.0-11.0 Slow growth tions with other species in water. Calcium re-
> 11.0 Alkaline death point duces the toxicity of metals, ammonia, and the
Salmonid culture hydrogen ion. In addition, due to the higher
6.4-8.4 Recommended range for fish ion concentration m hard waters, suspendedproduction soil particles settle faster in hard waters than
soft waters. For waters where alkalinity is high6.7-8.6 Recommended range forpfish and calcium is low, photosynthesis may in-
crease the pH to levels that are toxic to fish6.7-7.5 Recommended range for fish (Boyd 1990, 143, 377).
production
Sources: Lawson 1995, Tarazona and Munoz 1995. Guidelines. In general the most productive
waters for fish culture have roughly equal mag-
the alkali metals. Calcium and magnesium are nitudes of total hardness and total alkalinity.7
the most common cations contributing to hard- Listed in table 2.8 are general and species spe-
ness in fresh water systems. To a much lesser cific guidelines for freshwater aquaculture.
extent, hardness also includes other divalent Hardness averages 6,600 mg Pl in ocean water
ions such as iron (Fe2 +) and barium (Ba2+). and therefore is not a problem in seawater or
Water is classified with respect to its hardness brackish water systems (Lawson 1995, 25).
and softness as shown in table 2.7.
These categories were originally developed Treatment. Insufficient hardness is easily
for municipal water treatment and thus have overcome. Calcium hardness can be raised by
no biological relevance. It should be noted that adding agricultural gypsum or calcium chlo-
much of the concern about hardness in water ride. Gypsum is preferable because it costs less,
treatment is with all the ions involved, while is more readily available, and does not affect
in aquaculture the concern is mostly with the alkalinity. Its disadvantages include the vari-
calcium concentration. able purity of agricultural gypsum (70-98 per-
cent) and its slow reaction rate relative to
Effects. Calcium is the most important compo- calcium chloride (Boyd 1990,383).
nent of hardness to aquaculture. It is necessary
Dissolved Oxygen
Table 2.7 Hardness tolerance levels for aquaculture
Concentration Dissolved oxygen (DO) is a very basic require-Water classification (CaCOa per liter) ment for aquaculture species. It is usually the
first limiting factor to occur in pond culture.Soft 0-75 mg Dissolved oxygen is a complex parameter be-Moderate 75-150mg cause its concentration is dependent uponHard 150-300 mgVery hard > 300 mg many processes. In an aquaculture system the
sources of dissolved oxygen are photosynthe-Source: Sawyer and McCarty 1978. sis and reaeration from the atmosphere. The

12 Source Water Quality for Aquaculture: A Guide for Assessment
Table 2.8 Optimal ranges for total hardness
Total hardnessSpecies (mg 1-1) Comment Reference
Hatchling silver carp 300-500 Optimum Boyd 1990Channel catfish hatchery > 20 Optimum Boyd 1990Trout hatchery 10-400 Suggested Piper eta!. 1982Warm water hatchery 50-400 Suggested Piper et aL 1982Freshwater crustaceans > 50 Some species need more Boyd 1990Freshwater crayfish > 100 For optimum production De la Bretonne et a/. 1969
General guideline 20-300 Hardness = alkalinity Boyd and Walley 1975Romaire 1985
sinks include oxygen-consuming processes in slow growth. As dissolved oxygen gets be-
such as respiration from microbial life, fish, low 1 mg l-l, it becomes first lethal after long-
and plants, and the degradation of organic term exposure; and at lower dissolved oxygen,
matter by microorganisms (biological oxygen only small fish can survive short-term exposures
demand or BOD). These processes are influ- (Lawson 1995, 23). At high oxygen concentra-
enced by other factors. Photosynthesis, respi- tions, oxygen supersaturation can contribute to
ration, the degradation of organic matter, gas bubble trauma (see section on total gas pres-
and the solubility of oxygen are all influenced sure). Although when combined with other
by temperature. The type of fish, life stage, gases, oxygen can cause gas bubble trauma.feeding practices, level of activity and dis- High oxygen concentrations alone do not result
solved oxygen concentration also influence the in gas bubble trauma, but high dissolved oxygen
respiration rate. In addition to temperature, concentrations occurring at times when water
oxygen solubility is also affected by salinity, temperature increases rapidly can augment thebarometric pressure and impurities. The most phenomenon (Tarazona and Munoz 1995, 124).
common cause of low dissolved oxygen in an Oxygen supersaturation occurs due to high
aquaculture operation is a high concentration dams, aerators, and rapid photosynthesis whenof biodegradable organic matter (and thus saturated groundwater is warmed naturally to
BOD) in the water. This is especially true at ambient temperatures, or when saturated water
high temperatures. Hence BOD is possibly a is heated in hatcheries (Boyd 1990, 150-52).
more important parameter to dissolved oxygen
than dissolved oxygen itself. Guidelines. Setting guidelines for dissolved
oxygen for source water is difficult because dis-
Effects. Dissolved oxygen concentrations near solved oxygen in aquaculture operations is af-
saturation levels are generally healthiest for fected by many processes independent of thefish. Romaire (1985) believes that growth is im- initial source-water dissolved oxygen. At thepaired if dissolved oxygen concentrations re- screening stage, the initial dissolved oxygenmain below 75 percent saturation for long and BOD can be used to assess the ability of theperiods, and Colt and Orwicz (1991) recom- source water to maintain proper oxygen levels.mend that dissolved oxygen be maintained at a Other factors affecting dissolved oxygen con-
minimum of 95 percent saturation for optimum centration in the aquaculture operation can
growth. The following generalizations were de- only be assessed and mitigated once the opera-
rived for warm water pond fish. For dissolved tion is running.
oxygen concentrations approximately 1-5mg 1-, Listed in table 2.9 are the tolerances for dis-
the dissolved oxygen is still high enough for solved oxygen for different species. Thesesurvival; however, long-term exposure results should be considered as a minimum for source

Phase I: Physic-chemical Water Quality Parameters 13
Table 2.9 Recommended levels of dissolved oxygen for aquaculture
Species DO (mg 1-') Comment Reference
Tilapia > 5.0 Preferred Lloyd 19923.0-4.0 Tolerable
Trout 10.0 Normal at 150C Lloyd 19925.0 Limit for acclimation
Marine fish > 6.0 Minimum Huguenin and Colt 1989
Cold water fish > 6.0 Minimum Lawson 1995
Salmonids > 5.0 Can only survive lower DO for a few hours Lloyd 1992> 5.5 fish Roberts and Shepherd 1974> 7 eggs
Salmon > 8.5 Optimal Black 1991100% saturation
Warm water crustaceans > 5 Can only survive lower DO for a few hours Lloyd 1992
Eel > 5 Preferred Uoyd 19923.0-4.0 Tolerable
Carp >5.0 Preferred Lloyd 19923.0-4.0 Tolerable
Fish in muddy ponds or Resistant to Example: goldfish Lloyd 1992warm, slow rivers low DO
Warm water fish More tolerant to low DO than cold water species Lloyd 1992> 5.0 Recommended Lawson 1995> 1.5 Live for several days> 1.0 Live for several hours< 0.3 Lethal concentration
Channel caffish < 0.5 (fingerlings) Survive short exposure Lawson 19950.5 (adults) Survive short exposure Lawson 1995
2.0-3.0 Adults survive, eggs die Lawson 1995< 5.0 Feed poorly, grow slowly Lawson 1995
< 6.0 (hatchery) Boyd 1990
Red swamp crawfish < 1.0 (uveniles) Survive short exposure Avault eta. 1974< 2.0 Adults crawl out Lawson 1995
Penaeid shrimp species low DO Like freshwater fish Boyd 19900.7-1.4 Lethal concentration Lawson 1995
P. vannamei 6.0-10.0 Optimum Clifford 1994
General guideline > 5.0-6.0 Lawson 1995
water. In addition the dissolved oxygen and aerators. These systems typically employ me-BOD should be used together to assess the abil- chanical mixing in order to increase the surfaceity of the source water to maintain proper oxy- area of the water exposed to the air and thus thegen levels. transfer of oxygen. These can take many forms
including running the water over baffles or em-Treatment. Treatment of source water for low ploying power aerators such as paddlewheel
dissolved oxygen can be accomplished using aerators and spray aerators. 8

14 Source Water Quality for Aquaculture: A Guide for Assessment
Biochemical Oxygen Demand treatment is controversial because potassiumpermanganate is also an algicide; it may further
The biochemical oxygen demand is a measure decrease oxygen levels by killing algae. Theof the amount of organic compounds that can lower oxygen levels are due to reduced photo-be biologically oxidized by naturally occurring synthesis and the decomposition of the deadmicroorganisms in water.9 It is important in algae.aquaculture because the degradation of or- The most effective method for reducing BODganic matter by microorganisms is a major sink is providing oxygen through aeration, thus ac-for dissolved oxygen, a parameter of funda- celerating the degradation of the BOD by mi-mental importance to aquaculture. croorganisms. The methods of aeration are
similar to aeration in dissolved oxygen treat-Effects. As indicated earlier, the major concern ment. For rapid removal, rigorous aeration to
of BOD is the potential for it to deplete oxygen remove BOD can be followed up by a settlingto levels which are dangerous to fish. If a source basin and a sand filter to remove the microor-water contains a large amount of BOD, micro- ganisms and any other particulates (Boyd 1990,bial growth will be enhanced especially at 356, 386). Another method which is less costlyhigh temperatures. With this microbial growth and less efficient is to use retention ponds inand the corresponding degradation of or- which the water is held for one or two days toganic matter, oxygen will be consumed. This allow settling and oxidation of the BOD.can lead to the depletion of oxygen in the pondand its associated effects on fish including Carbon Dioxidedeath.
Carbon dioxide (CO2) is a natural componentGuidelines. Like dissolved oxygen, it is diffi- of surface waters. Diffusion from the atmos-
cult to establish guidelines for BOD concentra- phere, fish respiration, and the biological oxi-tions in source water because the effects of the dation of organic compounds are the majorBOD are dependent upon many processes. sources of carbon dioxide in surface waters.BOD5 indicates the rate of oxygen consumption Extraordinarily high levels of carbon dioxidein water over a 5-hour period. The optimal are of concern in aquaculture. This can occurrange of BOD5 for cyprinid culture is recom- in source water taken from groundwaters. Inmended to be less than 8-15 mg 1-'. 10 For waste- addition, surface water sources can have highwater-fed ponds the recommended range of levels of carbon dioxide when respiration isBOD5 concentrations is 10-20 mg l-l (Ghosh and occurring at high rates. Thus, if a source waterothers 1990, 181). is taken from surfaces waters at night or in the
These guidelines can be used while taking summer when respiration is high, there mayinto consideration factors such as the dis- be reason for concern.solved oxygen, the likely DO requirements ofthe culture, the degree of aeration of the pond, Effects. When carbon dioxide concentrationsseasonal temperature changes, expected pho- are too high, the blood CO2 levels of fish in-tosynthesis, and the oxygen solubility. A judg- crease subsequently impairing the ability ofment can then be based on the appropriate their hemoglobin to carry oxygen, and causingBOD level for the source water. respiratory distress (also known as the Bohr-
Root effect). The severity of the Bohr-Root effectTreatment. Two common options for treat- is dependent upon the oxygen level. It occurs
ment are potassium permanganate and aera- even at high oxygen levels and becomes moretion. Potassium permanganate chemically severe at lower oxygen levels. A species toler-oxidizes organic matter, thus reducing the ance to the Bohr-Root effect can vary. SomeBOD. However results are often mixed and the species are able to survive high carbon dioxide.
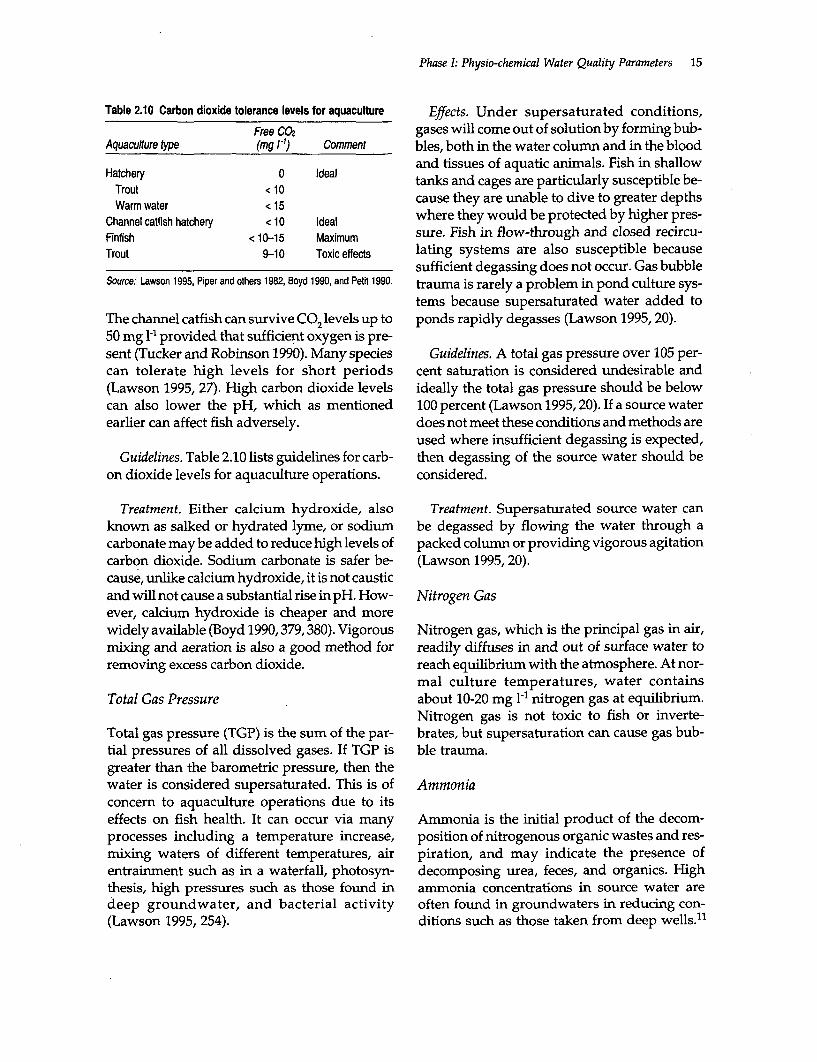
Phase I: Physio-chemical Water Quality Parameters 15
Table 2.10 Carbon dioxide tolerance levels for aquaculture Effects. Under supersaturated conditions,
Free COa gases will come out of solution by forming bub-Aquaculture type (mg /-t) Comment bles, both in the water column and in the blood
and tissues of aquatic animals. Fish in shallowHaTcrhety <10 Ideal tanks and cages are particularly susceptible be-
Warm water < 15 cause they are unable to dive to greater depthsChannel caffish hatchery <10 Ideal where they would be protected by higher pres-Finfish < 10-15 Maximum sure. Fish in flow-through and closed recircu-Trout 9-10 Toxic effects lating systems are also susceptible because
sufficient degassing does not occur. Gas bubbleSource: Lawson 1995, Piper and others 1982, Boyd 1990, and Petit 1990. trauma is rarely a problem in pond culture sys-
tems because supersaturated water added toThe channel catfish can survive CO2 levels up to ponds rapidly degasses (Lawson 1995, 20).50 mg l-l provided that sufficient oxygen is pre-sent (Tucker and Robinson 1990). Many species Guidelines. A total gas pressure over 105 per-can tolerate high levels for short periods cent saturation is considered undesirable and(Lawson 1995, 27). High carbon dioxide levels ideally the total gas pressure should be belowcan also lower the pH, which as mentioned 100 percent (Lawson 1995,20). If a source waterearlier can affect fish adversely. does not meet these conditions and methods are
used where insufficient degassing is expected,Guidelines. Table 2.10 lists guidelines for carb- then degassing of the source water should be
on dioxide levels for aquaculture operations. considered.
Treatment. Either calcium hydroxide, also Treatment. Supersaturated source water canknown as salked or hydrated lyme, or sodium be degassed by flowing the water through acarbonate may be added to reduce high levels of packed column or providing vigorous agitationcarbon dioxide. Sodium carbonate is safer be- (Lawson 1995, 20).cause, unlike calcium hydroxide, it is not causticand will not cause a substantial rise in pH. How- Nitrogen Gasever, calcium hydroxide is cheaper and morewidely available (Boyd 1990,379,380). Vigorous Nitrogen gas, which is the principal gas in air,mixing and aeration is also a good method for readily diffuses in and out of surface water toremoving excess carbon dioxide. reach equilibrium with the atmosphere. At nor-
mal culture temperatures, water containsTotal Gas Pressure about 10-20 mg 1-l nitrogen gas at equilibrium.
Nitrogen gas is not toxic to fish or inverte-Total gas pressure (TGP) is the sum of the par- brates, but supersaturation can cause gas bub-tial pressures of all dissolved gases. If TGP is ble trauma.greater than the barometric pressure, then thewater is considered supersaturated. This is of Ammoniaconcern to aquaculture operations due to itseffects on fish health. It can occur via many Ammonia is the initial product of the decom-processes including a temperature increase, position of nitrogenous organic wastes and res-mixing waters of different temperatures, air piration, and may indicate the presence ofentrainment such as in a waterfall, photosyn- decomposing urea, feces, and organics. Highthesis, high pressures such as those found in ammonia concentrations in source water aredeep groundwater, and bacterial activity often found in groundwaters in reducing con-(Lawson 1995, 254). ditions such as those taken from deep wells. 1
16 Source Water Quality for Aquaculture: A Guide for Assessment
Ammonia can be a larger problem for recircu- rium depending on pH, temperature and sa-lating systems than for ponds because these linity. Analytical procedures normally meas-systems do not often have phytoplankton and ure TAN, so pH, temperature, and salinityrooted plants to assimilate ammonia unless an must be known to calculate the concentrationadequately sized nitrifying filter is included. of unionized ammonia.In pulsed flow systems such as those in irri- The proportion of total ammonia nitrogen ingation ditches, high stocking densities result the form of unionized ammonia increases asin high ammonia concentrations (D'Silva and pH increases, so at a higher pH a smallerMaughan 1995). amount of total ammonia nitrogen causes
toxic effects (Boyd 1990, 156). At lower pHEffects. High concentrations of ammonia TAN is less toxic because more ammonia ex-
cause an increase in the ammonia concentration ists as ammonium. The effect of pH on am-and pH in fish blood. This can cause gill dam- monia toxicity can be pronounced. A changeage, reduce the oxygen-carrying capacity of in pH levels from 7.0 to 8.0 increases the tox-blood, increase the oxygen demand of tissues, icity of a given concentration of ammonia by adamage red blood cells and the tissues that factor of 10 (Lloyd 1992,37). Ammonia toxicityproduce them, and affect osmoregulation can be influenced by other factors such as tem-(Lawson 1995,32-33). perature and salinity. These are summarized
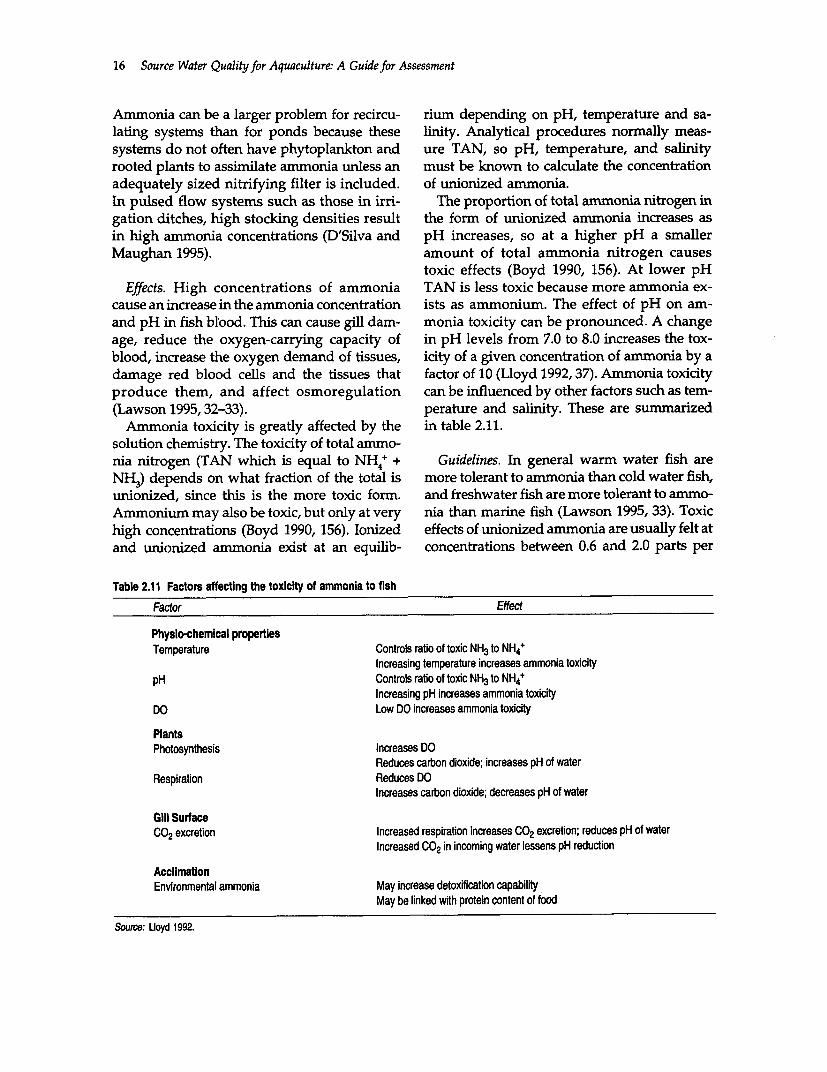
Ammonia toxicity is greatly affected by the in table 2.11.solution chemistry. The toxicity of total ammo-nia nitrogen (TAN which is equal to NH4+ + Guidelines. In general warm water fish areNH3) depends on what fraction of the total is more tolerant to ammonia than cold water fish,unionized, since this is the more toxic form. and freshwater fish are more tolerant to ammo-Ammonium may also be toxic, but only at very nia than marine fish (Lawson 1995, 33). Toxichigh concentrations (Boyd 1990, 156). Ionized effects of unionized ammonia are usually felt atand unionized ammonia exist at an equilib- concentrations between 0.6 and 2.0 parts per
Table 2.11 Factors affecting the toxicity of ammonia to fish
Factor Effect
Physlo-chemical propertiesTemperature Controls ratio of toxic NH3to NH4+
Increasing temperature increases ammonia toxicitypH Controls ratio of toxic NH3to NH4+
Increasing pH increases ammonia toxicityDO Low DO increases ammonia toxicity
PlantsPhotosynthesis Increases DO
Reduces carbon dioxide; increases pH of waterRespiration Reduces DO
Increases carbon dioxide; decreases pH of water
Gill SurfaceC02 excretion Increased respiration increases C02 excretion; reduces pH of water
Increased C02 in incoming water lessens pH reduction
AcclimationEnvironmental ammonia May increase detoxification capability
May be linked with protein content of food
Sou8e: Uoyd 1992.

Phase I: Physio-chemical Water Quality Parameters 17
Table 2.12 Ammonia tolerances for aquaculture
AmmoniaSpecies (mg 1' of NH3) Comment Reference
M. rosenbergii 0.09 Reduced growth rates Boyd 1990Penaeidshrimp 0.45 50% growth reduction Boyd 1990P. monodon < 0.13 Safe concentration Boyd 1990P. vannamei < 0.1 Optimum Clifford 1994
0.1-1.0 mg Il TAN OptimumFreshwater fish <0.05 Safe concentration Lawson 1995
< 1.0 mg 1.1 TANChannel cat. hatchery < 0.05 Optimum Boyd 1990Salmonid hatchery <0.0125 Upper limit Piper et al. 1982Salmonids <0.02 EU 1979Marine fish < 0.01 Safe concentration Huguenin and Colt 1989
General guidelines < 1.0 mg 11 TAN Permissible level Meade 19890.1 Max tolerable level Pillay 1992
< 0.012 Permissible level Boyd 1990<0.02 Permissible level Meade 1989
million (mg 1-l), but some species may be less Because it gets converted to the nitrate end-tolerant. Because there is little consensus re- product quickly, high nitrite concentrations aregarding permissible levels of ammonia, it is not common in aquatic systems. Nitrite is notbest to be conservative. Listed in table 2.12 are a common source water problem. More com-species-specific ammonia tolerances to use in monly, it becomes a problem during operationassessing the suitability of the source water. of recirculating systems where the water is con-
tinually reused (Lawson 1995, 35).Treatment. As mentioned earlier, ammonia is
primarily a problem in recirculating systems Effects. High nitrite concentrations deactivatewhere ammonia is produced at a faster rate than hemoglobin in the blood of fish thus causingit is oxidized. In these cases biological filters are hypoxia. This condition is referred to as brownused (Lawson 1995, 215-47). In brackish water blood disease. A similar effect is found in crus-shrimp farms, zeolites are known to be added taceans (Lawson 1995,34).to control ammonia concentrations. Zeolites Nitrite toxicity is affected by many chemicalhave been shown to be technically effective in factors. Among the most important is the re-freshwater; however recent research has put duction of toxicity by ions such as calcium,into question the efficacy and cost effectiveness chloride, bromide and bicarbonate. As a result,of this method in salt water and brackish water it is rarely a problem in saltwater and brackishsystems (Briggs and Funge-Smith 1996). Other water. For example, nitrite is 55 times moreoptions include using aeration to oxidize the toxic to milkfish (Chanos chanos) in freshwaterammonia to nitrate (nitrification) or to adjust than in water with 16%o salinity (Boyd 1990,the pH and use air stripping to volatilize the 161). It has also been found that the combina-ammonia.'2 tion of high nitrite concentrations and low
chloride levels can result in reduced feedingNitrite activities, poor feed conversions, lower resis-
tance to disease, and mortality (Lawson 1995,Nitrite is formed primarily as an intermediary in 34). Other evidence shows increasing pH, lowthe conversion of ammonia to nitrate, a process dissolved oxygen and high ammonia increasesknown as nitrification (see appendix table 1). the toxicity.13

18 Source Water Quality for Aquaculture: A Guidefor Assessment
Table 2.13 Optimal nitrite concentrations for aquaculture Treatment. Nitrate can be converted to nitro-Species or Concentration gen gas by the process of denitrification. It canwater (mg 1.-) Comment Reference then be removed by volatilization. These treat-
ment systems can be difficult to run and areHard freshwater < 0.1 Pillay 1992Soft water <0.1 Meade 1989 generally expensive.'
Freshwater fish <0.5 Hatcheries Swann 1993 Other Critical FactorsBrackish water
shrimp <45 Boyd 1990
P. monodon <4.5 Postlarval Boyd 1990 IronandManganesegrowout
P. vannamei < 1.0 Optimum Clifford 1994 Iron (Fe) is found in two oxidation states inSalmonid <0.01 Soft water Pillay 1990 natural systems. Ferrous iron (Fe 2+) is the re-
<0.1 Hard water duced form and ferric iron (Fe3 +) is the oxi-dized form. The reduced form of the metalwhich predominates in nonoxygenated (an-
Guidelines. Listed in table 2.13 are recom- oxic) waters is relatively soluble while themended levels of nitrite in aquaculture facili- oxidized form which predominates in oxy-ties. They can be used as a guide to assess the genated waters is very insoluble. The differ-suitability of a given source water for aqua- ence in solubility causes problems whenculture. using source water with high concentrations
of reduced iron. If a source water contains aTreatment. In recirculating systems the bio- lot of reduced iron, the iron will precipitate
logical filters mentioned for ammonia removal once the source water is oxygenated. The pre-are also used for nitrite. If treatment of source cipitate can then have deleterious effectswater before use is desired, aeration can be used upon the operation. Common sources of fer-to promote the nitrification process and conver- ric iron are bottoms of large reservoirs duringsion to nitrate.' 4 summer, and deep ground water (Boyd 1990,
165).Nitrate A very similar situation exists for manganese
(Mn). The oxidized form (Mn4 +) is much lessNitrate is the least toxic of the major inorganic soluble than the reduced form (Mnn+). If highnitrogen compounds. It is formed as the end concentrations of reduced manganese exist inproduct of the nitrification process and concen- a source water, it will oxidize and precipitatetrations are generally higher than both ammo- causing similar problems as iron.nia and nitrite.
Effects. High levels of nitrate can affect os- Table 2.14 Optimal nitrate concentrations for aquaculture
moregulation and oxygen transport, but toxic Concentrationconcentrations are much higher than for ammo- Species (mg 1I) Comment Reference
nia and nitrites (Lawson 1995, 35). High nitrate Carp < 80 Optimum Svobodova etlevels can also result in eutrophication and ex- aL 1993cessive growth of algae and aquatic plants Trout <20 Optimum Svobodova etwhich might have a negative impact on culture aL 1993species. P. vannamei 0.4-0.8 Optimum Clifford 1994
Freshwater < 3 Optimum Piper et aLhatchery 1982
Guidelines. Listed in table 2.14 are recom-mended nitrate levels on a species specific and General < 3 Permissible Meade 1989general basis. guidelines < 100 Pillay 1992
Phase 1: Physio-chemical Water Quality Parameters 19
Effects. If waters which have high concentra- necessary, water can be vigorously agitatedtions of reduced iron or manganese are used with mechanical devices or spilled throughdirectly for filling aquaria or tanks for holding towers, and then passed through a sand filterfish, the precipitates may occlude gills and or settling basin. In small-scale operations, ironcause stress or mortality. This is less of a prob- can be removed with filters and water softenerslem in earthen ponds where the volume of alone, but this method is not practical for large-water is greater and the iron or manganese scale aquaculture facilities (Lawson 1995, 38).precipitates near the inflow and does not harmfish. Channel catfish ponds can even be filled Hydrogen Sulfidewith water containing 20 to 50 mg 1-1 of ferrousion, but such waters are not suitable for direct Hydrogen sulfide (H2S) is produced by bacte-use in hatcheries (Boyd 1990, 165). In general ria under oxygen starved (anoxic) conditions.manganese is in lower concentrations in the It can be found in source water taken fromenvironment than iron and therefore is less of a ground water and oxygen-starved areas of sur-concern than iron. In addition to the problems face water. It is of great concern to aquaculturewith precipitation, iron also encourages the as it is very toxic to fish.growth of iron-metabolizing bacteria whichform an orange slime that can clog pipes, filter, Effects. Even extremely low concentrations ofand other equipment (Lawson 1995, 36). hydrogen sulfide cause hypoxia and are deadly
or extremely harmful to fish. Concentrations asGuidelines. Iron concentrations less than 0.5 little as 0.05 mg 1-1 have caused death after only
mg Pl would be appropriate for hatcheries of a brief exposure and concentrations less thanchannel catfish and other warm water species, 0.01 mg 1-1 have inhibited reproduction. 8
while the optimal iron concentration for coldwater hatcheries is less than 0.15 mg t 1.'6 Iron Guidelines. While hydrogen sulfide producedconcentrations of less than 0.2 mg 1-1 are recom- by heterotrophic bacteria under anaerobic con-mended for cyprinid culture and concentra- ditions inside culture facilities can be treated,tions of less than 0.1 mg P1 are recommended for any sign of hydrogen sulfide in source water ismarine aquaculture systems.17 But Meade cause for alarm. Source water found to contain(1989) conservatively recommends a general even the lowest levels of hydrogen sulfide is ques-standard of less than 0.01 mg 1-1. A general tionable as to its suitability as a source water.standard for manganese concentrations insource water is less than 0.01 mg 1-1. Treatment. Oxidation with potassium per-
manganate or dilution through water exchangeTreatment. Ferrous iron can be removed with are the best methods of hydrogen sulfide re-
potassium permanganate (KMnO4), but the pro- moval. The formation of hydrogen sulfide incedure is seldom practical because potassium ponds can be prevented by vigorous aerationpermanganate is toxic to phytoplankton and and circulation to eliminate anaerobic zonesexpensive. Orthophosphate is adsorbed by the (Lawson 1995, 38). As a method of hydrogenprecipitating ferric hydroxide, so ponds must sulfide removal, some companies in Asia areoften be fertilized after treatment (Boyd 1990, selling photosynthetic bacterial additives358). which claim to convert hydrogen sulfide to sul-
The simplest method for removing reduced fate. There is no evidence that these bacterialiron and manganese is to retain water for one supplements can lower concentrations of hy-or two days in a holding pond, which will al- drogen sulfide in ponds. In fact, the commer-low the reduced forms (ferrous iron) to natu- cially sold bacteria are naturally abundant inrally oxidize to the oxidized forms (ferric iron), aquaculture environments and do not need toprecipitate and settle out. If rapid removal is be added (Boyd 1990, 387).
20 Source Water Quality for Aquaculture: A Guidefor Assessment
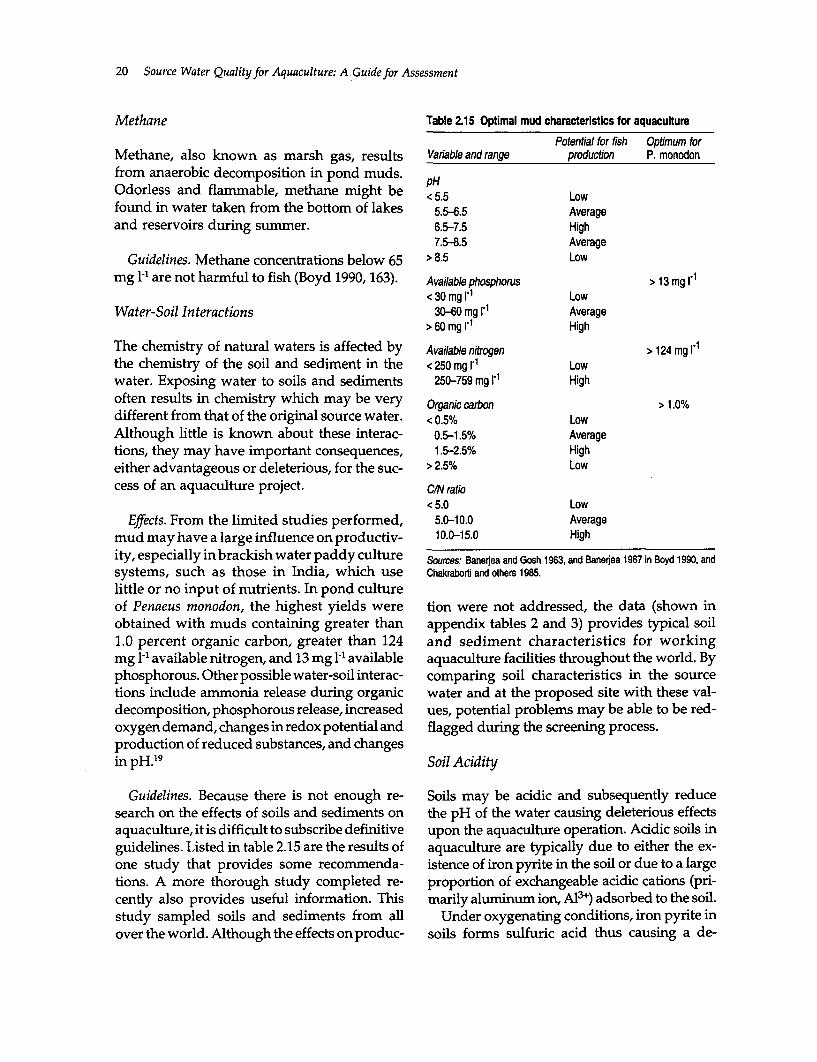
Methane Table 2.15 Optimal mud characteristics for aquaculturePotential for fish Optimum for
Methane, also known as marsh gas, results Variable and range production P. monodonfrom anaerobic decomposition in pond muds. pHOdorless and flammable, methane might be <5.5 Lowfound in water taken from the bottom of lakes 5.5-6.5 Averageand reservoirs during summer. 6.5-7.5 High
7.5-8.5 AverageGuidelines. Methane concentrations below 65 > 8.5 Low
mg 1-l are not harmful to fish (Boyd 1990, 163). Available phosphorus > 13 mg i<30 mg 1-1 Low
Water-Soil Interactions 30-60 mg I Average> 60 mg r High
The chemistry of natural waters is affected by Available nitrogen > 124 mg l-1the chemistry of the soil and sediment in the < 250 mg r Lowwater. Exposing water to soils and sediments 250-759 mg i" Highoften results in chemistry which may be very Organic carbon > 1.0%different from that of the original source water. <0.5% LowAlthough little is known about these interac- 0.5-1.5% Averagetions, they may have important consequences, 1.5-2.5% Higheither advantageous or deleterious, for the suc- > 2.5% Lowcess of an aquaculture project. CIN ratio
< 5.0 LowEffects. From the limited studies performed, 5.0-10.0 Average
mud may have a large influence on productiv- 10.0-15.0 Highity, especially in brackish water paddy culture Sources: Baneriea and Gosh 1963, and Banerjea 1967 in Boyd 1990, andsystems, such as those in India, which use Chakraborli and others 1985.
little or no input of nutrients. In pond cultureof Penaeus monodon, the highest yields were tion were not addressed, the data (shown inobtained with muds containing greater than appendix tables 2 and 3) provides typical soil1.0 percent organic carbon, greater than 124 and sediment characteristics for workingmg 1-' available nitrogen, and 13 mg 1-l available aquaculture facilities throughout the world. Byphosphorous. Other possible water-soil interac- comparing soil characteristics in the sourcetions include ammonia release during organic water and at the proposed site with these val-decomposition, phosphorous release, increased ues, potential problems may be able to be red-oxygen demand, changes in redox potential and flagged during the screening process.production of reduced substances, and changesin pH.'9 Soil Acidity
Guidelines. Because there is not enough re- Soils may be acidic and subsequently reducesearch on the effects of soils and sediments on the pH of the water causing deleterious effectsaquaculture, it is difficult to subscribe definitive upon the aquaculture operation. Acidic soils inguidelines. Listed in table 2.15 are the results of aquaculture are typically due to either the ex-one study that provides some recommenda- istence of iron pyrite in the soil or due to a largetions. A more thorough study completed re- proportion of exchangeable acidic cations (pri-cently also provides useful information. This marily aluminum ion, A13+) adsorbed to the soil.study sampled soils and sediments from all Under oxygenating conditions, iron pyrite inover the world. Although the effects on produc- soils forms sulfuric acid thus causing a de-
Phase I: Physio-chemical Water Quality Parameters 21
crease in pH to typically less than 3.5.20 A soil upon drying for several days.21 For acidity inwhich is in this state is referred to as an acid- general, it has been suggested that for a soil pHsulfate soil. Acid-sulfate soils typically de- of less than 6.5 and a source water with a lowvelop in brackish water swamps that are high total alkalinity (less than 20 mg 1-1), treatmentin iron pyrite and they also result from acid (using liming) will be required. In addition themine drainage (Boyd 1990, 182). In addition, pH guidelines given under water-soil interac-acid-sulfate soils are particularly prevalent in tions and the average soil pH of aquacultureponds constructed on former mangrove operations in Appendixes 2 and 3 can provideswamps. Acidic soils not containing iron py- some guidance.rite lower the pH of the solution as a result ofexchangeable acidic cations which disassociate Treatment. There is no feasible way of treatingwith the soil and react with the water as an the soil to remove iron pyrite. However, meas-acid. ures can be taken to mitigate the effects. These
include: draining soils and waiting until naturalEffects. Acid soils can reduce the pH of the oxidation and leaching removes the acidity, us-
water and causing the deleterious effect of low ing lime to neutralize the acidity, and preven-pH mentioned earlier. Acid-sulfate soil condi- tion of the oxidation of iron pyrite so thattions also tie up nutrients (including fertilizers), sulfuric acid is not produced. It should be notedthus reducing primary production and wasting that the time to remove the acidity in first tech-fertilizer (Joseph 1990, 319). nique is several years and the lime require-
ments for the second technique are so large it isGuidelines. Potential acid-sulfate soils may be often unfeasible. Acid soils other than those
identified as either having a sulfur concentra- caused by the presence of iron pyrite can betion greater than 0.75 percent or a low pH (2-3) treated using lime.2
CHAPTER 3
Phase II: Anthropogenic and BiologicalWater Quality Parameters
M etals, metalloids, organic com- form complexes with particulates such as ox-pounds, pathogens and biological ides, clays and particulate organic matter. Tox-contaminants are the parameters ad- icity is usually related to the dissolved,
dressed in Phase II. Because testing for all of uncomplexed forms of the metals, rather thanthese parameters can be expensive, identifica- to the adsorbed, chelated, or complexed formstion of the parameters of greatest concern will which are more common. In addition to its re-be made. This is done by determining the pol- duction through binding to particulates andlutants expected from past, present and future complexing ligands, the concentration of theagricultural, industrial, and domestic activities toxic dissolved, uncomplexed forms are re-in the area. In addition any historical evidence duced at high pH. Toxicity of metals are alsofor algal or phytoplankton blooms in the area reduced at high salinity due to competition ofcan be reviewed. The parameters of concern ions with the metals.23 Therefore metals are lesscan then be tested for and compared to the likely to be a problem in marine aquacultureguidelines presented here. systems than in freshwater systems. Some met-
als bioaccumulate in fish and shellfish thusMetals causing a potential threat to public health.
The following sections summarize theMajor anthropogenic sources of metals include sources, environmental behavior, backgroundore mining and processing, smelters, plating levels, and toxicities of the metals. In addition,industries, tanneries and textile industries. The guidelines to assess the source water are alsoresulting metal pollution is of concern to presented. It should be noted that although thisaquaculture because of the potential toxic ef- document treats contaminants in isolation,fects and the ability of many metals to bioac- they are likely to occur in concert with othercumulate, thus reducing product quality and contaminants and water quality problems. Acausing public health risks. mixture of metals at concentrations below their
In general the effects of metals are dependent individual toxicity thresholds may produceupon which form predominates of the many toxic effects through their joint action (Fumessdifferent aquatic chemical forms of metals. In and Rainbow 1990,116). The following sectionsolution metals form complexes with ligands reflects the bias in the literature towards thesuch as hydroxide ions and carbonate ions. focus on criteria for contaminant concentra-Stronger complexes are also formed with tions in the water column, but concentrationschelating agents such as organic matter. Metals in sediments may be as important, if not more
22

Phase II: Anthropogenic and Biological Water Quality Parameters 23
so. In some instances sediments may be the Effects on bioaccumulation. While methyl mer-most appropriate measure of contamination, cury accounts for more than 90 percent of theyet few standards exist for sediment contami- mercury found in fish at higher trophic levels,nation. it constitutes less than 1 percent of the total
mercury found in aquatic systems (Malm andMercury others 1990, 12). Methyl mercury is 1,000 times
more soluble in fats than in water and concen-Mercury (Hg) naturally occurs in the environ- trates in muscle tissue, brain tissue, and thement as a result of the volcanic degassing of central nervous system. Hence mercury levelsthe Earth's crust and weathering of mercury- in fish may be in excess of 10,000 to 100,000rich geology. While water from areas rich in times the original concentration in surroundingmercury ores may exhibit high local mercury waters. The contaminant rises through the foodconcentrations, industrial processes, agricul- chain and high concentrations of mercury accu-ture, and the combustion of fossil fuel are the mulate in predators such as trout, pike, walleye,most significant sources of aquatic contamina- bass, tuna, swordfish, and shark. In highly con-tion. Common sources include caustic soda, taminated areas methyl mercury may be accu-pulp and paper, and paint manufacturing. mulated in smaller species which are lower inMercury is also used in batteries, dental amal- the food chain such as those found in aquacul-gam, and in bactericides. ture (Philips 1993, 302). In addition to fish,
aquatic invertebrates also accumulate mercuryEnvironmental behavior. Mercury occurs in to high concentrations.26
both inorganic and organic forms in water. Its Accumulation is fast while depuration ismost predominant forms in freshwater are hy- slow. Slightly contaminated shrimp are slowdroxide complexes and in saltwater as a chlo- to depurate mercury, while contaminated oys-ride complex (Stumm and Morgan 1981, 372). ters depurate rapidly. Unlike oysters, shrimpMercury also exists as the mercuric ion (Hg2+) consume sediment-dwelling organisms whichand under anoxic conditions, as the neutral, may contain a higher proportion of methylreduced form (Hg°). In soils it can precipitate mercury than plankton and detritus in theout as stable mercuric sulphide (Dojlido and water column. Mercury depuration in fish isBest 1993, 92). Methyl mercury is formed by also extremely slow. The half-life of methylbacteria from mercuric ions under both aerobic mercury in fish is estimated at two years (Pal-and anaerobic conditions. It is this form that mer and Presley 1993, 566).bioaccumulates in fish and shellfish. Levels of methyl mercury in fish have also
been correlated with the age and size of theBackground levels. Mercury levels in water are fish, the species, pH of the water, and mercury
much lower than levels in sediments. Natural content of water and sediments (WHO 1989b,background concentrations average 0.1 mg 1-l 33). However the processes affecting mercurydry weight in soils, and 0.19 mg 1-l dry weight behavior in the environment are too complexin sediments.2 4 Background levels for unpol- for prediction with the current state of knowl-luted waters fall in the range of 0.001 to 0.003 edge.parts per billion (ppb) for lakes and rivers, 0.002to 0.015 ppb for coastal waters, and 0.0005 to Effects on human health. The general popula-0.003 ppb for the open ocean. tion does not face a significant health risk from
mercury. Exposure is primarily through diet. InEffects on fish health. The lethal levels of mer- most foodstuffs mercury is largely in the inor-
cury for fish range from 1 mg l-' for tilapia to 30 ganic form and at very low levels. Fish and fishmg l-l for guppies and 2 mg l-1 for a crustacean products are the dominant dietary sources;(Cyclops abyssorum).25 hence mercury is of greater concern in areas

24 Source Water Quality for Aquaculture: A Guide for Assessment
where fish and shellfish account for a major Cadmiumproportion of the diet (Philips 1993, 303). Veryhigh levels (more than 1 mg 1- wet weight) have Cadmium (Cd) is a highly toxic metal whichbeen found in the flesh of fish from contami- plays a role in a variety of industrial processesnated waters, resulting in bans on fishing, fish such as electroplating, nickel plating, smelting,sale, and fish consumption in polluted areas. engraving, and battery manufacturing. It is
Groups of people with high fish consump- also a constituent of easily fusible alloys, softtion rates may accumulate blood-methyl mer- solder, electrodes for vapor lamps, photoelec-cury levels associated with a low risk of tric cells, nickel-cadmium storage batteries,neurological damage in adults. The health ef- pigments and plastics. Inorganic fertilizersfects of mercury poisoning are essentially irre- such as phosphate fertilizers, sewage sludgeversible. Symptoms include numbness and used on agricultural land, and tailings fromtingling, loss of vision and hearing, delirium, zinc mines are also important sources of cad-and disturbance of gait and speech (Philips mium contamination. Cadmium is usually1993, 298). Of particular concern is that methyl found along with zinc in surface waters, but atmercury is almost completely absorbed from much lower concentrations (Svobodova andthe intestine and stable in the body, and circu- others 1993, 26). Municipal sewage effluentslates unchanged in the blood. It remains in the and sludge are another important source ofbody for extended periods of time (biological cadmium in aquatic environments.half-life is estimated at 70-76 days in humanand 200 days to two years in fish), penetrates Environmental behavior. The predominanteasily through the blood-brain barrier and ac- form of cadmium in the environment is as thecumulates in the brain. Pregnant and nursing cadmium ion (Cd2+). It also can complex withwomen are at a greater risk of adverse effects organic matter and particulates to a significantthan the general population (WHO 1989b, 33). extent (Dojlido and Best 1993, 84-85). In anoxicMethyl mercury easily penetrates the placenta sediments, cadmium precipitates as cadmiumand accumulates in the fetus (Philips 1993, sulfide. Unlike mercury, cadmium does not303), causing critical prenatal exposure which form organometallic species.may lead to brain damage (Fitzgerald andClarkson 1991). Because it is highly fat soluble, Background levels. In general natural watersmethyl mercury also accumulates in mother's contain very low levels of cadmium unless theymilk. are polluted. For unpolluted waters of any type,
cadmium concentrations generally range fromGuidelines. Because the concentrations which 0.0 to 0.13 ppb.27 Saline water levels are less than
may present a public health risk are signifi- 0.2 ppb in estuaries (less than 2.0 in estuarinecantly lower than those that affect the health of sediments) and less than 0.15 ppb in coastalthe culture species, the guidelines are based on areas (less than 1.5 in sediments)- 8
the public health risks. Because the chemicaland biological interactions of mercury are so Effect onfish and shellfish health. The cadmiumcomplex, it is not possible to calculate a single ion and some organic and inorganic complexesmercury criteria for source water that will pro- are toxic to fish. Acute toxic exposure of fishduce aquaculture products with a mercury damages the central nervous system andconcentration less than those which present a parenchymatous organs. Chronic exposure ad-risk to public health. Therefore a Phase III pilot versely affects the reproductive organs ofstudy is advisable if total mercury concentra- aquatic organisms, as well as maturation,tions in fresh or estuarine water are greater hatchability, and development of larvaethan 0.01 ppb or greater than 0.02 ppb in salt (Svobodova and others 1993,26). Continuationwater. of exposure causes mortalities at concentrations
Phase II: Anthropogenic and Biological Water Quality Parameters 25
considerably lower than the lethal count level Effects on human health. Cadmium is excep-(96-hour LCJ), probably because the efficiency tionally persistent in humans, and even lowof the cadmium detoxification mechanism in levels of exposure may result in considerablefish has a limited duration (Lloyd 1992, 84). accumulation over time especially in the kid-
However, most of the cadmium which binds neys (WHO 1989b, 29). The major symptoms ofwith solid particles ends up in sediments cadmium poisoning, also known as itai-itai syn-where its biological availability is limited and drome, are softening of the skeletal bones,thus less toxic. Calcium also reduces the toxic- pseudo-fractures of the bones, possible skeletality of dissolved cadmium, so it is somewhat deformation, and kidney damage (Phillipsless toxic in hard water (Lloyd 1992, 84). Be- 1993, 299). Subclinical effects include liver andcause carbon and cadmium compete for bind- renal tubular dysfunction (Phillips 1993, 300,ing sites, higher concentrations of carbon 304).dioxide may reduce the bioavailability and Exposure is likely to vary among individualshence the toxicity of cadmium.29 depending on food preferences. Bivalve mol-
lusks (oysters and clams), some crustaceans,Effects on bioaccumulation. Some species have kidneys and livers of terrestrial animals, and
greater capacity for accumulation of cadmium tobacco are common pathways of cadmium ex-than other species. Unlike mercury, accumula- posure for humans (Phillips 1993, 304). Whiletion rates for cadmium vary greatly among cadmium poisoning has not been known to oc-groups (Phillips 1993, 304). The bioconcentra- cur as a result of consumption of fisheriestion factors (concentration in organism/con- products, significant concern exists over thiscentration in water) for many species are on possibility.the order of thousands. For some mollusksand arthropods, they are on the order of tens Guidelines. Listed in table 3.1 are guidelinesof thousands, and on the order of hundreds of for cadmium in source water. Meade's (1989)thousands for certain tissues (few of which cadmium criteria of 0.5 ppb for soft water andare usually eaten by man). 30 Depuration is 5 ppb for hard waters are good for mostslow and incomplete, so animals contami- aquaculture with the exception of mollusks.nated in culture facilities are not commercially Linear uptake of cadmium was recorded forsalvageable. mollusks growing in 5 ppb of hard saline water
Significant levels of cadmium may be accu- (UNEP 1985,11). Therefore a more conservativemulated by bivalve mollusks and certain spe- upper limit of 0.5 ppb, regardless of the hard-cies of crustaceans (Phillips 1993, 304). In ness, is recommended for mollusks.polluted waters, oysters (Crassostrea gigas andC. commercialis), clams, cockles, and some spe- Leadcies of crab (particularly in the brown meat)can accumulate significant amounts of cad- The major sources of lead (Pb) to aquatic sys-mium.ix The Pacific oyster (Crassostrea gigas) tems include atmospheric deposition of ex-has exhibited consistently high concentrations haust from vehicles, disposal of batteries, leadof cadmium, especially in China. Cadmnium ore mine wastes, lead smelters, sewage dis-concentrations in shrimp and prawns are un- charge, highway runoff, and agricultural run-likely to be high. Although, studies of Penaeus off from fields fertilized with sewage sludge.japonicus have revealed high concentrations inareas where fin fish concentrations were com- Environmental behavior and background levels.paratively low. In marine vertebrates, cad- At pH 6 the lead ion (Pb2+) and hydroxide spe-mium tends to accumulate in the kidneys, cies dominate. At higher pH, lead hydroxideleaving the concentration low in the axial mus- and carbonate species begin to dominate. Leadcle tissue.32 also commonly forms sulfate and carbonate

26 Source Water Quality for Aquaculture: A Guide for Assessment
Table 3.1 Maximum cadmium concentrations for aquaculture
ConcentrationSpecies (ppb) Comment Reference
Salmonids <0.2 Svobodova etaaL 1993Salmonid hatcheries < 0.4 Alkalinity < 100 mg 1-1 Piper et aL 1982
< 3.0 Alkalinity > 100 mg I"Cyprinids < 1.0 SvobodovA et aL 1993Crustaceans < 2.0 UNEP 1985Freshwater < 1.1 USEPA 1986Saltwater < 9.3 USEPA 1986General guidelines < 0.5 Alkalinity < 100 mg I" Meade 1989
< 5.0 Alkalinity > 100 mg I1
Human drinking water < 10.0 Maryland 1993
precipitates. It also forms complexes with or- to be a public health threat (Phillips 1993, 305).ganic matter and particulates. Dissolved lead However mollusks are known to accumulateconcentrations in the environment are generally high concentrations of lead in polluted areaslow due to either precipitation of carbonate spe- (Pastor and others 1994,53). The half-life of leadcies or adsorption to particulate matter (Dojlido in marine organisms is shorter than the half-and Best 1995, 109-10). There is some evidence lives of other heavy metals. Lead in black-lipthat lead forms organometalic compounds in oysters has a half-life of 26 to 34 days. In 40 daysnatural systems which can accumulated in fish mussels lose 33 percent of their accumulated. It(Schmidt and Huber 1976). The backgrounds is believed that the rate of lead depuration islevels of dissolved lead in surface waters rarely dependent upon the initial exposure conditionsexceeds 20 ppb (Dojlido and Best 1993, 110). and detoxification mechanism (UNEP 1985,35).
Effects onfish and shellfish health. Chronic lead Effects on human health. As mentioned earlier,toxicity in aquatic organisms leads to nervous fish and shellfish are not a major pathway forsystem damage while acute toxicity causes gill lead exposure to human populations. The ef-damage and suffocation (Svobodova and others fects which primarily arise from exposure to1993, 27). Chronic lead toxicity is easily identi- exhaust fumes includes impaired neurologicfied in fish by the blackening of the fins (Dojlido and motor development and damage to kid-and Best 1993, 112). The toxicity of lead is de- neys (Dojlido and Best 1993, 112-13). Severependent on the alkalinity, hardness and pH of lead poisoning can also occur in cases wherethe water. Toxicity is decreased by high alkalin- lead-based paints are ingested.ity (that is, high calcium carbonate) becausecalcium carbonate competes for uptake at the Guidelines. The lead criteria in table 3.2 repre-gill surface (Lloyd 1992, 39). The solubility of sent the range of opinions regarding maximumlead and thus its toxicity is lower in hard waters concentrations of lead in source water. The per-than in soft waters (Dojlido and Best 1993,112). missible level of lead in drinking water is alsoFor the same reason, lead toxicity is higher at included for comparison. However, saltwaterlower pH levels which would be common par- mussels (Mytilus edulis) have been shown toticularly at ponds bottoms and among benthos accumulate significant concentrations of lead inand nutrients (Svobodova and others 1993, 27). water with a concentration of 10 ppb; so it is
questionable whether any of the criteria aboveEffects on bioaccumulation. Background levels are conservative enough for mollusks (UNEP
are low in most marine products and unlikely 1985, 35). The safest strategy is to conduct a
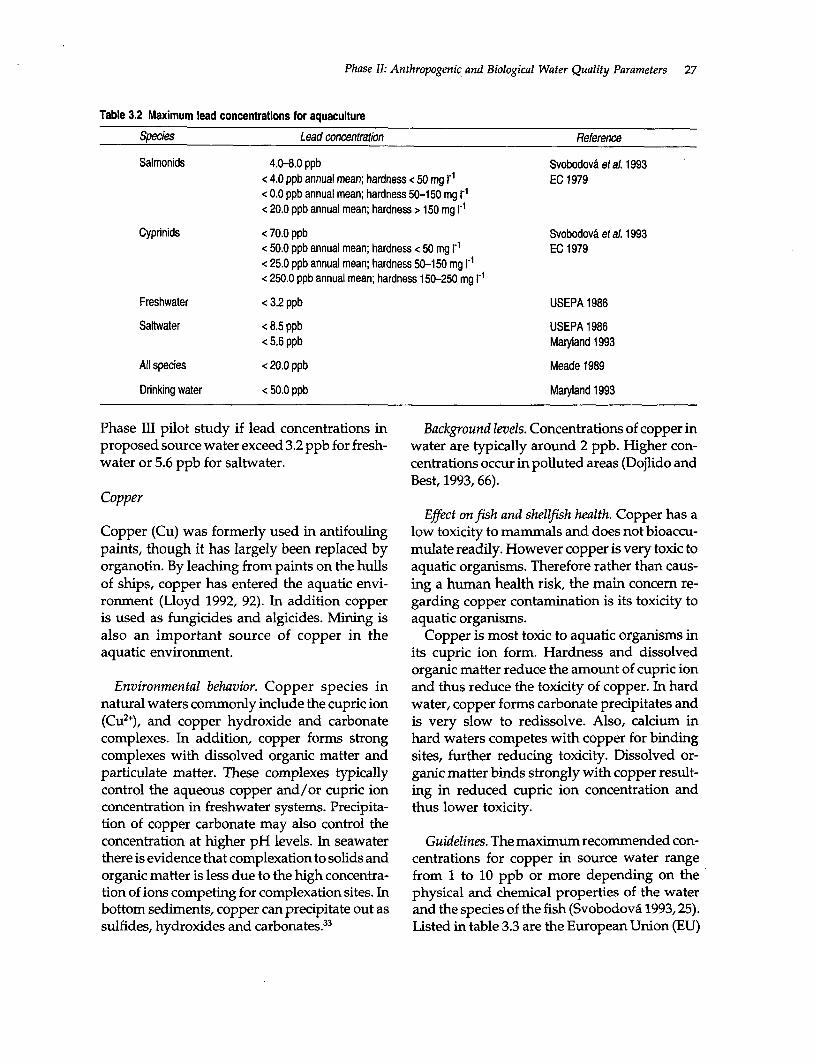
Phase II: Anthropogenic and Biological Water Quality Parameters 27
Table 3.2 Maximum lead concentrations for aquaculture
Species Lead concentration Reference
Salmonids 4.0-8.0 ppb Svobodova et aL. 1993< 4.0 ppb annual mean; hardness < 50 mg 1I EC 1979< 0.0 ppb annual mean; hardness 50-150 mg< 20.0 ppb annual mean; hardness > 150 mg l-1
Cyprinids < 70.0 ppb Svobodova et aL 1993< 50.0 ppb annual mean; hardness < 50 mg 11 EC 1979< 25.0 ppb annual mean; hardness 50-150 mg 1< 250.0 ppb annual mean; hardness 150-250 mg I'
Freshwater < 3.2 ppb USEPA 1986
Saltwater < 8.5 ppb USEPA 1986< 5.6 ppb Maryland 1993
All species < 20.0 ppb Meade 1989
Drinking water < 50.0 ppb Maryland 1993
Phase III pilot study if lead concentrations in Background levels. Concentrations of copper inproposed source water exceed 3.2 ppb for fresh- water are typically around 2 ppb. Higher con-water or 5.6 ppb for saltwater. centrations occur in polluted areas (Dojlido and
Best, 1993, 66).Copper
Effect on fish and shellfish health. Copper has aCopper (Cu) was formerly used in antifouling low toxicity to mammals and does not bioaccu-paints, though it has largely been replaced by mulate readily. However copper is very toxic toorganotin. By leaching from paints on the hulls aquatic organisms. Therefore rather than caus-of ships, copper has entered the aquatic envi- ing a human health risk, the main concern re-ronment (Lloyd 1992, 92). In addition copper garding copper contamination is its toxicity tois used as fungicides and algicides. Mining is aquatic organisms.also an important source of copper in the Copper is most toxic to aquatic organisms inaquatic environment. its cupric ion form. Hardness and dissolved
organic matter reduce the amount of cupric ionEnvironmental behavior. Copper species in and thus reduce the toxicity of copper. In hard
natural waters commonly include the cupric ion water, copper forms carbonate precipitates and(Cu2 +), and copper hydroxide and carbonate is very slow to redissolve. Also, calcium incomplexes. In addition, copper forms strong hard waters competes with copper for bindingcomplexes with dissolved organic matter and sites, further reducing toxicity. Dissolved or-particulate matter. These complexes typically ganic matter binds strongly with copper result-control the aqueous copper and/or cupric ion ing in reduced cupric ion concentration andconcentration in freshwater systems. Precipita- thus lower toxicity.tion of copper carbonate may also control theconcentration at higher pH levels. In seawater Guidelines. The maximum recommended con-there is evidence that complexation to solids and centrations for copper in source water rangeorganic matter is less due to the high concentra- from 1 to 10 ppb or more depending on thetion of ions competing for complexation sites. In physical and chemical properties of the waterbottom sediments, copper can precipitate out as and the species of the fish (Svobodova 1993,25).sulfides, hydroxides and carbonates.3 3 Listed in table 3.3 are the European Union (EU)

28 Source Water Quality for Aquaculture: A Guide for Assessment
Table 3.3 Maximum copper concentrations for production speciation which in turn is pH dependent.of salmonil fish Maximum toxicity occurs at pH 5.6
Species Copper concentration
Salmonids < 1 ppb; hardness 0-50 mg I" Effects on bioaccumulation and public health.<6 ppb; hardness 50-100 mg Fish will die from aluminum poisoning long< 10 ppb; hardness 100-250 mg 11 before they would be able to accumulate con-< 28 ppb; hardness > 250 mg l centrations which would be harmful to hu-
mans. Therefore bioaccumulation is not a majorSource: EU 1979. concem. If exposed, there is very little cause for
concern. Aluminum which does accumulate inguidelines specifically for salmonids. The fol- the body is stored in the heart, spleen and bone,lowing are general copper concentration guide- and has not proven to be a serious health risk.lines collected from different literature sources: It should be noted though that there is a possibleless than 2.9 ppb for saltwater; less than 6 ppb but unproven association between aluminumfor soft freshwater (alkalinity less than 100mg 1-); intake and disorders such as Alzheimer's dis-less than 12 ppb for hard fresh water alkalinity ease (WHO 1989b, 27).greater than 100 mg l-1.34
Guidelines. A guideline for aluminum inAluminum source water is less than 10 ppb (Meade 1989).
Aluminum (Al) is among the most abundant Chromiumnaturally occurring metals. Its most commonforms in the environment are as alumino-sili- Chromium (Cr) is principally used in platingcates or aluminum oxides. Anthropogenic and chrome alloy production. Chromium isemissions to water include its use as a coagu- also used in pigments, paints, ceramics, textilelant in water treatment. It is also commonly dyes, fungicides, fireproof bricks and catalysts.used in chemical industries (Dojlido and Best Chromate compounds are also used for corro-1993, 100). sion control in heating and cooling systems
(Dojlido and Best 1993, 175).Environmental behavior and background levels.
Aluminum is more soluble at pH below 6 than Environmental behavior and background levels.at higher pH where it precipitates as aluminum Under reduced conditions chromium is in thehydroxide (Svobodova and others 1993, 23). ion form, Cr3 +. Under oxidizing conditions suchGenerally at pH levels common to natural wa- as those commonly found in an aquacultureters (pH 5 to 9), aluminum concentrations are operation, it is in the hexavalent (Cr+) form. Alow due to the low solubility of aluminum hy- large proportion of chromium in natural watersdroxide. Normal concentrations of dissolved is found associated with suspended solids andaluminum in natural waters with near neutral sediment. In natural waters chromium typicallypH and low concentration of complexing agents has concentrations less than 5 ppb and theyrange from 0.0003 ppb to 0.3 ppb.35 Acidified rarely get above 20 ppb (Dojlido and Best 1993,waters would have higher dissolved aluminum 175-76). Chromium can also bioaccumulate inconcentrations. Complexing agents such as hu- aquatic organisms.mic acids would increase the solubility of alu-minum, thus increasing the dissolved Effects onfish and shellfish health. Chromium isaluminum concentration. highly toxic to aquatic organisms, especially in
the hexavalent form.37The toxicity of chromiumEffects on fish and shellfish health. The toxicity is greater in soft, acidic water (Svobodova and
of aluminum to fish is dependent upon the others 1993,24). Therefore chromium poisoning

Phase I1: Anthropogenic and Biological Water Quality Parameters 29
is less of a problem in marine waters, and back- waters (Dojlido and Best 1993, 201). Typicalground levels are low in most marine organisms concentrations of nickel in surface water ranges(Phillips 1993, 305). The 96-hr LC50 for salmonid from 1-3 ppb with higher concentrations (10-50fish ranges from 3.3 to 65 mg 1.38 For longer ppb) in industrialized areas.40
exposures it was found that a concentration of13 ppb adversely affected the growth of rain- Effects onfish and shellfish health. Nickel is onlybow trout.39 moderately toxic to fish. For salmonid culture,
Chromium is not very toxic to humans. nickel has a 96-hr LC50 value of 8 mg l-l in softThere is little evidence that significant expo- waters and 50 mg 1-' in hard waters.4 'sure can occur via the ingestion of seafoodproducts. There have been some incidences Effects on bioaccumulation. Fish have little ca-where large exposures via inhalation of salts pacity for bioaccumulation of nickel. Inverte-caused lung cancer (Forstner and Wittman brates have been shown to accumulate nickel1981, 25). Table 3.4 lists water quality criteria (EIFAC 1984, 6-9).for chromium in aquaculture.
Effects on human health. At high doses nickelNickel can be carcinogenic and teratogenic to humans
(Dojlido and Best 1993, 202).Nickel (Ni) is introduced to surface watersthrough effluents from metal plating and ore Guidelines. Recommended water quality cri-processing facilities. It is also emitted by the teria are: less than 10 ppb (95 percentile less thancombustion of petroleum products and is used 30 ppb) for soft water (20 mg 1-1 CaCO) and lessto make batteries. than 40 ppb (95 percenfile less than 120 ppb) for
hard water (320 mg I-f CaCO).42
Environmental behavior and background levels.The dominant form of nickel in aquatic systems Silveris Ni2+. It forms moderately strong complexeswith humic acids and can adsorb to particu- The main industrial sources of silver (Ag) arelates. However, in general, nickel is found pre- ore processing, photography, dentistry, anddominantly in the dissolved form in natural electronics. In industrialized areas anomal-
ously high concentrations of silver can befound in surface waters wherever human be-
for aquaculture ings are found. In fact silver is often a good
Species Chromium concentration tracer for sewage.
Salmonid < 5 ppb annual mean; Hardness 0-50 mg Ir Environmental behavior and background concen-< 10 ppb annual mean; Hardness 50-100 mg I1 trations. Common aqueous forms of silver un-< 20 ppb annual mean; Hardness 100-200 mg I1 der aerobic conditions are the silver ion (Ag+)< 50 ppb annual mean; Hardness > 200 mg Ir1 in freshwater and silver chloride complexes in
Cyprinid < 150 ppb annual mean; Hardness 0-50 mg I1 seawater (Stumm and Morgan 1981, 372). It< 175 ppb annual mean; Hardness 50-100 mg l11 also readily forms precipitates such as silver< 200 ppb annual mean; Hardness 100-200 mg 1-1 sulfide, silver oxide, silver chloride and silver< 250 ppb annual mean; Hardness > 200 mg i"1 nitrate (Dojlido and Best 1993, 70). Mollusks,
such as oysters, accumulate silver quickly, butGeneral <210"ppb chromium (III) take a long time to depurate. Typical concentra-
guidelines < 11 ppb chromium (VI) in freshwater tions of silver in surface waters in the Urited< 50 ppb chromium (VI) in saltwater States range from 0 to 1 ppb (Durum and Haffty
Sources: EU 1979 and USEPA 1993. 1961).
30 Source Water Quality for Aquaculture: A Guide for Assessment
Effects on fish and shellfish health. Silver is in freshwater areas where there is considerablehighly toxic to aquatic life. Its toxicity is de- boating activity, especially in marinas (Lloydpendent upon which salt is present. Silver ni- 1992, 92).trate is most toxic followed by silver chlorideand iodide, sulfide, and thiosulfate. Concentra- Effects onfish and shellfish health. Tin, which istions as low as 0.5 ppb have caused mortalities of low toxicity to mammals, is toxic to aquaticand interfered with the hatching of rainbow organisms (Phillips 1993,306). A toxic level hastrout.43 been reported at 2 mg l-l for fish (Liebman 1958).
Organotin compounds are considerably moreEffects on human health. Silver can be absorbed toxic than tin and are of considerable concern as
by skin tissue. When this occurs in large a result.amounts, discoloration of both skin and eyetissue, a condition known as argyria, can result Effects on bioaccumulation. Organotin com-(Forstner and Wittman 1981,16). pounds readily bioaccumulate in aquatic or-
ganisms (Dojlido and Best 1993,107).Guidelines. Areas with high silver concentra-
tions should be avoided for culture of mollusks. Effects on human health. Gastric irritation is theGuidelines for silver concentrations in source main human health problem associated withwater are: less thanO.12ppb for freshwater and less consumption of foods containing elevated lev-than 2.3 ppb for saltwater (Maryland 1993,11). els of tin (WHO 1989b, 34). Most of the tin
ingested by humans is derived from packagingTin in tin cans. Fisheries products are considered a
negligible source of tin in the human diet. How-Industrial sources of tin (Sn) include process- ever standards for tin in fish and shellfish doing ore and manufacturing paint and rubber exist and can be considered directly if a Phaseproducts. Sources of organotin include most III study is pursued.predominantly the use of tributyl tin (TBT) asan antifouling paint for boats. It can also come Guidelines. A water quality standard for fishfrom plastics industries where it is used as a for tin is 2 mg l-'.45 For organotins, sedimentscatalyst, fungicide, and disinfectant (Dojlido with TBT concentrations of 1 ppb are toxic toand Best 1993, 107). There are also tin-based clams (Furness and Rainbow 1990, 118). Pro-molluscicides that are often excessively used to posed environmental quality standards for fishcontrol snail populations (Acosta and Pullin for organotins are 0.02 ppb for tributyl tin and1991). triphenyl tin in freshwater fish."6 Other stand-
ards state TBT concentrations in source waterEnvironmental behavior and background levels. should be less than 0.026 ppb for freshwater and
In natural waters under aerobic conditions, tin less than 0.010 ppb for saltwater (Marylandis most commonly complexed with hydrox- 1993, 11).ides.' In natural waters, TBT remains in aslowly degrading toxic form which accumu- Zinclates in sediments (Lloyd 1992,92). Typical con-centrations of tin in natural waters are very low, Zinc (Zn) enters surface waters primarily as aranging from approximately 0 to 2 ppb (Durum result of discharges from metal treatmentand Haffty 1961). Because organotins do not plants, chemical plants, and foundries (Dojlidooccur in nature, levels of organotin should be and Best 1993, 79). Mining can also be a source.negligible unless contamination exists. MostTBT contamination occurs in the marine envi- Environmental behavior and background levels.ronment, but high concentrations can also occur In low alkalinity waters, zinc exists as the zinc

Phase 11: Anthropogenic and Biological Water Quality Parameters 31
ion (Zn2+) and hydroxide complexes. In high Table 3.5 Maximum zinc concentrations for aquaculturealkalinity waters, it forms complexes with car- recommended by the European Unionbonate and sulfate. Zinc can precipitate at high Annual 95thpH as zinc hydroxide and coprecipitate with S Hardness average percentilecalcium carbonate (Dojlido and Best 1993, 80).It also readily forms complexes with organic Salmonid fisheries 10 8 30matter or particulate matter. Ten to seventy- 50 50 200eight percent of zinc in the world's rivers is 100 75 300adsorbed to suspended solids and very little is 500 125 500in the form of precipitates. 47 The concentration Coarse fisheries 10 75 300of zinc in surface waters is generally low. Its 50 176 700range in uncontaminated waters is 5 to 15 ppb 100 250 1,000(Moore and Ramamoorthy 1984). 500 500 2,000
Source: EU 1979.Effects onfish and shellfish. There is very little
evidence to indicate any significant human concentrations high enough to cause humanhealth effect of zinc. It is however toxic to health problems.aquatic organisms. Zinc concentrations lessthan 100 ppb had little effect on oyster larvae Environmental behavior and background levels.(Ostrea edulis), but concentrations of 300 ppb Arsenic chemistry in water is complex. Arsenicconsiderably reduced larval growth, and at can exist in four different oxidation states de-concentrations of 500 ppb larvae either died pending on whether the conditions are oxidiz-or failed to metamorphose (Milne 1972, 165). ing or reducing. Arsenic binds strongly toHardness (or high calcium concentration) re- particulate matter, can coprecipitate with ironduces the toxicity of zinc (Lloyd 1992, 79). The oxides, and under reducing conditions can pre-LC50 (48-96 hours) varies between 0.5 and 5 cipitate as arsenic sulfide or elemental arsenic.mg l-1 for fish (Moore and Ramamoorthy 1984, Arsenic also forms methylated species through82). the action of microorganisms. In natural waters
a significant portion of the total arsenic is asso-Guidelines. Listed in table 3.5 are the EU ciated with particulates. For example, 33 per-
guidelines for specific fisheries. General guide- cent of the arsenic in Puget Sound and 67lines are: less than 50 ppb for warm water hatch- percent in Rhine River is associated with par-eries; less than 110 ppb for freshwater; and less ticulates.49 Arsenic tends to accumulate in bot-than 86 ppb for saltwater.' tom sediments. Unpolluted river waters
usually do not contain concentrations greaterMetalloids than 1 ppb.50 The coastal waters in the United
Kingdom have concentrations of arsenic lessArsenic than 5 ppb (Musselwhite 1982).
The main sources of contamination of arsenic Effects on fish and shellfish health. There is only(As) in the environment are smelting, power limited information on the toxicity of arsenic togeneration, the burning of crude oil and coal, aquatic species. Based on existing information,and washing of products such as detergents arsenic is relatively non-toxic to aquatic organ-(Dojlido and Best 1993, 144).- Arsenic is com- isms. A short-term exposure of approximatelymonly used in insecticides, herbicides and 1,000 ppb is necessary for mortalities to occur.wood preservatives. There are also some natu- However arsenic may affect phytoplanktonral groundwater sources of arsenic from arse- growth at levels as low as five times the back-nic ores and volcanic activity which can reach ground concentration. 5 '
32 Source Water Quality for Aquaculture: A Guide for Assessment
Effects on bioaccumulation. The organic forms cement production (Dojlido and Best 1993,of arsenic are bioaccumulated in fish and shell- 172).fish. However, the bioaccumulation is muchless significant than that of methyl mercury. Environmental behavior and background levels.The primary forms of arsenic in fish and shell- Like arsenic, selenium exists in the environmentfish are methylated arsenicals and arseno-sug- in many different oxidation states. Its mostars in primary producers and arsenobetanine in common forms in the environment are as se-higher organisms. Relatively high concentra- lenites and selenates which have similar chemi-tions of organic arsenical compounds are pre- cal behavior as sulfites and sulfates. Thesent in some seafoods. However the World breakdown of organic matter containing sele-Health Organization (WHO) has announced nium results in the formation of organose-that there is little evidence to suggest that peo- lenium compounds. Typical backgroundple who consume large amounts of seafood concentrations of selenium are around 0.1suffer adverse effects related to its organic arse- ppb.53nic content. Levels of inorganic arsenic inaquatic organisms are low, frequently below Effects onfish and shellfish health. Selenium pre-0.5-1.0 mg l-l wet weight.52 sents few problems for marine organisms, and
it may even help in detoxifying accumulatedEffects on human health. The human health mercury.54
effects of arsenic are primarily neurological andnephrological and may linger. The toxicity of Effects on bioaccumulation and human health.arsenic is related to its chemical form. Inorganic Organic forms of selenium can bioaccumulateforms are toxic to mammals and many organic and are harmful to humans. Selenium is also aforms are of insignificant toxicity (Phillips 1993, necessary nutrient to humans and the differ-300). Human populations consuming large ence between the amount that results in a nutri-quantities of marine fish contamninated with or- ent deficiency and the amount that results inganoarsenic compounds (weekly intakes of 0.05 toxicity is very small (Dojlido and Best 1993,mg/kg of body weight) did not experience ad- 173).verse effects (WHO 1989b, 28). In laboratorytests, rats which consumed enough contami- Guidelines. Concentrations of selenium innated fish to produce a daily organoarsenic in- source waters should not exceed 5 ppb in fresh-take of 3 mg/kg of body weight showed no water and 71 ppb in saltwater (USEPA 1993).toxic effects. WHO does not recommend achange in dietary habits due to organoarseni- Chlorinecals in marine fish; however the organizationindicates further investigations of the type and Chlorine (Cl) is discharged into surface waterslevels of organoarsenicals present in marine from municipal and agricultural water treat-fish are suggested. ment operations and from textile and paper
plants. Chemical industries which use chlorineGuidelines. Concentrations of arsenic (III) in gas can also be a significant source. If a source
source water should not exceed 190 ppb in water is taken from a municipal water supplyfreshwater and 36 ppb in saltwater (USEPA which chlorinates, high chlorine concentra-1993). tions should be expected.
Selenium Environmental behavior and background levels.Upon entering water, chlorine gas dissociates to
The principle sources of selenium (Se) in the form hypochlorous and hydrochloric acids. Hy-environment are the burning of fossil fuels and pochlorous acid (HOCl) partially dissociates

Phase II: Anthropogenic and Biological Water Quality Parameters 33
creating water with some hypochlorite (OCI-) Environmental behavior and background levels.which is the less toxic species and some HOCI, Cyanide in water is typically in the form ofthe more toxic species. The proportion of each hydrogen cyanide, HCN, or the ion form CN-.species is dependent upon the pH. As pH in- The ion form can take on a variety of complexescreases, the proportion of hypochlorite in- with metals. These complexes are of varied sta-creases until about pH 9 where it dominates. bility with the most stable complexes formingChlorine commonly reacts to form chloramines with iron and cobalt. Because HCN is the mostin solution. In general the high reactivity of toxic form, it is these complexes which regulatechlorine makes it relatively short lived in the toxicity of cyanide. Cyanides do not gener-aquatic systems. ally occur in surface waters because of their
The amount of chlorine added to municipal rapid breakdown and evaporation. They arewater supplies depends upon the pH and the typically found only near discharge points (Do-amount of organic matter and complexing jlido and Best 1993,208-9).agents in the water supply. However, it tendsto range between 0.1 to 1.0 mg 1-1 of residual free Effects. Due to the rapid breakdown of cya-chlorine (chlorine which has not reacted with nide in water, toxicity is of primary concerncomplexes or organic compounds in solution).55 for fish and shellfish. The toxicity of cyanide
is dependent upon the complexes formedEffects. Chlorine and chloramines are very with metals in solution. The weaker the com-
toxic to fish. Concentrations as low as 4 ppb as plex, the higher the toxicity. Therefore, highHOCl can be harmful to fish within four days concentrations of metals which form strongof exposure (Alabaster and Lloyd 1980,185). complexes with CN [for example, Ni, Fe (II),
Fe (III), CO] would reduce the toxicity of CN.Guidelines. The USEPA recommends chlorine Toxicity is also increased by low pH and by
residuals not exceed 11 ppb in freshwater or high temperature. 557.5 ppb in saltwater. For freshwater fisheriesat a pH of 6, the EU recommends a residual Guidelines. Maximum permissible cyanidefree chlorine concentration of 6.8 ppb or less. concentrations range from 0.2 to 20 ppbHigher pH can tolerate more. However it is depending on the compounds involved. Sug-more prudent to follow the more conservative gested general guidelines are 5 ppb in fresh-general criteria of 3 ppb suggested by some water or 1 ppb in saltwater.59
researchers. 56
Organic CompoundsTreatment. Addition of sodium thiosulfate is
the most effective method for chlorine removal. Off-flavorIt takes approximately 7 mg l-l of sodium thio-sulfate pentahydrate to remove 1 mg 1-1 of free Odorous organic compounds such as thoseresidual chlorine. Chlorine also can be removed from petroleum distillates and discharges fromby simply holding water in a storage reservoir paper processing are a common source of off-until the chlorine dissipates through exposure flavors in fish. Pulp and paper mill wastesto sunlight.57 contain polymeric lignins, phenolic com-
pounds, mercaptans, terpenes, and otherCyanide residues of chemically digested wood chips
which can contain chlorinated derivativesCyanide (CN) may be discharged into surface and degradation products of chloroligninswaters from a variety of industries including such as chloroform, carbon tetrachloride, andcoking plants, gasworks, galvanizing plants, chloroethylenes. Petroleum products enter wa-and petroleum refineries. ters via discharges from petroleum refineries

34 Source Water Quality for Aquaculture: A Guide for Assessment
or petrochemical industries as runoff contami- Pesticidesnated by motor oils and fuels, from wastes andspills of boat fuels, and from oil spills or dis- Pesticide is used to refer to any chemical em-charge of ballast water off oil tankers and other ployed to control unwanted nonpathogenic or-large ships. Phenols in source water may also ganisms including insecticides, acaricides,cause off-flavor. Phenols result from dis- herbicides, fungicides, algicides, and even ro-charges of industrial effluents (especially from tenone which is used to kill unwanted fishthermal processing of coal), from petroleum (Svobodova 1993, 30). Pesticides have tradi-refineries, and from the production of synthetic tionally been designed to be not only toxic butfabrics.60 persistent. The persistence allows for less
frequent application of the pesticide. TheseEffects. The primary effect is on the flavor of properties are precisely the reasons for the en-
the product because fish grown in water con- vironmental concern over pesticides. Pesticidestaminated with these compounds will be unpal- are of concern because of the risks they poseatable before contaminant concentrations reach to fish and shellfish health, as well as the risksan unhealthy level. The exception to this is phe- their bioaccumulation pose to product qualitynols which can have significant behavioral ef- and public health.fects on fish.6 ' Pesticides can be split into seven main cate-
The majority of off-flavor in fish exposed to gories: inorganic pesticides, organophospho-petroleum products are caused by unsaturated rus pesticides, carbamates, derivatives ofalkanes, aromatic hydrocarbons, and sulfur phenoxyacetic acid, urea pesticides, pyrid-containing organic contaminants. However not inium pesticides, and derivatives of triazineall petroleum contaminants result in off-flavor. (Dojlido and Best 1993, 234). The chlorinatedSaturated aliphatic hydrocarbons are not very pesticides are of particular concern due to theirodorous and do not cause unpalatable flavors persistence and tendency to bioaccumulate inin fish (Tucker and Martin 1991, 137). fish and shellfish.
Phenols act as anesthetics on the central The major source of pesticide contaminationnervous system. Chronic exposure to phenols in surface waters is runoff from agriculture.may result in necrobiotic changes in the brain, Pesticide manufacturing operations can emitparenchymatous organs, circulation system, wastes with extremely high pesticide concen-and gills. The symptoms of phenol poisoning trations. Because of the persistence of manyin aquatic species are increased activity, leap- pesticides, special attention must be made toing out of the water, loss of balance, and mus- potential past sources of pesticides in identify-cular spasms. ing potential contamination sources to
aquaculture source water.Guidelines. Admissible concentrations for oils Some chlorinated pesticides, namely di-
range between 0.002 and 0.025 mg 1-1. Admissi- chloro-diphenyl-trichloro-ethane or DDT,ble concentrations for phenols are 0.001 mg P' aldrin, dieldrin, heptachlor, and chlordane arefor chlorophenol, 0.003 mg 1-1 for cresol, 0.004 prohibited in the United States and their usemg 1-1 for resorcine, and 0.001 mg 1-1 for hydro- continues to decline worldwide.6 2 Howeverquinone (Svobodova 1993, 27-28,35). they are still used in some developing coun-
The simplest test for off-flavor producing tries where problems of agricultural pests andorganics requires neither equipment nor re- insect-transmitted disease are severe and alter-agents: water which tastes or smells unusual native methods are expensive or insufficientlymay result in off-flavor. Therefore a sensory developed.assessment can often be preferable to chemi-cal analysis in assessment of the source Environmental behavior. The persistence ofwater. pesticides varies depending on the chemical
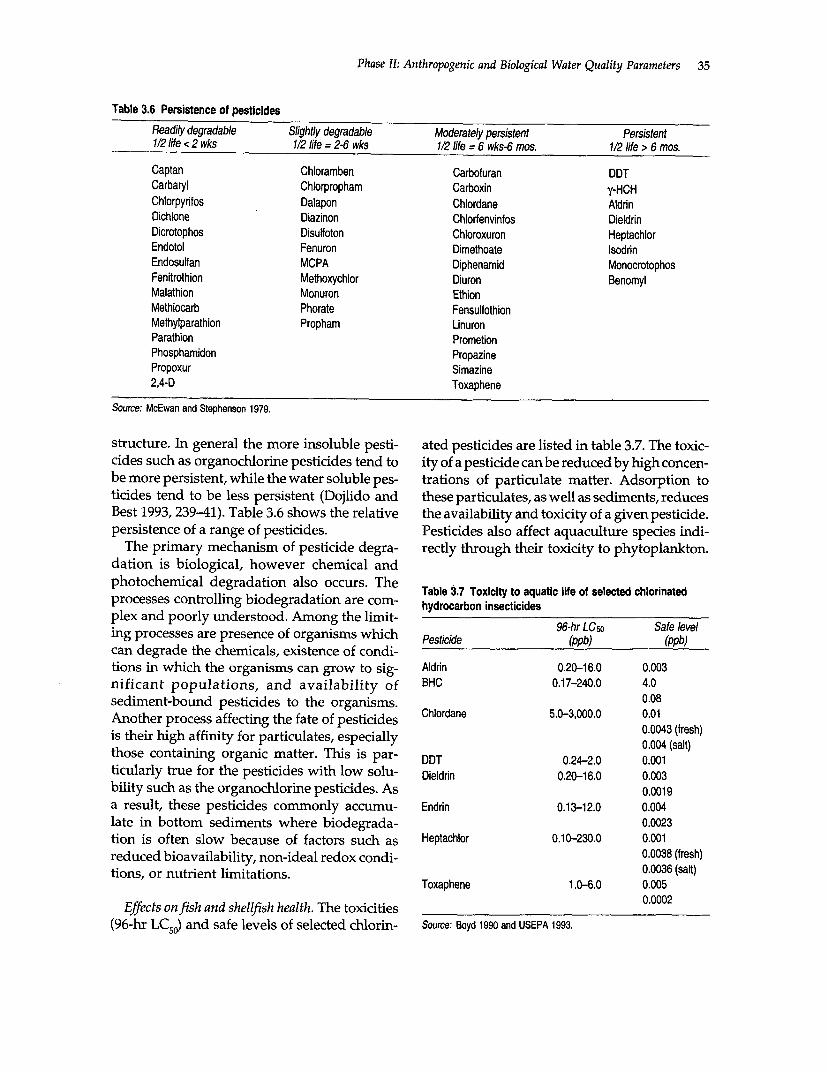
Phase II: Anthropogenic and Biological Water Quality Parameters 35
Table 3.6 Persistence of pesticides
Readily degradable Slightly degradable Moderately persistent Persistent1/2 life < 2 wks 1/2 life = 2-6 wks 1/2 life = 6 wks-6 mos. 1/2 life > 6 mos.
Captan Chloramben Carbofuran DDTCarbaryl Chlorpropham Carboxin y-HCHChlorpyrifos Dalapon Chlordane AldrinDichione Diazinon Chlorfenvinfos DieldrinDicrotophos Disulfoton Chloroxuron HeptachlorEndotol Fenuron Dimethoate IsodrinEndosulfan MCPA Diphenamid MonocrotophosFenitrothion Methoxychlor Diuron BenomylMalathion Monuron EthionMethiocarb Phorate FensulfothionMethylparathion Propham LinuronParathion PrometionPhosphamidon PropazinePropoxur Simazine2,4-D Toxaphene
Source: McEwan and Stephenson 1979.
structure. In general the more insoluble pesti- ated pesticides are listed in table 3.7. The toxic-cides such as organochlorine pesticides tend to ity of a pesticide can be reduced by high concen-be more persistent, while the water soluble pes- trations of particulate matter. Adsorption toticides tend to be less persistent (Dojlido and these particulates, as well as sediments, reducesBest 1993, 239-41). Table 3.6 shows the relative the availability and toxicity of a given pesticide.persistence of a range of pesticides. Pesticides also affect aquaculture species indi-
The primary mechanism of pesticide degra- rectly through their toxicity to phytoplankton.dation is biological, however chemical andphotochemical degradation also occurs. The Table 3.7 Toxicity to aquatic life of selected chlorinatedprocesses controlling biodegradation are com- hydrocarbon insecticidesplex and poorly understood. Among the limit- 96-hr LC5o Safe leveling processes are presence of organisms which Pesticide (ppb) (ppb)can degrade the chemicals, existence of condi-tions in which the organisms can grow to sig- Aldrin 0.20-16.0 0.003nificant populations, and availability of BHC 0.17-240.0 4.0sediment-bound pesticides to the organisms. 0.08Another process affecting the fate of pesticides Chlordane 5.0-3,000.0 0.01is their high affinity for particulates, especially 0.0043 (fresh)0.004 (salt)those containing organic matter. This is par- DDT 0.24-2.0 0.001ticularly true for the pesticides with low solu- Dieldrin 0.20-16.0 0.003bility such as the organochlorine pesticides. As 0.0019a result, these pesticides commonly accumu- Endrin 0.13-12.0 0.004late in bottom sediments where biodegrada- 0.0023tion is often slow because of factors such as Heptachlor 0.10-230.0 0.001reduced bioavailability, non-ideal redox condi- 0.0038 (fresh)tions, or nutrient limitations. 0.0036 (salt)
Toxaphene 1.0-6.0 0.005
Effects onfish and shellfish health. The toxicities 0_0002(96-hr LCJ) and safe levels of selected chlorin- Source: Boyd 1990 and USEPA 1993.

36 Source Water Quality for Aquaculture: A Guide for Assessment
Herbiciides are particularly toxic to phyto- Guidelines. The safe levels for selected pesti-plankton (Boyd 1990, 166). cides in table 24 include only a partial list of the
hundreds and potentially thousands of com-Effects on bioaccumulation. Many pesticides, mercially available pesticides. If the pesticides
including most significantly chlorinated pesti- used in the watershed from which source watercides, have a low solubility in water; however is derived are not among those listed, furtherthey readily dissolve in hydrophobic environ- investigations should be conducted to deter-ments such as the fats of aquatic organisms. In mine permissible levels.general lower solubility results in a higher ten- Depending on the pesticides of concern, thedency for a pesticide to accumulate in fish and testing required to determine permissible levelsshellfish. Efforts to experimentally quantify the may range from simple to complex. Becausebioconcentration factors (BCF) have not yielded many persistent pesticides bind strongly toexact results due to the variability in experi- sediments and suspended particulate matter,mental conditions. The BCF equals concentra- testing of concentrations which occur in solu-tion of pesticide in organism divided by tion may be misleadingly low in comparisonconcentration of pesticide in water. However with their bioavailability (Lloyd 1992, 90).they have yielded general BCF ranges for a Therefore if the presence of persistent pesticidesparticular compound. Listed in table 3.8 are the is suspected in source water or sediments, asolubility of selected pesticides and the corre- Phase III field study should be conducted tosponding ranges of experimentally derived determine the effects of potential pesticide ac-BCF for fish. cumulation on culture species and consumers.
Effects on human health. Organochlorine pesti- Treatment. Options include those used incides are absorbed in humans by the gastroin- treatment of municipal water supplies such astestinal tract, and some may also be absorbed reverse osmosis, ion exchange, air stripping,through the skin. The toxic mechanisms are not adsorption, and oxidation. However these areyet fully understood, but the major toxic action often very expensive. Finding another sourceof organochlorine pesticides is on the central water may be the most viable choice.and peripheral nervous system. Exposure to Water from an uncontaminated source canchlorinated cyclodiene insecticides (that is, be contaminated by insecticides after it is in-aldrin, dieldrin, endrin, chlordane, heptachlor, troduced into culture facilities. Pesticidesendosulfan, and isodrin) causes headaches, diz- sprayed onto crops may drift over considerableziness, nausea, vomiting, jerking muscles, and distances to ponds and canals (Boyd 1989, 47).convulsions. In addition many pesticides are Box 3.1 describes measures to prevent pesticidessuspected carcinogens.63 from contaminating the aquaculture ponds.
Table 3.8 Pesticide solubility and experimentally derived bioaccumulation factors in fishPesticide Solubility in water (mg 1-') BCF in fish References
Aldrin 0.02 3,890-10,715 Suntio et al. 1988 and Howard 1991Atrazine 33 3-10 Khan 1977BHC low 1,160-3,740 Khan 1977Chlordane 0.1 5,200-38,000 Worthing 1987 and Howard 1991Dieldrin 0.17 3-6,000 Suntio 1988 and Howard 1991Endrin 0.00025 1,335-10,000 Biggar and Riggs 1974 and Howard 1991Heptachlor 0.18 5,744-21,379 Biggar and Riggs 1974 and Howard 1991Toxaphene 0.55 3,100-33,300 Murphy etal. 1987 and Reish et aL 1978
Note: BOF factors partially taken from Howard (1991), in which literature values are included for a long list of pesticides. Ranges listed here were takenfrom the literature values quoted for fish that did not specify an unusually short equilibrium time (that is, on the order of hours.)
Phase II: Anthropogenic and Biological Water Quality Parameters 37
Box 3.1 Protecting aquaculture ponds processed and distributed chemical productsfrom pesticides in the world. Primary sources include runoff
from roads and discharge from industries us-• Place ponds a considerable distance from ing oil (Dojlido and Best 1993, 231). As men-
pesticide treated fields. tioned earlier, the major concern of petroleum. Plant trees or other tall plants between pes- hydrocarbons to aquaculture is producing off-
ticice treated fields and aquaculture facili- flavor. Crude oil, either released from tankersties to intercept airborne drift of sprayed at or stc al oil fied or shorepesticides. at sea or spilt accidentally at oil fields or shore
. Construct topographic barriers (ditches or terminals, is a major pollutant in the intertidalterraces) to prevent agricultural runoff zone which can devastate oyster beds (Milnefrom entering ponds. 1972, 163). The risks of potential aquaculture
. Use proper methods of pesticide applica- source water taken from areas with high oiltion to fields.
. Properly dispose of all pesticides and pes- tanker traffic should be considered carefully.ticide containers.
Polychlorinated BiphenylsSource. Boyd 1990.
Polychlorinated biphenyls (PCB) were heavilyused in transformers and capacitors of heavy
Antibiotics and Antimicrobials electrical equipment as lubricants for compres-sors and in the production of varnishes, dye-
Agriculture is one example of industries re- stuffs and plastics (EIFAC 1993, 28). Commonquiring control of microbes which may con- worldwide PCB trade names are Aroclortaminate source water with unwanted anti- (USA), Clophen (Germany), Delor (Czechoslo-biotics and antimicrobials. Iodine, for example, vakia), Kaneclor Japan), and Savol and Sovtolis often used in veterinary drugs, agricultural (Russia and the former Soviet republics).65 Inchemicals, and sanitizing solutions (WHO the 1970s severe restrictions were made on its1989b, 32). These chemicals may damage the production and as a result worldwide produc-natural micro-biological conununities which tion has gone down drastically. However PCBare necessary for the health of the culture spe- is considered among the most persistent pol-cies; or they may disturb the natural microbio- lutants and contamination is widespread. Be-logical environment, creating an opening for cause of their persistence, it is of particularopportunistic pathogens. importance to identify older companies which
Bioavailability is a particularly important is- may have been producing the chemical in or-sue for antibiotics and antimicrobials. Testing der to identify if PCBs are potentially contami-procedures for these compounds are so sensi- nating the source water. It should also be notedtive that even a few molecules can be detected. that PCBs can travel great distances and there-However molecules which are bound to sedi- fore industries outside the immediate localityments and other substrates, and thus biologi- may be contaminating the source water ofcally unavailable, must be detached in order to concern.be detected. Therefore the levels which areshown by testing may be representative of Environmental behavior. PCBs are extremelymany antibiotic and antimicrobial chemical persistent in the environment. Although theycomplexes which are not biologically active.64 can be biodegraded, degradation is slow under
natural conditions. The PCBs are able to volatil-Petroleum Hydrocarbons ize from water; however the more common des-
tiny for these molecules is in sediments andAs components of liquid and gaseous fuels, body tissues. This is due to their extremely lowhydrocarbons are among the most widely solubility which encourages adsorption to sedi-
38 Source Water Quality for Aquaculture: A Guide for Assessment
ments and accumulation in the fat tissues of fish pared to that in the tested formulations (Svobo-and mammals. As a result, concentration of dova 1993, 28).PCBs in the water column are typically much General water criteria for aquatic organismslower than in the sediments (Dojlido and Best as set by the USEPA are less than 0.014 ppb for1993, 183, 282). freshwater and less than 0.03 ppb for saltwater.
Meade (1989) suggests that levels up to 2 ppbEffects on fish and shellfish health. Chronic ex- may be acceptable. Due to their high toxicity,
posure to low levels of PCBs may result in if levels of any PCBs exceed those set out byskeletal deformities, skin and fin damage (pos- the USEPA, a Phase Im pilot project should besibly disintegration), damage to the liver and pursued to identify and quantify a number ofgonads, high mortality during hatching, and key types of PCBs for an expert evaluation ofhigh mortality of early fry (Svobodova 1993, the potential hazard.6829). The eggs and larvae of aquatic organismsare more sensitive to these pollutants. The solu- Dioxins and Furansbility and thus toxicity of PCBs are enhanced byincreases in temperature. Dioxins is a general term for 75 different poly-
chlorinated dibenzo-o-dioxins. Similarly,Effects on bioaccumulation. Because of their low furans is a general term for 135 different poly-
solubility in water and high solubility in fat, chlorinated dibenzofurans. Furans are typi-these compounds have a large tendency to ac- cally found in conjunction with dioxins.cumulate in the food chain, especially in lipid Dioxins and furans can enter water via therich eggs and fatty fish such as eels. The BCF for wastewater of industries such as wood proc-PCBs in aquatic organisms ranges from 103 to essing plants, pulp and paper mills, tanneries,105. Shellfish and mussels are known to accu- and the production of pesticides and woodmulate PCBs in contaminated waters.66 preservatives. Also, combustion of wastes, coal
and chlorinated pesticides can produce dioxinsEffects on human health. When ingested, less and furans (Dojlido and Best 1993, 287).
highly chlorinated PCBs are metabolized in theliver and excreted, but more highly chlorinated Environmental behavior. Dioxins and furans arebiphenyls are metabolically stable and accumu- widespread in the water environment. Sedimentslate in body fat. However the toxicity of PCBs are a major sink for these compounds. Theirto humans is generally low. In Japan in 1968 an biodegradation is slow and because of their lowaccidental consumption of PCB-contaminated solubility, they readily adsorb to sediments.edible oil by 1,000 people resulted in no mortali-ties but adverse health symptoms were ob- Effects on fish and shellfish health. In rainbowserved for three years.67 trout, coho salmon, guppy, and pike, chronic
exposure to tetrachloro dioxin (TCDD) throughGuidelines. Because there are over 200 PCBs diet or water caused decreased growth and
with individual toxicological properties caused fin necrosis and death.69
which are often mixed together, it is difficultto determine toxicity standards for either hu- Effects on bioaccumulation. Dioxins and furansman or aquatic species. Most toxicity tests are have low solubility and therefore are capable ofcarried out on commercial formulations bioaccumulation in fish. Bioaccumulation fac-which are normally identified by the extent to tors up to 10,000 have been reported (Isenseewhich they are chlorinated rather than by the 1978).PCBs that they contain. Differential uptake ofthe individual components leads to a different Effects on human health. Of the dioxins the 2,3,ratio being found in the organisms when com- 7, 8 tetrachloro isomer (2,3,7,8 TCDD) is the
Phase II: Anthropogenic and Biological Water Quality Parameters 39
most toxic. The primary human health effects of one order of magnitude takes place in-pond, sodioxins are chloracne and possible birth defects. that in-pond concentrations should be less thanThey have also been shown to affect the liver 103 per 100 ml. If pond temperature and reten-and nervous system.70 tion time indicate that a higher reduction can be
However, it should be noted that the effects achieved, this guideline may be relaxed. At con-of dioxins and furans in the above areas are centrations above 104 and 105 per 100 ml, thenot certain and a point of great controversy in potential for fecal coliform and other pathogenspolitics and in the scientific community. to invade muscle tissue is very high.7"
Guidelines. It is difficult to prescribe guide- Guidelinesfor total bacteria. The validity of fecallines considering the controversial nature of coliform as an overall indicator of bacteriologi-dioxin effects. It is recommended that dioxins cal contamination is debatable, especially in thebe evaluated on a case-by-case basis. If their tropics. Reliance on coliform standards maypresence is suspected, a Phase Im field study overestimate potential health risks, unduly bur-should be pursued. dening developing countries in their efforts to
develop shellfish resources in tropical watersPathogens and Biological Contaminants (Rice 1992, 195). Some researchers recommend
that the concentration of total bacteria (not totalHigh concentrations of pathogenic organisms coliforms or fecal coliforms, but standard plateare commonly found in waters polluted by hu- count per ml) be used to assess the risk of mi-man sewage and animal wastes. Thus a major crobial contamination. They point out that ifsource of contamination is sewage outfalls in total bacteria reaches 1.0 to 5.0 multiplied by 104
populated areas and livestock facilities. per ml, then bacteria are likely to appear inmuscle tissue (Buras and others 1985).
Human Pathogens in Fish and ShellfishGuidelines for specific pathogens and parasites.
In many countries untreated wastewater or Other pathogens associated with human dis-animal wastes are used directly in aquacul- eases such as salmonella, streptococcus, Aero-ture; in these cases contamination is of particu- monas, Pseudomonas, Klebsiellae, and Escherichiaelar concern. are often found in the gut of fish cultured in
wastewater, but rarely in the muscle tissues orEffects. Human pathogens are of concern in visceral organs. WHO recommends that salmo-
aquaculture because they can accumulate in nella count in source water not exceed 103 perfish. These organisms do not cause disease in 100 ml. Mara and Cairncross (1989) recommendthe fish. However, the fish can serve as a vector that the concentration of viable trematode eggsfor the disease thus infecting humans who con- (arithmetic mean number per liter or kg) besume them or handle them. Many pathogens, equal to zero, because the only feasible means ofincluding salmonella, E. coli and Clostridium controlling Clonorchis sinensis, Fasciolopsis buski,botulinum, have been found to survive in fish and Schistosoma japonicum (species which aretissues (Buras 1990). endemic to Asia) is to remove all viable eggs
before the wastewater is applied to ponds.72
Guidelinesforfecal coliforms. WHO (1989) rec- Botulism, typhoid, hepatitis, cholera, non-ommends that fecal coliform counts in source specific gastroenteritis, and a host of other dis-water not exceed 103 per 100 ml. Mara and eases may also result from ingestion of raw orCairncross (1989) indicate that in wastewater- insufficiently cooked fish and shellfish. There-fed ponds, concentrations of 104 per 100 ml are fore if wastewater or other sources which areacceptable for culture of both fish and aquatic likely to be contaminated with pathogens aremacrophytes. They assume that a reduction of used, source water should be tested for a range
40 Source Water Quality for Aquaculture: A Guide for Assessment
of pathogens which might influence project Because such pathogens are difficult and expen-viability. sive to monitor, standards are set for depura-
tion processes rather than for the concentrationStandards for shellfish. The United States has of pathogens in the flesh of cultured organisms
established standards for waters that can be (Pillay 1992, 104). For example, only shellfishused to culture or harvest shellfish. For these grown from certified operations can be sold onwaters the total coliform median or geometric the United States and Canadian markets.mean most probable number (MPN) of the The two most common methods of depura-water should not exceed 70 per 100 ml and not tion are relaying in clean water or depurationmore than 10 percent of the samples can exceed in specially designed plants. Relaying entailsan MPN of 230 per 100 ml for a 5-tube decimal transplanting shellfish into a clean area for adilution test (or an MPN of 330 per 100 ml for a minimum period of time, usually 30 days;3-tube decimal dilution test). In addition the however, depuration of highly contaminatedfecal coliform median or geometric mean MPN shellfish requires longer purging periods andof the water should not exceed 14 per 100 ml and is not feasible on a commercial basis. Depura-not more than 10 percent of the samples can tion plants store the shellfish in tanks of seawa-exceed an MPN of 43 per 100 ml for a 5-tube ter disinfected with filters, chlorine, ozone, ordecimal dilution test (or an MPN of 49 per 100 ultra-violet radiation (Pillay 1992,104). Despiteml for a 3-tube decimal dilution test).73 its acceptance in many countries, depuration
alone without attention to water quality in theWater treatment. Wastewater usage can be initial growing areas is not sufficient to assure
treated through traditional wastewater treat- safe shellfish. Careful attention must be givenment processes. These processes can be a com- for developing unpolluted areas and culturebination of primary sedimentation, activated practices which will minimize the risk of mi-sludge, biofiltration, aerated lagoon, oxidation crobial contamination of shellfish.ditch, disinfection, waste stabilization ponds, oreffluent storage reservoirs. Treated waste- Phytoplankton and Algal Toxinswaters have been shown usable for aquacultureand, in some cases, as a better altemative than Off-flavor. The muddy, earthy flavor of fishthe local contaminated surface water.74 grown in fresh or brackish water is one of the
In addition, chlorination of aquaculture most common types of environmental contami-ponds to remove pathogens can be performed. nation of aquaculture fish; it can often be antici-The chlorine dose will vary depending on pH pated by smelling or tasting the source water.and the concentration of organic matter and This muddy off-flavor, which is easily detectedammonia. However, when chlorinating in mild-flavored fish, is not harmful to humanaquaculture ponds, one has to be careful the health, but can result in lower prices forconcentrations of chlorine are reduced below aquaculture products. Off-flavor in pond-cul-toxic levels before the fish are exposed to the ture fish is characteristic of geosmin, 2-methyl-disinfected water (Boyd 1996, 44). isobomeol, mucidone, or similar compounds
produced by blooms of actinomycetes and blue-Treatment by depuration of shellfish. Filter-feed- green algae. Algal blooms are often times un-
ing shellfish grown in polluted or low-quality predictable and hard to prevent. The offendingwater accumulate pathogenic micro-organisms algae can be killed with copper sulfate, but theand have to be depurated before sale, especially best strategy is to remove the muddy flavorin areas where shellfish is eaten raw or partially through depuration in clean water prior to har-uncooked. Depuration also reduces the risk of vesting. Catfish, for example, can depurate in 5viral pathogens, such as hepatitis, which are to 15 days depending on water temperature andoften transmitted through oysters and clams. the severity of the off-flavor. Algae which cause
Phase II: Anthropogenic and Biological Water Quality Parameters 41
muddy off-flavor do not thrive in saline water muscle, rarely becomes toxic. Depuration is(Pillay 1992, 100-1). feasible for rapidly detoxifying species. How-
ever detoxifying shellfish on a large scale is notRed tide. Red tides (blooms of toxic dinoflag- economically promising.76
ellates) are a major source of fish and shellfishmortality and a serious public health hazard. Toxic algal blooms. Toxic algal blooms are dif-The most common algal blooms in tropical wa- ficult to prevent or predict. Algal blooms origi-ters are caused by the dinoflagellate Pyrodinium nate in the oceans far from shellfish beds, andbahamense var. compressa.75 the mechanisms which cause them are not well
Shellfish rapidly accumulate these toxins understood. The toxins associated with theseand become vectors of various forms of shell- algae can cause shellfish to become toxic over-fish poisoning, such as paralytic shellfish poi- night. These toxins can persist for months aftersoning (PSP), diarrhetic shellfish poisoning blooms have disappeared, resulting in major(DSP), neurotoxic shellfish poisoning (NSP), economic disasters (Pillay 1992,105).and amnesiac shellfish poisoning (ASP). Ratesof toxin accumulation and depuration vary Guidelines. Because it is difficult to predictwith species, temperature, and intensity of if a given source water will be a victim of algalblooms. Mussels both accumulate and depu- or phytoplankton blooms, guidelines need torate PSP toxins more quickly than other spe- be based on historical monitoring data. If datacies, while oysters take a longer time to exist on location and extent of algal or phy-accumulate and to detoxify. Some species have toplankton blooms, then it should be deter-been reported to remain toxic for up to two mined if the area of the proposed sourceyears. The hard clam or quahog, on the other water is susceptible to blooms. If so, thehand, can avoid toxic algae by burying itself risks must be considered carefully. The ef-deep within the sand and closing its shell. Scal- fects may be mitigated by restricting thelops are also safe to eat during algal blooms types of species farmed or the time of yearbecause the part normally eaten, the abductor farms can operate using this source water.
CHAPTER 4
Phase III: Field Study
P hase m should be pursued if Phase I or processes, and the project species. The fishPhase II criteria are not met and the risks growth, health, and contaminant residues canare either considered acceptable or a then be measured. A design and cost analysis
treatment method which is technically and fi- can be made of any proposed treatmentnancially viable is found. The purpose of processes.Phase III is to provide a field test of aquacul- In both cases it is important to emulate theture operation when the success of the project conditions to be used in the final project. Thisis in question based on water quality. The includes not only source water and speciesfield study will help render a decision on but, if possible, the soil. Because quality inwhether or not to use the selected source surface waters can vary seasonally, it is im-water. In the case where the source water is portant to run the study over a representativeaccepted, any operational problems or ad- time period which reflects these changes. Typi-justments can be anticipated before the pro- cally this would be one year. In order to makeject begins. The field study specifically focuses sure the influence of source water quality onon evaluating the fish growth and health, the project outcome is being tested, efforts shouldcontaminant residues in the fish, and the tech- be made to eliminate other possible sources ofnical and economic feasibility of a treatment failure.operation.
Criteria for Fish Growth and HealthStudy Design
Fish should be of sufficient size to be market-There are two options for the type of field able and production should operate at a highstudy. The more cost efficient method is to find enough rate to be profitable. The fish shouldan operating aquaculture facility in the area be sufficiently healthy so disease or its risk iswhich is using the same source water and man- low. The fish should undergo examination foragement techniques to grow a similar species. any specific symptoms based on the pollutantsTests for species growth and health and con- present. More general examination for dis-taminant residues can then be made on the eases, stress, or abnormalities should be per-product of this facility. In addition, a detail formed. Recent research has pointed to thedesign including cost analysis can be made of utility of biomarkers in assessing a potentialany proposed treatment processes. effect of water quality on fish. These markers,
The second option is to set up a pilot study which are listed in appendix table 4, may be ofof the aquaculture facility, using the pro- use depending on the pollutant. In particularposed source water, any proposed treatment those measuring stress such as the corticos-
42
Phase III: Field Study 43
teroids/cataecholamines biomarkers have biological contaminants for the United States,been suggested as a good measure of general Canada, Japan, and the European Union.stress as a result of water quality problems(Tarazona and Munoz 1995). Fish and Shellfish Intended
for Local ConsumptionCriteria for Contaminant Residues
Because diet and possible exposure to contami-In the case of fish intended for export, contami- nants differ from country to country, standardsnant residues should be sufficiently low to for contaminant residues set as import stand-meet the standards of the importing country. ards by some countries in food may not beFor fish intended for consumption locally, appropriate for the project area. Both wherestandards should be adopted based on protec- aquaculture products will be consumed andtion of public health. what product parts will be consumed must be
taken into account when considering permis-Basisfor Standards sible levels of contaminant residues. If a prod-
uct is going to be consumed heavily in a localLevels of contaminants allowed in food and area, the residues will have to be lower to bedrinking water are based upon provisional tol- safe. In addition all edible parts should meeterable weekly intake (PTWI) standards. These consumption standards and the parts of a fishstandards, expressed in micrograms per per- deemed edible vary from market to market ac-son or micrograms per person per kilogram of cording to custom and taste. Consumers inbody weight, depend upon the average rate of some regions may eat kidneys, livers, or otherhuman bioaccumulation from contaminated organs, while consumers in other regions willfoodstuffs. Standards for contaminant residues eat only muscle tissues. In addition, certainin food are calculated on the basis of the PTWI, contaminants may accumulate in the kidney,rate of consumption of the foodstuff, and prob- liver, and muscle tissues of a fish at differentable extent of exposure to the contaminant via rates. Hence a single fish may contain someother pathways. PTWI for selected contami- parts which meet standards and others whichnants are listed in appendix table 5. do not.
If no standards are set for the project area,Fish and Shellfish Intendedfor Export the above factors should be considered to the
extent possible in establishing standards. In ar-For fish and shellfish intended for export, the riving at these standards the list of PTWI incontaminant residues should meet the stand- appendix table 5 may be useful along with theards of the importing country. Appendix tables import standards for different countries listed6 and 7 list these standards for chemical and in appendix tables 6 and 7.
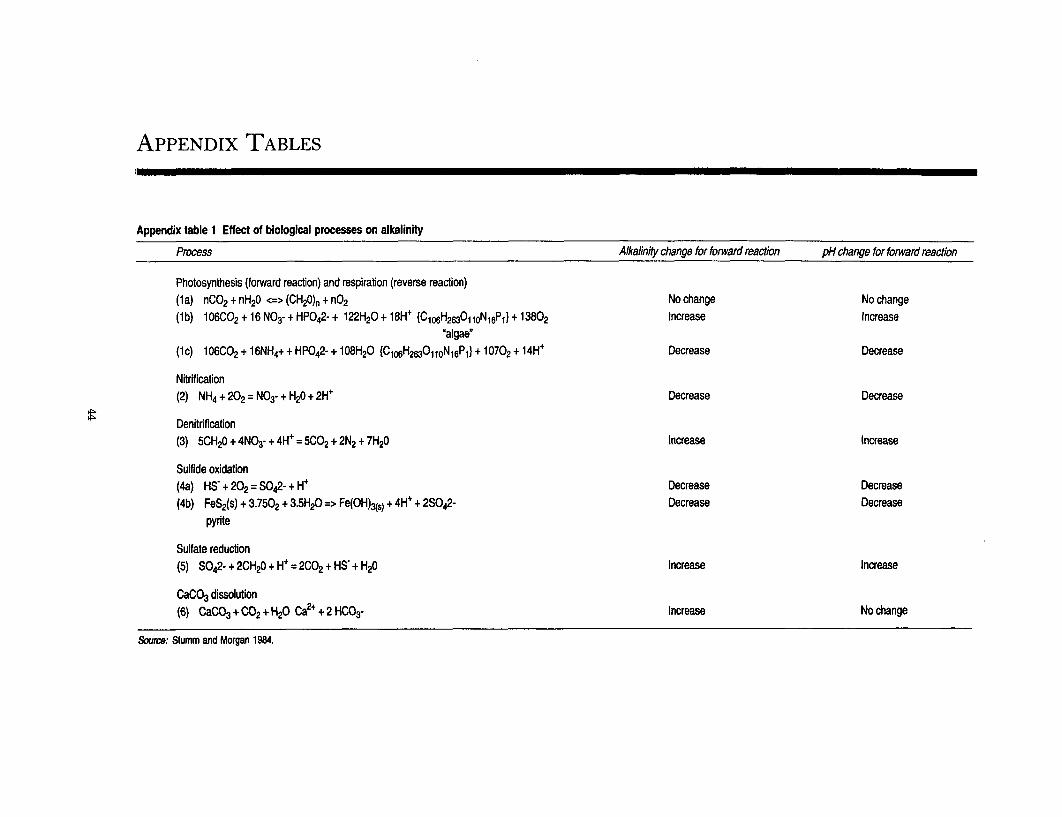
APPENDIX TABLES
Appendix table 1 Effect of biological processes on alkalinity
Process Alkalinity change for forward reaction pH change for forward reaction
Photosynthesis (forward reaction) and respiration (reverse reaction)(la) nCO2 + nH20 <=> (CH20)n + nO2 No change No change(lb) 106C02 + 16 NO3-+ HP0 42- + 122H20 + 18H {CI06H2630110N16Pl) + 13802 Increase Increase
'algae'
(1c) 106C02 + 16NH 4+ + HPO42- + 108H20 (C{06H2630 110N16P) + 10702 + 14H+ Decrease Decrease
Nitrification(2) NI-14+ 202 = NO3-+ H20 + 2H+ Decrease Decrease
Denitrification(3) 5CH20 + 4NO3- + 4H+ = 5CO2 + 2N2 + 7H20 Increase Increase
Sulfide oxidation(4a) HS- + 202 = S042- + H+ Decrease Decrease
(4b) FeS2(s) + 3.7502 + 3.5H 20 => Fe(OH)3(S) + 4H+ + 2SO42- Decrease Decrease
pyrite
Sulfate reduction(5) S042- + 2CH20 + H+= 22 + HS + H20 Increase Increase
CaCO3 dissolution(6) CaCO3 + CO2 + H20 Ca2+ + 2 HC0 3- Increase No change
Source: Stumm and Morgan 1984.

Appendix Tables 45
Appendix table 2 Relative abundance categories of soil chemical variables in brackish water ponds
1st decile 2nd-3rd decile 4th-7th decile 8th-9th decile 10th decileVariable (very low) (low) (medium) (high) (very high)
pH < 4 4-6 6-8 8-9 > 9Carbon (%) < 0.5 0.5-1 1-2.5 2.5-4 > 4Nitrogen (%) < 0.15 0.15-0.25 0.25-0.4 0.4-0.5 > 0.5Sulfur (%) < 0.05 0.05-0.1 0.1-0.5 0.5-1.5 > 1.5
Phosphorus (mg 11) < 20 20-40 40-250 250-400 > 400Calcium (mg 11) < 1,000 1,000-2,000 2,000-4,000 4,000-8,000 > 8,000Magnesium (mg 1") < 700 700-1,500 1,500-3,000 3,000-4,000 > 4,000Potassium (mg 1") < 100 100-400 400-1,200 1,200-1,700 > 1,700Sodium (mg 11) < 2,500 2,500-7,000 7,000-15,000 15,000-25,000 > 25,000Iron (mg 1.) < 60 60-200 200-750 750-1,200 > 1,200Manganese (mg 11) <10 10-50 50-150 150-350 > 350Zinc (mg [-1) < 2 2-5 5-8 8-14 > 14Copper (mg l') <1 1-2 2-8 8-11 >11Silicon (mg 11) < 30 30-100 100-500 500-750 > 750Boron (mg 1-) < 4 4-8 8-18 18-24 >24Cobalt (mg 11) < 0.5 0.5-1 1-2.5 2.5-3.5 > 3.5Molybdenum (mg 11) < 0.3 0.3-0.5 0.5-0.9 0.9-1.2 > 1.2Aluminum (mg -1) <100 100-200 200-500 500-600 >600Barium (mg 1.1) < 0.5 0.5-1 1-1.5 1.5-3.5 > 3.5Chromium (mg 11) < 1 1-2 2-4 4-7 > 7Lead (mg 11) < 2 2-4 4-7 7-9 > 9
Note: Series of soil samples from 346 brackish water aquaculture ponds.Source: Boyd and others 1994.

46 Source Water Quality for Aquaculture: A Guide for Assessment
Appendix table 3 Relative abundance categories of soil chemical variables in freshwater ponds
1st decile 2nd-3rd decile 4th-7th decile 8th-9th decile 10th decileVariable (very low) (low) (medium) (high) (very high)
pH < 5 5-6 6-7 7-8 > 8Carbon (%) < 0.5 0.5-1 1-2 2-3.5 > 3.5Nitrogen (%) < 0.2 0.2-0.3 0.3-0.4 0.4-0.5 > 0.5Sulfur (%) < 0.01 0.01-0.025 0.025-0.05 0.05-0.125 > 0.125Phosphorus (mg 11) < 5 5-10 10-20 20-40 > 40Calcium (mg l-1) < 600 601-1,200 1,200-3,400 3,400-7,600 > 7,600Magnesium (mg 1.1) < 45 45-80 80-120 120-230 > 230Potassium (mg 1-1) < 30 30-60 60-80 80-110 >110Sodium (mg 1') < 15 15-35 35-60 60-100 > 100Iron (mg 11) <10 10-50 50-130 130-210 > 210Manganese (mg 11) < 5 5-20 20-40 40-75 > 75Zinc (mg 1-1) < 0.2 0.2-1.5 1.5-2.5 2.5-5 > 5Copper (mg 11) < 0.3 0.3-1.25 1.25-2.5 2.5-6 > 6Silicon (mg 11) < 20 20-40 40-60 60-100 > 100Boron (mg 1") < 0.3 0.3-0.5 0.5-0.75 0.75-1.25 > 1.25Cobalt (mg i1) < 0.1 0.1-0.2 0.2-0.35 0.35-0.8 > 0.8Molybdenum (mg 1) <0.1 0.11-0.15 0.15-0.2 0.21-0.35 >0.35Aluminum (mg 1.1) < 3.5 3.5-75 75-120 120-200 > 200Barium (mg 11) < 0.5 0.5-1 1-1.5 1.5-4 > 4Chromium (mg 1") < 0.5 0.5-0.75 0.75-1 1-1.75 > 1.75Lead (mg 1.1) < 1 1-1.25 1.25-1.5 1.5-2.5 > 2.5
Note: Series of soil samples from 358 freshwater aquaculture ponds.Source: Boyd and others 1994.

Appendix Tables 47
Appendix table 4 Selected blomarkers proposed in study of environmental and/or toxicological responses In tish
Type Biomarker Comments
DNA alterations DNA adducts Specific for genotoxic chemicals
DNA alterations Strand breaks in DNA Specific for genotoxic chemicals
DNA alterations Hypomethylation of DNA Specific for genotoxic chemicals
DNA alterations Cyotgenetic effects Specific for genotoxic chemicals
Biochemical Induction of Cyt. P-450 Organic planar compounds
Biochemical Metallothioneins Selected metals
Biochemical ATPases Nonspecific
Biochemical Aminolevulinic acid dehyd. Specific for lead
Biochemical Methemoglobin Specific for nitrite and other chemicals
Biochemical Acetylcholinesterase Specific for organophosphorous and carbamates
Physiological Adenylate energy change NonspecificPhysiological Glycogen Nonspecific
Physiological Scope for growth Nonspecific
Physiological Corticosteroidslcatecholamines Nonspecific-primary stress response
Physiological Plasma thyroid hormone Developmental alterations in growth
Physiological Growth hormone Growth inhibitors: chlorpyrifos and phenol
Physiological Stress (heat shock) proteins Nonspecific
Immunological Leucokrit General screen assayImmunological Macrophage phagocytosis
Immunological Macrophage pinocytosis
Immunological Native immunoglobulin Humoral comprehensive assay
Immunological Specific antibody quantitation Humoral host resistance challenge assay
Immunological Increase disease susceptibility Comprehensive host resistance challenge assay
Histopathological Hepatic biomarkers Different lesions depending on the chemical
Histopathological Vertebral abnormalities Temperature, oxygen, metals
Source: Tarazona and Munoz 1995.
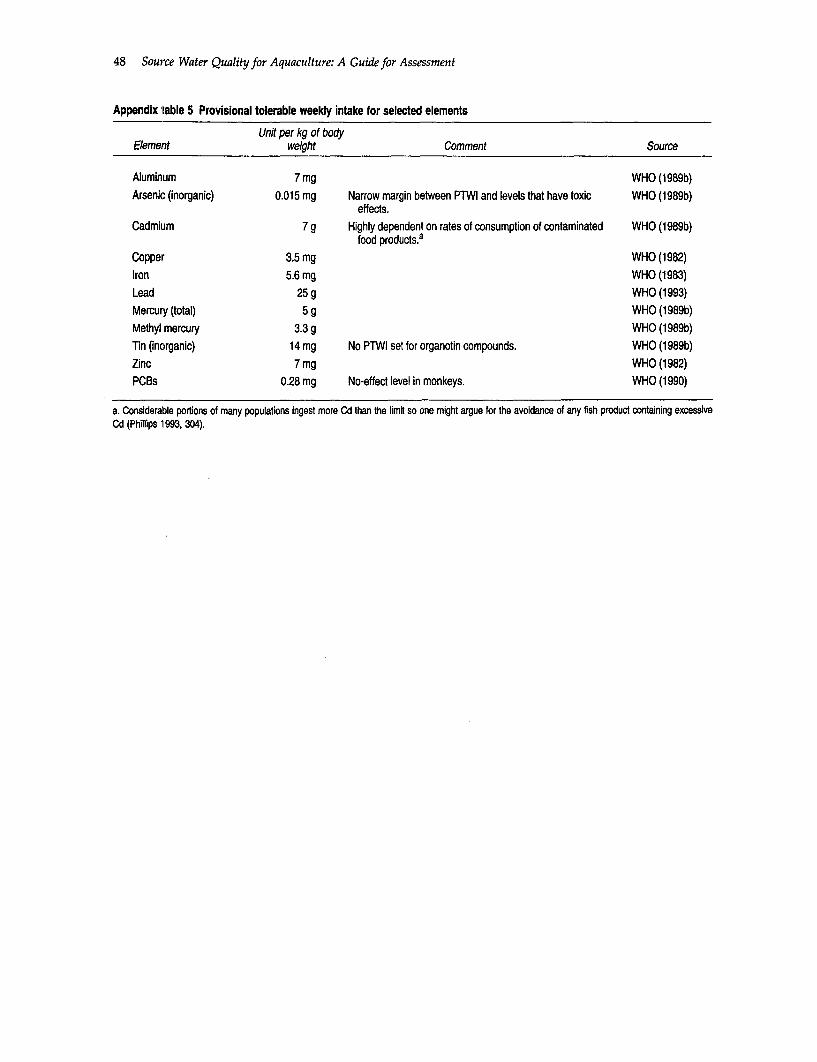
48 Source Water Quality for Aquaculture: A Guide for Assessment
Appendix table 5 Provisional tolerable weekly intake for selected elements
Unit per kg of bodyElement weight Comment Source
Aluminum 7mg WHO (1989b)
Arsenic (inorganic) 0.015 mg Narrow margin between PTWI and levels that have toxic WHO (1989b)effects.
Cadmium 7 g Highly dependent on rates of consumption of contaminated WHO (1 989b)food products.a
Copper 3.5 mg WHO (1982)Iron 5.6 mg WHO (1983)
Lead 25 g WHO (1993)Mercury (total) 5 g WHO (1 989b)
Methyl mercury 3.3 g WHO (1 989b)Tin (inorganic) 14 mg No PTWI set for organotin compounds. WHO (1989b)
Zinc 7mg WHO (1982)PCBs 0.28 mg No-effect level in monkeys. WHO (1990)
a. Considerable portions of many populations ingest more Cd than the limit so one might argue for the avoidance of any fish product containing excessiveCd (Phillips 1993, 304).

Appendix table 6 Import standards for contaminant residues in fish and shelffish
United States Canadian Japanese European UnionMedian standard Range of import standard import standard import standard impont standard
Contaminant Shelffish Fish standards' Shellfisht Fisht Shellfish Fish Shellfish Fish4. Shellfish52'3 Fish5,21
Arsenic (AS) 1.5 0.1-5.0 766 3,529 3,529 -17,18,20 "18,20
Cadmium (Cd) 1 0.3 0.05-2.0 36 "17,18,20 **18,20
Chromium (Cr) 1 1 1 126 "17,18,20 "18,20
Copper (Cu) 20 20 10-100 "17,18,20 18,20
Lead (Pb) 2 2 0.5-10 1.56 0.529 0.529 -17,18,20 *18,20
Mercury (Hg) 0.5 0.5 0.1-1.0 1.0.0 7'f 0.5 8230 0.4,0.321,26 0.4,0.325,26 0.58,13,15,18.20 0 85,1 08,13,14,15,18,20Nickel (Ni) 706 "17,18,20 *-18,20
Selenium (Se) 0.3 2 0.3-2.0 -17,18,20 -18,20Tin (Sn) 190 150 50-250 -17,18,20 "18,20
Zinc (Zn) 70 45 40-100 -17,18,20 "18,20
Paralytic shellfish 0.88 4.0 MU/g8,27 0.816
poison (PSP)Neurotoxic shellfish
poison (NSP)Diarrhetic shellfish 0.05 MU/g5,27 "16,22
poison (DSP)Dyes "18
Petroleum hydro- `17
carbonsOrganophosphorus "18 18
compoundsOrganohalogenated "17,18.19 "18,19
compoundsPCBs 2.08 2.08 2.08 0.500.5,3.08,24 *18,19 *18,192,3,7,8 -TCDD 0.02 ppb2DDT and dervatives 5,o8 5.08Dieldrin 0.38,81 2 o.38,9.12 0.128
Chordane 0.38 0.38Chlordecone 0.3,0.48.10 0.38
Heptachlor/Hepta- 0.3' 0.38chlor Epoxide
2,4-D 1.0 1.0Mirex 0.18 0.18Diquat 0.1 0.1Fluridone 0.511 059Glyphosate 3.0 0.259Simazine 129
(Table continues on next page.)
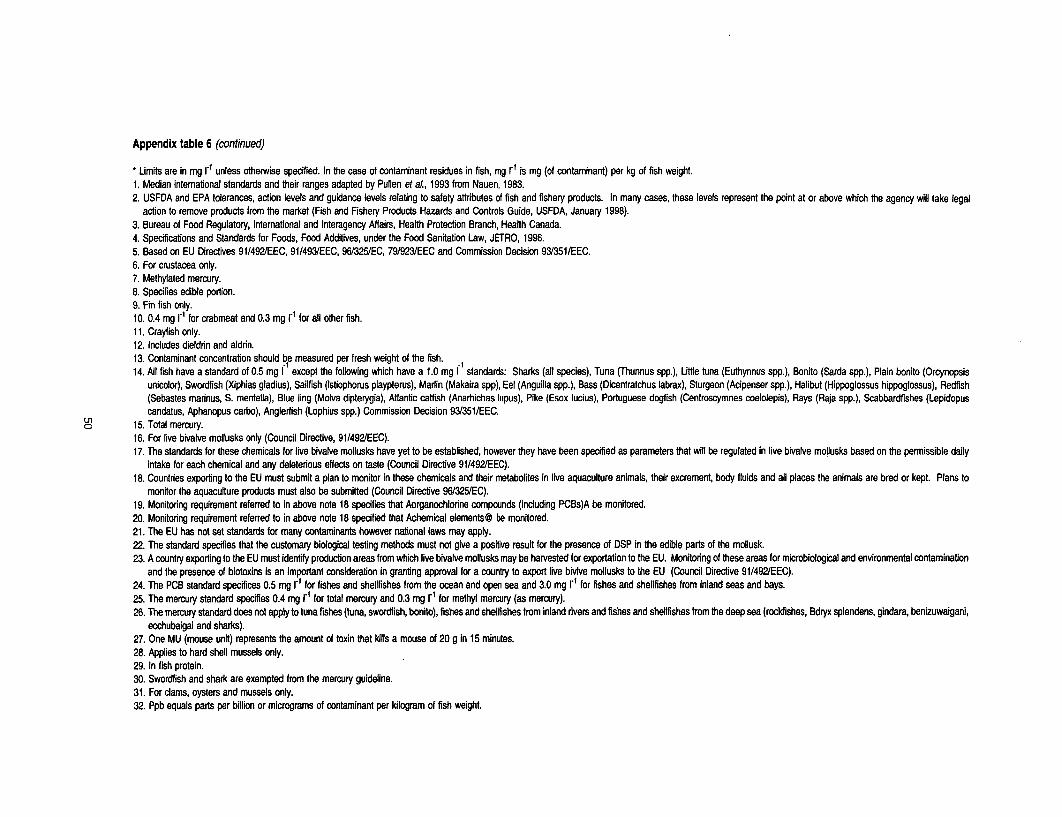
Appendix table 6 (continued)
* Limits are in mg i'l unless otherwise specified. In the case of contaminant residues in fish, mg I" is mg (of contaminant) per kg of fish weight.1. Median intemational standards and their ranges adapted by Pullen et al., 1993 from Nauen, 1983.2. USFDA and EPA tolerances, action levels and guidance levels relating to safety attributes of fish and fishery products. In many cases, these levels represent the point at or above which the agency will take legal
action to remove products from the market (Fish and Fishery Products Hazards and Controls Guide, USFDA, January 1998).3. Bureau of Food Regulatory, Intemational and Interagency Affairs, Health Protection Branch, Health Canada.4. Specificatons and Standards for Foods, Food Additives, under the Food Sanitation Law, JETRO, 1996.5. Based on EU Directives 91/492/EEC, 91/493/EEC, 96/325/EC, 79/923/EEC and Commission Decision 931351/EEC.6. For crustacea only.7. Methylated mercury.8. Specifies edible portion.9. Fin fish only.10. 0.4 mg r'1 for crabmeat and 0.3 mg r1 for all other fish.11. Crayfish only.12. Includes dieldrin and aldrin.13. Contaminant concentration should be measured per fresh weight of the fish. 114. All fish have a standard of 0.5 mg I except the following which have a 1.0 mg I standards: Sharks (all species), Tuna (Thunnus spp.), Little tuna (Euthynnus spp.), Bonito (Sarda spp.), Plain bonito (Orcynopsis
unicolor), Swordfish (Xiphias gladius), Sailfish (Istiophorus playpterus), Martin (Makaira spp), Eel (Anguilla spp.), Bass (Dicentratchus labrax), Sturgeon (Acipenser spp.), Halibut (Hippoglossus hippoglossus), Redfish(Sebastes marinus, S. mentella), Blue ling (Molva dipterygia), Attantic catfish (Anarhichas lupus), Pike (Esox lucius), Portuguese dogfish (Centroscymnes coelolepis), Rays (Raja spp.), Scabbardfishes (Lepidopuscandatus, Aphanopus carbo), Anglerfish (Lophius spp.) Commission Decision 93/351/EEC.
15. Total mercury.16. For live bivalve mollusks only (Council Directive, 91/492/EEC).17. The standards for these chemicals for live bivalve mollusks have yet to be established, however they have been specified as parameters that will be regulated in live bivalve mollusks based on the permissible daily
intake for each chemical and any deleterious effects on taste (Council Directive 91/492/EEC).18. Countries exporting to the EU must submit a plan to monitor in these chemicals and their metabolites in live aquaculture animals, their excrement, body fluids and all places the animals are bred or kept. Plans to
monitor the aquacufture products must also be submitted (Council Directive 96/325/EC).19. Monitoring requirement referred to in above note 18 specifies that Aorganochlorine compounds (including PCBs)A be monitored.20. Monitoring requirement referred to in above note 18 specified that Achemical elements@ be monitored.21. The EU has not set standards for many contaminants however national laws may apply.22. The standard specifies that the customary biological testing methods must not give a positve result for the presence of DSP in the edible parts of the mollusk.23. A country exporting to the EU must identify production areas from which live bivalve mollusks may be harvested for exportation to the EU. Monitoring of these areas for microbiological and environmental contamination
and the presence of biotoxins is an important consideration in granting approval for a country to export live bivlve mollusks to the EU (Council Directive 91/492/EEC).24. The PCB standard specifices 0.5 mg lr1 for fishes and shelfishes from the ocean and open sea and 3.0 mg r' for fishes and shellfishes from inland seas and bays.25. The mercury standard specifies 0.4 mg I1 for total mercury and 0.3 mg I1 for methyl mercury (as mercury).26. The mercury standard does not apply to tuna fishes (tuna, swordfish, bonito), fishes and shellfishes trom inland rivers and fishes and shelHfishes from the deep sea (rockfishes, Bdryx splendens, gindara, benizuwaigani,
ecchubaigai and sharks).27. One MU (mouse unit) represents the amount of toxin that kills a mouse of 20 g in 15 minutes.28. Applies to hard shell mussels only.29. In fish protein.30. Swordfish and shark are exempted from the mercury guideline.31. For clams, oysters and mussels only.32. Ppb equals parts per billion or micrograms of contaminant per kilogram of fish weight.

Appendix table 7 Import bacteriological standards for fish and shellfish
United States import standard Canadian import standard Japanese import standard European Union import standard
Contaminant Shellfish Fish Shellfish/ Fish Shellfish3 Fisht Shellfish4 Fish4
Bacteria count 50,000, 100,000/1g7 100,000/gt7
E. coli spp. 230/100 40 CFU/g13 40 CFU/g' 3 230/100g18 100 CFU/g 22' 23'26MPN/g 12'31
230MPN/'100g 29,30
Enterotoxigenic E. Coli 1x10³ ETEC/ga32 1x10³ ETEC/g5'32
Coliform group presence of presence oforganism organism' 9
Fecal coliform 330/100 g12,31 330 MPN/1 00g29'30
Staphylococcus spp. 104 MPN/g or 104 MPN/gor 10,000 CFU/g14 10,000 CFU/g14 1,000 CFU/g22' 23' 24
presence of presence oftoxin 8 31 toxin8' 1
Salmonella spp. presence of presence of presence of presence of presence oforganism organism organism 5 organism 5
f organism 21 3
ListeNa spp. presence of presence of 100 CFU/g"6 100 CFU/g' 6
organism5 '8 organism5'Clostridium spp. presence of presence of
organism or organism ortoxin7 toxin7
Vibrio cholerae presence of presence oforganism5
,9 organism5 -
9
Vibrio paraphaemolyticus 104/g5,10 104/9 5,1
Vibrio vulnifficus presence of presence oforganism 5 ' organism5
,11
Thermotolerant bacteria 100 CFU/g22' 23'25
Mesophilic aerobic bacteria 100,000, 500,000,
C F'°°°2,2°3,27CFU/g~2
* Limits are in mg l- unless otherwise noted.1. USFDA and EPA tolerances, action levels, and guidance levels relating to safety atributes of fish and fishery products. In many cases these levels represent the point at or above which the agency will take legalaction to remove products from the market (Fish and Fishery Products Hazards and Controls Guide, USFDA, January 1998).2. Bureau of Food Regulatory, Intemational and Interagency Affairs, Heafth Protection Branch, Health Canada.
(Table continues on next page.)
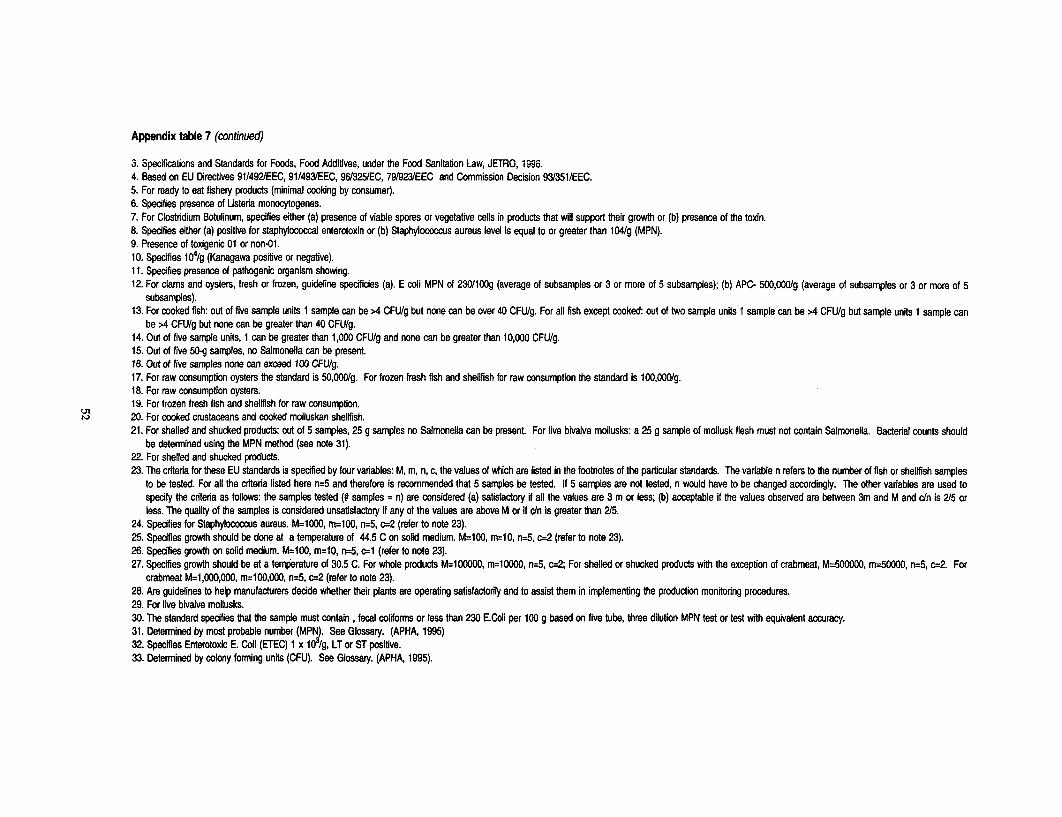
Appendix table 7 (continued)
3. Specifications and Standards for Foods, Food Additives, under the Food Sanitation Law, JETtRO, 1996.4. Based on EU Directives 91/492/EEC, 91/493/EEC, 961325/EC, 79/923/EEC and Commission Decision 93/351/EEC.5. For ready to eat fishery products (minimal cooking by consumer).6. Specifies presence of Usteria monocytogenes.7. For Clostridium Botulinum, specifies either (a) presence of viable spores or vegetative cells in products that will support their growth or (b) presence of the toxin.8. Specifies either (a) positive for staphylococcal enterotoxin or (b) Staphylococcus aureus level is equal to or greater than 104/g (MPN).9. Presence of toxigenic 01 or non-1.10. Specifies 104/g (Kanagawa positive or negative).11. Specifies presence of pathogenic organism showing.12. For clams and oysters, fresh or frozen, guideline specificies (a). E coli MPN of 230/100g (average of subsamples or 3 or more of 5 subsamples); (b) APC- 500,000/g (average of subsamples or 3 or more of 5
subsamples).13. For cooked fish: out of five sample units 1 sample can be >4 CFU/g but none can be over 40 CFU/g. For all fish except cooked: out of two sample units 1 sample can be >4 CFU/g but sample units 1 sample can
be >4 CFU/g but none can be greater than 40 CFU/g.14. Out of five sample units, 1 can be greater than 1,000 CFU/g and none can be greater than 10,000 CFU/g.15. Out of five 50-g samples, no Salmonella can be present.16. Out of five samples none can exceed 100 CFU/g.17. For raw consumption oysters the standard is 50,000/g. For frozen fresh fish and shellfish for raw consumption the standard is 100,000/g.18. For raw consumption oysters.19. For frozen fresh fish and shellfish for raw consumption.20. For cooked crustaceans and cooked molluskan shellfish.21. For shelled and shucked products: out of 5 samples, 25 g samples no Salmonella can be present. For live bivalve mollusks: a 25 g sample of mollusk flesh must not contain Salmonella. Bacteral counts should
be determined using the MPN method (see note 31).22. For shelled and shucked products.23. The criteria for these EU standards is specified by four varables: M, m, n, c, the values of which are listed in the footnotes of the particular standards. The variable n refers to the number of fish or shellfish samples
to be tested. For all the criteria listed here n=5 and therefore is recommended that 5 samples be tested. If 5 samples are not tested, n would have to be changed accordingly. The other variables are used tospecify the criteria as follows: the samples tested (# samples = n) are considered (a) satsfactory if all the values are 3 m or less; (b) acceptable if the values observed are between 3m and M and c/n is 2/5 orless. The quality of the samples is considered unsatisfactory if any of the values are above M or if c/n is greater than 2/5.
24. Specifies for Staphylococcus aureus. M=1000, m=100, n=5, c=2 (refer to note 23).25. Specifies growth should be done at a temperature of 44.5 C on solid medium. M=100, m=10, n=5, c=2 (refer to note 23).26. Specifies growth on solid medium. M=100, m=10, n=5, c=1 (refer to note 23).27. Specifies growth should be at a temperature of 30.5 C. For whole products M=100000, m=10000, n=5, c=2; For shelled or shucked products with the exception of crabmeat, M=500000, m=50000, n=5, c=2. For
crabmeat M=1,000,000, m=100,000, n=5, c=2 (refer to note 23).28. Are guidelines to help manufacturers decide whether their plants are operating satisfactorily and to assist them in implementing the production monitoring procedures.29. For live bivalve mollusks.30. The standard specifies that the sample must contain, fecal coliforms or less than 230 E.Coli per 100 g based on five tube, three dilution MPN test or test with equivalent accuracy.31. Determined by most probable number (MPN). See Glossary. (APHA, 1995)32. Specifies Enterotoxic E. Coli (ETEC) 1 x 10³/g, LT or ST positive.33. Determined by colony forming units (CFU). See Glossary. (APHA, 1995).

Notes
1. Bromage and Shephered 1974; Pillay 1990; EU 7. Romaire 1985 as cited in Lawson 1995, 25.1979. 8. For more information on aeration see Lawson
2. Functionally alkalinity is the amount of a strong (1995).acid necessary to titrate a water to the equivalence point 9. BOD is often measured as the five day BOD (BODsof atmospheric CO2 which occurs at about a pH of 4.5. in mg/i) which is defined as the amount of dissolvedBecause the pH of 4.5 is approximately the limit at oxygen used up by microorganisms in the biochemicalwhich fish and shellfish can survive, alkalinity is a good oxidation of organic matter over a 5 day period at 20°C.measure of the ability of the water to prevent reductions (Metcalf and Eddy, Inc. 1991, 71.) BOD for aquaculturein pH to the level at which the fish undergo extreme operations can also be measured using a shorter perioddisturbance. Adapted from Stumm and Morgan 1981, of time than 5 days and a temperature equivalent to that185. of the pond. The result is expressed as a function of time
3. Alkalinity can be represented as [Alk] = [HCO3-1 + (mg 1-1 hr-1). (Boyd 1981, p130 .) COD which represents2[CO3 2-] + [OH-] - [H+] + Cb - Ca where Cb represents the amount of organic matter that can be chemicallythe total equivalents of bases other than the carbonate oxidized in a given water is also commonly used be-and hydroxide species. This can include species such as cause of the ease of its measurement. BOD can be esti-ammonium, borates, silicates and phosphates. Ca rep- mated from COD in using the following correlationresents the total equivalent concentration of acids other developed for channel catfish ponds: BOD (mg r' hr1) =than the hydrogen ion. Note that because the hydrogen -1.006 -0.00148C - 0.0000125C2 + 0.0766T + 0.000253CT;ion contributes to alkalinity, a change in pH can result C = COD mg/l T = temp (°C). Boyd and others 1978 asin a change in alkalinity. cited in Boyd 1981, 130.
4. Production of an acid by a metabolic process neu- 10. Svobodova and others 1993,9. A maximum CODtralizes some of the bases, reducing the acid neutraliz- concentration of 20-30 mg/1 is also recommended.ing capacity of the water and thus decreasing alkalinity. 11. Ammonia is also a waste product excreted by fishThe production of a base results in an increase in the and shellfish, and hence ammonia will be producedacid neutralizing capacity of the water and thus an during an aquaculture operation.increase in alkalinity. This also applies to H+ and OH-. 12. For more information on these methods, see Met-Because H+ is an acid and OH- is a base, a reduction in calf and Eddy, Inc. 1991.pH(adecreaseinOH andanincreaseinH+)willresult 13. EIFAC 1984, 8; Lawson 1995, 34; Boyd 1990,in a reduction in alkalinity and vise versa. 161.
5. In aquaculture low pH is often a result of sulfuric 14. For more information, see Metcalf and Eddy, Inc.acid formation by the oxidation of sulfide-containing 1991.bottom soils. This occurs most commonly where iron 15. Peavy and others 1985. For detailed design, seepyrite is present (Lawson, 1995, 26). High pH in Metcalf and Eddy, Inc. 1991.aquaculture is commonly a result of excess photoplank- 16. Tucker and Robinson 1990; Swann 1993, 2.ton photosynthesis in waters with high alkalinity and 17. Huguenin and Colt 1989; Svobodova and otherslow calcium hardness. 1993, 24.
6. Boyd 1990, 143; Lawson 1995, 25. 18. Smith and others 1976; Lawson 1995,35.
53

54 Source Water Quality for Aquaculture: A Guide for Assessment
19. Boyd 1990,185-187. For more information on soils 53. Dojlido and Best 1993, 172; Forstner and Wittmanand sediments in aquaculture, see Boyd 1995. 1981.
20. Boyd 1995, 49. Specifies a pH of less than 3.5 in a 54. Phillips 1993,306; Furness and Rainbow 1990,119.1:1 mixture of soil and distilled water. 55. Dojlido and Best 1993, 184.
21. Boyd 1995, 272. Field identification of potential 56. USEPA 1993; EU 1979; Meade 1989.acid sulfate soils can be made by mixing a few grams of 57. Boyd 1990, 387; Boyd 1996; Boyd 1979, 187.fresh soil with a few milliliters of fresh, 10-30% hydro- 58. Dojlido and Best 1993,209; Svobodova and othersgen peroxide. If pyrite is present there will be a rigorous 1993,21.reaction with the production of bubbles. This followed 59. Svobodovf and others 1993, 22; USEPA 1993.by measurement of a pH of less than 3 for the hydrogen 60. Brune and Tomasso 1991, 137; Svobodova 1993,peroxide solution is confirmation of a potential acid- 27-28.sulfate soil. 61. Not all instances of off-flavor are caused by water
22. Boyd 1995,276. quality problems. Off-flavor may also result from post-23. Shazili 1995; Eisler 1971; Sunda 1978. mortem oxidation of fats due to prolonged or improper24. Salomons and F6rstner 1984; Malm and others 1990, storage, or from certain feed ingredients such as those
12. high in marine fish oil. However, if source water has an25. Mance 1987. unusual odor or if the presence of compounds which26. For more information see Cunningham and Tripp might cause off-flavor is suspected, off-flavor should be
1973 or Sayler and others 1975. tested for.27. WHO 1973, cited in Dojlido and Best 1993, 85. 62. For more information on pesticides see Macrae28. UNEP 1985, 13. and others 1993, 3521-41.29. Rosenthal, personal communication. 63. Manahan 1991,522; USGPO 1987.30. UNEP 1985, 10. 64. Rosenthal, personal communication. For more31. Pillay 1992, 102; Phillips 1993, 305. information, contact the International Council for the32. Phillips 1993,304-5; Fumess and Rainbow 1990,150. Exploration of the Sea, which is conducting research on33. Mantoura and others 1978; Dojlido and Best 1993, biologically active complexes.
65-6. 65. Svobodova 1993,28.34. USEPA 1993; Piper and others 1982; Meade 1989. 66. Lloyd 1992, 59. See also MAFF 1989; Svobodova35. Nordstrom 1982, cited in Dojlido and Best 1993, 1993,28; Pillay 1992, 102.
101. 67. Bailey and others 1978, cited in Dojlido and Best36. Hermann 1987, cited in Dojlido and Best 1993,102. 1993,285.37. Phillips 1993,300. 68. USEPA 1993; Svobodova 1993, 29.38. Mance 1987, cited in Dojlido and Best 1993, 177. 69. Lobel and others 1994,3-4. See also, Kleeman and39. Mance 1987, cited in Dojlido and Best 1993, 177. others 1988.40. Nriagu 1980, cited in Dojlido and Best 1993, 201. 70. Phillips 1993,302; Dojlido and Best 1993,287.41. Mance 1987, cited in Dojlido and Best 1993, 202. 71. WHO 1989a, 43; Mara and Cairncross 1989,89,116.42. EIFAC 1984, 15. 72. Pillay 1992, 52; WHO 1989a, 43; Mara and Cairn-43. Mance 1987, cited in Dojlido and Best 1993, 70. cross 1989, 89. For maps of areas of endemism see Mara44. Dojlido and Best 1993, 107; Stumm and Morgan and Cairncross 1989, 85-87. For treatment procedures
1981, 372. see Mara and Cairncross 1989, 112-113.45. Liebman 1958, cited in Dojlido and Best 1993,107. 73. USDHH, USPHS, USFDA 1995, c-9.46. Zabel and others 1988, cited in Dojlido and Best 74. WHO 1989, 44 48; Shereif and Mancy 1995.
1993, 107. 75. Pillay 1992, 71, 105. Other common species in-47. Wilson 1976, cited in Dojlido and Best 1993, 80. clude toxic marine dinoflagellates (Ptychodiscus and48. Piper and others 1982; USEPA 1993. Gonyaulax.), some blue-green algae (Microcystis aerugi-49. Dojlido and Best 1993, 145; Moore and nosa),andthebrackishwaterchrysophyte(Prymnesium
Ramamoorthy 1984. parvum.). Boyd 1990, 163.50. Dojlido and Best 1993, 147; Moore and 76. Other methods employing temperature and
Ramamoorthy 1984. salinity stress and chlorination have not been very suc-51. Dojliclo and Best 1993, 147; Fumess and Rainbow cessful. Ozonation has met with limited success, but
1990, 119. there is controversy over its usefulness. Pillay 1992,52. Phillips 1993,305; WHO 1983,29; Pillay 1992,102. 106.

Bibliography and Related Sources
Acosta, B. O., and R. S. V. Pullin, eds. 1991. "Envi- Aquaculture Society Special Publication 16.ronmental Impact of the Golden Snail (Pomacea Ghent, Belgium.sp.) on Rice Farming Systems in the Philip- Boyd, Claude E. 1974. "LimeRequirementsof Ala-pines." Proceedings of the International Centerfor bama Fish Ponds." Alabama Agricultural Experi-Aquatic Resources Management (ICLARM) Con- ment Station Bulletin no. 459. Birmingham, Ala:ference. Manila, Philippines: ICLARM. Auburn University Press.
Alabaster, J. S., and R. Lloyd. 1982. Water Quality . 1979. Water Quality in Warmwater FishCriteriafor Freshwater Fish. 2d edition. London: Ponds. 1st printing. Birmingham, Ala.: AuburnButterworth Scientific. University Press.
APHA (American Public Health Association). _ . 1981. Water Quality in Warmwater Fish1995. Standard Methodsfor Examination of Water Ponds. 2d printing. Birmingham, Ala.: Auburnand Wastewater. Washington, D.C.: APHA. University Press.
Avault, J. W., De La Bretonne, and J. V. Huner. _ . 1989. Water Quality Management and Aera-1974. "Two Major Problems in Culturing Craw- tion in Shrimp Farming. Fisheries and Alliedfish in Ponds: Oxygen Depletion and Over- Aquacultures Departmental Series no. 2. Bir-crowding." Proceedings of the Second International mingham, Ala.: Auburn University Press.Crayfish Symposium. Louisiana State University, . 1990. Water Quality in Ponds for Aquacul-Division of Continuing Education, Baton ture. Birmingham, Ala.: Auburn UniversityRouge, La. Press.
Bailey, R. A., H. M. Clark, J. P. Ferris, S. Krause, . 1995. Bottom Soils, Sediment, and Pondand R. L. Strong. 1978. Chemistry of the Environ- Aquaculture. New York: Chapman and Hall.ment. New York: Academic Press. .1996. "Chlorination and Water Quality in
Banerjea, S. M., and A. N. Ghosh. 1963. "Soil Nu- Aquaculture Ponds." World Aquaculture. Sep-trients and Plankton Production in Fish Ponds: tember 1996: 41-45.Available Soil Phosphorous." Indian Journal of Boyd, Claude E., R. P. Romaire, and E. Johnston.Fisheries 10: 627-35. 1978. "Predicting Early Morning Dissolved
Banerjea, S. M. 1967. "Water Quality and Soil Con- Oxygen Concentrations in Channel Catfishdition of Fish Ponds in Some States of India in Ponds." Transactions of the American Fisheries So-Relation to Fish Production." Indian Journal of ciety 107: 484-92.Fisheries 14: 113-44. Boyd, Claude E. and W. W. Walley. 1975. "Total
Biggar, J. W., and R. I. Riggs. 1974. Hilgardia 42: Alkalinity and Hardness of Surface Waters in383-91. Alabama and Mississippi." Alabama Agricul-
Black, E. A. 1991. "Coastal Resource Inventories: tural Experiment Station Bulletin no. 465. Bir-A Pacific Coast Strategy for Aquaculture Devel- mingham, Ala.: Auburn University Press.opment." In N. De Pauw and J. Joyce, eds. Briggs, M. R. P., and S. J. Funge-Smith. 1996. "TheAquaculture and the Environment. European Effects of Zeolites and Other Alumino-silicate
55

Bibliography and Related Sources 56
Clays on Water Quality at Various Salinities." Duram Eisler, R. 1971. "Cadmium Poisoning inAquaculture Research 27: 301-11. Fundulus heteroclitus (Pisces: Cyprinodontidae)
Bromage, N., and J. Shephered. 1988. "Fish, Their and Other Marine Organisms." Journal of theRequirements and Site Evaluation." In J. Shep- Fish Research Board of Canada 28: 1225-34.hered, and N. Bromage, eds. Intensive Fish Farm- EIFAC (European Inland Fisheries Advisorying. Oxford: BSP Professional Books. Commission). 1964. Water Quality Criteria for
Brown, E. B., and J. B. Gratzek. 1980. Fish Farming Freshwater Fish: Suspended Solids. Technical pa-Handbook: Food, Bait, Tropical and Goldfish. West-. per 1. Rome: FAO.port, Conn.: AVI Publishing Company. _ . 1986. Water Quality Criteria for Freshwater
Buras, N., L. Duek, and S. Niv. 1985. "Reaction of Fish: Extreme pH Values. Technical paper 4.Risk to Microorganisms in Wastewater." Ap- Rome: FAO.plied Environment Microbiology 50(4): 989-95. . 1968. Water Quality Criteria for Freshwater
Buras, N. 1990. "Bacteriological Guidelines for Fish: Temperature. Technical paper 6. Rome:Sewage-fed Fish Culture." In P. Edward, and R. FAO.S. V. Pullin, eds. "Wastewater-fed Aquacul- _ . 1970. Water Quality Criteria for Freshwaterture." Proceedings of the International Seminar on Fish: Ammonia. Technical paper 11. Rome: FAO.Wastewater Reclamation and Reuse for Aquacul- . 1972. Water Quality Criteria for Freshwaterture, Calcutta, India. Asian Institute of Technol- Fish: Monohydric Phenols. Technical paper 15.ogy, Bangkok, Thailand. Rome: FAO.
Chakroborti, R. K., P. Ravichandran, D. D. Dolder, . 1973a. Water Quality Criteriafor FreshwaterS. K. Mandal, and D. Sanfui. 1985. "Some Fish: Dissolved Oxygen. Technical paper 19.Physio-chemical Characteristics of Kakdwip Rome: FAO.Brackish Water Ponds and Their Influence on _ . 1973b. Water Quality Criteriafor FreshwaterSurvival, Growth, and Production of Penaeus Fish: Chlorine. Technical paper 20. Rome: FAO.monodon (Fabricus)." Indian Journal of Fisheries . 1973c. Water Quality Criteriafor Freshwater32: 224-35. Fish: Zinc. Technical paper 21. Rome: FAO.
Clifford, Henry C. Ell. 1994. "Semi-Intensive Sen- _ . 1976. Water Quality Criteria for Freshwatersation: A Case Study in Marine Shrimp Pond Fish: Copper. Technical paper 27. Rome: FAO.Management." World Aquaculture 25(3): 10. . 1977. Water Quality Criteria for Freshwater
Cunningham, P. A., and M. R. Tripp. 1973. "Accu- Fish: Cadmium. Technical paper 30. Rome: FAO.mulation and Depuration of Mercury in the _ . 1983. Water Quality Criteria for FreshwaterAmerican Oyster Crassotrea Virginica." Marine Fish: Chromium. Technical paper 43. Rome: FAO.Biology 20: 14-19. .1984a. Water Quality Criteriafor Freshwater
Encyclopedia of Food Science, Food Technology, Fish: Nickel. Technical paper 45. Rome: FAO.and Nutrition. "Fish Farming." 1882-87. .1984b. Water Quality Criteriafor Freshwater
De La Bretonne, L., J. W. Avault, and R. 0. Fish: Nitrite. Technical paper 46. Rome: FAO.Smitherman. 1969. "Effects of Soil and Water _ . 1987. Water Quality Criteria for FreshwaterHardness on Survival and Growth of the Red Fish: Rev. 1 Mixtures of Toxicants. TechnicalSwamp Catfish, Procambarus Clarkii, in Plastic paper 37. Rome: FAO.Pools." Proceedings of the Southeastern Association . 1993. Water Quality Criteria for Freshwaterof Game and Fish Commissioners 23: 626-33. Co- Fish: Water Quality and Fish Health. Technicallumbia, S. Carolina. paper 54. Rome: FAO.
Dojlido, J., and G. A. Best. 1993. Chemistry of Water European Union (EU). 1979. Directive on the Qual-and Water Pollution. West Sussex: Ellis Horwood ity of Fresh Water Needing Protection or Improve-Limited. ment in Order to Support Fish Life. 79/659/EEC.
D'Silva, A. M., and 0. E. Maughan. 1995. "Effects Brussels: EU.of Density and Water Quality on Red Tilapia Fitzgerald, W. F., and T. W. Clarkson. 1991. "Mer-(Oreochromis mossambicus X 0. urolepis hor- cury and Monomethyl Mercury: Present andnorum) in Pulsed-Flow Culture Systems." Jour- Future Concerns." Environmental Health Perspec-nal of Applied Aquaculture 5(1): 69-75. tives December 1996: 159-66.
Durum, W. H., and J. Haffty. 1961. "Occurrence of Forstner, U., and G. T. W. Wittman. 1981. MetalMinor Elements in Water." U. S. Geological Sur- Pollution in the Aquatic Environment. Berlin:vey Circular 445. Washington, D.C. Springer-Verlag.

57 A Guide to Assessing Source Water Quality for Aquaculture
Fumess, Robert W., and Philip S. Rainbow. 1990. cide Residues, 1985-1988. Food Surveillance Pa-Heavy Metals in the Marine Environment. Boca per no. 25. London: HMSO.Raton, Florida: CRC Press. Malm, O., W. C. Pfeiffer, C. M. M. Souza, and R.
Ghosh, A., G. N. Chattopadyay, and P. K. Chak- Reuther. 1990. "Mercury Pollution Due to Goldraborti. 1990. "Environmental and Sanitary As- Mining in the Madeira River Basin, Brazil." Am-pects of Wastewater Recycling for Productive bio 19(1): 11-15.Use." In P. Edward, and R. S. V. Pullin, eds. Manahan, S. E. 1991. Environmental Chemistry 5th"Wastewater-fed Aquaculture." Proceedings of ed. Chelsea, Mich.: Lewis Publishers.the International Seminar on Wastewater Reclama- Mance, G. 1987. Pollution Threat of Heavy Metals intion and Reuse for Aquaculture, Calcutta, India. Aquatic Environments. London: Elsevier.Asian Institute of Technology, Bangkok, Thai- Mantoura, R. F. C., A. Dickson, and J. P. Riley.land. 1978. "The Complexation of Metals with Hurnic
Howard, P. H.,ed. 1991. Handbook ofEnvironmental Materials in Natural Waters." Estarine andFate and Exposure Data For Organic Chemicals. Coastal Marine Science 6: 387-408.Vol. 3: Pesticides. Chelsea, Mich.: Lewis Publish- Mara, D., and S. Cairncross. 1989. Guidelinesfor theers Inc. Safe Use of Wastewater and Excreta in Agriculture
Huguenin, J. E., and J. Colt. 1989. Design and Oper- and Aquaculture. Geneva: WHO.ating Guide for Aquaculture Seawater Systems. Maryland, Department of the Environment. 1993.Amsterdam: Elsevier. Code of Maryland Regulations: Water Quality.
Isensee, A. R. 1978. "Bioaccumulation of 2, 3, 7, 26.08.02. Annapolis, Md.8,-tetrachlorodibenzo-para-dioxin." Ecological McEwan, F. L., and G. R. Stephenson. 1979. TheBulletin 27: 255-62. Use and Significance of Pesticides in the Environ-
Japan External Trade Organization JETRO). 1996. ment. New York: Wiley.Specifications and Standards for Foods and Food Mckay, L. R., and B. Gjerde. 1985. "The Effect ofAdditives. New York. Salinity on Growth of Rainbow Trout." Aquacul-
Joseph, M. M., ed. 1990. Aquaculture in Asia. Kar- ture 49: 325-31.nataka, India: Asian Fisheries Society, Indian Meade, J. W. 1989. Aquaculture Management. NewBranch. York: Van Nostrand Reinhold.
Khan, M. A. Q., ed. 1977. Pesticides in the Aquatic Metcalf and Eddy, Inc. 1991. Wastewater Engineer-Environment. New York: Plenum Press. ing: Treatment, Disposal and Reuse 3rd ed. rev. by
Kleeman, J. M., J. R. Olson, and R. E. Peterson. G. Tchobanoglous and F. L. Burton. New York:1988. "Species Differences in 2,3,7,8-tetrachlo- McGraw-Hill.rodibenzo-p-dioxin toxicity and Biotransforma- Milne, P.H. 1972. Fish and Shellfish Farming intion in Fish." Fundamental and Applied Toxicology Coastal Waters. West Byfleet: Fishing News10: 206-13. Books.
Lawson, T. B. 1995. Fundamentals of Aquacultural Moore, J., and S. Ramamoorthy. 1984. Heavy Met-Engineering. New York: Chapman and Hall. als in Natural Waters. Berlin: Springer-Verlag.
Lloyd, R. 1992. Pollution and Freshwater Fish. West Murphy, T. J., M. D. Mullin, J. A. Meyer. 1987.Byfleet: Fishing News Books. "Equilibration of Polychlorinated Biphenyls
Lobel, P. S., D. A. Mann, and G. Sancho. 1994. and Toxaphene with Air and Water." Environ-Pollution and Coastal Fisheries: How Much Do We mental Science and Technology 21: 155-62.Know? Washington, D.C.: Center for Interna- Musselwhite, C. 1982. "Survey of Arsenic Concen-tional and Strategic Studies. trations in Rivers and Coastal Waters of the
Maceina, M. J., and J. V. Shineman. 1979. "Grass U.K." WRC 199-s. DOE Contract Report. WaterCarp: Effect of Salinity on Survival, Weight Loss Research Center, Medmeham, Berkshire.and Muscle Tissue Water Content." Progressive Nauen, C. C. 1983. "Compilation of Legal LimitsFish Culturist 41: 69-73. for Hazardous Substances in Fish and Fisheries
Macrae, R., R. K. Robinson, and M. J. Sadler. 1993. Products." FAO Fish. Circ. 764:102. Rome: FAO.Encyclopedia of Food Science Food Technology, and Palmer, S. J., and B. J. Presely. 1993. "MercuryNutrition. London: Academic Press. Bioaccumulation by Shrimp Transplanted to
MAFF (Ministry of Agriculture, Fisheries, and Lavaca Bay, Texas." Marine Pollution Bulletin 26:Food). 1989. Report of the Working Party on Pesti- 10.
Bibliography and Related Sources 58
Pastor, A., F. Hemandez, M. A. Peris, J. Beltran, V. Huner and E. E. Brown, eds. Westport: AVIS. Sancho, and M. T. Castillo. 1994. "Levels of Publishing.Heavy Metals in Some Marine Organisms from Salomons, W., and U. Forstner. 1984. Metals in thethe Western Mediterranean Area (Spain)." Ma- Hydrocycle. Berlin: Springer-Verlag.rine Pollution Bulletin 28(1): 50-53. Sawyer, C. N., and P. L. McCarty. 1978. Chemistry
Peavy, H. S., D. R. Rowe, and G. Tchobanoglous. for Environmental Engineers. New York: McGraw1985. Environmental Engineering. New York: Hill.McGraw-Hill. Sayler, G. S., J. D. Nelson, Jr., and R. R. CoUwell.
Perry, W. G., and J. W. Avault. 1970. "Culture of 1975. "Role of Bacteria in Bioaccumulation ofBlue, Channel, and White Catfish in Brackish Mercury in the Oyster Crassostrea virginica." Ap-Water Ponds." Proceedings of the Southeastern plied Microbiology 30: 91-96.Association of Game and Fish Commissioners 23: Schmidt, U., and E. Huber. 1976. "Methylation of592-7. Columbia, S. Carolina. Organo Lead and Lead (II) Compounds to
Petit, J. 1990. "Water Supply, Treatment, and Re- (CH3)4 Pb by Microorganisms." Nature 259:157-cycling in Aquaculture." In G. Bamabe, ed. 8. London, U.K.Aquaculture. Vol. 1. New York: Ellis Horwood. Shazili, N. A. M. 1995. "Effects of Salinity and
Phillips, J. H. 1993. "Developing-Country Pre-Exposure on Acute Toxicity to Seabass,Aquaculture, Trace Chemical Contaminants, Lates calcarifer." Bulletin of Environmental Con-and Public Health Concerns." In P. Edward and tamination and Toxicology 54: 22-28.R. S. V. Pullin, eds. "Wastewater-fed Aquacul- Shereif, M. M., and K. H. Mancy. 1995. "Organo-ture." Proceedings of the International Seminar on chlorine Pesticides and Heavy Metals in FishWastewater Reclamation and Reuse for Aquacul- Reared in Treated Sewage Effluents and Fishture, Calcutta, India. Asian Institute of Technol- Grown in Farms Using Polluted Surface Watersogy, Bangkok, Thailand. in Egypt." Water Science and Technology 32(11):
Pillay, T. V. R. 1990. Aquaculture Principles and 153-61.Practices. West Byfleet: Fishing News Books. Stickney, R. R. 1986. "Tilapia Tolerance of Saline
. 1992. Aquaculture and the Environment. Waters: A Review." Progressive Fish Culturist 48:New York: Halsted Press. 161-7.
Piper, R. G., I. B. McElwain, L. E. Orme, J. P. Stumm, W., and J. J. Morgan. 1981. Aquatic Chem-McCraren, L. G. Fowler, andJ. R. Leonard. 1982. istry: An Introduction Emphasizing ChemicalFish Hatchery Management. Washington, D.C.: Equilibria in Natural Waters. 2d edition. NewU.S. Fish and Wildlife Service. York: John Wiley and Sons.
Pullin, R.S.V., H. Rosenthal, andJ. L. Maclean, eds. Sunda, W. G., D. W. Engel, and R. M. Thuotte.1993. Environment and Aquaculture in Developing 1978. "Effect of Chemical Speciation on ToxicityCountries. Manila, Philippines: International of Cadmium to Grass Shrimp, PalaemonetesCenter for Living Aquatic Resources Manage- pugio: Importance of Free Cadmium Ion." Envi-ment (ICLARM). ronmental Science and Technology 12(4): 409-13.
Reish, D. J., T. J. Kauwling, A. J. Mearns, P. S. Suntio, L. R., Shiu, W. Y., Mackay, D., Seiber J. N.,Oshida, S. S. Rossi, F. G. Wilkes, and M. J. Ray. and Glotfelty, D. 1988. "Critical Review of1978. "Water Pollution: Marine and Estuarine Henry's Law Constants for Pesticides." ReviewsPollution." Journal of the Water Pollution Control of Environmental Contamination and ToxicologyFederation 50: 1424-69. 108: 1-59.
Rice, M. A. 1992. "Bivalve Aquaculture in Warm Svobodova, Z., R. L., J. Machova, and B.Tropical and Subtropical Waters with Reference Vykusova. 1993. Water Quality and Fish Health.to Salinity and Water Quality, Monitoring, and EIFAC technical paper no. 54. Rome: FAO.Post-harvest Disinfection." Tropical Science 32 Swann, L. 1993. "Water Quality Water Sources(2): 179-102. Used in Aquaculture." Water Quality Fact Sheet
Roberts, R. J., and C. J. Shepherd. 1974. Handbook AS-486. Aquaculture Extension. Illinois-Indianaof Trout and Salmon Diseases. West Byfleet: Fish- Sea Grant Program. Purdue University, Westing News Books. Lafayette, Ind.
Romaire, R. P. 1985. Water Quality, Crustacean and Tansakul, R. 1983. "Progress in Thailand RearingMollusk Aquaculture in the United States. In J. V. Larvae of the Giant Prawn, Macrobrachium

59 A Guide to Assessing Source Water Quality for Aquaculture
rosenbergii DeMan, inSalted Water." Aquaculture _ . 1993. Code of Federal Regulations. Part 131:31: 95-98. Water quality standards. Protection of environment.
Tarazona, J. V., and M. J. Munoz. 1995. "Water Parts 100-49. Washington, D.C.: U.S. Govern-Quality in Salmonid Culture." Reviews in Fisher- ment Printing Office.ies Science 3(2): 109-39. U.S. Food and Drug Administration (USFDA).
Tucker, Craig S., and E. H. Robinson. 1990. Channel 1996. Fish and Fisheries Products Hazards and Con-Catfish Farming Handbook. New York: Van Nos- trols Guide. Center for Food Safety and Appliedtrand Reinhold. Nutrition. Washington, D.C.
Tucker, C. S., and J. F. Martin. 1991. "Environ- WHO (World Health Organization). 1973. Thement-related Off-flavor in Fish." In D. E. Brune Hazard to Health and Ecological Effects of Persistentand J. R. Tomasso, eds. Aquaculture and Water Substances in the Environment. ICP/CEP 101(3)1.Quality: Advances in World Aquaculture vol. 3. Geneva.Baton Rouge, La.: The World Aqua-culture So- _ . 1982. Evaluation of Certain Food Additivesciety. and Contaminants: Twenty-sixth Report of the Joint
UNEP (United Nations Environment Pro- FAO/WHO Committee on Food Additives. Techni-gramme). 1985. GESAMP: Cadmium, Lead, and cal report series no. 683, Geneva.Tin in the Marine Environment. UNEP Regional _ . 1983. Evaluation of Certain Food AdditivesSeas Reports and Studies no. 56. GESAMP Re- and Contaminants: Twenty-seventh Report of theports and Studies no. 22. Rome: FAO. Joint FAO/WHO Committee on Food Additives.
United Nations Food and Agriculture Organiza- Technical report series no. 696, Geneva.tion (FAO). 1994. Major Trends in Global Aquacul- _ . 1989a. Health Guidelinesfor the Use of Waste-ture Production in 1994. FAO Fisheries water in Agriculture and Aquaculture. TechnicalDepartment. Rome. report series no. 778. Geneva.
_____ .1976. Principlesfor Developing Coastal Water _ . 1989b. Evaluation of Certain Food AdditivesQuality Criteria. GESAMP Reports and Studies and Contaminants: Thirty-third Report of the Jointno. 5. Rome. FAO/WHO Committee on Food Additives. Techni-
U.S. Department of Health and Human Services cal report series no. 776. Geneva.(USDHH), U.S. Public Health Service (USPHS) . 1990. Evaluation of Certain Food Additivesand U.S. Food and Drug Administration (US- and Contaminants: Thirty-fifth Report of the JointFDA). 1995. National Shellfish Sanitation Program FAO/WHO Expert Committee on Food Additives.Manual of Operations. Part I: Sanitation of Shellfish Technical report series no. 789. Geneva.Growing Areas. Washington, D.C.: USDHH/ . 1993. Evaluation of Certain Food AdditivesUSPHS/USFDA. and Contaminants: Forty-first Report of the Joint
USEPA (U.S. Environmental Protection Agency). FAO/WHO Committee on Food Additives. Techni-1986. Quality Criteria for Water. EPA 440/5-86- cal report series no. 683, Geneva.001. Washington, D.C. Worthing, C. R. 1987. The Pesticide Manual. 8th
_____ .1992. National Study of Chemical Residues in edition. Farnham, Surrey, U.K.: British CropFish. EPA 823-R-92-008. Washington, D.C. Protection Council.

Species Index
Aeromonas, 40 Fasciolopsis buski, 40Arthropods, 25 Freshwater crayfish, 13Atlantic salmon, 8 Freshwater crustaceans, 13
Freshwater prawn, 8, 10Bass, 8, 24, 60Brackishwater prawn, 10 Grass carp, 10, 58Brine shrimp, 8 Guppy, 39Brook trout, 8 Hatchling silver carp, 13Brown shrimp, 8
Japanese eel, 8C. commercialis, 26Carp, 14, 20 Klebsiellae, 40Catfish, 41, 56, 57, 61Channel catfish, 8, 10, 13, 14, 16, 20 M. rosenbergii, 10Chanos chanos, 18 Marine fish, 10, 14, 18Chinook salmon, 8 mollusks, 25, 26, 27, 28, 30, 31Clams, 26, 31, 41 Mullet, 8Clonorchis sinensis, 40 mussels, 27, 28, 39, 42Clostridium botulinum, 40 Mytilus edulis, 28Cockles, 26Coho salmon, 8, 39 Ostrea edulis, 32Cold water fish, 14 Oyster, 24, 26, 27, 30, 32, 38, 41, 42, 57, 60Common carp, 8Crab, 26 P. monodon, 18, 19, 22Crassostrea gigas, 26 P. vannamei, 8, 10, 14, 18, 19, 20Cyclops abyssorym, 24 Pacific Oyster, 26Cyprinid, 15, 20, 27, 30 Penaeid shrimp, 14, 18
Penaeus japonicus, 26E. coli, 40 Penaeus monodon, 21, 57Eel, 14 Pike, 24, 39Escherichiae, 40 Pink Shrimp, 8European eel, 8 Plaice, 8
61
62 Source Water Quality for Aquaculture: A Guide for Assessment
Pseudomnonas, 40 Sockeye salmon, 8Pyrodinium bahamense var. compressa, 42 Sole, 8
Streptococcus, 40Quahog, 42 Striped bass, 8
Swordfish, 24Rainbow trout, 8, 29, 30, 39, 59Red hybrid tilapia, 10 Tilapia, 8, 10, 14, 24, 57, 60Red swamp crawfish, 8, 14 Trout, 10, 13, 14, 16, 20, 60
Tuna, 24Salmonella, 40 Turbot, 8Salmonid, 8, 11, 12, 14, 18, 19, 27, 28, 29, 30,
32, 60 Walleye, 24Schistosoma japonicum, 40 Warm water crustaceans, 14Shark, 24 Warm water fish, 14


THE WORLD BANK
1 8 11I Sti-c.t .WV.
NVashimiton, 1).( . 20433 USA
'I'elephlotnC: 20J2-4-77-1234
IFacsimile: 202-477-6391
TIelex: NMC(I1 64145 WMLIA) NIN
M1CI 248423 XV()RI .L)lANIk
I-n-mail: hooks@ Cvorldhank.orlg
ENVIRONMENTALLY AND SOCIALLYSUSTAINABLE DEVELOPMENT
RSBN O-8 4 3D -/9/
ISBN 0-8213-4319-X