pet/ct atlas on quality control and image artefacts
TRANSCRIPT

INTERNATIONAL ATOMIC ENERGY AGENCYVIENNA
ISBN 978–92–0–101014–8ISSN 2075–3772
PE
T/C
T A
tlas on Q
uality Co
ntrol and
Imag
e Artefacts
This publication is an atlas on quality control and PET/CT artefacts, providing guidance on the physics and technical aspects behind PET and PET/CT image distortions. It presents an assortment of cases with examples of possible image distortions and errors, with explanations as to the causes of and solutions to each individual image problem. This publication will be especially useful to medical physicists, physicians, technologists and service engineers in the clinical fi eld.
No. 27
IAEA HUMAN HEALTH SERIES No. 27
PET/CT Atlas on Quality Control and Image Artefacts
PE
T/C
T A
tlas on Q
uality Co
ntrol and
Imag
e Artefacts
IAEA HUMAN HEALTH SERIES IAEA HUMAN HEALTH SERIES

IAEA HUMAN HEALTH SERIES PUBLICATIONS
The mandate of the IAEA human health programme originates from Article II of its Statute, which states that the “Agency shall seek to accelerate and enlarge the contribution of atomic energy to peace, health and prosperity throughout the world”. The main objective of the human health programme is to enhance the capabilities of IAEA Member States in addressing issues related to the prevention, diagnosis and treatment of health problems through the development and application of nuclear techniques, within a framework of quality assurance.
Publications in the IAEA Human Health Series provide information in the areas of: radiation medicine, including diagnostic radiology, diagnostic and therapeutic nuclear medicine, and radiation therapy; dosimetry and medical radiation physics; and stable isotope techniques and other nuclear applications in nutrition. The publications have a broad readership and are aimed at medical practitioners, researchers and other professionals. International experts assist the IAEA Secretariat in drafting and reviewing these publications. Some of the publications in this series may also be endorsed or co-sponsored by international organizations and professional societies active in the relevant fields. There are two categories of publications in this series:
IAEA HUMAN HEALTH SERIESPublications in this category present analyses or provide information of an
advisory nature, for example guidelines, codes and standards of practice, and quality assurance manuals. Monographs and high level educational material, such as graduate texts, are also published in this series.
IAEA HUMAN HEALTH REPORTSHuman Health Reports complement information published in the IAEA Human
Health Series in areas of radiation medicine, dosimetry and medical radiation physics, and nutrition. These publications include reports of technical meetings, the results of IAEA coordinated research projects, interim reports on IAEA projects, and educational material compiled for IAEA training courses dealing with human health related subjects. In some cases, these reports may provide supporting material relating to publications issued in the IAEA Human Health Series.
All of these publications can be downloaded cost free from the IAEA web site:http://www.iaea.org/Publications/index.html
Further information is available from:Marketing and Sales UnitInternational Atomic Energy AgencyVienna International CentrePO Box 1001400 Vienna, Austria
Readers are invited to provide their impressions on these publications. Information may be provided via the IAEA web site, by mail at the address given above, or by email to:
RELATED PUBLICATIONS
www.iaea.org/books
QUALITY ASSURANCE FOR PET AND PET/CT SYSTEMS IAEA Human Health Series No. 1STI/PUB/1393 (145 pp.; 2009)ISBN 978–92–0–103609–4 Price: €32.00
IAEA QUALITY CONTROL ATLAS FOR SCINTILLATION CAMERA SYSTEMSSTI/PUB/1141 (293 pp.; 2003)ISBN 92–0–101303–5 Price: €99.00
RADIATION PROTECTION IN NEWER MEDICAL IMAGING TECHNIQUES: PET/CT Safety Reports Series No. 58STI/PUB/1343 (41 pp.; 2008)ISBN 978–92–0–106808–8 Price: €28.00
PLANNING A CLINICAL PET CENTREIAEA Human Health Series No. 11STI/PUB/1457 (146 pp.; 2010)ISBN 978–92–0–104610–9 Price: €42.00
QUANTITATIVE NUCLEAR MEDICINE IMAGING: CONCEPTS, REQUIREMENTS AND METHODSIAEA Human Health Reports No. 9STI/PUB/1605 (59 pp.; 2014)ISBN 978–92–0–141510–3 Price: €33.00
NUCLEAR MEDICINE PHYSICS: A HANDBOOK FOR TEACHERS AND STUDENTSSTI/PUB/1617 (forthcoming)ISBN 978–92–0–143810–2

PET/CT ATLAS ON QUALITY CONTROL
AND IMAGE ARTEFACTS

AFGHANISTANALBANIAALGERIAANGOLAARGENTINAARMENIAAUSTRALIAAUSTRIAAZERBAIJANBAHAMASBAHRAINBANGLADESHBELARUSBELGIUMBELIZEBENINBOLIVIABOSNIA AND HERZEGOVINABOTSWANABRAZILBRUNEI DARUSSALAMBULGARIABURKINA FASOBURUNDICAMBODIACAMEROONCANADACENTRAL AFRICAN
REPUBLICCHADCHILECHINACOLOMBIACONGOCOSTA RICACÔTE D’IVOIRECROATIACUBACYPRUSCZECH REPUBLICDEMOCRATIC REPUBLIC
OF THE CONGODENMARKDOMINICADOMINICAN REPUBLICECUADOREGYPTEL SALVADORERITREAESTONIAETHIOPIAFIJIFINLANDFRANCEGABONGEORGIAGERMANY
GHANAGREECEGUATEMALAHAITIHOLY SEEHONDURASHUNGARYICELANDINDIAINDONESIAIRAN, ISLAMIC REPUBLIC OF IRAQIRELANDISRAELITALYJAMAICAJAPANJORDANKAZAKHSTANKENYAKOREA, REPUBLIC OFKUWAITKYRGYZSTANLAO PEOPLE’S DEMOCRATIC
REPUBLICLATVIALEBANONLESOTHOLIBERIALIBYALIECHTENSTEINLITHUANIALUXEMBOURGMADAGASCARMALAWIMALAYSIAMALIMALTAMARSHALL ISLANDSMAURITANIAMAURITIUSMEXICOMONACOMONGOLIAMONTENEGROMOROCCOMOZAMBIQUEMYANMARNAMIBIANEPALNETHERLANDSNEW ZEALANDNICARAGUANIGERNIGERIANORWAYOMAN
PAKISTANPALAUPANAMAPAPUA NEW GUINEAPARAGUAYPERUPHILIPPINESPOLANDPORTUGALQATARREPUBLIC OF MOLDOVAROMANIARUSSIAN FEDERATIONRWANDASAN MARINOSAUDI ARABIASENEGALSERBIASEYCHELLESSIERRA LEONESINGAPORESLOVAKIASLOVENIASOUTH AFRICASPAINSRI LANKASUDANSWAZILANDSWEDENSWITZERLANDSYRIAN ARAB REPUBLICTAJIKISTANTHAILANDTHE FORMER YUGOSLAV
REPUBLIC OF MACEDONIATOGOTRINIDAD AND TOBAGOTUNISIATURKEYUGANDAUKRAINEUNITED ARAB EMIRATESUNITED KINGDOM OF
GREAT BRITAIN AND NORTHERN IRELAND
UNITED REPUBLICOF TANZANIA
UNITED STATES OF AMERICAURUGUAYUZBEKISTANVENEZUELAVIET NAMYEMENZAMBIAZIMBABWE
The following States are Members of the International Atomic Energy Agency:
The Agency’s Statute was approved on 23 October 1956 by the Conference on the Statute of the IAEA held at United Nations Headquarters, New York; it entered into force on 29 July 1957. The Headquarters of the Agency are situated in Vienna. Its principal objective is “to accelerate and enlarge the contribution of atomic energy to peace, health and prosperity throughout the world’’.

IAEA HUMAN HEALTH SERIES No. 27
PET/CT ATLAS ON QUALITY CONTROL
AND IMAGE ARTEFACTS
INTERNATIONAL ATOMIC ENERGY AGENCYVIENNA, 2014
COPYRIGHT NOTICE
All IAEA scientific and technical publications are protected by the terms of the Universal Copyright Convention as adopted in 1952 (Berne) and as revised in 1972 (Paris). The copyright has since been extended by the World Intellectual Property Organization (Geneva) to include electronic and virtual intellectual property. Permission to use whole or parts of texts contained in IAEA publications in printed or electronic form must be obtained and is usually subject to royalty agreements. Proposals for non-commercial reproductions and translations are welcomed and considered on a case-by-case basis. Enquiries should be addressed to the IAEA Publishing Section at:
Marketing and Sales Unit, Publishing SectionInternational Atomic Energy AgencyVienna International CentrePO Box 1001400 Vienna, Austriafax: +43 1 2600 29302tel.: +43 1 2600 22417email: [email protected] http://www.iaea.org/books
© IAEA, 2014
Printed by the IAEA in AustriaMay 2014
STI/PUB/1642
IAEA Library Cataloguing in Publication Data
PET/CT atlas on quality control and image artefacts. — Vienna : International Atomic Energy Agency, 2014.
p. ; 30 cm. — (IAEA human health series, ISSN 2075–3772 ; no. 27)STI/PUB/1642ISBN 978–92–0–101014–8Includes bibliographical references.
1. Tomography, Emission — Quality control. 2. Tomography — Atlases. 3. Tomography, Emission — Atlases. I. International Atomic Energy Agency. II. Series.
IAEAL 14–00896

FOREWORD
Combined positron emission tomography (PET)/computed tomography (CT) imaging has become a routine procedure in diagnostic radiology and nuclear medicine. The clinical review of both PET and PET/CT images requires a thorough understanding of the basics of image formation as well as an appreciation of variations of inter-patient and intra-patient image appearance. Such variations may be caused by variations in tracer accumulation and metabolism, and, perhaps more importantly, by image artefacts related to methodological pitfalls of the two modalities.
This atlas on quality control (QC) and PET/CT artefacts provides guidance on typical image distortions in clinical PET/CT usage scenarios. A number of cases are presented to provide nuclear medicine and radiology professionals with an assortment of examples of possible image distortions and errors in order to support the correct interpretation of images. About 70 typical PET and PET/CT cases, comprised of image sets and cases, have been collected in this book, and all have been catalogued and have explanations as to the causes of and solutions to each individual image problem. This atlas is intended to be used as a guide on how to take proper QC measures, on performing situation and problem analysis, and on problem prevention.
This book will be especially useful to medical physicists, physicians, technologists and service engineers in the clinical field.
The IAEA wishes to express its thanks to the main contributors to this publication: T. Beyer (Switzerland), S. Holm (Denmark), O. Mawlawi (United States of America) and C.C. Robilotta (Brazil). The IAEA officers responsible for this publication were H. Delis, S. Palm and G.L. Poli of the Division of Human Health.

EDITORIAL NOTE
Although great care has been taken to maintain the accuracy of information contained in this publication, neither the IAEA nor its Member States assume any responsibility for consequences which may arise from its use.
The use of particular designations of countries or territories does not imply any judgement by the publisher, the IAEA, as to the legal status of such countries or territories, of their authorities and institutions or of the delimitation of their boundaries.
The mention of names of specific companies or products (whether or not indicated as registered) does not imply any intention to infringe proprietary rights, nor should it be construed as an endorsement or recommendation on the part of the IAEA.
The IAEA has no responsibility for the persistence or accuracy of URLs for external or third party Internet web sites referred to in this book and does not guarantee that any content on such web sites is, or will remain, accurate or appropriate.

PREFACE
Positron emission tomography (PET) was introduced as a research imaging modality in the early 1970s. Since then, PET has evolved into a routine clinical imaging modality for the non-invasive assessment of metabolic and functional processes. PET has the advantage of being a very sensitive imaging modality at the expense of providing quantitative information with little anatomical background information. This aspect has been rectified in part by combining PET tomographs with computed tomography (CT) systems into a single gantry-based PET/CT imaging device. PET/CT systems became commercially available in 2001. Since then, over 5000 systems have been installed worldwide, with the number growing continuously and with most clinical PET-only systems being replaced gradually by PET/CT.
The complexity of a combined PET/CT system needs to be balanced with rigorous quality control (QC) procedures. Likewise, the new information provided by combined PET/CT examinations must be complemented with a thorough understanding of potential pitfalls and artefacts arising from the combined imaging procedure. PET/CT, as any other imaging modality, is acceptable for routine clinical and research applications only if technical pitfalls can be avoided prospectively; if artefacts from incorrect or suboptimal acquisition procedures can be recognized and, if possible, corrected retrospectively; and if the resulting image information can be interpreted correctly, which entails an appreciation of variants of the represented image information.
This atlas aims to provide PET/CT users with a brief overview of the required QC procedures for the operation of a PET/CT system in routine clinical practice. Users are invited to study additional references provided in the bibliography of Section 1. In addition, the atlas provides a general introduction to the fundamental aspects and limitations of PET and CT imaging, which users of PET/CT should be aware of. Following this basic overview, the reader is presented with a series of artefacts stemming from hardware malfunctions in order to provide guidance on the most common pitfalls from system operation. The larger portion of this atlas is dedicated to image artefacts from PET/CT imaging acquisition protocols in order to facilitate a deeper understanding of the sources of image artefacts and potential solutions.
There is no guarantee that all artefacts discussed in this book can be avoided at every site. However, an appreciation for the source of these artefacts will help support improved PET/CT operations along with the high quality standards required for an increased acceptance of this modality.


CONTENTS
1. DAILY QUALITY CONTROL AND QUALITY ASSURANCE . . . . . . . . . . . . . . . . . . . . . . . . . . . . . . 1
1.1. Clinical PET/CT platforms . . . . . . . . . . . . . . . . . . . . . . . . . . . . . . . . . . . . . . . . . . . . . . . . . . . . . . . 11.1.1. General Electric . . . . . . . . . . . . . . . . . . . . . . . . . . . . . . . . . . . . . . . . . . . . . . . . . . . . . . . . 11.1.2. Philips . . . . . . . . . . . . . . . . . . . . . . . . . . . . . . . . . . . . . . . . . . . . . . . . . . . . . . . . . . . . . . . . 31.1.3. Siemens . . . . . . . . . . . . . . . . . . . . . . . . . . . . . . . . . . . . . . . . . . . . . . . . . . . . . . . . . . . . . . . 5
2. PET AND PET/CT PHYSICS . . . . . . . . . . . . . . . . . . . . . . . . . . . . . . . . . . . . . . . . . . . . . . . . . . . . . . . . . . 10
2.1. Acquisition . . . . . . . . . . . . . . . . . . . . . . . . . . . . . . . . . . . . . . . . . . . . . . . . . . . . . . . . . . . . . . . . . . . 122.1.1. Positron range . . . . . . . . . . . . . . . . . . . . . . . . . . . . . . . . . . . . . . . . . . . . . . . . . . . . . . . . . . 122.1.2. Depth of interaction . . . . . . . . . . . . . . . . . . . . . . . . . . . . . . . . . . . . . . . . . . . . . . . . . . . . . . 132.1.3. 2-D and 3-D PET . . . . . . . . . . . . . . . . . . . . . . . . . . . . . . . . . . . . . . . . . . . . . . . . . . . . . . . . 152.1.4. Emission scan duration . . . . . . . . . . . . . . . . . . . . . . . . . . . . . . . . . . . . . . . . . . . . . . . . . . . 162.1.5. Noise in PET images . . . . . . . . . . . . . . . . . . . . . . . . . . . . . . . . . . . . . . . . . . . . . . . . . . . . . 172.1.6. Effects of varying emission/transmission duration . . . . . . . . . . . . . . . . . . . . . . . . . . . . . . 192.1.7. Time of flight PET . . . . . . . . . . . . . . . . . . . . . . . . . . . . . . . . . . . . . . . . . . . . . . . . . . . . . . . 21
2.2. Reconstruction . . . . . . . . . . . . . . . . . . . . . . . . . . . . . . . . . . . . . . . . . . . . . . . . . . . . . . . . . . . . . . . . . 222.2.1. Post-reconstruction filter . . . . . . . . . . . . . . . . . . . . . . . . . . . . . . . . . . . . . . . . . . . . . . . . . . 222.2.2. Iterative reconstruction parameters . . . . . . . . . . . . . . . . . . . . . . . . . . . . . . . . . . . . . . . . . . 232.2.3. Image matrix size . . . . . . . . . . . . . . . . . . . . . . . . . . . . . . . . . . . . . . . . . . . . . . . . . . . . . . . 242.2.4. Point spread function and PET image reconstruction . . . . . . . . . . . . . . . . . . . . . . . . . . . 252.2.5. Partial volume effects . . . . . . . . . . . . . . . . . . . . . . . . . . . . . . . . . . . . . . . . . . . . . . . . . . . . 26
3. INSTRUMENTATION PHYSICS . . . . . . . . . . . . . . . . . . . . . . . . . . . . . . . . . . . . . . . . . . . . . . . . . . . . . . 28
3.1. Detector blocks and boards . . . . . . . . . . . . . . . . . . . . . . . . . . . . . . . . . . . . . . . . . . . . . . . . . . . . . . . 283.1.1. PET detector failure . . . . . . . . . . . . . . . . . . . . . . . . . . . . . . . . . . . . . . . . . . . . . . . . . . . . . . 283.1.2. Controller board failure . . . . . . . . . . . . . . . . . . . . . . . . . . . . . . . . . . . . . . . . . . . . . . . . . . . 303.1.3. Memory board failure . . . . . . . . . . . . . . . . . . . . . . . . . . . . . . . . . . . . . . . . . . . . . . . . . . . . 313.1.4. Faulty timing calibration . . . . . . . . . . . . . . . . . . . . . . . . . . . . . . . . . . . . . . . . . . . . . . . . . . 313.1.5. Master control and timing, and correction and rebinning board failure . . . . . . . . . . . . . . 343.1.6. Signal processing failure . . . . . . . . . . . . . . . . . . . . . . . . . . . . . . . . . . . . . . . . . . . . . . . . . . 343.1.7. Data resorting failure . . . . . . . . . . . . . . . . . . . . . . . . . . . . . . . . . . . . . . . . . . . . . . . . . . . . . 35
3.2. Normalization . . . . . . . . . . . . . . . . . . . . . . . . . . . . . . . . . . . . . . . . . . . . . . . . . . . . . . . . . . . . . . . . . 363.2.1. Normalization . . . . . . . . . . . . . . . . . . . . . . . . . . . . . . . . . . . . . . . . . . . . . . . . . . . . . . . . . . 363.2.2. Faulty normalization . . . . . . . . . . . . . . . . . . . . . . . . . . . . . . . . . . . . . . . . . . . . . . . . . . . . . 383.2.3. Slice to slice sensitivity . . . . . . . . . . . . . . . . . . . . . . . . . . . . . . . . . . . . . . . . . . . . . . . . . . 39
3.3. Attenuation and scatter correction . . . . . . . . . . . . . . . . . . . . . . . . . . . . . . . . . . . . . . . . . . . . . . . . . . 413.3.1. Effects of attenuation correction . . . . . . . . . . . . . . . . . . . . . . . . . . . . . . . . . . . . . . . . . . . . 413.3.2. Scatter correction artefacts: Example 1 . . . . . . . . . . . . . . . . . . . . . . . . . . . . . . . . . . . . . . . 413.3.3. Scatter correction artefacts: Example 2 . . . . . . . . . . . . . . . . . . . . . . . . . . . . . . . . . . . . . . . 433.3.4. Scatter correction artefacts: Example 3 . . . . . . . . . . . . . . . . . . . . . . . . . . . . . . . . . . . . . . . 44
3.4. Intravenous contrast . . . . . . . . . . . . . . . . . . . . . . . . . . . . . . . . . . . . . . . . . . . . . . . . . . . . . . . . . . . . 453.4.1. Focal intravenous contrast accumulation: Example 1 . . . . . . . . . . . . . . . . . . . . . . . . . . . . 453.4.2. Focal intravenous contrast accumulation: Example 2 . . . . . . . . . . . . . . . . . . . . . . . . . . . 47
3.5. Oral contrast artefacts . . . . . . . . . . . . . . . . . . . . . . . . . . . . . . . . . . . . . . . . . . . . . . . . . . . . . . . . . . . 483.5.1. Positive oral contrast artefacts: Example 1 . . . . . . . . . . . . . . . . . . . . . . . . . . . . . . . . . . . 483.5.2. Oral contrast artefacts: Example 2 . . . . . . . . . . . . . . . . . . . . . . . . . . . . . . . . . . . . . . . . . . 49

3.6. Metal artefacts . . . . . . . . . . . . . . . . . . . . . . . . . . . . . . . . . . . . . . . . . . . . . . . . . . . . . . . . . . . . . . . . 503.6.1. Artefacts from high-Z materials: Dental implants . . . . . . . . . . . . . . . . . . . . . . . . . . . . . . 503.6.2. Artefacts from high-Z materials: Chemotherapy port . . . . . . . . . . . . . . . . . . . . . . . . . . . . 513.6.3. Artefacts from high-Z materials: Cardiac pacemaker . . . . . . . . . . . . . . . . . . . . . . . . . . . 523.6.4. Artefacts from high-Z materials: Orthopaedic brace . . . . . . . . . . . . . . . . . . . . . . . . . . . . 533.6.5. Artefacts from high-Z materials: Hip prosthesis . . . . . . . . . . . . . . . . . . . . . . . . . . . . . . . . 54
3.7. Patient motion . . . . . . . . . . . . . . . . . . . . . . . . . . . . . . . . . . . . . . . . . . . . . . . . . . . . . . . . . . . . . . . . . 553.7.1. Head motion . . . . . . . . . . . . . . . . . . . . . . . . . . . . . . . . . . . . . . . . . . . . . . . . . . . . . . . . . . . 553.7.2. Arm motion . . . . . . . . . . . . . . . . . . . . . . . . . . . . . . . . . . . . . . . . . . . . . . . . . . . . . . . . . . . . 563.7.3. Breathing motion artefact . . . . . . . . . . . . . . . . . . . . . . . . . . . . . . . . . . . . . . . . . . . . . . . . . 573.7.4. Disappearing liver lesion . . . . . . . . . . . . . . . . . . . . . . . . . . . . . . . . . . . . . . . . . . . . . . . . . . 583.7.5. Cardiac misalignment . . . . . . . . . . . . . . . . . . . . . . . . . . . . . . . . . . . . . . . . . . . . . . . . . . . . 593.7.6. Head motion in paediatric imaging . . . . . . . . . . . . . . . . . . . . . . . . . . . . . . . . . . . . . . . . . . 603.7.7. Gross patient motion . . . . . . . . . . . . . . . . . . . . . . . . . . . . . . . . . . . . . . . . . . . . . . . . . . . . . 61
3.8. Truncation, mismatch of field of view . . . . . . . . . . . . . . . . . . . . . . . . . . . . . . . . . . . . . . . . . . . . . . 623.8.1. Truncation along the upper extremities: Example 1 . . . . . . . . . . . . . . . . . . . . . . . . . . . . . 623.8.2. Truncation along the upper extremities: Example 2 . . . . . . . . . . . . . . . . . . . . . . . . . . . . . 633.8.3. Truncation along the lower extremities . . . . . . . . . . . . . . . . . . . . . . . . . . . . . . . . . . . . . . . 65
3.9. CT artefacts . . . . . . . . . . . . . . . . . . . . . . . . . . . . . . . . . . . . . . . . . . . . . . . . . . . . . . . . . . . . . . . . . . . 663.9.1. CT beam hardening and lesion localization . . . . . . . . . . . . . . . . . . . . . . . . . . . . . . . . . . . 663.9.2. Ultra-low-dose CT . . . . . . . . . . . . . . . . . . . . . . . . . . . . . . . . . . . . . . . . . . . . . . . . . . . . . . . 67
4. SCANNING CONDITIONS . . . . . . . . . . . . . . . . . . . . . . . . . . . . . . . . . . . . . . . . . . . . . . . . . . . . . . . . . . . 69
4.1. Injection conditions . . . . . . . . . . . . . . . . . . . . . . . . . . . . . . . . . . . . . . . . . . . . . . . . . . . . . . . . . . . . . 694.1.1. Tracer quality assurance . . . . . . . . . . . . . . . . . . . . . . . . . . . . . . . . . . . . . . . . . . . . . . . . . . 694.1.2. Subcutaneous tracer infiltration . . . . . . . . . . . . . . . . . . . . . . . . . . . . . . . . . . . . . . . . . . . . . 704.1.3. Contamination at the injection site . . . . . . . . . . . . . . . . . . . . . . . . . . . . . . . . . . . . . . . . . . 714.1.4. Contamination in the breast region . . . . . . . . . . . . . . . . . . . . . . . . . . . . . . . . . . . . . . . . . . 724.1.5. Contamination of blanket . . . . . . . . . . . . . . . . . . . . . . . . . . . . . . . . . . . . . . . . . . . . . . . . . 734.1.6. Contamination during flushing . . . . . . . . . . . . . . . . . . . . . . . . . . . . . . . . . . . . . . . . . . . . . 744.1.7. Contamination of patient couch. . . . . . . . . . . . . . . . . . . . . . . . . . . . . . . . . . . . . . . . . . . . . 754.1.8. Tracer uptake in internal absorber . . . . . . . . . . . . . . . . . . . . . . . . . . . . . . . . . . . . . . . . . . . 76
4.2. Data entry errors . . . . . . . . . . . . . . . . . . . . . . . . . . . . . . . . . . . . . . . . . . . . . . . . . . . . . . . . . . . . . . . 774.2.1. Patient data entries . . . . . . . . . . . . . . . . . . . . . . . . . . . . . . . . . . . . . . . . . . . . . . . . . . . . . . . 774.2.2. Retrospective change of data entries . . . . . . . . . . . . . . . . . . . . . . . . . . . . . . . . . . . . . . . . . 78
4.3. Scanning time after injection . . . . . . . . . . . . . . . . . . . . . . . . . . . . . . . . . . . . . . . . . . . . . . . . . . . . . . 794.3.1. Multiple time point imaging . . . . . . . . . . . . . . . . . . . . . . . . . . . . . . . . . . . . . . . . . . . . . . . 794.3.2. Microembolism . . . . . . . . . . . . . . . . . . . . . . . . . . . . . . . . . . . . . . . . . . . . . . . . . . . . . . . . . 80
4.4. Bed overlap . . . . . . . . . . . . . . . . . . . . . . . . . . . . . . . . . . . . . . . . . . . . . . . . . . . . . . . . . . . . . . . . . . . 814.4.1. Variable bed overlap . . . . . . . . . . . . . . . . . . . . . . . . . . . . . . . . . . . . . . . . . . . . . . . . . . . . . 814.4.2. Insufficient bed overlap . . . . . . . . . . . . . . . . . . . . . . . . . . . . . . . . . . . . . . . . . . . . . . . . . . . 83
4.5. Bladder artefacts . . . . . . . . . . . . . . . . . . . . . . . . . . . . . . . . . . . . . . . . . . . . . . . . . . . . . . . . . . . . . . . 844.5.1. Bladder artefacts: Example 1. . . . . . . . . . . . . . . . . . . . . . . . . . . . . . . . . . . . . . . . . . . . . . . 844.5.2. Bladder artefacts: Example 2. . . . . . . . . . . . . . . . . . . . . . . . . . . . . . . . . . . . . . . . . . . . . . . 85
ABBREVIATIONS . . . . . . . . . . . . . . . . . . . . . . . . . . . . . . . . . . . . . . . . . . . . . . . . . . . . . . . . . . . . . . . . . . . . . . . 87CONTRIBUTORS TO DRAFTING AND REVIEW . . . . . . . . . . . . . . . . . . . . . . . . . . . . . . . . . . . . . . . . . . . . . 89

1
1. DAILY QUALITY CONTROL AND QUALITY ASSURANCE
One of the unique characteristics of positron emission tomography (PET) imaging is its ability to provide quantitative information for diagnostic and therapy applications. A properly designed quality assurance (QA) programme should be implemented and should include thorough acceptance tests and routine verification of the performance and functionality of all components of the tomography.
A set of basic tests and their periodicity have been recommended for PET/computed tomography (CT) systems by, for example, the IAEA, the European Association of Nuclear Medicine (EANM), the American Association of Physicists in Medicine (AAPM), the American College of Radiology (ACR), the National Electrical Manufacturers Association (NEMA) and the International Electrotechnical Commission (IEC). However, the settings, procedures and phantoms to be used are, normally, manufacturer specific. The performance characteristics (specifications) should be provided together with the equipment and should be checked during acceptance testing of the equipment. Daily and periodic test results should be recorded and monitored continuously, so that any significant deviation from the reference values can be detected and corrected for, before affecting clinical results.
Both the PET and the CT components should be tested separately as recommended and each parameter’s working limits should be considered. However, as the information given by the CT images is used for attenuation correction (AC) and anatomical reference for the PET functional images, it is essential that the alignment between both modalities be checked, especially when high body mass index (BMI) patient studies are frequent.
If special tests are required by local authorities, clear operational procedures should be available to fulfil these requirements.
This section includes daily quality assurance (DQA) procedures from the three main manufacturers of PET/CT tomographs, namely General Electric (GE) Healthcare, Philips Healthcare and Siemens Healthcare.
The bibliography at the end of this section provides further reading on this topic.
1.1. CLINICAL PET/CT PLATFORMS
1.1.1. General Electric
1.1.1.1. Background
PET/CT DQA on GE Discovery PET/CT platforms is performed to ensure consistent and optimal scanner operation. Two sets of tests are performed to accomplish this objective: CT tests and PET tests.
1.1.1.2. CT tests
CT DQA on GE Discovery PET/CT platforms consists of several tests, the first of which is an X ray tube warm up procedure. This test is necessary to bring the X ray tube to its optimal operating temperature, which reduces the possibility of artefacts and may aid in extending the lifetime of the X ray tube. This procedure takes about 1 min to finish.
Tube warm up is then followed by an air calibration (or ‘fast cal’) procedure which, in turn, is composed of a series of calibrations and system tests. These include checking the data acquisition system converter board, collimator calibration, gantry balancing, mylar window cleanliness, focal spot position and, finally, an array of detector gain calibrations performed at different X ray tube voltages based on user predefined settings. The overall duration of this procedure is 20–30 min depending on the user predefined voltage settings.
Following tube warm up and air calibration, a CT number uniformity, linearity, image resolution and low contrast detectability test is then performed using a DQA water filled phantom. The DQA phantom, which is supplied with the scanner, is first placed on a holder and then positioned centrally in the field of view (FOV) (Fig. 1.1). A CT scan of the phantom is then acquired with preset parameters. Regions of interest are drawn on the resultant images at different locations and slices to evaluate CT number uniformity (Fig. 1.2), linearity and resolution (Fig. 1.3), and low contrast detectability (Fig. 1.4).

2
FIG. 1.1. CT daily quality assurance phantom positioned centrally within the field of view of the scanner using the scanner lasers.
FIG. 1.2. CT image of the daily quality assurance phantom with regions of interest for measuring the CT number uniformity.
FIG. 1.3. CT image of the daily quality assurance phantom for resolution measurement.
FIG. 1.4. CT image of the daily quality assurance phantom for low contrast detectability.
1.1.1.3. PET tests
The PET DQA on GE Discovery platforms consists of several tests, all of which require the extension of a built in 68Ge rod source into the FOV of the scanner (the source is not visible once extended since it is located behind the scanner enclosure). The PET DQA test is launched from the console and does not require any phantoms to be placed in the FOV of the scanner. The PET DQA tests are performed sequentially and evaluate the system’s coincidences, singles, dead time, timing and energy. The overall duration of the tests is about 10 min.
Once complete, the PET DQA procedure provides a visual and parametric data report on the status of the PET detectors (Fig. 1.5). The parametric results are also expressed in a three colour scale: green — within acceptable range; yellow — recommend tuning; red — outside acceptable range. Current DQA results can also be compared to those performed at baseline when the scanner was tuned by the manufacturer’s field service engineers. This is done by generating a visual representation of the ratio of the parametric results from these two dates (Fig. 1.6).
In addition, the DQA test also provides an assessment of the rod source (68Ge) mean count rate and variance, as well as its remaining lifetime. If these results fall below preset values, the status of the rod source DQA test will turn red.

3
FIG. 1.5. Results of the PET daily quality assurance test.
FIG. 1.6. Ratio of daily quality assurance results, here showing the results of prior to baseline daily quality assurance test.
1.1.1.4. Guidance
DQA tests for CT and PET components of the scanner should be performed to ensure consistent and optimal scanner operation. These tests should be performed and their results evaluated prior to injecting and scanning the patient to minimize repeat scanning and reduce patient radiation exposure.
1.1.2. Philips
1.1.2.1. Background
Daily quality control (QC) tests require manufacturer provided phantoms: a dedicated QA phantom for the CT scanner and a 22Na point source for the PET component. The CT QA phantom, called the ‘head and body’

4
phantom, allows for basic testing of CT number for different materials, image noise and uniformity, and presence of artefacts.
1.1.2.2. CT tests
After X ray tube conditioning and air calibration, the head and body phantom (Fig. 1.7) is fixed in its holder and scanned, so that CT numbers of different materials can be obtained from the images for verification (Fig. 1.8).
FIG. 1.7. Head and body phantom in its holder. FIG. 1.8. CT scan of the body layer.
Daily verification of CT number results should be registered and monitored (Fig. 1.9).
FIG. 1.9. Example of a daily monitoring of the CT numbers extracted from the scans.
1.1.2.3. PET tests
A 22Na point source (Fig. 1.10) is positioned in its holder at the centre of the tomograph’s FOV and imaged for the PET daily QC. Sinograms (Fig. 1.11) are obtained and checked for discontinuities. Significant deviations may indicate miscalibration or faulty detectors.

5
FIG. 1.10. 22Na point source in its holder (arrow).
FIG. 1.11. Quality assurance sinograms of the 22Na point source.
1.1.2.4. Guidance
Daily and periodic QA tests should follow the manufacturer’s recommendations, and the PET/CT manual should be consulted. The results should be compared to reference values and any significant deviation should be analysed carefully.
1.1.3. Siemens
1.1.3.1. Background
Properly performed daily QC, using dedicated phantoms (Fig. 1.12), is essential to ensure the quality and reliability of PET/CT examinations in a clinical routine.

6
FIG. 1.12. (a) CT quality control phantom; (b) 68Ge based phantom placed on a dedicated holder.
1.1.3.2. CT tests
The CT component of a PET/CT system is used for anatomical referencing of the PET findings, to localize lesions and structures, as well as to produce the attenuation map of the patient for AC. Thus, the CT numbers should be uniform over a uniform image and free of image distortions. This test is performed using a phantom (Fig. 1.12(a)) that contains three compartments to assess the uniformity (water-filled compartment), the axial slice thickness and the line spread function (wire).
Axial images (slices) of the water phantom (Fig. 1.13) are acquired and CT numbers are calculated for five regions of interest in all slices. Differences between regions within a slice and standard deviations from the global mean value are given, so that homogeneity can be evaluated. This is done automatically for different kVp and mA settings of the X ray tube.
The CT component resolution is evaluated by analysing the modulation transfer function (Fig. 1.14) obtained from an image of the wire portion of the phantom.
The reconstructed images of the central portion of the QC phantom (Fig. 1.15) provide tomographic slice thickness that should be checked with the nominal values.
Image uniformity, imaging table position and the laser light marker are also evaluated, and a quality constancy table containing all results is presented.
FIG. 1.13. Slice of the water portion. FIG. 1.14. Modulation transfer function obtained from the wire image.

7
The daily QC test of the CT component consists of analysing the image noise (Fig. 1.16), related to the variation of the water CT number within a thick slice, acquired for a different kVp and mA of the X ray tube.
FIG. 1.15. Axial reference image for the levelled CT phantom to confirm nominal slice thickness.
FIG. 1.16. Axial CT image of the quality assurance phantom to confirm CT number uniformity.
1.1.3.3. PET tests
The PET component of a hybrid system is composed of detection blocks mounted in ring geometry. The detectors can be either BGO (bismuth germanate) or LSO (lutetium oxyorthosilicate).
The constancy of the detector’s performance is tested daily using a uniform cylindrical 68Ge phantom (Fig. 1.12(b)), placed in the centre of the FOV of the tomograph.
Sinograms of the 68Ge uniform source (Fig. 1.17(a)) should be inspected carefully and compared to reference sinograms obtained after calibration and normalization. Daily χ2 values related to the reference data are calculated automatically and, according to the range set by the manufacturer, the system should be normalized for values between 2.5 and 7, while it will need calibration for values above 7.
Individual sinograms (Fig. 1.17(b)) can also be visualized if identification of detection blocks is needed, as when pronounced diagonal streaks representing faulty blocks are present.
1.1.3.4. Guidance
Daily and periodic QA tests should follow the manufacturer’s recommendations, and the PET/CT manual should be consulted.

8
FIG. 1.17. (a) Sinogram map of the 68Ge uniform phantom; (b) localization of two detection blocks.

9
BIBLIOGRAPHY
AMERICAN ASSOCIATION OF PHYSICISTS IN MEDICINE, PET/CT Acceptance Testing and Quality Assurance, TG126, AAPM, College Park, MD (2009).
AMERICAN COLLEGE OF RADIOLOGY, ACR Technical Standard for Medical Nuclear Physics Performance Monitoring of PET/CT Imaging Equipment, ACR, Reston, VA (2008).
BUSEMANN-SOKOLE, E., et al., Routine quality control recommendations for nuclear medicine instrumentation, Eur. J. Nucl. Med. Mol. Imaging 37 (2010) 662–671.
INTERNATIONAL ATOMIC ENERGY AGENCY, Quality Assurance for PET and PET/CT Systems, IAEA Human Health Series No. 1, IAEA, Vienna (2009).
INTERNATIONAL ELECTROTECHNICAL COMMISSION, Radionuclide Imaging Devices — Characteristics and Test Conditions — Part 1: Positron Emission Tomographs, IEC 61675-1, IEC, Geneva (2008).
NATIONAL ELECTRICAL MANUFACTURERS ASSOCIATION, Performance Measurements of Positron Emission Tomographs, NEMA Standard NU2-2012, NEMA, Rosslyn, VA (2012).
ZANZONICO, P., Routine quality control of clinical nuclear medicine instrumentation: A brief review, J. Nucl. Med. 49 (2008) 1114–1131.

10
2. PET AND PET/CT PHYSICS
In this section, it is illustrated how PET image quality is affected by the basic physical limitations of the detection principle, by choices made during instrument design, and by selections of acquisition and reconstruction parameters.
PET is based on radiotracers labelled with an unstable radionuclide that decays by emitting a positron. The positron is an antiparticle to the electron, having the same mass but opposite electric charge. When the positron has lost its initial kinetic energy by successive interactions in tissue, typically within a sub-millimetre distance, it will undergo annihilation with an electron, and the rest mass of the two particles is converted into two photons of 511 keV (Fig. 2.1). The angle between the paths of the two photons is almost exactly 180º. The photons travel at the speed of light, 30 cm/ns. If two such photons are detected by two detectors opposite each other in coincidence, i.e. within a short timing window of 4–12 ns, it may be inferred that a positron decay took place at the line connecting the two detectors (line of response (LOR)). The error inherent in this assumption mainly depends on the positron energy, which, in turn, depends on the specific nuclide. In most cases, it is insignificant compared to the scanner parameters (detector size) that limit the spatial resolution of the PET scanner.
FIG. 2.1. (a) The annihilation principle. The positron decay results in two annihilation photons, each of 511 keV, at an angle of 180º. (b) A PET scanner (ring-design) with covers removed to reveal the detector modules. (c) The lines of response, here shown for only 16 detectors in one ring, sample all directions simultaneously. No rotation is required to collect a full set of projections.
Since the annihilation process is isotropic, the sensitivity of a PET scanner depends on the useful solid angle covered by detector material. Most scanners have a ring design with a diameter of 70–90 cm and an axial extension of 15–25 cm. Early PET scanners operated in a 2-D mode by allowing only coincidences within one ring (or nearest neighbours) to be accepted, while detectors with a larger ‘ring difference’ were shielded from another by septa. Since the 1990s, some PET scanners have been built with retractable septa and, today, most scanners are made entirely without septa. This 3-D mode increases sensitivity but also puts a high demand on reconstruction and corrections. The sensitivity is critical because the statistical noise in the images depends on the registered number of counts, although in a more complex way than for simple gamma counting.
If it were possible to measure the ‘exact’ difference in arrival times of the two photons, this information could be converted into a precise determination of the decay position along the LOR, i.e. to a precise point in space, and further calculations (image reconstruction) would be unnecessary. With existing techniques, however, precision is of the order of 0.5 ns, which corresponds to a position uncertainty of 7 cm along the LOR. Nevertheless, this information is valuable, in particular for larger objects (patients). The principle is known as time of flight (TOF) PET, first suggested in the 1980s and now widely available in commercial scanners (Fig. 2.2).
Ideally, the two annihilation photons travel in straight lines without any interaction in the object and are both detected. This represents a true coincidence (Fig. 2.3). However, the free mean path of 511 keV photons in tissue is only of the order of 10 cm. Thus, a large fraction of the photons is either absorbed or, more likely, undergoes scatter. The scattered photon will have a slightly lower energy, but the difference may not be sufficient for it to be discarded by the energy discriminator of the system. If a scattered photon is detected together with its companion annihilation photon, the result represents a scatter coincidence, which is a false piece of information. It may also happen that two unrelated photons are incidentally detected within the timing window (and each of their companion

11
annihilation photons is lost to the system). These false coincidence events are known as randoms. The number of randoms increases with the square of the count rate (activity) and with the width of the timing window.
In order to obtain quantitative imaging, corrections must be applied for randoms, attenuation and scatter. Randoms may be estimated from the count rate in individual detectors (singles) or measured in a delayed timing window. In both cases, it involves a subtraction that reduces the measured signal and increases noise. Although the main physical process of attenuation of 511 keV photons in tissue is (Compton) scattering, the naming convention in (PET) imaging is that AC is used for the process of increasing the signal (correction for the missing photons), while scatter correction removes those photons that are assigned incorrectly to a given LOR. Both types of correction may introduce artefacts in images.
One important advantage of PET over other nuclear medicine imaging techniques is its potential for determining absolute activity concentrations and, thus, also tracer concentrations down to picomoles per litre. PET data are inherently quantitative, meaning that the information in the image can be interpreted directly as activity concentration in kilobecquerels per cubic centimetre or indirectly as standardized uptake values (SUVs), where the concentration is normalized by the injected activity and patient weight, or by the lean body mass, or the body surface area. The simple property of the weight based SUV is that, for a uniform distribution, no activity excreted, SUV = 1, assuming a tissue density of 1 g/cm3. This same assumption, normally not mentioned, explains why SUV is often reported as being unitless, rather than in grams per cubic centimetre, which is strictly correct.
For quantitative results to be obtained, all corrections must be applied properly. One of the most important (largest) corrections is AC. The advantage of PET (over other nuclide imaging methods) is that, due to the coincidence principle, the value of attenuation along the LOR does not depend on the actual position along the LOR (i.e. depth in the object). Thus, attenuation can be determined independently of the activity distribution, using either a transmission scan with a radioactive line or point source, or adopting the information from a CT scan. A CT scanner provides tomographical images by the transmission of X rays through the body. A CT scan represents a map of attenuation values that is interpreted in terms of anatomy due to the fact that different tissues have slightly different densities. Since attenuation depends on energy and the PET energy of 511 keV differs from the effective CT energy of 60–80 keV, piecewise linear scaling must be performed through a look-up table before the information can be used for correction in PET. This scaling is not unique but requires some assumptions regarding the composition of the tissue components in each voxel. A standard way of handling this is using a bilinear model,
FIG. 2.2. (a) In ordinary PET, the counts in a line of response are assigned with equal probability to all of the pixels along the corresponding line in the image matrix. (b) In time of flight PET, the counts can be localized within a limited segment of the line of response.
FIG. 2.3. An illustration of the different types of coincidence. Only for the true coincidence does the line of response to which we assign the event (‘count’) actually pass through (near) the point of decay.

12
considering mixtures of air and water (soft tissue), and of water and dense bone, respectively. Tissues and materials not falling within these categories, e.g. contrast agents or metallic implants, may cause image artefacts.
Reconstruction of the acquired raw PET data (sinograms) into tomographic images can be performed by various algorithms. Filtered back projection is a direct, linear method. It has the advantage of simplicity and speed, and is still the primary method in CT. Owing to its rather poor noise performance, the methods of choice in PET are normally iterative methods, where prior knowledge of the system can be built into a system matrix and used in the iteration loop. The results for all reconstruction methods depend on the selection of image matrix sizes and the filtering applied. For iterative methods, the number of iterations (and ‘subsets’ in certain algorithms) is also important.
In the selected examples, it is shown how many of these choices of acquisition and reconstruction parameters may influence the image quality and the quantitative results, e.g. in terms of SUV.
The bibliography at the end of this section provides further reading on this topic.
2.1. ACQUISITION
2.1.1. Positron range
2.1.1.1. Background
PET imaging is based on the utilization of tracer molecules labelled with a positron emitting radioisotope. Several such radioisotopes exist and positrons are ejected from the nucleus with different energy spectra depending on the radioisotope. For example, the maximum energy of the emitted positron is 0.6, 1.0 and 1.9 MeV for 18F, 11C and 68Ga, respectively. The positron range describes the maximum distance travelled by the positron in tissue (e.g. water) before annihilating with an electron. Obviously, positron range increases with positron energy, thus resulting in reduced spatial resolution for higher energy positron emitters. Positron ranges can be measured in PET and need to be accounted for when performing PET imaging using different radioisotopic labels for the tracer molecules. The positron range for the mostly used radioisotope, 18F, is very small and negligible with respect to the spatial resolution of the PET tomograph.
2.1.1.2. Case
The reduced spatial resolution for a given PET system can be illustrated by acquiring PET data using the same protocol and phantom but with different radiotracers (Fig. 2.4). The higher the maximum emission energy of the positron from the positron emitter, the larger the mean free path length and the lower the intrinsic spatial resolution, which can be appreciated from increased blurring of images reconstructed with fixed reconstruction settings.
FIG. 2.4. The Iida brain phantom was filled with three different radiotracers (from left to right: 18F, 68Ga and 120I) labelled with positron emitters. The maximum positron energy for these three radioisotopes is 0.6, 1.9 and 4.6 MeV, respectively. The phantom was imaged on a dedicated brain-only PET system with 2 mm LSO (lutetium oxyorthosilicate) based crystals. The increased blurring for 68Ga and 120I compared to the low energy positron emitter 18F should be noted.

13
2.1.1.3. Guidance
Positron range effects contribute to the overall blurring of PET images with otherwise fixed acquisition and reconstruction parameters. Thus, spatial resolution of non-FDG (fluorodeoxyglucose) tracers (i.e. tracers labelled with higher energy positron emitters) may be lower and the images may appear slightly blurrier.
2.1.2. Depth of interaction
2.1.2.1. Background
The resolution of a PET scanner is not constant across the measured FOV. For the common ring detector system with its cylindrical symmetry, the effect can be described by function(s) of the distance from the centre. At any point, resolution may be measured as full width at half maximum (FWHM) along three orthogonal axes: one parallel to the scanner axis (axial resolution) and two in the transaxial plane — one tangential and one radial. While the tangential resolution is fairly constant, the axial and the radial FWHMs increase with the radius. A simple illustration of the cause of this variation (for the radial resolution) is given in Fig. 2.5. The annihilation photons are stopped by the crystals where they have an exponentially decreasing probability of penetration depth. The half-value layer in typical detector materials is of the order of 1 cm. For photons along LORs through the centre, this depth of interaction has no implication, since the event will be assigned to the correct LOR independent of the depth of interaction. Moving towards the edge, however, penetrating photons may actually create an event in neighbouring crystals rather than in the one where they entered. In this case, the event is assigned to a wrong LOR, causing the signal from a point source to be degraded in the radial direction.
FIG. 2.5. Illustration of depth of interaction in PET leading to potentially wrong line of response (LOR) assignments (courtesy of Siemens Healthcare).
This effect on the point spread functions (PSFs) has implications for the (local) partial volume effects (PVEs) and, in turn, for the attempts to measure quantitative values (e.g. SUV).
The inclusion of knowledge from PSF measurements into the reconstruction algorithms may reduce the problem. Such algorithms are provided from the vendors under different names (TrueX from Siemens, SharpIR from GE and Astonish from Philips).
2.1.2.2. Case
The depth of interaction effect is illustrated with a set of measurements on a 68Ge line source at distances from r = 1 cm to r = 34 cm. Reconstruction was performed with filtered back projection and with iterative methods

14
with and without PSF information. The results are shown in Fig. 2.6 and in Table 2.1, where the values of measured FWHM are listed along with the relative height of the profile.
FIG. 2.6. Images and radial count profiles of a 68Ge line source placed parallel to the scanner axis in eight radial positions. Acquisition was performed on a Siemens mCT with a nominal field of view of 70 cm. Reconstruction was performed with filtered back projection (a), and iterative ordered-subsets expectation-maximization without (b) and with (c) inclusion of point spread function (PSF) information.
2.1.2.3. Guidance
Spatial resolution (FWHM) degrades towards the edge of the FOV. Thus, PVEs in small lesions become more significant here. It is important to be aware of the implications for the measurement of quantitative values, including SUV. Reconstruction with an iterative method that includes a priori knowledge of the PSF may improve spatial image resolution and quantitative accuracy.

15
TABLE 2.1. VALUES OF MEASURED FULL WIDTH AT HALF MAXIMUM AND RELATIVE HEIGHT OF THE PROFILE VERSUS RADIAL DISTANCE
Radial distance (cm)
FBP OSEM (without PSF) OSEM (with PSF)
FWHM (mm)
Relative height (%)
FWHM (mm)
Relative height (%)
FWHM (mm)
Relative height (%)
1 2.7 100 5.2 100 3.5 100
5 4.2 72 5.4 84 3.9 90
10 5.6 56 5.4 88 3.2 100
15 6.5 49 6.0 79 4.1 80
20 6.5 48 6.3 70 4.0 79
25 7.4 43 7.4 60 4.1 78
30 8.0 43 8.3 53 3.8 74
34 38 46
Note: FBP: filtered back projection; FWHM: full width at half maximum; OSEM: ordered-subsets expectation-maximization; PSF: point spread function.
2.1.3. 2-D and 3-D PET
2.1.3.1. Background
PET can be performed in 2-D and 3-D modes. The difference between these acquisition modes is the presence of septa in the axial direction between detector rings — similar to a collimator in gamma cameras — which reduces the detection of scattered events but also reduces the sensitivity of the scanner, thus resulting in lower signal to noise ratio (SNR) images, particularly for large patients. The majority of new PET tomographs are only capable of 3-D imaging.
2.1.3.2. Case
PET scans of patients were acquired in 2-D and 3-D modes. In both image sets, the patient was injected with 592 MBq of 18F-FDG and imaged sequentially in 2-D and 3-D modes at 60 min post-injection. Data were acquired for 3 min per bed position and reconstructed using iterative techniques (ordered-subsets expectation-maximization (OSEM)). Figure 2.7 corresponds to a patient with a BMI of less than 25, while Fig. 2.8 corresponds to a patient with a BMI greater than 30. The images clearly show the improvement in image quality between 2-D and 3-D images, particularly for patients with a large BMI.
2.1.3.3. Guidance
Whole body PET studies should be acquired in 3-D rather than 2-D mode to improve the resultant image quality as long as accurate scatter correction techniques can be applied. Most current PET tomographs have such scatter correction techniques. However, users are recommended to consult with the manufacturer for specific details.

16
FIG. 2.7. 2-D and 3-D PET images of a patient with a body mass index of 23 showing little difference between the two images.
FIG. 2.8. 2-D and 3-D PET images of a patient with a body mass index of 36 showing reduced noise level in the 3-D image compared to the 2-D image.
2.1.4. Emission scan duration
2.1.4.1. Background
An objective in PET and PET/CT imaging is to limit the total duration of the examination to the absolute minimum, while maintaining diagnostic quality of the PET and PET/CT images. Typical scan times chosen for whole body FDG-PET or PET/CT studies are of the order of 3 min per bed position. The longer the scan time, the more counts can be collected and the less noisy the PET images are. The shorter the emission scan time, the higher the noise level in the PET images.
2.1.4.2. Case
An 18 year old female patient with lymphoma was examined on a PET/CT using FDG as the tracer of choice. This study was acquired in list-mode (emission scan) and whole body images were reconstructed with different durations of emission acquisitions per bed position. PET data were corrected for scatter and attenuation using the available CT images. As shown in Fig. 2.9, image noise in attenuation corrected (AC)-PET increases with shorter extracted scan durations.

17
FIG. 2.9. Whole body FDG-PET/CT study of a female patient with lymphoma. The injected activity was 270 MBq and PET/CT scanning started at 60 min post-injection. After acquiring a topogram and a CT (a), a 6-bed list mode emission scan was acquired for 3 min per bed position. AC-PET images are shown for a total emission scan time of 18 min (b), 6 min (c) and 1 min (d). AC: attenuation corrected.
2.1.4.3. Guidance
Shorter emission acquisition times should be considered for patients who cannot tolerate extended examination times. Shorter examination times come at the cost of increased image noise and care should be taken when choosing the final imaging protocol parameters.
2.1.5. Noise in PET images
2.1.5.1. Background
The origin of the signal that forms PET images is the radioactive decay of the labelled tracer. Since this is a stochastic process, the image pixels, even in homogeneous areas, will show a certain variation that can be described by the standard variation of pixel values. While the underlying process of decay follows Poisson statistics, the reconstructed and processed images will not have this simple property. The noise in the images is basically determined by the number of registered counts, but is strongly affected by the corrections and filtering applied. One particular important issue is that the number of random coincidences increases with the square of the activity. In subtracting randoms, the noise increases and, therefore, the quality of images, as a function of counts, may reach a maximum (minimum noise) and then declines. This can be demonstrated in longitudinal phantom studies with decaying activity (Fig. 2.10).
2.1.5.2. Case
A Capintec brain phantom was filled with >1 GBq of a 11C compound. Images were acquired in 3-D mode for 2 min every 20.4 min (the half-life of 11C). Reconstruction was performed with filtered back projection and minimal filtering. It should be noted that the first image shows a lower quality than the second, and that the following three images are almost identical, showing that the optimum for the image quality is rather flat. The ratio of activity between the first and the last image is a factor of 215 or approximately 32 000. The noise of the emission images can be reduced by post-reconstruction filtering (Fig. 2.11).

18
FIG. 2.10. Central, axial image planes of the Capintec brain phantom (11C, T1/2 = 20 min) acquired longitudinally every 20 min for a period of 2 min each.
FIG. 2.11. Image sets 13–16 from Fig. 2.10 after applying a 20 mm Gaussian post-reconstruction filter.
2.1.5.3. Guidance
Noise in images can be reduced at the cost of spatial resolution. In general, higher activity within normally accepted limits will lead to higher image quality (less noise). Owing to the randoms correction, however, the gain in image quality will be limited above a certain activity level. This is true, in particular, for large patients, where the fraction of randoms will be higher. In such cases, the only way to improve image quality may be to extend the emission acquisition time.

19
2.1.6. Effects of varying emission/transmission duration
2.1.6.1. Background
PET imaging in general entails the acquisition of emission and transmission data of an object or subject inside the FOV of the PET system. In whole body PET-only transmission, data are acquired by means of a rod source (or several) filled with 68Ge, a positron emitter. Measured transmission data are used for the purpose of attenuation (and scatter) correction of the emission data. The noise and, hence, the diagnostic quality in the reconstructed AC emission image is a function of the object size and the number of counts acquired in the emission and transmission acquisition.
2.1.6.2. Case
Figure 2.12 introduces the concept of the emission (Em) and transmission (TX) fractioning of a given total acquisition time T. For a fixed T, a short TX-time (thus a long Em-time) amplifies the noise from the transmission data in the AC-PET images. On the other hand, a short Em-time (thus a long TX-time) amplifies the noise from the emission data. The fraction f of TX-time over Em-time affects the noise in the AC-PET images as seen in Fig. 2.12(b), where a noise minimum is reached for 0.2 ≤ f ≤ 0.4. This minimum was shown to hold for PET images reconstructed with filtered back projection and for source strengths recommended by the vendors (e.g. three 68Ge rods (60 MBq each) for the old ECAT PET series).
FIG. 2.12. (a) For a given total acquisition time T per bed position, the shorter the fraction f of time spent on TX acquisition, the higher the noise contributions from the TX data to AC-PET. (b) An optimized fraction f of TX/Em acquisition time for filtered back projection reconstruction of whole body data was found to be around 0.2–0.4. AC: attenuation corrected; Em: emission; TX: transmission.

20
The optimum fraction f of TX- and Em-times per total acquisition time was determined by several groups in phantom and patient studies. At the time of the study, 3-D filtered back projection reconstruction was the method of choice, and the optimum fraction f was found to be between 0.2 and 0.4. In other words, for a given acquisition time of 6 min per bed position, a TX acquisition time of 1.2–2.4 min was found to yield the lowest noise of the reconstructed images. This is exemplified in Fig. 2.13. The optimum fraction f is reduced further in the case that segmented AC and iterative reconstruction methods are used.
FIG. 2.13. Torso phantom studies with arms and breasts shown for different fractions f of TX/Em acquisition times for a given total scan time T in the case of 3-D filtered back projection reconstruction (a) and iterative reconstruction (b). (c) A patient with an adenocarcinoma is shown following an injection of 400 MBq of 18F-FDG and a total acquisition time of 7 min per bed.
2.1.6.3. Guidance
In PET-only, care should be taken in choosing the optimum fraction of TX and Em acquisition time. In general, in 3-D whole body PET, the TX-time should be less than half the total acquisition time per bed position. Significant noise reduction is achieved when using iterative reconstruction, which further reduces the optimum fraction f.
In PET/CT, the TX-related noise contributions to the PET image following computed tomography based attenuation correction (CT-AC) are essentially zero and the time consumption for CT is also negligible, corresponding to f ≈ 0.

21
2.1.7. Time of flight PET
2.1.7.1. Background
In TOF PET, the time difference between the arrival of the two annihilation photons at the opposite detectors is measured. Thus, the annihilation event can be more accurately localized along the LOR. By using this information during the reconstruction, the SNR of the PET images is improved. This improvement is proportional to the square root of the diameter of the patient and is estimated to be about a factor of two for a standard sized patient and a typical timing resolution of 500 ps on current PET/CT systems.
2.1.7.2. Case
In conventional PET (Fig. 2.14(a)), the probability for the location of the annihilation is the same for any location along the LOR. In TOF PET (Fig. 2.14(b)), this probability is limited to a bell-shaped function across the actual location of the annihilation. This TOF information helps increase the SNR in the reconstructed PET images (Figs 2.14(d) and (f)) compared to the PET images reconstructed from conventional, non-TOF data (Figs 2.14(c) and (e)). The improvement from TOF is bigger in larger patients (Fig. 2.14(f) versus Fig. 2.14(e), BMI = 30) than in smaller patients (Fig. 2.14(d) versus 2.14(c), BMI = 24).
FIG. 2.14. This figure illustrates the benefits of time of flight PET in standard sized and large patients. FOV: field of view; LOR: line of response.
2.1.7.3. Guidance
TOF PET provided an improved SNR in the reconstructed images, with the improvement being more prominent in larger patients.

22
2.2. RECONSTRUCTION
2.2.1. Post-reconstruction filter
2.2.1.1. Background
Image filtering (smoothing) reduces the resulting noise in the image, thereby improving the SNR at the expense of decreasing the spatial resolution. Different filter types as well as cut-off frequencies (or FWHM) can be chosen during PET image reconstruction. The filter type and cut-off frequency are usually user selectable and defined in the image reconstruction protocol. The most common filter type used in PET image reconstruction is the Gaussian filter. It should be noted that the extent of image smoothing affects the accuracy of quantification in reconstructed PET images.
2.2.1.2. Case
Figure 2.15 shows PET images of the same patient reconstructed using the same algorithm and filter type (iterative reconstruction with post-Gaussian filtering) while changing the filter FWHM. The figure clearly shows the increase in image smoothing as the filter FWHM increases from 3 to 12 mm. In this regard, the conspicuity of the various lesions in the image changes with the extent of filtering. Table 2.2 shows the reduction in SUV measurements due to filtering effects.
FIG. 2.15. Coronal FDG-PET image following post-reconstruction filters of 3 mm (a), 6 mm (b) and 12 mm (c).
TABLE 2.2. MAXIMUM STANDARDIZED UPTAKE VALUE (SUVmax) FOR THE LARGEST HYPERMETABOLIC LESION IN THE LEFT THORAX OF THE PATIENT IN FIG. 2.15
Filter width (mm) SUVmax
3 6.4
6 5.5
12 3.3

23
2.2.1.3. Guidance
The extent of image smoothing (filter FWHM size) is user dependent and is usually set based on the physician’s preference. It is important to note that the extent of image smoothing (both over smoothing and under smoothing) affects the accuracy of quantification in reconstructed PET images.
2.2.2. Iterative reconstruction parameters
2.2.2.1. Background
OSEM is the most widely used iterative reconstruction method in PET. Both the number of subsets and iterations influence the quality and the quantification of the reconstructed PET images.
2.2.2.2. Case
A set of emission sinograms from an FDG-PET acquisition of a patient was reconstructed applying a different number of subsets (s) and iterations (i), as shown in Fig. 2.16. Table 2.3 shows the effects of varying the number of subsets and iterations on PET quantification as measured by SUV. For the indicated hot spot in Fig. 2.16, the mean SUV (SUVmean) does not change significantly, while the maximum SUV (SUVmax) varies with the number of iterations more than with the number of subsets.
FIG. 2.16. Coronal images of an FDG whole body PET study following ordered-subsets expectation-maximization reconstruction using a different number of subsets and iterations.

24
TABLE 2.3. MEAN AND MAXIMUM STANDARDIZED UPTAKE VALUES (SUVmean AND SUVmax) FOR DIFFERENT RECONSTRUCTION PARAMETERS SHOWN IN FIG. 2.16
OSEM 2i, 8s 4i, 8s 6i, 8s 4i, 14s 4i, 21s
SUVmean 1.2 1.3 1.5 1.4 1.4
SUVmax 3.1 4.7 6.3 6.6 6.8
Note: OSEM: ordered-subsets expectation-maximization.
2.2.2.3. Guidance
The variation of SUV measurements with reconstruction parameters mandates strict adherence to standardized acquisition and reconstruction protocols.
2.2.3. Image matrix size
2.2.3.1. Background
PET image reconstruction, as other tomographic imaging, can be performed using different matrix sizes. Traditionally, whole body PET image reconstruction has been based on a matrix size of 128 × 128 pixels, while brain images have used 256 × 256 pixels. For a fixed FOV size, an increase in matrix size results in smaller pixels. For example, an FOV of 70 cm and a matrix size of 128 × 128 pixels result in pixels of 5.47 mm. As the pixel size decreases, the number of reconstructed events per pixel will decrease and, hence, the image quality expressed as an SNR will decrease. The matrix size is user selectable and is usually chosen so that the resultant pixel size is about one third of the resolution of the scanner.
2.2.3.2. Case
Figure 2.17 shows PET images of the same patient reconstructed using different matrix sizes (64 × 64, 128 × 128 and 256 × 256). The figure clearly shows the change in image quality with the change in matrix size. For a fixed FOV, small matrix sizes result in a course appearance of the PET image, while large matrix sizes result in a noisy PET image. Table 2.4 shows the reduction in SUV measurements due to the effects of matrix size.
FIG. 2.17. Coronal FDG-PET image reconstructed with a matrix size of 64 pixels (a), 128 pixels (b) and 256 pixels (c).

25
TABLE 2.4. MAXIMUM STANDARDIZED UPTAKE VALUE (SUVmax) FOR THE HYPERMETABOLIC LESION IN THE UPPER LEFT THORAX OF THE PATIENT IN FIG. 2.17
Matrix size SUVmax
64 4.9
128 5.5
256 5.7
2.2.3.3. Guidance
The appearance of a PET image is affected by the matrix size. In general, the matrix size is chosen such that the corresponding pixel size is about one third of the spatial resolution of the scanner.
2.2.4. Point spread function and PET image reconstruction
2.2.4.1. Background
The SUV is strongly dependent on the choice of reconstruction algorithms and parameters. This is also the case when selecting methods that include corrections for the variability of the PSF across the FOV. PSF methods are available from vendors under different names (TrueX from Siemens, SharpIR from GE and Astonish from Philips).
2.2.4.2. Case
Figure 2.18 shows PET images from whole body FDG-PET studies reconstructed with and without PSF implemented in the iterative reconstruction procedure. It is clear from the figure that the effect of incorporating the PSF in the reconstruction process is more significant for small lesions than for larger lesions. For example, the SUVmax of the small metastasis seen in the upper panel of Fig. 2.18 increases from 8.4 to 16.4, while the SUVmean of the liver remains unchanged. In the case of the larger lesion, the increase in SUVmax from PSF based reconstruction was only 30%, from 19.4 to 25.5.
2.2.4.3. Guidance
For inter-scan and intra-scan patient evaluation acquisition and reconstruction, parameters should be kept the same.

26
FIG. 2.18. Whole body PET image of two patients (top and bottom) reconstructed without (left) and with (right) point spread function. SD: standard deviation; SUV: standardized uptake value.
2.2.5. Partial volume effects
2.2.5.1. Background
In PET and PET/CT imaging, the spatial resolution of the PET images is defined by the size of the individual detectors and the arrangements of the detectors around the centre of the FOV. The spatial resolution is highest in the centre of the FOV and degrades towards the edge of the transverse FOV.
PVEs describe the underestimation of activity concentrations in small regions of interest for a given size of detector. The smaller the detector, the less significant are the PVEs for a given object. PVEs hinder the accurate quantification of lesions.
Recent advances in PET system technology include the routine use of smaller sized detector elements in whole body PET tomographs. In the 1990s, PET detectors of 6 mm × 6 mm surface area were common; in modern systems, this crystal size is reduced to 4 mm × 4 mm, thus providing higher intrinsic resolution data and, as a result, improved recovery for given lesions.
2.2.5.2. Case
Figure 2.19 shows the consequences of PVE on different sized lesions. Figures 2.19(a) and (b) show improved lesion recovery for smaller detector elements (6 mm versus 4 mm); it should be noted that the smallest 10 mm lesions are barely visible on the PET images acquired on the 6 mm × 6 mm crystal system. Figure 2.19(c) illustrates the consequences of PVE on clinical PET images with an increased lesion recovery for smaller sized PET detector elements.

27
FIG. 2.19. Partial volume effects in PET images. (a), (b) Improved lesion recovery for smaller detector elements; (c) consequences of the partial volume effect on clinical PET images.
2.2.5.3. Guidance
State of the art PET and PET/CT systems employ smaller sized crystals, thus allowing for higher resolution PET images. The reduced detector size reduces PVEs and improves the quantitative accuracy of PET images.
BIBLIOGRAPHY
BAILEY, D.L., TOWNSEND, D.W., VALK, P.E., MAISEY, M.N. (Eds), Positron Emission Tomography, Springer-Verlag, London (2005).
CHERRY, S.R., SORENSON, J.A., PHELPS, M.E., Physics in Nuclear Medicine, 4th edn, Elsevier/Saunders, Philadelphia, PA (2012).
HOFFMAN, E.J., HUANG, S.C., PHELPS, M.E., Quantitation in positron emission tomography: 1. Effect of object size, J. Comput. Assist. Tomogr. 3 (1979) 299–308.
HOFFMAN, E.J., HUANG, S.C., PHELPS, M.E., KUHL, D.E., Quantitation in positron emission tomography: 4. Effect of accidental coincidences, J. Comput. Assist. Tomogr. 5 (1981) 391–400.
HUANG, S.C., HOFFMAN, E.J., PHELPS, M.E., KUHL, D.E., Quantitation in positron emission tomography: 2. Effects of inaccurate attenuation correction, J. Comput. Assist. Tomogr. 3 (1979) 806–814.
— Quantitation in positron emission tomography: 3. Effect of sampling, J. Comput. Assist. Tomogr. 4 (1980) 819–826.

28
3. INSTRUMENTATION PHYSICS
The generation of accurately quantifiable PET images necessitates optimal operation of PET hardware as well as the application of a range of software algorithms that correct for variable, missed and unwanted detected events.
Following the detection of an annihilation event, the generated signal is processed through a series of electronic boards to determine the energy, position and timing of the event. Additional signal processing electronics assess event coincidence and sorting. A failure in any of these hardware components will lead to a degradation in image quality and in the accuracy of quantification. In this regard, a QC and QA programme should be implemented to ensure the proper functioning of the scanner hardware on a daily basis.
In addition to hardware components, several software algorithms are applied during image generation to ensure accurate image quantification. These include normalization and calibration, as well as corrections for dead time, randoms, geometry, attenuation, scatter and decay. The majority of these algorithms utilize correction maps or scaling factors (parameters) that should be updated on a regular basis to effectively reflect the current state of the system performance. Different reconstruction algorithms apply these corrections at different stages of the image generation process to produce the final image. Furthermore, different manufacturers utilize different approaches to implement these corrections with varying effects on image quantification.
Furthermore, the introduction of PET/CT with its demonstrated advantages over dedicated PET imaging has presented several challenges that affect the accuracy of PET quantification. These challenges are primarily rooted in the use of CT for the AC of the PET data and necessitate specialized image processing algorithms to mediate their effects on the resultant PET images. Examples of these challenges include the effects of high density material, such as oral and intravenous (IV) contrast media or metal implants, on CT numbers; truncation effects due to the mismatch between the CT and PET FOVs; and a temporal mismatch between the PET and CT data acquisition and its effect on the internal structures that are affected by involuntary motion.
This section presents clinical and phantom examples that highlight artefacts that are due to hardware failure and data correction errors, as well as artefacts inherent to PET/CT imaging that are primarily due to the use of CT data for the AC of PET images.
The bibliography at the end of this section provides further reading on this topic.
3.1. DETECTOR BLOCKS AND BOARDS
3.1.1. PET detector failure
3.1.1.1. Background
PET and PET/CT systems are composed of thousands of detectors arranged in blocks or pixelated arrays. The performance of these detectors is essential for the accurate determination of the activity distribution in the PET image. One way to evaluate the performance of these detectors is by visually assessing the PET raw data as represented through sinograms.
3.1.1.2. Case
Figure 3.1 shows a sinogram and a corresponding image of a NEMA/IEC phantom with all of the PET detectors operational. Figure 3.2 shows the same images when module 5 of block 4 of the scanner was non-operational. Figure 3.3 shows the same images when blocks 4 and 5 of modules 5 and 6, respectively, were non-operational.
Figure 3.4 shows a plot of the normalized activity concentration for the different spheres in the NEMA/IEC phantom for a varying number of non-operational detector blocks. The figure clearly shows that the normalized activity concentration is highly affected by the number of non-operational detectors. The proximity of the non-operational detector block to the area of interest (spheres) also affects the quantitative results.

29
FIG. 3.1. Representative emission sinogram and reconstructed image of the NEMA/IEC phantom showing the six spherical lesions (10–37 mm diameter) in a fully functional system.
FIG. 3.2. Representative emission sinogram and reconstructed image of the NEMA/IEC phantom showing the six spherical lesions (10–37 mm diameter) with one non-operational detector block.
FIG. 3.3. Representative emission sinogram and reconstructed image of the NEMA/IEC phantom showing the six spherical lesions (10–37 mm diameter) with two non-operational detector blocks.

30
FIG. 3.4. Variability of sphere quantification in the NEMA/IEC phantom for a varying number of non-operational detector blocks.
3.1.1.3. Guidance
The performance of the PET detectors should be checked daily as part of the QA/QC procedure of the PET system prior to injecting patients. In the case of a few non-operational detector elements, the effect on the overall quantitative accuracy of PET images is negligible. Imaging may continue while service is being scheduled. It is highly recommended to check the sinograms for any detector defects in addition to the results of the DQA on a daily basis.
3.1.2. Controller board failure
3.1.2.1. Background
Following event detection in PET, the recorded signals are processed in a multitude of electronic boards. The proper operation of these electronic boards is crucial for the generation of PET images that depict the actual biodistribution of the tracer. The operation of these boards as well as the overall performance can be assessed through the results of the DQA scan of the PET system.
3.1.2.2. Case
A 68Ge phantom was scanned as part of the DQA on a PET/CT system. The images in Fig. 3.5. show artefacts throughout the entire image set. Further investigation indicated that the controller board for all coincidence events on the acquisition computer system was malfunctioning and had to be replaced.
3.1.2.3. Guidance
DQA tests of PET and PET/CT scanners are essential to ensure the proper operation of the tomograph. Technologists and/or nurses should refrain from injecting patients prior to verifying the results of the DQA. If a scanner’s performance is unacceptable, as per the manufacturer’s recommendation, the system should be placed out of service and maintenance should be performed.

31
FIG. 3.5. Reconstructed images of a uniform phantom demonstrating severe system failure.
3.1.3. Memory board failure
3.1.3.1. Background
Before any equipment is put into clinical use, acceptance tests should be carried out in order to verify that it performs according to its specifications. These specifications are supplied by the manufacturer after standard test procedures.
3.1.3.2. Case
During acceptance tests performed on a standalone PET tomograph with BGO detectors, the peak 2-D noise equivalent count rate was 169 kcps measured at 100 kBq/mL, which, according to specifications, should be 230 kcps at 137 kBq/mL. The graph in Fig. 3.6 shows that the system stopped counting for two frames, at approximately 7.4 kBq/mL (0.2 μCi/mL) and 111 kBq/mL (3 μCi/mL). Furthermore, the images in Fig. 3.7 indicate incorrect data sorting, which suggests problems with one or more memory boards. These failures disappeared after replacement of the boards.
3.1.3.3. Guidance
Memory board failures can lead to sudden drops of count rate that can be appreciated in dynamic PET acquisition but may well go undetected in static mode acquisition.
3.1.4. Faulty timing calibration
3.1.4.1. Background
Apart from the DQA tests, some manufacturers also recommend periodic calibrations to be carried out by the users before the daily tests. The results of these tests should be analysed and further adjustments should be performed, if needed, before patient studies.

32
FIG. 3.6. 2-D noise equivalent count rate curves showing an incidental drop in count rate due to memory board failure. The arrows point to the frames where the system stopped counting. NECR: noise equivalent count rate.
FIG. 3.7. Corresponding axial 2-D PET images showing memory board failure (10th and 20th images) as well as event sorting problems (7th–9th and 17th–19th images).
3.1.4.2. Case
Figure 3.8 shows the consequences of faulty PET timing calibration and PET normalization on a whole body PET/CT study. The patient study was performed without the DQA check shown in Fig. 3.9.
3.1.4.3. Guidance
A DQA test should be performed and evaluated carefully before clinical studies are conducted. Periodic verification of good practice of the staff should be performed and retraining of members should be carried out if needed.

33
FIG. 3.8. Coronal CT (a), PET (b) and fused images (c) of a whole body PET/CT patient study with timing calibration errors shown as a geometric pattern throughout the PET image.
FIG. 3.9. Daily quality assurance summary report showing the map of detector blocks with faulty timing calibrations.

34
3.1.5. Master control and timing, and correction and rebinning board failure
3.1.5.1. Background
In a PET with TOF capabilities, the master control and timing boards manage the acquisition and timing, while the correction and rebinning boards store, correct and rebin the acquired list mode data.
3.1.5.2. Case
Following a TOF acquisition, the reconstructed PET image presented some horizontal lines in the area of the knees of a whole body patient study (Fig. 3.10). The artefact was identified as resulting from a failure of both the master control and timing boards, as well as the correction and rebinning boards.
FIG. 3.10. Patient scan.
3.1.5.3. Guidance
Timing errors and/or miscalibration are manifested in different ways. Normally, the resolution of such errors requires the on-site support of a service engineer.
3.1.6. Signal processing failure
3.1.6.1. Background
The PET/CT is a complex system usually involving several interacting computers to acquire and process the data. While a strict QA system may reveal problems at an early stage and reduce errors to a minimum, it is still possible that parts of the system may fail spontaneously and intermittently, and, in rare cases, create unexpected and inexplicable results.
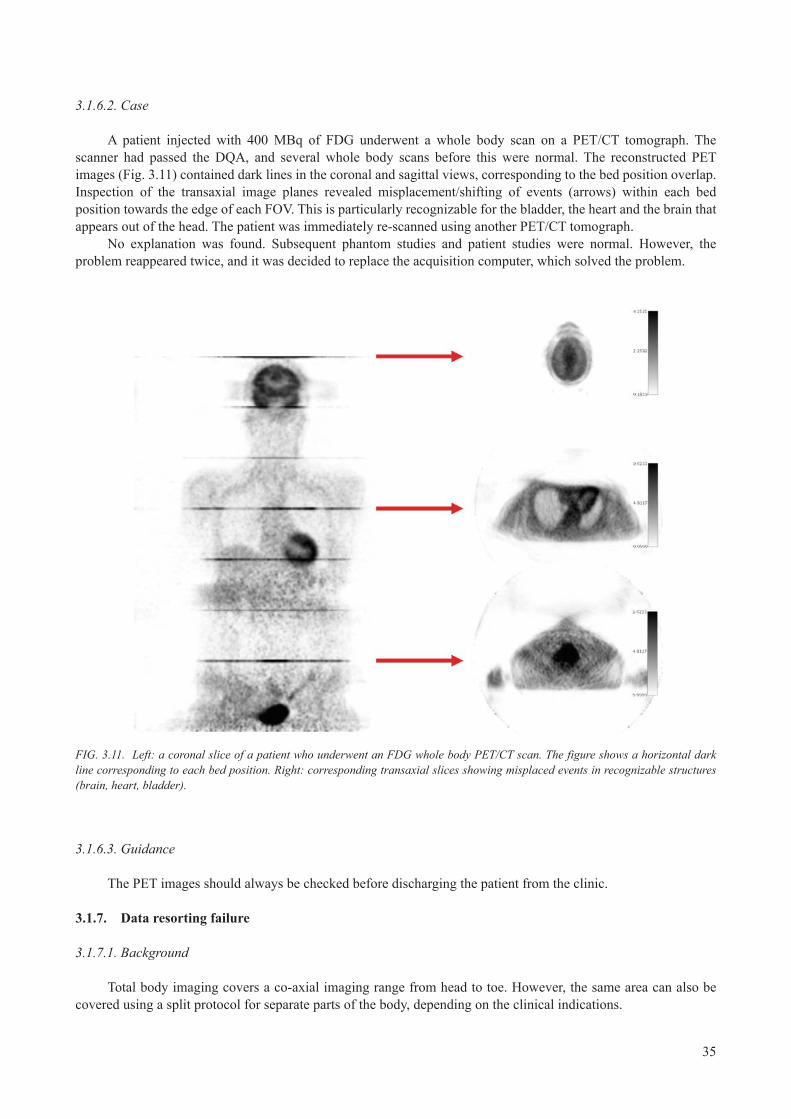
35
3.1.6.2. Case
A patient injected with 400 MBq of FDG underwent a whole body scan on a PET/CT tomograph. The scanner had passed the DQA, and several whole body scans before this were normal. The reconstructed PET images (Fig. 3.11) contained dark lines in the coronal and sagittal views, corresponding to the bed position overlap. Inspection of the transaxial image planes revealed misplacement/shifting of events (arrows) within each bed position towards the edge of each FOV. This is particularly recognizable for the bladder, the heart and the brain that appears out of the head. The patient was immediately re-scanned using another PET/CT tomograph.
No explanation was found. Subsequent phantom studies and patient studies were normal. However, the problem reappeared twice, and it was decided to replace the acquisition computer, which solved the problem.
FIG. 3.11. Left: a coronal slice of a patient who underwent an FDG whole body PET/CT scan. The figure shows a horizontal dark line corresponding to each bed position. Right: corresponding transaxial slices showing misplaced events in recognizable structures (brain, heart, bladder).
3.1.6.3. Guidance
The PET images should always be checked before discharging the patient from the clinic.
3.1.7. Data resorting failure
3.1.7.1. Background
Total body imaging covers a co-axial imaging range from head to toe. However, the same area can also be covered using a split protocol for separate parts of the body, depending on the clinical indications.

36
3.1.7.2. Case
In order to avoid a bladder filled with activity, a whole body study was divided into two consecutive acquisitions; the first covering the head/torso, and the second covering the lower extremities. While the data from the first scan were reconstructed, projections from the thighs were acquired.
This protocol resulted in a misplacement of the head activity to the thigh region as shown in the PET and fused PET/CT images (Fig. 3.12). This problem was resolved by starting the second part of the acquisition procedure only after completion of the reconstruction of the first scan.
FIG. 3.12. Reconstructed PET (a), CT (b) and fused PET/CT (c) images demonstrating incidental local activity misplacement in a split protocol study.
3.1.7.3. Guidance
Local activity misplacement could potentially arise in PET/CT imaging. All PET data acquisition protocols should be tested prior to clinical application. The PET image quality should be checked prior to discharging the patient from the clinic.
3.2. NORMALIZATION
3.2.1. Normalization
3.2.1.1. Background
‘Normalization’ is the traditional term for a correction with the purpose of eliminating differences in sensitivity between detectors (or detector pairs). It is equivalent to the uniformity correction of a gamma camera performed with a flood phantom. A normalization correction in PET is created from a recording that provides a uniform irradiation of all detectors by means of, for example, a rotating pin source or a uniform (homogeneous) cylinder phantom. For example, in a PET scanner with block detectors, the most prominent differences are those between centre and edge/corner detectors. In an uncorrected sinogram, these differences result in a characteristic rhombic pattern. Owing to its systematic nature, a deviation from the perfect correction will tend to create ring artefacts in the reconstructed images.

37
3.2.1.2. Case
The most sensitive test of the normalization correction is obtained by imaging a uniform cylinder phantom with a very high number of counts and/or adding together a number of adjacent slices. In a patient scan, even quite significant errors may pass without being acknowledged as artefactual. Figure 3.13 demonstrates the effects of incorrect normalization of PET data in a phantom. Figure 3.14 shows the same effect using the Capintec brain phantom. Error simulation was performed on real data. The examples shown here are extreme in the sense that the same raw data are reconstructed with and without correction (‘100% error’).
FIG. 3.13. Cylinder phantom reconstructed without (left) and with (right) normalization correction.
FIG. 3.14. Capintec brain phantom reconstructed without (left) and with (right) normalization correction, and displayed in two different colour scales. It should be noted that the artefacts created by the detector sensitivity differences are easier to recognize when the images are displayed in the inverse grey scale than in the colour scale applied.
3.2.1.3. Guidance
If a normalization error is suspected, a test should be carried out with a uniform cylinder collecting a large number of counts (i.e. an order of magnitude above clinical imaging). The images should preferably be displayed in black and white scale. Scanner normalization is recommended to be performed on a regular basis.

38
3.2.2. Faulty normalization
3.2.2.1. Background
PET scanners are composed of thousands of scintillation detector elements. The performance of these detectors should be the same when illuminated by a uniform source of radiation, otherwise the resultant PET image will show differences in the radioactivity distribution that are not truly reflected in the object or tracer distribution being imaged. To ensure that the performance of the PET detectors is similar to one another, a normalization scan is performed. During the normalization, a correction map is generated that normalizes the differences in signal response from each detector. The normalization correction map is stored and applied during subsequent PET image reconstruction.
3.2.2.2. Case
A PET scan of a patient was reconstructed with a normalization scan that was intentionally acquired with an additional object placed in the FOV of the tomograph. In this regard, the normalization scan does not truly represent the state of the detector performance as it includes the presence of the object in the FOV. Since the presence of the object results in the detection of fewer counts in some detectors, the normalization correction map will then boost the performance of these detectors to compensate for this deficiency. The resultant image will then show areas of high focal uptake corresponding to these detectors.
Figure 3.15 shows the sinogram of one slice of the correct normalization map (left) and the corresponding slice from the biased correction map (right). Figure 3.16 shows the reconstructed sagittal PET image with the biased normalization map and clearly illustrates areas of focal FDG uptake (arrow) that are not physiological but are due to the bias in the applied normalization correction map. The repeating nature of this artefact is due to the application of the normalization correction map to every FOV of the acquired PET data.
FIG. 3.15. (a) Original and correct normalization sinogram; (b) biased normalization sinogram due to the presence of an object in the field of view.

39
FIG. 3.16. Sagittal FDG-PET image reconstructed with faulty normalization.
3.2.2.3. Guidance
Normalization scans should reflect the underlying performance of the detector elements of the PET scanner. Users should ensure that no objects other than the recommended source of radiation are present in the FOV of the scanner when a normalization scan is being performed. Normalization scans should be performed on a regular basis (preferably every quarter) or when detectors or signal processing boards are tuned or replaced.
3.2.3. Slice to slice sensitivity
3.2.3.1. Background
The sensitivity of a PET scanner along the axial direction (z axis) is not uniform. The sensitivity along this direction depends on the acquisition mode (2-D or 3-D) as well as the azimuthal angle of coincidence pairs allowed by the scanner manufacturer. In general, the image planes at the edge of the axial FOV are less sensitive than the central image planes. Corrections are usually applied to normalize the difference in sensitivity along the axial direction and to generate a uniform sensitivity profile for a uniform activity distribution along the axial direction. Axial sensitivity profile correction is routinely applied during image reconstruction of the acquired PET data.
3.2.3.2. Case
Figures 3.17 and 3.18 show PET scans of patients acquired in 2-D and 3-D, respectively, without axial sensitivity profile correction. The figures clearly show areas of decreased sensitivity corresponding to the edge of each of the acquired axial FOVs (bed positions).

40
FIG. 3.17. Coronal FDG-PET image reconstructed without correction for the slice to slice axial sensitivity profile.
FIG. 3.18. Coronal CT (a), FDG-PET (b) and fused PET/CT (c) images acquired in 3-D and reconstructed without correction for the slice to slice axial sensitivity profile. The increased axial width of the artefact in 3-D compared to 2-D in Fig. 3.17 should be noted.
3.2.3.3. Guidance
Axial sensitivity profile correction is usually performed as part of the tomograph’s calibration/normalization process. It is highly recommended to perform this calibration on a quarterly basis or when detectors or signal processing boards are tuned or replaced.

41
3.3. ATTENUATION AND SCATTER CORRECTION
3.3.1. Effects of attenuation correction
3.3.1.1. Background
In PET, as in nuclear medicine in general, some of the emitted photons will be attenuated by the patient and, hence, will not be detected. As such, the measured activity concentration (and, hence, the SUV) in the body will not reflect the true measurement. One of the most important corrections for quantitative PET imaging is the correction for attenuation.
3.3.1.2. Case
A 73 year old male with a left upper lobe lung nodule was imaged following the injection of 330 MBq of FDG. Figure 3.19 shows the PET images reconstructed with (a) and without (b) AC.
FIG. 3.19. Coronal whole body FDG-PET images reconstructed with (a) and without (b) attenuation correction. The increased skin flare, hot lungs and reduced activity in the central portion of the body in the uncorrected PET images should be noted.
3.3.1.3. Guidance
AC of PET images should be performed for accurate interpretation and quantification of activity concentration. AC supports reproducible treatment response evaluation.
3.3.2. Scatter correction artefacts: Example 1
3.3.2.1. Background
Attenuation and scatter corrections are prerequisites for quantitative PET and PET/CT imaging. Scatter correction assumes reference points in the uncorrected emission images, which are used to estimate a magnitude and distribution of scattered events. Both corrections require the availability of a map of linear attenuation coefficients corresponding to the tissues/objects within the FOV. This requirement may not be fulfilled in the case that truncation is present in PET/CT images.

42
3.3.2.2. Case
This example demonstrates the amplification of scatter estimates from an incorrect match of attenuation map and activity distribution, causing an overcorrection of scatter in the area of the upper neck, leading to photopenic areas.
A patient was scheduled for a whole body FDG-PET/CT examination. The patient was positioned arms up, causing the arms to extend beyond the transverse CT FOV creating truncation (Fig. 3.20(a)). The attenuation and scatter corrected PET images (Fig. 3.20(b)) show a photopenic area in the upper neck, making the head and brain appear to ‘float’ on top of the neck. The truncation of the PET activity distribution in the area of the arms should also be noted. The PET images prior to attenuation and scatter corrections (Fig. 3.20(c)) showed no photopenic area in that anatomical region.
Figure 3.21 illustrates a similar case with scatter artefacts becoming dominant in the upper thoracic region.
FIG. 3.20. CT (a), attenuation and scatter corrected PET (b), and uncorrected PET (c) images of a whole body PET/CT study. From left to right: axial, coronal and sagittal images. The figure shows the scatter correction artefacts at the base of the skull.

43
FIG. 3.21. Attenuation and scatter corrected PET (a), attenuation corrected but not scatter corrected PET (b) and transaxial CT images of a whole body PET/CT study (c). The figure shows the scatter correction artefacts in the upper thorax in (a) caused by extensive truncation.
3.3.2.3. Guidance
Scatter correction, and scatter estimates in particular, can be affected by asymmetric activity distributions within the transverse FOV. Both corrected and uncorrected PET images should be checked for QC purposes prior to discharging the patient from the clinic.
3.3.3. Scatter correction artefacts: Example 2
3.3.3.1. Background
Image reconstruction in PET makes use of several data corrections to generate quantifiable images. One of these corrections is for scattered photons. When applied during an iterative reconstruction algorithm, there is the potential to generate an image artefact, particularly when the patient is scanned with their arms down while the hands/fingers are placed away from the body.
3.3.3.2. Case
A 69 year old patient with metastatic melanoma was imaged with 440 MBq of FDG. The patient was scanned arms down as expected for melanoma patients undergoing PET/CT examinations. The patient did not, however, keep her hands/fingers close to the body, thereby causing a significant photopenic artefact across the image at this location due to scatter correction (Fig. 3.22(a)). When the PET images were reconstructed without scatter correction (Fig. 3.22(b)), the artefact disappeared, indicating that the cause of this error was scatter correction.

44
FIG. 3.22. Coronal images of whole body FDG-PET reconstructed with (a) and without (b) scatter correction. The scatter artefacts at the level of the hands should be noted.
3.3.3.3. Guidance
When imaging patients that require positioning their arms adjacent to their body, as in melanoma studies, it is highly recommended that the patients place their arms, hands and fingers in contact with their body in order to minimize artefacts due to scatter correction.
3.3.4. Scatter correction artefacts: Example 3
3.3.4.1. Background
Current image reconstruction techniques in PET utilize iterative approaches, which incorporate different corrections during the reconstruction process. One of these corrections is for scattered events. There are different implementations of scatter correction but, in some cases, this correction results in image artefacts, particularly when imaging a relatively hot bladder.
3.3.4.2. Case
A 64 year old male with oesophageal cancer was injected with 333 MBq of FDG. A whole body PET scan was acquired with 3 min per bed position and reconstructed using 3-D iterative techniques (OSEM) with scatter correction. The patient was asked to void prior to the imaging session. However, the bladder remained hot, resulting in a large photopenic artefact around the bladder as shown in Fig. 3.23.
3.3.4.3. Guidance
Scatter correction in PET image reconstruction may result in image artefacts. Approaches to minimize artefacts include asking the patient to ensure voiding the bladder prior to imaging, imaging the patient from inferior to superior to minimize bladder refilling during the imaging process, and implementation of newer iterative reconstruction algorithms that minimize these effects.

45
FIG. 3.23. Coronal images of a whole body FDG-PET scan with attenuation and scatter correction (a) and without correction (b). Increased photopenic areas around the bladder on the corrected image should be noted.
3.4. INTRAVENOUS CONTRAST
3.4.1. Focal intravenous contrast accumulation: Example 1
3.4.1.1. Background
Contrast materials used for CT have a high element number Z. Iodine is normally used for IV injection. This use is based on the fact that high Z materials have high absorption at typical CT effective energies (60–80 keV). At the γ energy of 511 keV used in PET, however, the difference in attenuation between the contrast agents and tissue is minimal. It follows that the transformation to 511 keV is different from that of soft tissue and bone. Thus, high local concentrations of a contrast agent may cause an overcorrection in PET, thereby resulting in an artefact. Distributed contrast agents may, to some extent, influence absolute values and SUV without causing visible artefacts.
3.4.1.2. Case
Figure 3.24 shows a typical case of a patient undergoing contrast enhanced PET/CT imaging. IV CT contrast was injected using a biphasic protocol. Typical IV contrast accumulation can be observed in the subclavian vein, yielding an average attenuation of 1500 Hounsfield units (HU) or higher. Contrast accumulation is not accounted for in the segmentation bilinear scaling approach to CT-AC, thus creating hot spot artefacts in the AC-PET images. In the uncorrected image, no focal uptake is present, and the focus can, therefore, be identified as an artefact caused by the presence of the iodine contrast.
Figure 3.25 shows axial images of a second patient undergoing contrast enhanced PET/CT imaging demonstrating similar artefacts in the subclavian vein.

46
FIG. 3.24. Coronal images of a whole body FDG-PET/CT study with intravenous contrast. (a) CT image shown in bone window; (b) fused AC-PET and CT; (c) uncorrected PET; (d) AC-PET demonstrating hot spot artefacts corresponding to intravenous contrast accumulation. AC: attenuation corrected.
3.4.1.3. Guidance
The possibility of focal artefacts must be emphasized if AC is based on a CT scan performed with IV contrast enhancement. It is recommended to review the uncorrected and AC-PET images to exclude reporting false positive PET findings. Alternatively, modified contrast injection protocols can be employed in PET/CT imaging (see Section 3.4.2).

47
FIG. 3.25. Transaxial images of a whole body FDG-PET/CT study with intravenous contrast. (a) CT image shown in bone window; (b) fused AC-PET and CT; (c) uncorrected PET; (d) AC-PET demonstrating hot spot artefacts corresponding to intravenous contrast accumulation. AC: attenuation corrected.
3.4.2. Focal intravenous contrast accumulation: Example 2
3.4.2.1. Background
IV CT contrast is known to increase the attenuation of parenchymous organs and the IV/arterial system, thus enhancing the contrast of the CT image. If standard administration protocols from CT-only are adopted for PET/CT imaging, the application of IV contrast is known to cause apparent focal tracer uptakes, typically in the subclavian vein, which are caused by an accumulation of IV contrast. These apparent tracer uptake patterns in the subclavia represent an artefact.
3.4.2.2. Case
This case demonstrates the generation of an apparent tracer uptake in an area corresponding to a focal accumulation of IV contrast that does not correspond to an increased tracer accumulation on the uncorrected emission images. By adopting an optimized IV contrast administration, the focal contrast accumulation on CT can be circumvented and the PET images following CT-AC are free of artefacts originating from overestimations of the attenuation coefficients.
Figure 3.26(a) shows an FDG-PET/CT study of a patient with standard CT contrast enhancement: biphasic contrast (Xenetix, 300 mg iodine/mL) injection with 90 mL at 3 mL/s and 50 mL at 1.5 mL/s. CT images were acquired following a 30 s delay post-contrast injection. The focal contrast enhancement in the subclavian vein yielding an apparent focal hypermetabolic uptake pattern in PET emission images following CT-AC should be noted. Figure 3.26(b) shows a similar patient undergoing a whole body FDG-PET/CT study following optimized IV contrast administration: Xenetix (300 mg iodine/mL), biphasic injection of 80 mL at 3 mL/s and 60 mL at 1.5 mL/s with a 50 s delay, thus eliminating the artefact in the PET images of the subclavian vein as shown in the coronal (top) and axial (bottom) images.

48
FIG. 3.26. (a) Contrast enhanced CT, uncorrected PET, and PET/CT fusion using AC-PET data demonstrating a hot spot artefact from focal contrast accumulation in the subclavian vein. (b) The use of a modified intravenous contrast administration protocol can help to reduce contrast accumulation in the subclavian vein while providing generally good contrast enhancement. AC: attenuation corrected; noAC: not attenuation corrected.
3.4.2.3. Guidance
Standard CT-only IV contrast protocols should be adapted when employing contrast enhancement in PET/CT studies. Injection, flow rates and delays may vary with the CT system (e.g. dual-slice versus 128-slice CT).
3.5. ORAL CONTRAST ARTEFACTS
3.5.1. Positive oral contrast artefacts: Example 1
3.5.1.1. Background
Oral CT contrast is usually given prior to CT imaging (whenever clinically indicated) to improve the CT image contrast of the abdominal and gastrointestinal track region. Typically, positive oral contrast agents are used, that is contrast with a density higher than that of water. This contrast medium, which is usually given in liquid form, is shortly absorbed in the body, leaving a concentrated form of this contrast medium. A CT scan acquired at this stage will exhibit larger CT numbers in the contrasted region. While the administration of positive oral CT contrast may bias the accuracy of the AC-PET data, the administration of particularly high density contrast agents, such as barium sulphate for oesophageal imaging, may cause severe image distortions, including beam hardening effects that could potentially bias the PET image when the corresponding CT is used for AC.
3.5.1.2. Case
A 61 year old patient with lung cancer had ingested barium sulphate for an independent oesophagogram one day prior to the PET/CT study. The concentration of the contrast in the colon increases as a result of the significant water reabsorption of barium. Since the CT images are used for AC of the PET data, the high CT numbers of the residual barium overcorrect the attenuation of the PET emission data and mimic an increased 18F-FDG uptake (Fig. 3.27).

49
FIG. 3.27. Patient undergoing whole body PET/CT imaging following an oesophagogram study. CT (a) demonstrates extensive high density (3000 HU) enhancement in the stomach propagating into artificial enhancement of activity concentration in the AC-PET images (b). AC: attenuation corrected.
3.5.1.3. Guidance
In order to minimize the presence of PET image artefacts, a PET/CT scan should not be performed when residual oral contrast is still present from a previous oesophagogram. In that case, the PET/CT scan should be delayed until after the barium has cleared from the body, which typically takes a few days. It is generally recommended to review both corrected and uncorrected PET images.
3.5.2. Oral contrast artefacts: Example 2
3.5.2.1. Background
Positive oral CT contrast administration is standard practice in CT imaging. It helps to increase the attenuation and contrast of the digestive tract. If standard administration protocols from CT-only are adopted for PET/CT imaging, the application of positive oral contrast is known to cause an apparently increased tracer uptake pattern and bias on PET images following CT-AC.
3.5.2.2. Case
Figure 3.28 demonstrates the generation of an extended area of increased tracer uptake corresponding to positive oral contrast enhancement on CT. This increase in activity can be observed in the stomach as well as in the colon. By adopting alternative, water based contrast media, image artefacts on AC-PET in PET/CT imaging can be minimized.
Figure 3.28(a) shows transaxial CT images through patients following positive oral contrast enhancement with a 3% iodine and 1.5% barium based positive oral contrast. The increased CT attenuation of the colon compared to water should be noted. Figure 3.28(b) shows transaxial sections through the level of the stomach for CT (left), AC-PET (middle) and fused PET/CT (right), demonstrating the increased uptake of FDG in the stomach corresponding to the accumulation of positive oral contrast. Figure 3.28(c) demonstrates a case similar to Fig. 3.28(b), with a series of coronal image planes through a PET/CT study following positive oral contrast enhancement. The increased attenuation and uptake pattern in the colon should be noted. Figure 3.28(d) shows transaxial CT images through the abdomen after contrast enhancement with water (left) and a locust bean gum solution (right), demonstrating a mean CT attenuation similar to that of water. When using water based oral contrast enhancement, no artefacts are generated through CT-AC, as shown in Fig. 3.28(e).

50
FIG. 3.28. (a)–(c): Positive oral contrast enhanced CT and subsequent effects on PET images; (d)–(e): water based oral contrast provides good delineation in the abdomen without PET artefacts.
3.5.2.3. Guidance
Positive oral CT contrast can falsify tracer uptake patterns on PET following CT-AC. Negative or water based oral contrast may be used as an alternative for CT image evaluation but without the subsequent PET artefacts.
3.6. METAL ARTEFACTS
3.6.1. Artefacts from high-Z materials: Dental implants
3.6.1.1. Background
High-Z materials are known to cause artefacts in PET images following CT-AC. These artefacts are caused by overestimations of the attenuation coefficients due to the incorrect transformation of CT attenuation values into linear attenuation coefficients during the bilinear segmentation scaling approach that is standard in CT-AC.
Dental implants are typically made of silver or gold, thus creating well known beam hardening effects on CT-only and overestimations of attenuation coefficients during CT-AC.
3.6.1.2. Case
Figure 3.29 demonstrates the appearance of CT images in the presence of bilateral dental fillings. These high density fillings cause streak artefacts (beam hardening and scatter) on CT, while the same area appears photopenic on PET-only images without attenuation and scatter correction. After CT-AC, the PET images should still be photopenic in the area of the dental implants and fillings. However, owing to slight patient motion from muscle relaxation and other involuntary motion of the head, the PET emission data are corrected with attenuation maps that are not only biased locally but are also slightly misaligned to the emission data, thus causing a locally disseminated bias of the PET activity distribution following CT-AC.

51
FIG. 3.29. (a) Image appearance of bilateral dental fillings on the CT topogram, fused AC-PET/CT, CT, AC-PET and noAC-PET. It should be noted that, without patient motion, dental fillings do no propagate into artefactual tracer uptake on AC-PET. (b) Axial images through the mandible of a patient with bilateral dental implants: CT, noAC-PET and AC-PET. Owing to motion-induced misalignment of the CT and PET data, a bilateral focally increased tracer uptake was generated on AC-PET (arrows). AC: attenuation corrected; noAC: not attenuation corrected.
3.6.1.3. Guidance
Dental fillings and implants cause known beam hardening and streak artefacts on CT-only, which are visually more pronounced when displaying the CT in soft tissue window settings. If combined with slight patient motion, dental fillings can cause local artefacts on PET images following CT-AC. It is recommended to review AC and not attenuation corrected (noAC)-PET images in order to interpret potential metal artefacts. Currently, no prospective metal artefact correction is available in combined PET/CT tomographs.
3.6.2. Artefacts from high-Z materials: Chemotherapy port
3.6.2.1. Background
High-Z materials are known to cause artefacts in PET images following CT-AC. These artefacts are caused by overestimations of the attenuation coefficients due to the incorrect transformation of CT attenuation values into linear attenuation coefficients during the bilinear segmentation scaling approach that is standard in CT-AC.
Many oncology patients are examined with PET/CT during therapy and, therefore, come for the PET/CT examination with a chemotherapy port attached. Such ports contain high density materials and may cause artefacts on PET images following CT-AC.
3.6.2.2. Case
This case demonstrates the chance to misinterpret a focally increased tracer uptake on AC-PET as a lesion rather than as an artefact from a biased CT-AC.
A female patient with breast cancer undergoing chemotherapy was scheduled for an FDG-PET/CT. She was positioned in the prone position with her breasts hanging. Figure 3.30 shows a spiked density corresponding to the chemotherapy port (arrow) next to a low contrast breast lesion on CT (arrow-head). On AC-PET, the contrast of the apparent lesion corresponding to the port is higher than the contrast of the true breast lesion. On the noAC-PET image, no tracer uptake can be associated with the location of the port, rendering this an artificial lesion.

52
FIG. 3.30. CT (a), AC-PET (b) and noAC-PET (c) of a patient with breast cancer with a chemotherapy port causing artificial tracer uptake on AC-PET. AC: attenuation corrected; noAC: not attenuation corrected.
3.6.2.3. Guidance
In PET/CT patients with chemotherapy ports, care must be taken when interpreting focal PET lesions as these may correspond to focally incorrect attenuation coefficients arising from an overestimation of the attenuation of the port. It is recommended to review both AC-PET and noAC-PET images in order to interpret potential metal artefacts.
3.6.3. Artefacts from high-Z materials: Cardiac pacemaker
3.6.3.1. Background
High-Z materials can create (streak) artefacts on CT, and these artefacts may propagate to the PET through the AC process. Local artefacts on PET may be created even without visible artefacts on CT. In using the CT, the attenuation values are scaled (by table look-up) between the CT energy and the PET energy of 511 keV. The true scaling factor is larger for metals than for soft tissue and bone. Assuming only these two tissue types may, therefore, lead to local overcorrection in PET and result in image artefacts.
3.6.3.2. Case
Figure 3.31 illustrates transaxial images of a PET/CT study of a patient with a cardiac pacemaker. The increased attenuation on CT images from the pacemaker translates to artificially increased tracer uptake on AC-PET images following CT-AC.
3.6.3.3. Guidance
If a patient presents with metal implants, the chance of focal artefacts on PET following CT-AC must be emphasized. It is recommended to use both the AC and noAC images when evaluating the PET/CT study.

53
FIG. 3.31. (a) CT scan shown in bone window; (b) fused AC-PET/CT. noAC-PET scan (c) and AC-PET (d) demonstrating artificially increased focal uptake in the area of the pacemaker. AC: attenuation corrected; noAC: not attenuation corrected.
3.6.4. Artefacts from high-Z materials: Orthopaedic brace
3.6.4.1. Background
High-Z materials are known to cause artefacts in PET images following CT-AC. These artefacts are caused by overestimations of the attenuation coefficients due to the incorrect translation of CT attenuation values into linear attenuation coefficients during the bilinear segmentation scaling approach that is standard in CT-AC.
Orthopaedic operations may entail the placement of metal-based braces, thus causing extensive attenuation of the adjusted anatomical region on CT (and PET). These braces are known to cause apparent tracer increases on AC-PET images.
3.6.4.2. Case
Figure 3.32 demonstrates the combined effect of inflammatory changes near one end of the inserted and mounted orthopaedic brace (arrow), as well as focally increased tracer uptake due to an overestimation of the attenuation coefficients of the brace (arrow-head).

54
FIG. 3.32. Sagittal sections of the upper torso in CT (a), AC-PET (b) and noAC-PET (c) of a patient with an upper spine orthopaedic brace. The inflammatory changes in tracer uptake (arrow) that are present in (b) and (c) should be noted. The dorsal uptake pattern (arrow-head) is affected more by an overestimation of the attenuation map and is, therefore, only noticeable on AC-PET (b). AC: attenuation corrected; noAC: not attenuation corrected.
3.6.4.3. Guidance
Orthopaedic braces can cause locally biased uptake patterns. In order to separate those from inflammatory changes, both AC-PET and noAC-PET images should be reviewed.
3.6.5. Artefacts from high-Z materials: Hip prosthesis
3.6.5.1. Background
Metallic objects, such as hip prostheses, have a very high HU number on the corresponding CT image. In this regard, when such CT images are used for the AC of the corresponding PET data, these very high CT numbers will overestimate the activity concentration in the corresponding region in the PET image. However, if the true attenuation as measured by CT exceeds the HU scale limit (normally ~3000) and is, therefore, clipped at this value, the result may instead be an underestimation. This situation is usual in hip prostheses.
3.6.5.2. Case
A patient with a hip prosthesis was referred for a PET/CT scan. Figure 3.33 shows the CT (a), noAC-PET (b) and AC-PET (c) coronal images. The CT image shows very high CT numbers (arrow) corresponding to the metallic hip prosthesis. The corresponding AC-PET image shows a photopenic area since there was no accumulation of activity in this region. The noAC-PET image confirms this finding.
3.6.5.3. Guidance
Metallic artefacts in PET/CT images do not always result in an artificial increase in activity concentration. This situation occurs primarily when there is no patient motion between the PET and CT acquisitions. In hip prostheses, the total attenuation is often underestimated and the region will (correctly) show a photopenic area within the metal components.

55
FIG. 3.33. Coronal image planes of whole body CT (a), noAC-PET (b) and AC-PET (c) from a patient PET/CT study with a metallic hip prosthesis. AC: attenuation corrected; noAC: not attenuation corrected.
3.7. PATIENT MOTION
3.7.1. Head motion
3.7.1.1. Background
In PET/CT, the CT information is used to provide complementary anatomical reference data for the functional/metabolic data as well as for CT-AC. Thus, an accurate alignment of CT and PET emission data is required for accurate diagnosis and properly corrected PET images. In the case of grave misalignment, the diagnostic quality of the PET or PET/CT data can be affected.
In PET/CT examinations of extended co-axial imaging ranges, the time difference between acquiring the CT and the emission data of the head can be significant (up to 30 min) since the CT is acquired head first, whereas the multi-bed emission scan is acquired feet first in order to limit artefacts in the pelvic region (also known as bladder uptake). Given the rather lengthy delays in imaging the head and neck region, involuntary patient motion in that area is not uncommon. This relates to relaxation of the neck muscles, causing a misalignment of that anatomical region during the CT and PET scan.
3.7.1.2. Case
Figure 3.34 illustrates an apparent asymmetric tracer uptake in the brain that was caused by a slight misalignment of the head in the CT and PET emission scan caused by a relaxation of the neck muscles during the combined PET/CT examination.

56
FIG. 3.34. Axial, sagittal and coronal noAC- and AC-FDG-PET images of a whole body PET/CT study of an oncology patient: (a) the noAC-PET images show symmetrical uptake of FDG in the axial (left) and coronal (right) panels, and a fairly uniform uptake in the cortex on the sagittal images (middle); (b) the AC-PET images show an asymmetry in the tracer uptake (arrow) that was caused by a noAC-PET; (c) CT misalignment. AC: attenuation corrected; noAC: not attenuation corrected.
3.7.1.3. Guidance
Motion of the head during lengthy PET/CT examinations is common in oncology PET/CT imaging and may lead to locally biased tracer distributions in the head and neck region. Careful review of AC-PET and noAC-PET in combination with the CT following CT-AC is recommended. The use of additional patient positioning devices or a support structure, such as vacuum lock bags, may help reduce misalignment from involuntary patient motion.
3.7.2. Arm motion
3.7.2.1. Background
Accurate alignment of functional and anatomical information is a prerequisite for diagnostically meaningful PET/CT data and accurate CT-AC. Large PET-CT misalignments may not only jeopardize the image quality, but also significantly alter the quantification of the PET data.
3.7.2.2. Case
Figure 3.35 shows images of a PET/CT study with significant arm motion. During the PET/CT scan, the patient moved her arms from her side and placed them at the top of her abdomen. As a result, both attenuation and scatter correction led to significant artefacts in the AC-PET image. It should be noted that part of the lower extremities are not seen in this coronal slice because of the use of a knee support.
3.7.2.3. Guidance
Local PET and CT misalignment can be caused by patient motion (voluntary or involuntary). Thus, it is essential to instruct the patient prior to the examination not to move throughout the duration of the combined imaging session.

57
FIG. 3.35. Coronal CT (a), AC-PET (b) and fused AC-PET/CT (c) images of a whole body FDG-PET/CT study demonstrating artefacts from intra-scan motion of the arms. It should be noted that the patient moved her arms between the CT and PET data acquisition. AC: attenuation corrected.
3.7.3. Breathing motion artefact
3.7.3.1. Background
PET data acquisition requires a longer scan time than corresponding CT scans. This temporal difference could result in a mismatch between the PET and CT images, particularly when imaging the thorax owing to the influence of breathing motion. The mismatch between the PET and CT images results in a photopenic or photo-enhanced area at the diaphragm location.
3.7.3.2. Case
A 70 year old male with melanoma was injected with 350 MBq of FDG. A whole body PET/CT study was performed with 3 min per bed position. The patient was asked to breathe shallowly during the PET and CT scan. Figure 3.36 shows reconstructed coronal PET images demonstrating a photopenic region (‘banana’ artefact — arrow-head) at the diaphragm location, primarily due to differences in patient breathing between the CT and PET portions of the study.

58
FIG. 3.36. Coronal image planes of CT (a), noAC-PET (b), AC-PET (c) and fused AC-PET/CT (d) demonstrating local PET-CT misalignment of the diaphragm region resulting in photopenic areas above the diaphragm corresponding to undercorrection of attenuation in that area. This undercorrection is caused by the different caudo-cranial extent of the diaphragm on CT (a) and on the emission data (b). AC: attenuation corrected; noAC: not attenuation corrected.
3.7.3.3. Guidance
Breathing motion causes artefacts (photopenic or ‘banana’) in PET/CT imaging. These artefacts can be minimized by maintaining consistent shallow breathing during both the PET and CT scans. Alternatively, CT data can be acquired at normal expiration breath hold.
3.7.4. Disappearing liver lesion
3.7.4.1. Background
PET emission data are acquired over several breathing cycles. Thus, the resultant PET image represents the average location of internal structures affected by the breathing motion over the course of several respiratory cycles. For the case of a lesion located in a region that exhibits large motion, such as the base of the lungs, the lesion will be blurred due to motion and its corresponding activity concentration will be underestimated since the average volume of the lesion becomes larger than the original lesion volume. Several methods have been proposed to minimize the blurring and underestimation of activity concentration due to breathing motion.
One of these approaches is to acquire the PET data in gated mode, whereby the acquired PET data are binned into multiple segments, each representing a portion of the breathing cycle. Data from consecutive breathing cycles are then binned to their corresponding segments along the breathing cycle. In this way, a PET image will be subdivided into multiple PET images, each corresponding to a portion of the breathing cycle. These images are characterized by minimal motion but with a low SNR since the number of counts per bin has been decreased. Gating improves the accuracy of PET quantification but increases the image noise if the scan duration is kept fixed. Most commercial PET scanners have gating capabilities.

59
3.7.4.2. Case
Figure 3.37 shows a PET scan of a patient with a small lesion at the dome of the liver — an area that exhibits large movement due to breathing. Figure 3.37(a) shows the PET data acquired in standard mode with the lesion (arrow) barely visible due to motion blurring. Figure 3.37(b) shows the same PET data acquired with gated mode; the lesion is clearly visible due to motion suppression. The same image, however, shows a decreased SNR due to a decrease in the detected counts per bin.
FIG. 3.37. Coronal PET images without (a) and with (b) respiratory gating demonstrating improved lesion conspicuity. The low signal to noise ratio throughout the respiratory gated image due to the reduced count statistics should be noted.
3.7.4.3. Guidance
Motion blurring in PET imaging decreases the conspicuity and quantification accuracy, particularly of small lesions. One approach to minimize motion effects is to acquire the PET data in gated mode although this will result in a decreased SNR when using a fixed scan duration. An alternative approach is to acquire full-inspiration or end-expiration breath hold CT and PET data of the thorax, which is feasible with modern PET/CT technology and compliant patients.
3.7.5. Cardiac misalignment
3.7.5.1. Background
In a PET/CT scanner, the temporal resolution of PET data acquisition is on the order of minutes, while that of CT is on the order of seconds. This results in a potential positional mismatch when imaging structures that are affected by respiratory or breathing motion, such as the heart or the liver. This positional mismatch is further accentuated since the CT data are used for the AC of the PET data. When the CT image does not match the (average) position of the PET image, the AC will be biased, resulting in different artefacts depending on the extent of the mismatch and the location of the CT image with respect to the PET image.
3.7.5.2. Case
Figure 3.38 shows a transaxial image at the level of the heart of a 54 year old patient referred for a whole body FDG-PET/CT study. Owing to the temporal mismatch between the PET and the CT, the PET image exhibits a photopenic area at the lateral wall of the heart (arrow) as if the patient had a cardiac infarct. When the CT image was matched with the corresponding PET image and subsequently used for AC, the photopenic area disappeared (lower panel).

60
FIG. 3.38. Top panel left to right: transaxial CT, PET and fused PET/CT images demonstrating the effects of misalignment (arrow) between PET and CT at the level of the heart. Bottom panel: PET image following proper alignment between PET and CT.
3.7.5.3. Guidance
Mismatch between the PET and CT images results in AC bias that leads to various artefacts that affect the interpretation and the quantitative accuracy of the resultant PET images. Every effort should be made to minimize the mismatch between the PET and CT images; this may include dedicated breathing protocols, the use of gating mechanisms or further post-processing of the emission data.
3.7.6. Head motion in paediatric imaging
3.7.6.1. Background
PET scanning requires a relatively long imaging time. In this regard, patients are asked to remain motionless for the duration of the imaging time in order to minimize image blurring. Patient motion between CT or transmission imaging and emission (PET) data acquisition also results in wrong AC and, subsequently, incorrect activity concentration. Involuntary patient motion can more frequently be observed in paediatric and mentally retarded patients.
3.7.6.2. Case
A 15 year old male patient with metastatic osteosarcoma was imaged with 336 MBq of FDG for evaluation of therapy response. The patient was first CT scanned from the top of the head to the ankle position. However, just before the PET scan was started, the patient rotated his head. This motion resulted in a misalignment between the PET and CT scans (Figure 3.39), as well as biased AC. The figure clearly shows that the left side of the head was overcorrected for attenuation while the right side was undercorrected.

61
FIG. 3.39. Transaxial image planes of CT (a), noAC-PET (b), AC-PET (c) and fused AC-PET/CT (d) demonstrating local PET-CT misalignment of the head resulting in a biased cortical activity. AC: attenuation corrected; noAC: not attenuation corrected.
3.7.6.3. Guidance
Patient motion results in image artefacts and inaccurate quantification. Every effort should be made to minimize patient motion during PET or PET/CT imaging, by ensuring that the patients are as comfortable as possible prior to starting the imaging session. This is particularly important for paediatric, claustrophobic and mentally ill patients who cannot tolerate long imaging times.
3.7.7. Gross patient motion
3.7.7.1. Background
In PET/CT, the CT information is used to provide complementary anatomical reference data for functional/metabolic data as well as for CT-AC. Thus, an accurate alignment of CT and PET emission data is required for accurate diagnosis and properly corrected PET images. In the case of grave misalignment, the diagnostic quality of the PET or PET/CT data can be affected.
3.7.7.2. Case
A mentally retarded patient was referred for a whole body FDG-PET/CT study (Fig. 3.40). The examination was performed on an older generation PET/CT and consisted of a topogram, a spiral CT and a multi-bed emission acquisition. The CT was performed head first, whereas the PET examination was acquired feet first. As the emission scan of the upper thorax started, the patient thought that the examination was finished. Subsequently, the patient crawled out of the PET/CT scanner, having a short rest half way (see the shadow-like brain uptake superimposed on the thorax) before moving out of the scanner.

62
FIG. 3.40. Whole body FDG-PET/CT study of a mentally retarded patient. (a) Scan sequence for CT and multi-bed emission scan; (b) Contrast enhanced CT; (c) AC-PET with missing information in the head/neck region. Here, the patient moved out of the PET/CT before the entire examination was finished (it should be noted that the emission scan range in (a) was not covered during the examination). The patient rested for a moment half way, yielding a superposition of brain and thoracic uptake patterns (d). AC: attenuation corrected.
3.7.7.3. Guidance
Patients should be instructed sufficiently about the examination and any pertaining change in ambient noise/light, etc., thus reducing the chance of patient motion during the combined examination. It should be noted that patient instructions should be given prior to the injection of the patient in order to limit staff exposure. Patients should be constantly monitored by the technologist throughout the imaging session to ensure patient compliance with the study protocol.
3.8. TRUNCATION, MISMATCH OF FIELD OF VIEW
3.8.1. Truncation along the upper extremities: Example 1
3.8.1.1. Background
In a PET/CT tomograph, the transverse extents of the measured FOV of the PET and CT do not match. Typically, the PET has a transverse FOV of 60–70 cm, while the CT has a measured FOV of 50 cm. This mismatch in FOVs results in a truncation artefact visualized as a loss of AC at the edges of the PET FOV since the CT image does not cover the entire PET transverse FOV. Thus, the activity concentration in an area affected by a truncation artefact on the AC-PET image will be underestimated since no AC is applied in that region. Correction techniques for this artefact are currently available on most commercial PET/CT systems. These techniques synthetically extend the CT FOV to match that of the corresponding PET image, thereby minimizing the truncation artefacts.
3.8.1.2. Case
Figure 3.41 shows a PET/CT study of a 54 year old male with a history of metastatic melanoma of the skin. The top panel of the figure corresponds to the truncated PET/CT image sets, while the bottom panel shows the corrected images. Here, correction was applied through the extension of the transverse FOV reconstruction and using the expanded CT transmission map for the purpose of CT-AC of the corresponding PET data. Melanoma patients are usually scanned with arms down (next to the body) to assess disease involvement in the extremities. This arm positioning most often results in truncation artefacts, particularly when imaging large patients. The top

63
panel clearly shows a truncation artefact throughout the length of both arms. The lesion in the forearm (arrow) also falls in the truncated region and, hence, its activity concentration is underestimated. After applying extended FOV reconstruction, the lesion became more conspicuous and its SUV increased from 3.3 to 6.1.
FIG. 3.41. Upper panel: whole body FDG-PET/CT study of a patient positioned with arms down, demonstrating truncation artefacts along the arms. Lower panel: the same images following truncation correction with extended field of view reconstruction. From left to right: CT, AC-PET, fused AC-PET/CT and CT based attenuation map. AC: attenuation corrected.
3.8.1.3. Guidance
Truncation artefacts often occur when imaging large patients or when imaging patients arms-down. Correction techniques that extend the CT transverse FOV, which are currently available on most PET/CT scanners, should be applied to improve the conspicuity and quantitative accuracy of lesions that fall in the truncated regions. With compliant patients and whenever clinically indicated, the arms should be positioned and supported above the head of the patients for the entire PET/CT examination.
3.8.2. Truncation along the upper extremities: Example 2
3.8.2.1. Background
Over 90% of all PET/CT examinations are indicated for oncology disease. Thus, a typical PET/CT study covers a co-axial imaging range of 80–100 cm extending from the base of the skull to the upper thighs in order to screen the patient for primary and metastatic disease. Such examinations take around 30 min. In order to facilitate increased diagnostic quality, patients are positioned with their arms raised and supported above their head for the duration of the combined examination. Such positioning is standard in CT based oncology imaging in order to limit beam hardening effects (see Section 3.9.1) and truncation (see Section 3.8.1).

64
3.8.2.2. Case
This case describes residual truncation effects in the areas of the arms if they are lifted and supported above the head of the patient. Since patient positioning with the arms elevated is better tolerated if the arms are kept slightly bent rather than extended (Fig. 3.42), the elbow region may not be covered by the measured CT transverse FOV (50 cm) but still be seen by the PET transverse FOV (>60 cm).
FIG. 3.42. Patient positioning for an oncology PET/CT study with the arms raised and supported above the head.
The resulting truncation of the anatomical information can be appreciated from Fig. 3.43. When used for AC, truncated CT images (Fig. 3.43(b)) can mask the corrected PET activity distribution (Figs 3.43(c) and (d)). Retrospective correction of truncation is possible by reconstructing the CT images with an ‘extended FOV’ option (Fig. 3.43(e)). This option generates CT images of non-diagnostic quality with an estimated object representation outside the central FOV where the CT is based on the full set of projection data. When using these post-processed CT images for CT-AC, truncation artefacts in the corrected PET images can be minimized (Figs 3.43(f) and (g)). This may be important in patients with skin lesions (e.g. melanoma) or other uptake patterns near the area of truncation.
FIG. 3.43. CT truncation can be observed in arms-up scenarios ((a) and (b)). This truncation effect may propagate into the PET images following CT-AC ((c) and (d)). When reconstructing the CT images with an ‘extended field of view option’, part of the truncated anatomy can be recovered (e) and the propagation of truncation artefacts into the PET can be limited ((f) and (g)). The noAC-PET image is shown for comparison in (h). AC: attenuation corrected; noAC: not attenuation corrected.

65
3.8.2.3. Guidance
Arms-up positioning of patients should be standard in general whole body PET/CT imaging. Care should be taken during the positioning of the patients in order to find an optimum position that is tolerable to the patient for the duration of the combined examination and that, at the same time, reduces the chance of truncation effects in the regions of the maximum transverse elongation of the arms. In the case of severe truncation and scatter artefacts, retrospective reconstruction without attenuation and scatter correction is advised for comparison.
3.8.3. Truncation along the lower extremities
3.8.3.1. Background
The mismatch between the PET and CT transverse FOVs results in truncation artefacts (see Sections 3.8.1 and 3.8.2). Truncation artefacts occur most frequently at patient extremities (arms and/or legs) or peripheries when imaging large patients. Truncation artefacts may also occur in small patients when they are not positioned centrally in the FOV of the scanner. Patients with immobilizers for radiation treatment suffer the most from truncation artefacts. Some manufacturers provide PET/CT systems with extended gantry diameters (up to 85 cm) to accommodate such situations.
3.8.3.2. Case
Figure 3.44 shows a PET/CT study of a 35 year old male patient with a history of osteosarcoma in the left thigh. The patient was positioned off-centre inside the PET/CT system. The upper panel of the figure corresponds to the resulting truncated PET/CT image sets, while the lower panel shows the retrospectively corrected images. Patients with osteosarcoma most often do not have the complete ability to position their diseased extremities in a specific orientation due to the extent of disease or excessive pain. In this regard, truncation artefacts become inevitable. The upper panel clearly shows a truncation artefact of the left thigh. Part of the lesion in the left thigh (arrow) falls in the truncated region and, hence, its activity concentration is underestimated. Following correction, the SUV changed from 3.4 to 12.7.
FIG. 3.44. Upper panel: whole body FDG-PET/CT study of a patient with the diseased leg positioned off-centre, resulting in truncation artefacts in the area of the osteosarcoma. Lower panel: the same images following truncation correction with extended field of view reconstruction. From left to right: transaxial CT, AC-PET and fused AC-PET/CT. AC: attenuation corrected.

66
3.8.3.3. Guidance
Truncation artefacts often occur when imaging large patients or when imaging patients who have difficulty positioning their extremities within the transverse FOV of the scanner. Thus, attention should be paid to position the patient centrally in the measured FOV whenever possible. Correction techniques that extend the CT transverse FOV, which are available with state of the art PET/CT systems, should be applied to correct for truncation and improve the quantitative accuracy of lesions that fall in the truncated regions.
3.9. CT ARTEFACTS
3.9.1. CT beam hardening and lesion localization
3.9.1.1. Background
In CT, the X ray tube generates a spectrum of photons with energies between 30 and 140 keV depending on the tube settings (kVp) and the physical filtering of the X ray spectrum. The multi-energetic X ray beam traverses the body of the patient and the transmitted radiation is detected on the detectors opposite the X ray source. The X ray beam is attenuated on its way through the body; additional scatter may also occur.
During the course of attenuation, lower energy photons are attenuated more than higher energy photons, which leads to a shift of the spectral energy distribution towards higher photon energies. This shift is referred to as beam hardening. Beam hardening is more pronounced in the direction of increased attenuation, such as the lateral direction along the arms.
3.9.1.2. Case
Figure 3.45 illustrates the effect of X ray beam hardening on lesion localization in whole body PET/CT imaging in a patient positioned arms down along the body. Beam hardening and increased scatter cause image distortions that are visible in the dorsal portion of the trunk where they degrade the localization of a small hypermetabolic focus. The same figure shows the improved image quality (with respect to reduced image distortions) in case of positioning patients with one or both arms lifted and supported above their head.
FIG. 3.45. (a) Whole body FDG-PET/CT study of a patient positioned arms down, presenting increased beam hardening (and scatter) degrading the anatomical referencing of the small dorsal lesion shown in the axial CT and PET/CT images to the right; (b)–(d) topogram (top) and axial (bottom) CT images of patients positioned differently with their arms by the body or raised above the head, illustrating the improved image quality both in terms of reduced truncation and beam hardening.

67
3.9.1.3. Guidance
Beam hardening in CT and PET/CT can be avoided or reduced by positioning patients with their arms raised and supported above the head whenever clinically possible.
3.9.2. Ultra-low-dose CT
3.9.2.1. Background
CT scans for PET/CT imaging studies are primarily used for anatomical localization and AC of PET data. CT acquisition parameters affect the resulting CT image quality and could potentially affect the accuracy of the AC of PET data. Improving CT image quality comes primarily at the expense of increased patient exposure.
3.9.2.2. Case
A thoracic anthropomorphic phantom was filled with 18F-water and imaged on a PET/CT scanner with varying CT parameters. The phantom PET scan was performed in 3-D mode and covered three bed positions each acquired for a period of 3 min. The same PET data were then reconstructed with the different CT images.
A volume of interest was drawn in the central abdominal region and the SUV maximum, mean and standard deviation of the region were calculated. The CT scan parameters were 120 kVp with varying tube current–time products from 150 down to 5 mAs (rotation time: 0.5 s), and were repeated for 100 and 80 kVp. Figure 3.46 shows the decrease in the CT image quality with decreasing kVp and mAs settings. The figure also shows PET images for some of the CT acquisitions (red frame). Table 3.1 shows the impact of the different CT images on SUV measurements following CT-AC.
FIG. 3.46. CT and AC-PET images of an anthropomorphic phantom acquired with different kVp and mAs settings. The CT images marked with the red frame were used for CT-AC of the PET emission data shown in the lower row. AC: attenuation corrected.

68
TABLE 3.1. EFFECT OF CT ACQUISITION PARAMETERS ON MAXIMUM STANDARDIZED UPTAKE VALUE (STANDARD DEVIATION) (SUVmax (SD))
Tube current–time product (mAs)
150 25 10 5
Tube voltage (kVp) SUVmax (SD)
120 1.4 (0.1) 1.4 (0.1) 1.4 (0.1) 1.5 (0.1)
100 1.4 (0.1) 1.4 (0.1) 1.5 (0.1) 1.5 (0.1)
80 1.4 (0.1) 1.4 (0.1) 1.4 (0.1) 1.2 (0.1)
3.9.2.3. Guidance
CT parameters should be carefully chosen to balance CT image quality and patient exposure. Reducing the CT acquisition technique has a minimal effect on the PET SUV measurement, except at extremely low acquisition settings.
BIBLIOGRAPHY
BEYER, T., et al., Respiration artifacts in whole-body 18F-FDG PET/CT studies with combined PET/CT tomographs employing spiral CT technology with 1 to 16 detector rows, Eur. J. Nucl. Med. Mol. Imaging 32 (2005) 1429–1439.
BOCKISCH, A., et al., Positron emission tomography/computed tomography — imaging protocols, artifacts, and pitfalls, Mol. Imaging Biol. 6 (2004)188–199.
FAHEY, F.H., Data acquisition in PET imaging, J. Nucl. Med. Technol. 30 (2002) 39–49.
KINAHAN, P.E., et al., X ray-based attenuation correction for positron emission tomography/computed tomography scanners, Semin. Nucl. Med. 33 (2003) 166–179.
MAWLAWI, O., et al., Quantifying the effect of IV contrast media on integrated PET/CT: Clinical evaluation, AJR Am. J. Roent-genol. 186 (2006) 308–319.
MAWLAWI, O., et al., Truncation artifact on PET/CT: Impact on measurements of activity concentration and assessment of a correction algorithm, AJR Am. J. Roentgenol. 186 (2006) 1458–1467.
NAHMIAS, C., et al., Does reducing CT artifacts from dental implants influence the PET interpretation in PET/CT studies of oral cancer and head and neck cancer? J. Nucl. Med. 49 (2008) 1047–1052.
SURESHBABU, W., MAWLAWI, O., PET/CT imaging artifacts, J. Nucl. Med. Technol. 33 (2005) 156–161.
TURKINGTON, T.G., Introduction to PET instrumentation, J. Nucl. Med. Technol. 29 (2001) 4–11.

69
4. SCANNING CONDITIONS
In addition to issues with the hardware and data processing, image artefacts may arise from suboptimal patient preparation and handling of activity prior to or during the examination. Proper patient instruction, preparation and handling prior to and during the examination are key to a diagnostically useful examination.
Patient preparation and support in PET/CT imaging entails the following general steps:
— Clinical indication and communication of PET/CT examination (date, time). — Patient instructions prior to the examination (fasting, medication). — On the day of the examination: instructions on the examination procedure (steps during the acquisition, duration, processing, breathing, secondary feelings during the injection of the activity/contrast); all prior to injection of activity.
— Determination of blood glucose levels for FDG imaging. — IV FDG injection. — If clinically indicated, the patient should be provided with oral contrast for enhancement of the bowels. — Instructions should be given to rest quietly during the tracer uptake period (typically for FDG imaging) in a dimly lit room (blankets should be available).
— Just prior to the examination, the patient should be asked to void. — The patient should be positioned on the PET/CT couch according to the clinical indication (e.g. for general oncology, the arms should be supported above the head).
— If clinically indicated, the IV contrast injection system should be attached to the IV line of the patient that was used for the injection of the tracer.
— There should be communication with the patient during the course of the examination via the intercom system of the PET/CT.
— After finishing the examination, the patient should be assisted (the IV line should be taken out, the patient should be supported in getting up and getting dressed if required, and any remaining questions should be answered).
While several actions in any of the steps mentioned above can cause technical problems or lead to image artefacts, only examples of suboptimal patient preparation (e.g. injection of activity), patient handling (e.g. reattaching the contrast injector) and patient data entry errors during the protocol set-up will be given. It is recommended that both physicists and technical personnel who are engaged in these steps read about and understand the following practical examples of what may go wrong in the clinical operation of a PET/CT.
The bibliography at the end of this section provides further reading on this topic.
4.1. INJECTION CONDITIONS
4.1.1. Tracer quality assurance
4.1.1.1. Background
All PET radiopharmaceuticals undergo QC tests upon production. These radiopharmaceuticals should pass all QA tests prior to their administration to patients (with the exception of sterility tests that require several days to complete). On very rare occasions, human error affects this process and a radiopharmaceutical is released for patient use when it should not be.
4.1.1.2. Case
A 56 year old male with lymphoma was imaged following the administration of 630 MBq of FDG. Whole body PET imaging was performed in 2-D mode. The radiopharmaceutical failed the QA process; however, due to human error, this failure was not recognized prior to administering the compound to the patient. FDG, when

70
properly formulated, is not accumulated in the lungs. Figure 4.1, however, shows that the produced compound is concentrated in the lungs.
FIG. 4.1. Coronal whole body PET image of a patient injected with FDG demonstrating abnormal tracer accumulation in the lungs.
4.1.1.3. Guidance
QC and QA of radiopharmaceutical production are vital to ensure compliance with current good manufacturing practices. It is highly recommended that all radiopharmaceutical production be performed under current good manufacturing practice conditions to minimize any potential human error.
4.1.2. Subcutaneous tracer infiltration
4.1.2.1. Background
One of the advantages of PET imaging is its ability to accurately quantify the distribution of the injected tracer in the body non-invasively. This accuracy relies on several corrections during the image acquisition and reconstruction process, but also depends on the accurate knowledge of the amount of injected activity. One of the most widely used metrics in PET imaging is the SUV which is defined as:
SUV = activity concentration in a region of interest (kBq/mmL)
injected activity (MBq)/patient weight (kg) (1)
If part of the injected radioactivity is subcutaneously infiltrated during the injection process, the total amount of radioactivity delivered to the patient will not be equal to the assayed amount. As a consequence, the reported SUV measurements will not reflect the true activity concentration in regions of interest in the image.
4.1.2.2. Case
Figure 4.2 shows a whole body FDG-PET/CT study of a patient with head and neck cancer. The technologist in charge of patient injection did not realize that there was infiltration during the administration of the tracer. The ensuing PET images showed a bulky infiltration in the lower left arm. As a result, the uptake of the neck lesions was underestimated.
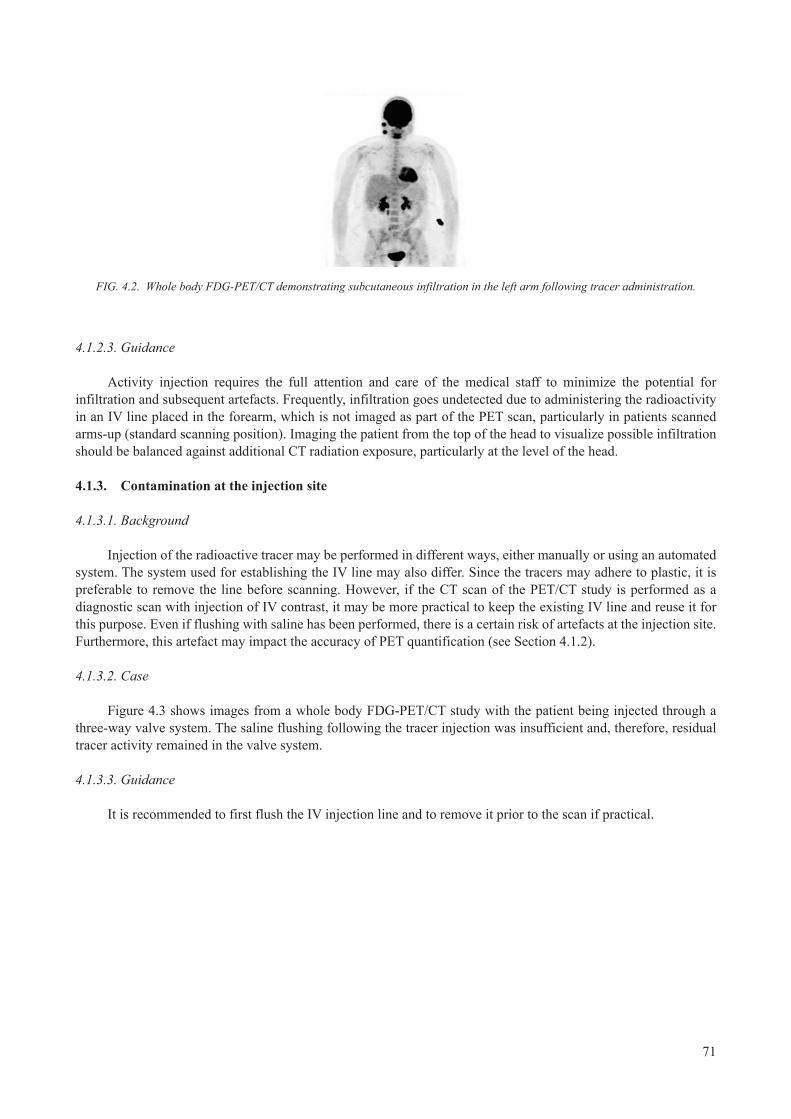
71
FIG. 4.2. Whole body FDG-PET/CT demonstrating subcutaneous infiltration in the left arm following tracer administration.
4.1.2.3. Guidance
Activity injection requires the full attention and care of the medical staff to minimize the potential for infiltration and subsequent artefacts. Frequently, infiltration goes undetected due to administering the radioactivity in an IV line placed in the forearm, which is not imaged as part of the PET scan, particularly in patients scanned arms-up (standard scanning position). Imaging the patient from the top of the head to visualize possible infiltration should be balanced against additional CT radiation exposure, particularly at the level of the head.
4.1.3. Contamination at the injection site
4.1.3.1. Background
Injection of the radioactive tracer may be performed in different ways, either manually or using an automated system. The system used for establishing the IV line may also differ. Since the tracers may adhere to plastic, it is preferable to remove the line before scanning. However, if the CT scan of the PET/CT study is performed as a diagnostic scan with injection of IV contrast, it may be more practical to keep the existing IV line and reuse it for this purpose. Even if flushing with saline has been performed, there is a certain risk of artefacts at the injection site. Furthermore, this artefact may impact the accuracy of PET quantification (see Section 4.1.2).
4.1.3.2. Case
Figure 4.3 shows images from a whole body FDG-PET/CT study with the patient being injected through a three-way valve system. The saline flushing following the tracer injection was insufficient and, therefore, residual tracer activity remained in the valve system.
4.1.3.3. Guidance
It is recommended to first flush the IV injection line and to remove it prior to the scan if practical.

72
FIG. 4.3. Left: coronal AC-PET demonstrating residual tracer accumulation in the three-way valve system. Right: a zoomed view of the CT, AC-PET and AC-PET/CT images. AC: attenuation corrected.
4.1.4. Contamination in the breast region
4.1.4.1. Background
The manual IV administration of radiotracer in PET imaging should be performed with the utmost care in order to ensure that the injectate is delivered without any contamination or infiltration. Careful administration also ensures minimal residual activity in the syringe, which aids in the accurate determination of SUV.
4.1.4.2. Case
A 54 year old female patient with colorectal cancer was injected with 392 MBq of FDG. Following injection, the technologist administering the dose accidentally contaminated the area next to the injection site with one drop of radioactivity. The contamination was only recognized at the end of the imaging session as shown in Fig. 4.4. Since the contamination was on the patient’s clothes, which had no direct contact with the patient, it caused an additional photopenic artefact consistent with that of scatter correction (see Section 3.3).
4.1.4.3. Guidance
Care should be exercised when administering radiotracer to patients to minimize the potential for contamination, which could lead to image artefacts and errors in measured activity concentration.

73
FIG. 4.4. Whole body AC-PET image demonstrating a banding artefact resulting from a left side contamination of the patient’s clothes following radiotracer administration. The truncation artefact in the elevated arms should also be noted (see Section 3.8). AC: attenuation corrected.
4.1.5. Contamination of blanket
4.1.5.1. Background
The manual IV administration of radiotracer in PET imaging should be performed with the utmost care in order to ensure that the injectate is delivered without any contamination or infiltration. Careful administration also ensures minimal residual activity in the syringe, which aids in the accurate determination of SUV.
4.1.5.2. Case
A 52 year old female patient with newly diagnosed lymphoma was injected with 380 MBq of FDG. Following injection and upon removal of the syringe, an accidental contamination of the blanket near the injection site (pelvic region) occurred (Fig. 4.5). The contamination was not recognized by the personnel performing the injection nor by the patient. The fused PET/CT image clearly shows that the area of high uptake as seen on the maximum intensity projection PET image (Fig. 4.5, arrow) is due to contamination since it is extra-corporal.
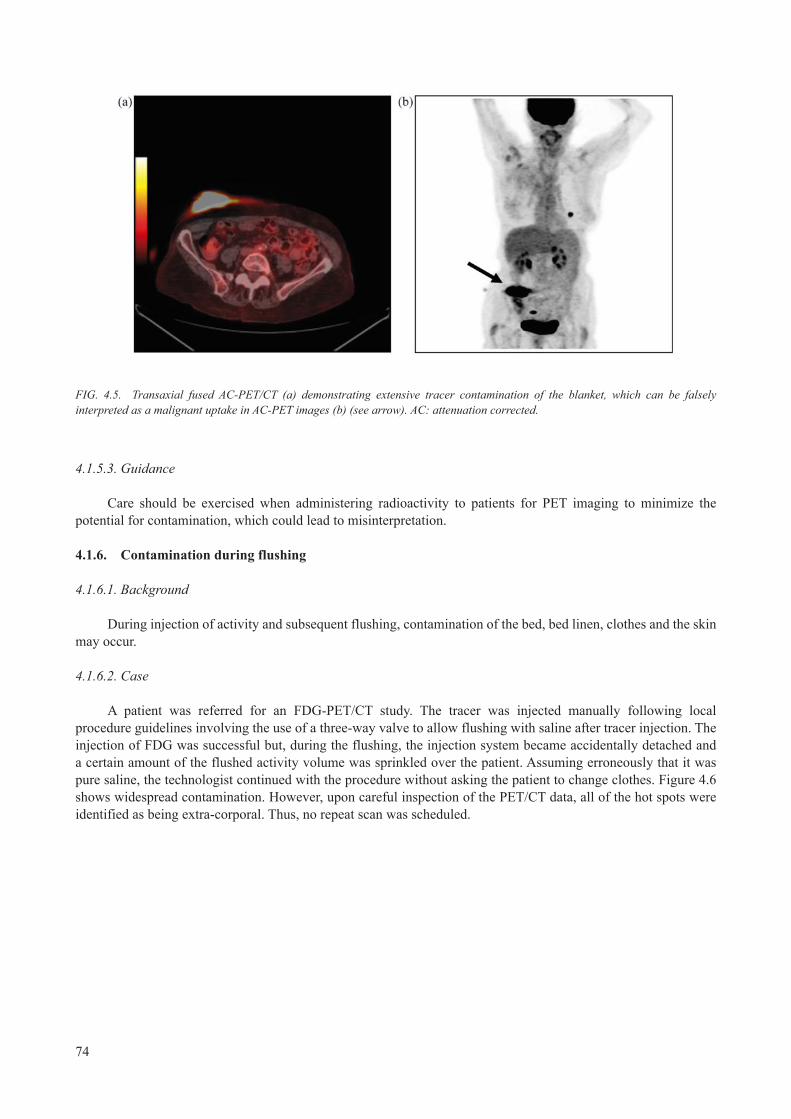
74
FIG. 4.5. Transaxial fused AC-PET/CT (a) demonstrating extensive tracer contamination of the blanket, which can be falsely interpreted as a malignant uptake in AC-PET images (b) (see arrow). AC: attenuation corrected.
4.1.5.3. Guidance
Care should be exercised when administering radioactivity to patients for PET imaging to minimize the potential for contamination, which could lead to misinterpretation.
4.1.6. Contamination during flushing
4.1.6.1. Background
During injection of activity and subsequent flushing, contamination of the bed, bed linen, clothes and the skin may occur.
4.1.6.2. Case
A patient was referred for an FDG-PET/CT study. The tracer was injected manually following local procedure guidelines involving the use of a three-way valve to allow flushing with saline after tracer injection. The injection of FDG was successful but, during the flushing, the injection system became accidentally detached and a certain amount of the flushed activity volume was sprinkled over the patient. Assuming erroneously that it was pure saline, the technologist continued with the procedure without asking the patient to change clothes. Figure 4.6 shows widespread contamination. However, upon careful inspection of the PET/CT data, all of the hot spots were identified as being extra-corporal. Thus, no repeat scan was scheduled.

75
FIG. 4.6. Extensive contamination seen on maximum intensity projection PET and localized to extra-corporal foci only on fused AC-PET/CT images. (a) Maximum intensity projection; (b) and (c) two selected coronal slices; (d) a transaxial slice through the contamination site.
4.1.6.3. Guidance
It is recommended that when injecting and flushing to always make sure that the syringe is firmly attached to the injection site. Even when flushing, it must be realized that a substantial amount of activity can be present. In the case of possible contamination, the patient’s clothes and blankets should be changed before scanning.
4.1.7. Contamination of patient couch
4.1.7.1. Background
Many radioactive tracers, including FDG, are primarily excreted through urine. Thus, in the case of a patient being incontinent during the examination, contamination of the scanner may occur.
4.1.7.2. Case
A demented patient was referred for a whole FDG-PET/CT scan. The patient was positioned on a flat radiotherapy tabletop since the PET/CT data were to be used for radiotherapy planning. The scan was started head first. Halfway through the PET scan, the technologist noticed the patient becoming restless. Upon investigation, the technologist found the patient to be incontinent and that a large amount of urine had leaked onto the bed and beyond (Fig. 4.7(a)).
The PET/CT scan was immediately terminated. The patient was asked to change clothes and the bed was subsequently cleaned before a repeat scan was initiated. Images from the repeat scan show a line of activity along the full length of the bed (Figs 4.7(b) and (c)). The line of activity is located along the couch and corresponds to a small canal which is used for positioning aids.

76
FIG. 4.7. (a) Sagittal maximum intensity projection of the first PET scan demonstrating partial contamination. Repeat PET scan demonstrates artefactual activity contamination along the patient couch. (b) and (c) Sagittal and coronal maximum intensity projections, respectively.
4.1.7.3. Guidance
In the case of bed contamination (and subsequent decontamination), it is recommended to perform a short scan to ensure that decontamination was successful. When using a hand-held monitor, the patient must be asked to leave the contaminated room.
4.1.8. Tracer uptake in internal absorber
4.1.8.1. Background
Many radioactive tracers, including FDG, are primarily excreted through urine. Patients are instructed to void immediately before scanning. Even when complying with good standards of hygiene, contamination with urine may occur in different ways, in particular if the amount of urine is small and the concentration correspondingly high.
4.1.8.2. Case
A female patient with a gynaecological cancer underwent a whole body FDG-PET/CT study. Figure 4.8 shows a focal hot spot on the PET corresponding to the vagina, thus generating suspicion of recurrent disease. Upon inspection of the fused PET/CT images, this hot spot was deemed to be incidental tracer uptake in an internal absorber.

77
FIG. 4.8. (a) Coronal and sagittal CT and PET images demonstrating a hot spot in the lower pelvis; (b) a zoom in view of the spot on CT, PET and fused PET/CT localizes the finding of tracer uptake to an internal absorber.
4.1.8.3. Guidance
In female patients, focal tracer uptake in the lower pelvis may be associated with internal absorbers.
4.2. DATA ENTRY ERRORS
4.2.1. Patient data entries
4.2.1.1. Background
Several manual data entries, such as patient weight, injected dose, injection time, residual dose and time, and their respective units, are needed for PET imaging. Any error in entering this information will lead to an error in the measurement of the SUV of the resultant scans.
4.2.1.2. Case
A 109 kg female with non-small cell lung cancer was injected with 359 MBq of FDG at 14:08. The patient has a left upper lobe lesion with an SUVmax of 4.6 (Fig. 4.9). Errors in entering patient information will result in different maximum SUVs for the lesion. Table 4.1 shows the difference in measured SUVmax depending on the type of data entry error.

78
FIG. 4.9. Coronal PET image with an upper left thoracic lesion.
TABLE 4.1. EFFECT OF VARIATION IN PATIENT ENTRIES (WEIGHT, UNITS, DOSE AND INJECTION TIME) ON MAXIMUM STANDARDIZED UPTAKE VALUE (SUVmax) MEASUREMENTS
Weight Unit Dose (MBq) Injection time SUVmax
109 kg 359 14:08 4.6
99 kg 359 14:08 4.2
109 lb 359 14:08 2.1
109 kg 433 14:08 3.8
109 kg 359 15:08 3.2
4.2.1.3. Guidance
Extreme care should be exercised when entering patient information for PET imaging. Errors in patient data entry will result in wrong SUV measurements, which could potentially alter patient management and which are difficult to identify on PET images.
4.2.2. Retrospective change of data entries
4.2.2.1. Background
Some information about the patient (name and ID) can be directly imported from the patient scheduling system to the acquisition console. However, additional information, such as the injected activity and the patient’s weight, is generally entered manually just prior to the PET/CT examination. Some systems allow the user to correct such information retrospectively after the examination.
4.2.2.2. Case
A male volunteer was injected with 200 MBq of FDG at the PET/CT scanner and a dynamic emission scan was started. After the scan was completed, the technologist noticed that the information about injected PET dose was incorrect, and wanted to correct that information before image reconstruction in order to make sure
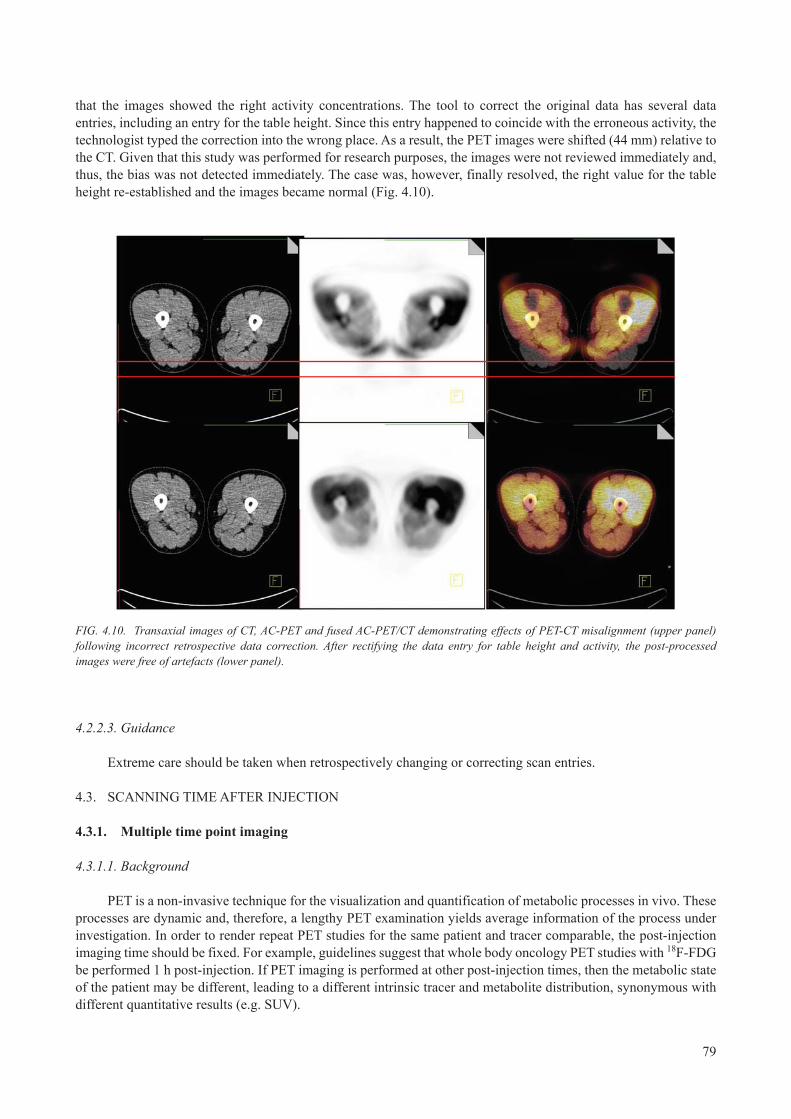
79
that the images showed the right activity concentrations. The tool to correct the original data has several data entries, including an entry for the table height. Since this entry happened to coincide with the erroneous activity, the technologist typed the correction into the wrong place. As a result, the PET images were shifted (44 mm) relative to the CT. Given that this study was performed for research purposes, the images were not reviewed immediately and, thus, the bias was not detected immediately. The case was, however, finally resolved, the right value for the table height re-established and the images became normal (Fig. 4.10).
FIG. 4.10. Transaxial images of CT, AC-PET and fused AC-PET/CT demonstrating effects of PET-CT misalignment (upper panel) following incorrect retrospective data correction. After rectifying the data entry for table height and activity, the post-processed images were free of artefacts (lower panel).
4.2.2.3. Guidance
Extreme care should be taken when retrospectively changing or correcting scan entries.
4.3. SCANNING TIME AFTER INJECTION
4.3.1. Multiple time point imaging
4.3.1.1. Background
PET is a non-invasive technique for the visualization and quantification of metabolic processes in vivo. These processes are dynamic and, therefore, a lengthy PET examination yields average information of the process under investigation. In order to render repeat PET studies for the same patient and tracer comparable, the post-injection imaging time should be fixed. For example, guidelines suggest that whole body oncology PET studies with 18F-FDG be performed 1 h post-injection. If PET imaging is performed at other post-injection times, then the metabolic state of the patient may be different, leading to a different intrinsic tracer and metabolite distribution, synonymous with different quantitative results (e.g. SUV).

80
4.3.1.2. Case
A female patient with neurological disorders presented for an FDG-PET. She was diagnosed with a low grade glioma and underwent dynamic PET imaging. Figure 4.11 shows transaxial PET images of the patient reconstructed following attenuation and scatter correction. The SUVmax in the lesion changed from 7.9 (45 min post-injection) to 10.1 (82 min post-injection) and to 12.6 (315 min post-injection), while the SUVmax of the brain changes differently at 7.8, 8.9 and 6.4, respectively, thus introducing variable lesion contrast.
FIG. 4.11. Transaxial PET images of a patient imaged at different time points post-injection: (a) 45 min, (b) 82 min and (c) 315 min. For comparison, the axial magnetic resonance post-Gd-enhancement is shown in (d). The varying contrast between the tumour and the left (visually right) hemisphere with time post-injection should be noted.
4.3.1.3. Guidance
Tracer uptake will change with the time of post-injection. These changes will depend on the tracer and the particular disease/indication. Visual tracer changes relate to changes in the quantitative values. It is important to choose the optimum time post-injection for PET imaging, and to stick to this time and acquisition protocol for patients with a given indication; this is all the more important for the same patient in follow-up. However, in selected cases, a dedicated dual-time point PET imaging protocol may be required to better separate benign or inflammatory changes from malignant processes on late phase images.
4.3.2. Microembolism
4.3.2.1. Background
FDG is a non-specific biomarker that is trapped in most cells after phosphorylation, especially in those that have increased glucose metabolism, such as tumour cells. Thus, understanding of physiological and technical factors related to FDG-PET/CT imaging is essential for interpreting these images. However, unexpected uptakes by tissues or organs may occur and need to be clarified before a report is produced.
4.3.2.2. Case
Figure 4.12 shows an unexpected 18F-FDG focus in the lung (left column) with no corresponding abnormality in the CT image of an oncology patient. This patient had a malignant lung nodule removed 2 years prior to the scan and the patient returned for follow-up. A second PET/CT scan was acquired 48 h later and showed normal pulmonary FDG distribution (right column).

81
FIG. 4.12. Left: FDG-PET/CT study demonstrating focal lung uptake consistent with suspected recurrent disease. Right: follow-up FDG-PET/CT study two days later demonstrates resolution of apparent lung lesion. The original focal uptake was presumably caused by a microembolism.
This focal uptake was caused by a microembolism formed during IV injection that got stopped in the capillaries of the lung. This focal uptake resolved prior to the repeat PET/CT scan and, thus, this patient was free of recurrent disease.
4.3.2.3. Guidance
The complete clinical history of patients scheduled for PET/CT examination should be available. Patient preparation should follow PET/CT guidelines in order to minimize the possibility of misjudgement of metastasis or nodules.
4.4. BED OVERLAP
4.4.1. Variable bed overlap
4.4.1.1. Background
The sensitivity of the PET scanner along the axial direction (z axis) is not uniform (see Section 3.2.3). Correction techniques have been implemented by all PET system manufacturers to ensure uniform sensitivity across the axial FOV. These correction techniques utilize multiplicative correction factors to increase the sensitivity of edge slices to make them similar to central slices (part of the normalization procedure). However, this approach also results in an increase in the noise content of image planes at the edge of the axial FOV. One approach to improve the sensitivity of edge image planes without increasing their corresponding noise content in whole body PET studies is to overlap contiguous bed positions in the axial direction. The extent of slice overlap in a multi-bed study is usually defined in the data acquisition protocol, with some manufacturers making this definition user selectable. The extent of slice overlap affects the quantitative accuracy of PET measurements. Slice overlap

82
in 3-D data acquisition mode is usually much larger than that in 2-D mode. Although increasing slice overlap improves the quantitative accuracy of the resultant PET images of a multi-bed position study, this increase results in a decrease in axial coverage, thereby necessitating longer scan times.
4.4.1.2. Case
A uniform flood phantom was scanned in two bed positions (axial FOV) with varying slice overlap (1, 3, 5, 7, 9, 11, 13, 15, 17 and 19). Figure 4.13 shows sagittal phantom images with different slice overlap. Images with very little slice overlap exhibit increased noise in the overlap region. As the slice overlap increases, the noise in the slice overlap region decreases.
FIG. 4.13. Sagittal PET images of a uniform phantom demonstrating the effect of increasing slice overlap on the PET image quality.
A plot of the mean, maximum and standard deviation (noise) of the SUV versus amount of slice overlap in a 9 cm region of interest drawn in the central overlap region is shown in Fig. 4.14. This figure clearly shows the decrease in image noise with increasing slice overlap.
FIG. 4.14. Plot of maximum (max) and mean standardized uptake value (SUV), and noise versus slice overlap of the uniform phantom.

83
Figure 4.15 shows a clinical case where the bed overlap was incidentally set to 1 instead of 11 image planes. The coronal PET views show bands of increased noise corresponding to consecutive bed positions.
FIG. 4.15. Coronal image planes of CT (a), noAC-PET (b), AC-PET (c) and fused AC-PET/CT (d) demonstrating bands of increased noise in the area of bed overlap (red arrows). AC: attenuation corrected; noAC: not attenuation corrected.
4.4.1.3. Guidance
Slice overlap affects the image quality and the quantitative accuracy of PET images. For scanners that allow user selectable slice overlap, the slice overlap should be preset for each protocol while balancing the trade-off between image quality/quantitative accuracy and scan duration. Changing the slice overlap for different patient studies is highly discouraged.
4.4.2. Insufficient bed overlap
4.4.2.1. Background
PET/CT studies consist of a CT scan followed by PET imaging of the same part of the body. Consecutive bed positions are needed to cover extended axial imaging ranges in PET. These consecutive bed positions are required to overlap slightly to account for the diminished sensitivity at the edge planes of the axial FOV. The amount of bed overlap depends on the PET acquisition mode (2-D versus 3-D) as well as other manufacturer specifications.
4.4.2.2. Case
Figure 4.16 shows a PET/CT patient study with two overlapping bed positions. The recommended slice overlap was supposed to be five slices but only one slice overlap was utilized in this study. Figure 4.17 further demonstrates the reduced diagnostic quality of PET/CT data in the insufficient bed overlap region.

84
FIG. 4.16. Coronal CT (a), AC-PET (b) and fused AC-PET/CT (c). The arrow points to the area of increased noise level in the bed overlap region. AC: attenuation corrected.
FIG. 4.17. Transaxial AC-PET (a) and fused AC-PET/CT (b) images from the overlapped region marked by the arrow in Fig. 4.16. AC: attenuation corrected.
4.4.2.3. Guidance
The extent of bed overlap recommended by the manufacturer should be followed. Routine verification of PET/CT protocols should be performed.
4.5. BLADDER ARTEFACTS
4.5.1. Bladder artefacts: Example 1
4.5.1.1. Background
In PET/CT imaging, an intrinsic alignment of human anatomy and functional information is assumed. In the case of patient or organ movement, this assumption is no longer true and the spatial alignment is construed. This becomes obvious in the case of the bladder in PET/CT imaging.
4.5.1.2. Case
A patient was referred for a gynaecological PET/CT study (Fig. 4.18). Following the topogram scan, a spiral CT was acquired in the caudo-cranial direction, while the subsequent emission scan was conducted in the cranio-caudal direction. Thus, the time difference between the CT and the PET acquisition of the bladder region was 20 min. During this period, a considerable change in bladder filling took place, with a clearly visible change in

85
bladder size on the CT and PET images. Correspondingly, the focal lesion that is visible on AC-PET is moved by several centimetres and is localized incorrectly to the intestines that are partially filled with oral CT contrast.
FIG. 4.18. Maximum intensity projection (a), sagittal CT (b), sagittal AC-PET (c) and fused AC-PET/CT (d) demonstrating the change in bladder volume between CT and PET, and subsequent lesion displacement. AC: attenuation corrected.
4.5.1.3. Guidance
It is recommended to minimize the time difference between CT and PET coverage of the bladder region. In whole body PET/CT imaging, the PET examination should be performed in the caudo-cranial direction. Irrespectively, it is necessary to be aware of intra-scan changes in bladder volume.
4.5.2. Bladder artefacts: Example 2
4.5.2.1. Background
Whole body PET/CT imaging protocols typically consist of a topogram, a continuous, spiral CT and a multi-bed emission acquisition. The CT is normally acquired in the cranio-caudal direction, whereas the emission acquisition is started at the pelvic region, moving the patient stepwise into the PET FOV towards the cranial region. This reverse order of CT and PET scanning should help to limit excessive tracer and metabolite accumulation in the bladder, as well as to improve the alignment of the urinary system and the bladder in both CT and PET.
4.5.2.2. Case
Figure 4.19 shows a case of an oncology patient undergoing whole body FDG-PET/CT imaging. Since an older PET/CT system was used, the emission scan time was rather long at 5 min per bed position. In addition, the patient did not void prior to the examination. Part of the bladder was covered in the first bed position. When the patient was moved to the next bed position, the bladder expanded further from urinary excretion and the superior part of the bladder was again in the FOV, leading to the appearance of a potential lesion above the bladder.

86
FIG. 4.19. (a) Imaging sequence of whole body PET/CT; (b) maximum intensity projection images of AC-PET of a patient undergoing an FDG-PET/CT. The bladder was covered in two contiguous bed positions and the filling of the bladder increased during the lengthy imaging examination, leading to an asymmetrically expanded ‘hypermetabolic’ activity distribution in the vicinity of the bladder.
4.5.2.3. Guidance
Patients scheduled for PET and PET/CT imaging must void prior to the examination. Shorter examination times may help reduce the likelihood of significant changes in the volume of the bladder during the course of the examination.
BIBLIOGRAPHY
BEYER, T., et al., Variations in clinical PET/CT operations: Results of an international survey of active PET/CT users, J. Nucl. Med. 52 2 (2011) 303–310.
BOELLAARD, R., et al., FDG PET and PET/CT: EANM procedure guidelines for tumour PET imaging: version 1.0, Eur. J. Nucl. Med. Mol. Imaging 37 1 (2010) 181–200.
DELBEKE, D., et al., Procedure guideline for tumor imaging with 18F-FDG PET/CT 1.0, J. Nucl. Med. 47 5 (2006) 885–895.
KRAUSE, B.J., et al., FDG-PET/CT in oncology. German guideline, Nuklearmedizin 46 6 (2007) 291–301.
SOCIETY OF NUCLEAR MEDICINE, Procedure Guideline for FDG PET Brain Imaging, Version 1.0, http://interactive.snm.org/docs/Society%20of%20Nuclear%20Medicine%20Procedure%20Guideline%20for%20FDG%20PET%20Brain%20Imaging.pdf
STAUSS, J., et al., Guidelines for 18F-FDG PET and PET-CT imaging in paediatric oncology, Eur. J. Nucl. Med. Mol. Imaging 35 (2008) 1581–1588.
VARRONE, A., et al., EANM procedure guidelines for PET brain imaging using [18F]FDG, version 2, Eur. J. Nucl. Med. Mol. Imaging 36 (2009) 2103–2110.

87
ABBREVIATIONS
AAPM American Association of Physicists in MedicineAC attenuation correction (or corrected)ACR American College of RadiologyBGO bismuth germanateBMI body mass index CT computed tomography CT-AC computed tomography based attenuation correctionDQA daily quality assurance EANM European Association of Nuclear MedicineEm emissionFBP filtered back projectionFDG fluorodeoxyglucoseFOV field of view FWHM full width at half maximum GE General ElectricHU Hounsfield unitIEC International Electrotechnical Commission IV intravenousLOR line of responseLSO lutetium oxyorthosilicateNEMA National Electrical Manufacturers Association noAC not attenuation correctedOSEM ordered-subsets expectation-maximizationPET positron emission tomographyPSF point spread functionPVE partial volume effectQA quality assuranceQC quality controlSNR signal to noise ratioSUV standardized uptake valueTOF time of flightTX transmission


89
CONTRIBUTORS TO DRAFTING AND REVIEW
Andersen, F. Rigshospitalet Copenhagen University Hospital, Denmark
Antoch, G. University Hospital Essen, Germany
Belohlavek, O. Na Homolce Hospital Prague, Czech Republic
Beyer, T. cmi-experts GmbH, Switzerland
Boanova, L.G. Hospital Mae de Deus, Brazil
Bockisch, A. University Hospital Essen, Germany
Boellaard, R. VU University Medical Center Amsterdam, Netherlands
Christensen, A.N. Rigshospitalet Copenhagen University Hospital, Denmark
Dahlbom, M. University of California, Los Angeles, United States of America
Delis, H. International Atomic Energy Agency
Desousa, A.L. Hospital Sírio-Libanês, Brazil
Herzog, H. Forschungszentrum Jülich, Germany
Holm, S. Rigshospitalet Copenhagen University Hospital, Denmark
Jødal, L. Aalborg University Hospital, Denmark
Kabickova, E. Na Homolce Hospital Prague, Czech Republic
Kalemis, A. Philips Healthcare, United Kingdom
Kinahan, P. University of Washington, United States of America
Loft, A. Rigshospitalet Copenhagen University Hospital, Denmark
Löfgren, J. Rigshospitalet Copenhagen University Hospital, Denmark
Machado, M. Monte Tabor-Hospital São Rafael, Brazil
Mawlawi, O. MD Anderson Cancer Center, United States of America
Muzi, M. University of Washington, United States of America
Palm, S. International Atomic Energy Agency
Pan, T. MD Anderson Cancer Center, United States of America
Poli, G.L. International Atomic Energy Agency
Ribeiro, M.J. French Alternative Energies and Atomic Energy Commission/Service Hospitalier Frédéric Joliot, France
Robilotta, C.C. University of São Paulo, Brazil
Schäfers, K. University of Münster, Germany
Teles Garcez, A. University of São Paulo, Brazil
Townsend, D. Singapore Bioimaging Consortium, Singapore


@ No. 23
ORDERING LOCALLYIn the following countries, IAEA priced publications may be purchased from the sources listed below or from major local booksellers.
Orders for unpriced publications should be made directly to the IAEA. The contact details are given at the end of this list.
AUSTRALIADA Information Services648 Whitehorse Road, Mitcham, VIC 3132, AUSTRALIA Telephone: +61 3 9210 7777 Fax: +61 3 9210 7788 Email: [email protected] Web site: http://www.dadirect.com.au
BELGIUMJean de LannoyAvenue du Roi 202, 1190 Brussels, BELGIUM Telephone: +32 2 5384 308 Fax: +32 2 5380 841 Email: [email protected] Web site: http://www.jean-de-lannoy.be
CANADARenouf Publishing Co. Ltd.5369 Canotek Road, Ottawa, ON K1J 9J3, CANADA Telephone: +1 613 745 2665 Fax: +1 643 745 7660 Email: [email protected] Web site: http://www.renoufbooks.com
Bernan Associates4501 Forbes Blvd., Suite 200, Lanham, MD 20706-4391, USA Telephone: +1 800 865 3457 Fax: +1 800 865 3450 Email: [email protected] Web site: http://www.bernan.com
CZECH REPUBLICSuweco CZ, spol. S.r.o.Klecakova 347, 180 21 Prague 9, CZECH REPUBLIC Telephone: +420 242 459 202 Fax: +420 242 459 203 Email: [email protected] Web site: http://www.suweco.cz
FINLANDAkateeminen KirjakauppaPO Box 128 (Keskuskatu 1), 00101 Helsinki, FINLAND Telephone: +358 9 121 41 Fax: +358 9 121 4450 Email: [email protected] Web site: http://www.akateeminen.com
FRANCEForm-Edit5 rue Janssen, PO Box 25, 75921 Paris CEDEX, FRANCE Telephone: +33 1 42 01 49 49 Fax: +33 1 42 01 90 90 Email: [email protected] Web site: http://www.formedit.fr
Lavoisier SAS14 rue de Provigny, 94236 Cachan CEDEX, FRANCE Telephone: +33 1 47 40 67 00 Fax: +33 1 47 40 67 02 Email: [email protected] Web site: http://www.lavoisier.fr
L’Appel du livre99 rue de Charonne, 75011 Paris, FRANCE Telephone: +33 1 43 07 50 80 Fax: +33 1 43 07 50 80 Email: [email protected] Web site: http://www.appeldulivre.fr
GERMANYGoethe Buchhandlung Teubig GmbHSchweitzer Fachinformationen Willstätterstrasse 15, 40549 Düsseldorf, GERMANY Telephone: +49 (0) 211 49 8740 Fax: +49 (0) 211 49 87428 Email: [email protected] Web site: http://www.goethebuch.de
HUNGARYLibrotade Ltd., Book ImportPF 126, 1656 Budapest, HUNGARY Telephone: +36 1 257 7777 Fax: +36 1 257 7472 Email: [email protected] Web site: http://www.librotade.hu

INDIAAllied Publishers1st Floor, Dubash House, 15, J.N. Heredi Marg, Ballard Estate, Mumbai 400001, INDIA Telephone: +91 22 2261 7926/27 Fax: +91 22 2261 7928 Email: [email protected] Web site: http://www.alliedpublishers.com
Bookwell3/79 Nirankari, Delhi 110009, INDIA Telephone: +91 11 2760 1283/4536 Email: [email protected] Web site: http://www.bookwellindia.com
ITALYLibreria Scientifica “AEIOU”Via Vincenzo Maria Coronelli 6, 20146 Milan, ITALY Telephone: +39 02 48 95 45 52 Fax: +39 02 48 95 45 48 Email: [email protected] Web site: http://www.libreriaaeiou.eu
JAPANMaruzen Co., Ltd.1-9-18 Kaigan, Minato-ku, Tokyo 105-0022, JAPAN Telephone: +81 3 6367 6047 Fax: +81 3 6367 6160 Email: [email protected] Web site: http://maruzen.co.jp
NETHERLANDSMartinus Nijhoff InternationalKoraalrood 50, Postbus 1853, 2700 CZ Zoetermeer, NETHERLANDS Telephone: +31 793 684 400 Fax: +31 793 615 698 Email: [email protected] Web site: http://www.nijhoff.nl
Swets Information Services Ltd.PO Box 26, 2300 AA LeidenDellaertweg 9b, 2316 WZ Leiden, NETHERLANDS Telephone: +31 88 4679 387 Fax: +31 88 4679 388 Email: [email protected] Web site: http://www.swets.com
SLOVENIACankarjeva Zalozba ddKopitarjeva 2, 1515 Ljubljana, SLOVENIA Telephone: +386 1 432 31 44 Fax: +386 1 230 14 35 Email: [email protected] Web site: http://www.mladinska.com/cankarjeva_zalozba
SPAINDiaz de Santos, S.A.Librerias Bookshop Departamento de pedidos Calle Albasanz 2, esquina Hermanos Garcia Noblejas 21, 28037 Madrid, SPAIN Telephone: +34 917 43 48 90 Fax: +34 917 43 4023 Email: [email protected] Web site: http://www.diazdesantos.es
UNITED KINGDOMThe Stationery Office Ltd. (TSO)PO Box 29, Norwich, Norfolk, NR3 1PD, UNITED KINGDOM Telephone: +44 870 600 5552 Email (orders): [email protected] (enquiries): [email protected] Web site: http://www.tso.co.uk
UNITED STATES OF AMERICABernan Associates4501 Forbes Blvd., Suite 200, Lanham, MD 20706-4391, USA Telephone: +1 800 865 3457 Fax: +1 800 865 3450 Email: [email protected] Web site: http://www.bernan.com
Renouf Publishing Co. Ltd.812 Proctor Avenue, Ogdensburg, NY 13669, USA Telephone: +1 888 551 7470 Fax: +1 888 551 7471 Email: [email protected] Web site: http://www.renoufbooks.com
United Nations300 East 42nd Street, IN-919J, New York, NY 1001, USA Telephone: +1 212 963 8302 Fax: 1 212 963 3489 Email: [email protected] Web site: http://www.unp.un.org
Orders for both priced and unpriced publications may be addressed directly to:IAEA Publishing Section, Marketing and Sales Unit, International Atomic Energy Agency Vienna International Centre, PO Box 100, 1400 Vienna, Austria Telephone: +43 1 2600 22529 or 22488 • Fax: +43 1 2600 29302 Email: [email protected] • Web site: http://www.iaea.org/books

14-0
3011

IAEA HUMAN HEALTH SERIES PUBLICATIONS
The mandate of the IAEA human health programme originates from Article II of its Statute, which states that the “Agency shall seek to accelerate and enlarge the contribution of atomic energy to peace, health and prosperity throughout the world”. The main objective of the human health programme is to enhance the capabilities of IAEA Member States in addressing issues related to the prevention, diagnosis and treatment of health problems through the development and application of nuclear techniques, within a framework of quality assurance.
Publications in the IAEA Human Health Series provide information in the areas of: radiation medicine, including diagnostic radiology, diagnostic and therapeutic nuclear medicine, and radiation therapy; dosimetry and medical radiation physics; and stable isotope techniques and other nuclear applications in nutrition. The publications have a broad readership and are aimed at medical practitioners, researchers and other professionals. International experts assist the IAEA Secretariat in drafting and reviewing these publications. Some of the publications in this series may also be endorsed or co-sponsored by international organizations and professional societies active in the relevant fields. There are two categories of publications in this series:
IAEA HUMAN HEALTH SERIESPublications in this category present analyses or provide information of an
advisory nature, for example guidelines, codes and standards of practice, and quality assurance manuals. Monographs and high level educational material, such as graduate texts, are also published in this series.
IAEA HUMAN HEALTH REPORTSHuman Health Reports complement information published in the IAEA Human
Health Series in areas of radiation medicine, dosimetry and medical radiation physics, and nutrition. These publications include reports of technical meetings, the results of IAEA coordinated research projects, interim reports on IAEA projects, and educational material compiled for IAEA training courses dealing with human health related subjects. In some cases, these reports may provide supporting material relating to publications issued in the IAEA Human Health Series.
All of these publications can be downloaded cost free from the IAEA web site:http://www.iaea.org/Publications/index.html
Further information is available from:Marketing and Sales UnitInternational Atomic Energy AgencyVienna International CentrePO Box 1001400 Vienna, Austria
Readers are invited to provide their impressions on these publications. Information may be provided via the IAEA web site, by mail at the address given above, or by email to:
RELATED PUBLICATIONS
www.iaea.org/books
QUALITY ASSURANCE FOR PET AND PET/CT SYSTEMS IAEA Human Health Series No. 1STI/PUB/1393 (145 pp.; 2009)ISBN 978–92–0–103609–4 Price: €32.00
IAEA QUALITY CONTROL ATLAS FOR SCINTILLATION CAMERA SYSTEMSSTI/PUB/1141 (293 pp.; 2003)ISBN 92–0–101303–5 Price: €99.00
RADIATION PROTECTION IN NEWER MEDICAL IMAGING TECHNIQUES: PET/CT Safety Reports Series No. 58STI/PUB/1343 (41 pp.; 2008)ISBN 978–92–0–106808–8 Price: €28.00
PLANNING A CLINICAL PET CENTREIAEA Human Health Series No. 11STI/PUB/1457 (146 pp.; 2010)ISBN 978–92–0–104610–9 Price: €42.00
QUANTITATIVE NUCLEAR MEDICINE IMAGING: CONCEPTS, REQUIREMENTS AND METHODSIAEA Human Health Reports No. 9STI/PUB/1605 (59 pp.; 2014)ISBN 978–92–0–141510–3 Price: €33.00
NUCLEAR MEDICINE PHYSICS: A HANDBOOK FOR TEACHERS AND STUDENTSSTI/PUB/1617 (forthcoming)ISBN 978–92–0–143810–2

INTERNATIONAL ATOMIC ENERGY AGENCYVIENNA
ISBN 978–92–0–101014–8ISSN 2075–3772
PE
T/C
T A
tlas on Q
uality Co
ntrol and
Imag
e Artefacts
This publication is an atlas on quality control and PET/CT artefacts, providing guidance on the physics and technical aspects behind PET and PET/CT image distortions. It presents an assortment of cases with examples of possible image distortions and errors, with explanations as to the causes of and solutions to each individual image problem. This publication will be especially useful to medical physicists, physicians, technologists and service engineers in the clinical fi eld.
No. 27
IAEA HUMAN HEALTH SERIES No. 27
PET/CT Atlas on Quality Control and Image Artefacts
PE
T/C
T A
tlas on Q
uality Co
ntrol and
Imag
e Artefacts
IAEA HUMAN HEALTH SERIES IAEA HUMAN HEALTH SERIES