peters & company investor...
TRANSCRIPT

1
Your investment in Flint gives you a
at every unconventional energy play in North America
FRONT ROW SEAT
Peters & CompanyInvestor BriefingJanuary 24, 2012

Company Presentation
2
PaulM.BoechlerExecutiveVicePresident&CFO
GuyCocquytVicePresidentCommunications
Shell Albian Sands – Flint’s largest oil sands infrastructure project to date

3
Flint’s Strategy - “Build it then Maintain it”Trading and Financial Indicators
$19.99 - $9.08 FES Share Price (High/Low)(high 2/22/11, low 9/26/11)
48.0 Million Basic Shares Outstanding
$691 Million Market Capitalization (as of Jan 24, 2012)
$1,781 Million in Annual Revenue (2010)
$131 Million in Annual EBITDA(2010)
$33 Million in Annual Net Earnings (2010)
$2.88 Annual EBITDA per Share (2010)
$80 Million cash holdings as of Sep 30, 2011
TSX:
FES
4
Forward-Looking Information Statement
Thispresentationcontainsforward‐lookingstatementsconcerningtheCompany’sprojectedoperatingresultsandanticipatedcapitalexpendituretrendsanddrillingactivityintheoilandgasindustry.ActualeventsorresultsmaydiffermateriallyfromthosereflectedintheCompany’sforward‐lookingstatementsduetoanumberofrisks,uncertaintiesandotherfactorsaffectingtheCompany’sbusinessandtheoilandgasindustrygenerally.Theseriskfactorsinclude,butarenotlimitedtorisksanduncertaintiesdescribedundertheheading“RiskFactors”andelsewhereintheCompany’sAnnualInformationFormfortheyearendedDecember31,2010,andotherdocumentsfiledwithCanadianprovincialsecuritiesauthorities,whichareavailabletothepublicatwww.sedar.com.Unlessotherwiseindicated,allfinancialinformationinthispresentationisinCanadiandollarsandinaccordancewithCanadiangenerallyacceptedaccountingprinciples.
5
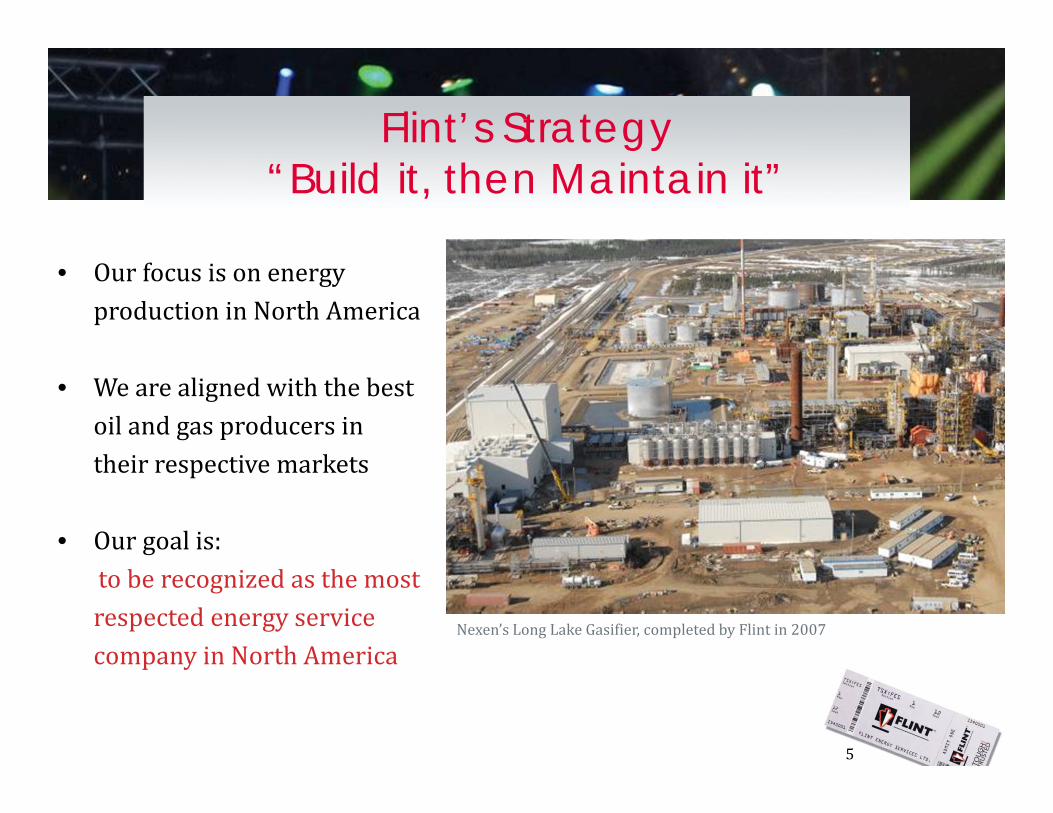
• OurfocusisonenergyproductioninNorthAmerica
• Wearealignedwiththebestoilandgasproducersintheirrespectivemarkets
• Ourgoalis:toberecognizedasthemostrespectedenergyservicecompanyinNorthAmerica
Nexen’sLongLakeGasifier,completedbyFlintin2007
Flint’s Strategy“Build it, then Maintain it”

6
Full-Cycle Services
OILFIELD SERVICES
PRODUCTIONSERVICES
FACILITY INFRASTRUCTURE
MAINTENANCESERVICES
UpstreamDrilling DownstreamRefining
Earlycycle Latecycle
MidstreamProduction
Transportation,Construction,Manufacturing&Maintenance
100% Oil sands Exposure35% Oil sands 15% Oilsands

Transportation Activities
TopL:RigMove,MarcellusBasin,PATopR:P&V,ColdLake,ABBottomL:NewRigMovingOffice,Texas
7
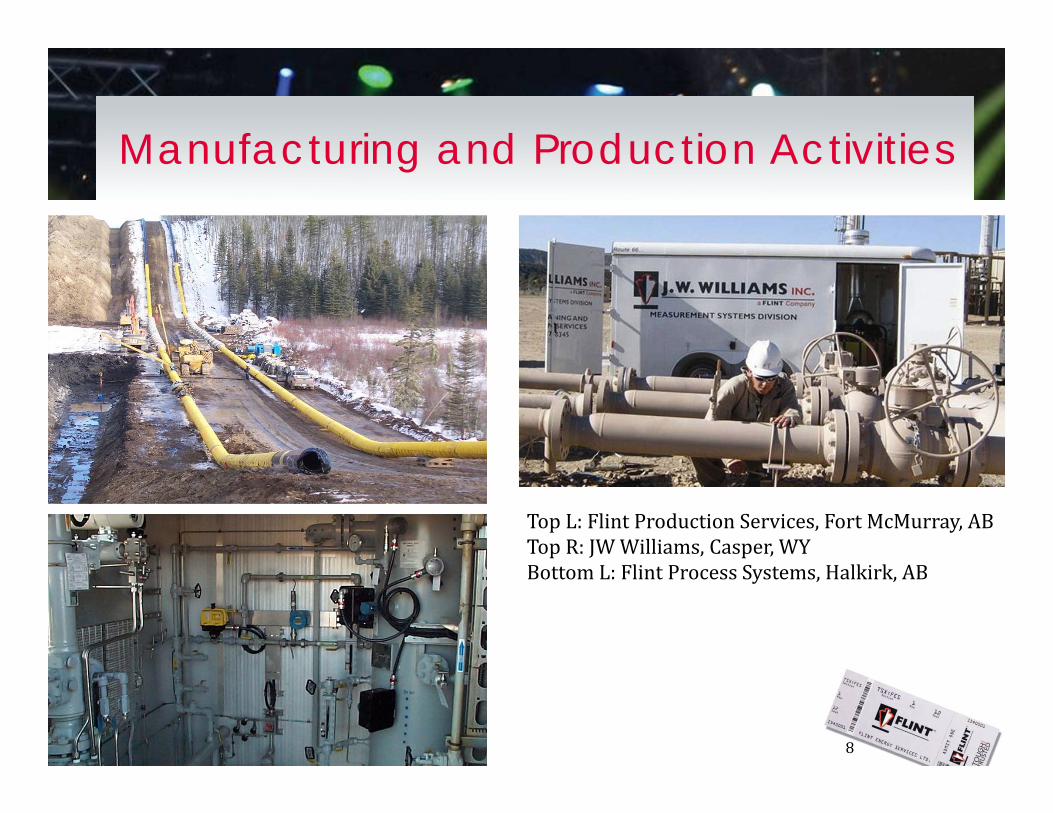
Manufacturing and Production Activities
TopL:FlintProductionServices,FortMcMurray,ABTopR:JWWilliams,Casper,WYBottomL:FlintProcessSystems,Halkirk,AB
Add paint earth
8

9
Fabrication & Module Construction Activities
TopL:Shell’sAlbianSandsProject,NEABTopR:Statoil’sLeismerProjectBottom:ModuleFabrication,SherwoodPark,AB
10
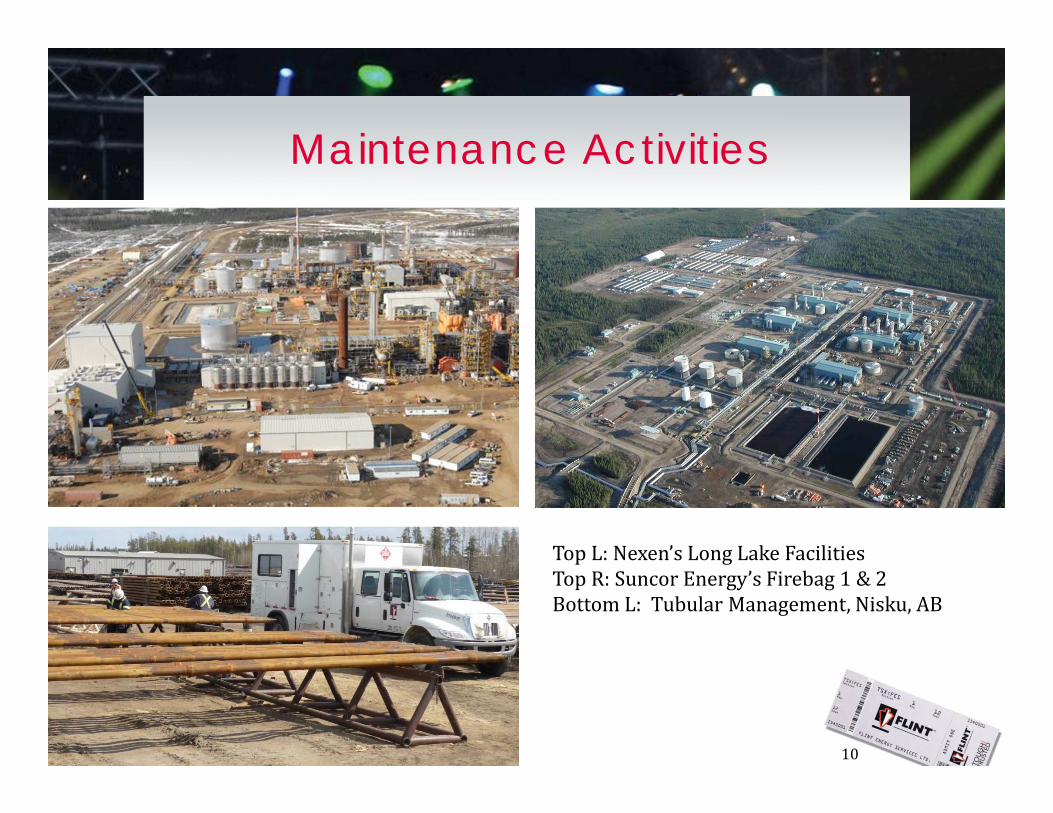
Maintenance Activities
TopL:Nexen’sLongLakeFacilitiesTopR:SuncorEnergy’sFirebag1&2BottomL:TubularManagement,Nisku,ABAdd tubular management

11
2010 Revenue by Segment
Total Revenues $1,334 millionEBITDA(1) $97 million
Amounts in C$ millions
Production Services$645 million in Revenue
$55 million in EBITDA
Facility Infrastructure$212 million in Revenue
$16 million in EBITDA
Oilfield Services$232 million in Revenue
$41 million in EBITDA
Maintenance Services$246 million in Revenue
$21 million in EBITDA
USA
Canada
$246.2 million Revenues$12.0 million EBITDA
23% of revenues arefrom US operations
2011 - 9 Month SegmentRevenue & EBITDA
1. Segment EBITDA before corporate allocations was $133 million
Canada
USARevenue$416 millionEBITDA $29 million Revenue
$229 millionEBITDA$26 million
12
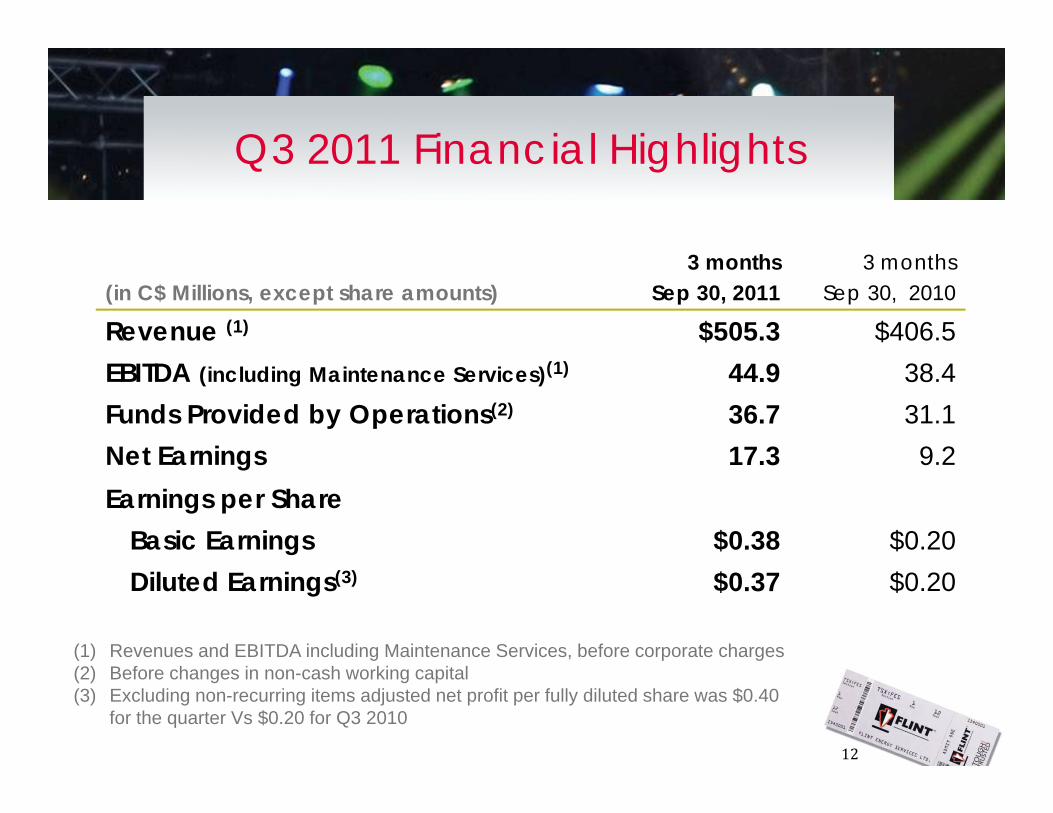
(in C$ Millions, except share amounts)3 months
Sep 30, 20113 months
Sep 30, 2010
Revenue (1) $505.3 $406.5EBITDA (including Maintenance Services)(1) 44.9 38.4Funds Provided by Operations(2) 36.7 31.1Net Earnings 17.3 9.2Earnings per Share
Basic Earnings $0.38 $0.20Diluted Earnings(3) $0.37 $0.20
(1) Revenues and EBITDA including Maintenance Services, before corporate charges(2) Before changes in non-cash working capital(3) Excluding non-recurring items adjusted net profit per fully diluted share was $0.40
for the quarter Vs $0.20 for Q3 2010
Q3 2011 Financial Highlights
13
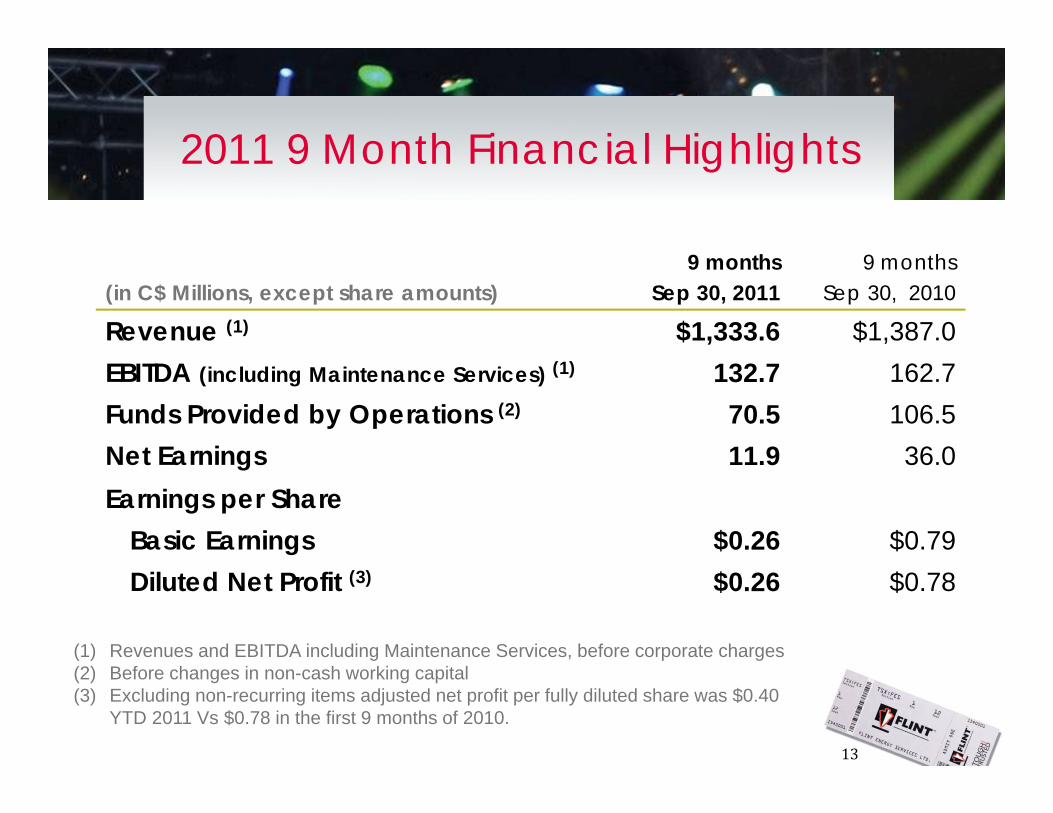
(in C$ Millions, except share amounts)9 months
Sep 30, 20119 months
Sep 30, 2010
Revenue (1) $1,333.6 $1,387.0EBITDA (including Maintenance Services) (1) 132.7 162.7Funds Provided by Operations (2) 70.5 106.5Net Earnings 11.9 36.0Earnings per Share
Basic Earnings $0.26 $0.79Diluted Net Profit (3) $0.26 $0.78
(1) Revenues and EBITDA including Maintenance Services, before corporate charges(2) Before changes in non-cash working capital(3) Excluding non-recurring items adjusted net profit per fully diluted share was $0.40
YTD 2011 Vs $0.78 in the first 9 months of 2010.
2011 9 Month Financial Highlights
14
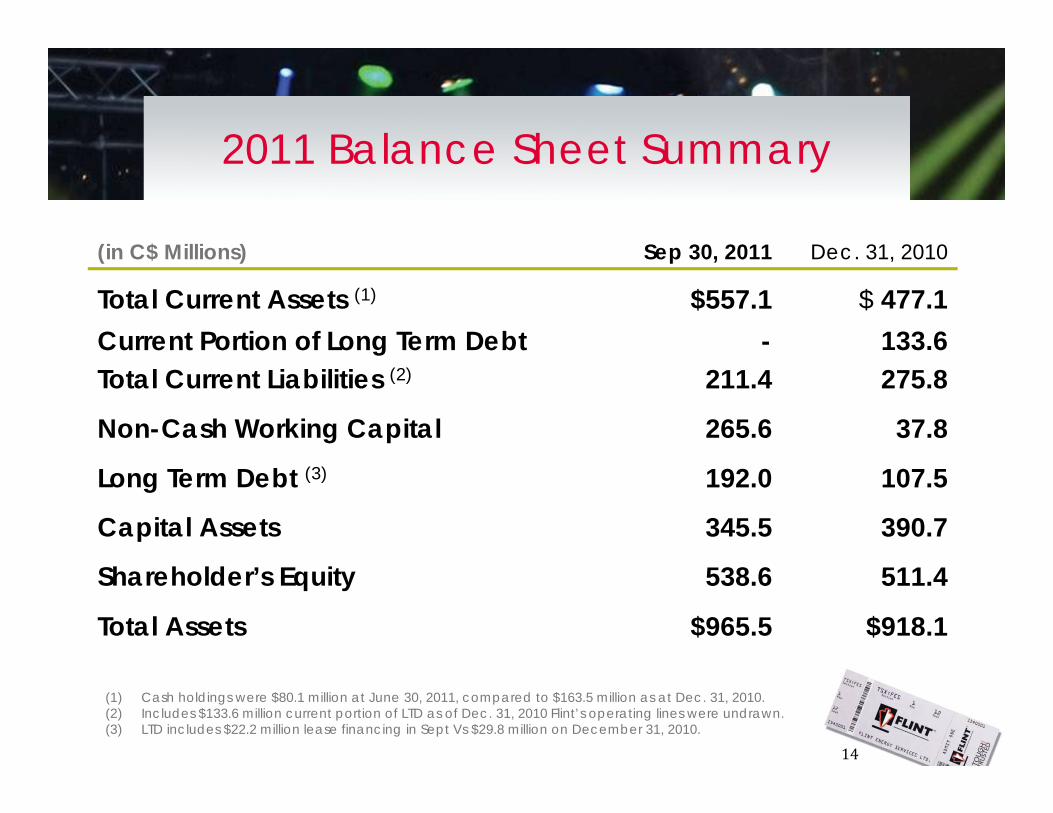
(in C$ Millions) Sep 30, 2011 Dec. 31, 2010
Total Current Assets (1) $557.1 $ 477.1Current Portion of Long Term DebtTotal Current Liabilities (2)
-211.4
133.6275.8
Non-Cash Working Capital 265.6 37.8
Long Term Debt (3) 192.0 107.5
Capital Assets 345.5 390.7
Shareholder’s Equity 538.6 511.4
Total Assets $965.5 $918.1
(1) Cash holdings were $80.1 million at June 30, 2011, compared to $163.5 million as at Dec. 31, 2010. (2) Includes $133.6 million current portion of LTD as of Dec. 31, 2010 Flint’s operating lines were undrawn. (3) LTD includes $22.2 million lease financing in Sept Vs $29.8 million on December 31, 2010.
2011 Balance Sheet Summary

15
$-
$250
$500
$750
$1,000
$1,250
$1,500
$1,750
$2,000
$2,250
$2,500
2005 2006 2007 2008 2009 2010 2011* 2012*
Production Infrastructure Oilfield Maintenance
Annual Revenues by Segment
*2011 & 2012 forecast based upon covering analyst’s published estimates, Nov 7, 2011

16
Unconventional Opportunities
Regional Growth OpportunitiesRig MovingBakkenMarcellusN.E.B.C.Texas&Louisiana
Pressure & Vacuum, Fluid HaulingBakkenTexas
Major Facilities ProjectsContinentalUnitedStates
Maintenance ContractsOilsandsRefineriesOtherindustrial
Production ServicesFillgapsinregionalservicedeliveryAddcomplementaryservicelines
Woodford, Fayetteville & HaynesvilleShale Gas
Montney & Horn River Shale Gas
Bakken Shale Oil Marcellus Shale Gas
Heavy Oil & Bitumen
East CoastOffshore
Arctic Gas
Barnett, Eagle Ford Shale Gas
82 + operating centres
11,000 + employees
Unconventional Opportunities
Flint Headquarters – Calgary & Houston
Carson Energy Services operational footprint

17
• US&Canadiandrillingactivityincreased25%in2011andisforecasttoincrease13%in2012
• Afterslowfirsthalf,mid‐streamcapitalspendinghaspickedupinbothCanadaandtheUSinQ4andQ12012
• Oilsandscapitalspendingisprojectedtoincreaseto$16billion,up20%
• WTIcrudeoilisforecasttoaveragebetween$95and$105overthenext5years
• Naturalgasisexpectedremainbelow$5/Mmbuthrough2017
2011/12 Forecast Update
24 inch pipeline installation near Fort McMurray, AB
70 acre module fabrication yard, Sherwood Park, AB
Sources: Spears & Associates Dec, 2011,CAPP June 2010, Oilsands Review, Nickle’s DOB Jan. 6, 2011

18
2010 Actual348 average rigs 11,176 wells
2011 Forecast 424 average rigs 14,252 wells
2012 Forecast 472 average rigs15,975 wells
Sources: Historical rig counts - Baker HughesCanadian & US forecast – Spears & Associates, Drilling & Production Outlook, Sep. 2011
-
100
200
300
400
500
600
700
800
2005 2006 2007 2008 2009 2010 2011 2012F-
400
800
1,200
1,600
2,000
2,400
Canadian Active Rigs US Active Rigs
2010 Actual1,536 average rigs 41,997 wells
2011 Forecast 1,879 active rigs 53,423 wells
2012 Forecast 2,113 rigs57,500 wells
North American Drilling Update
Jan 20, 2011 US rigs = 2,012Can rigs = 554
19
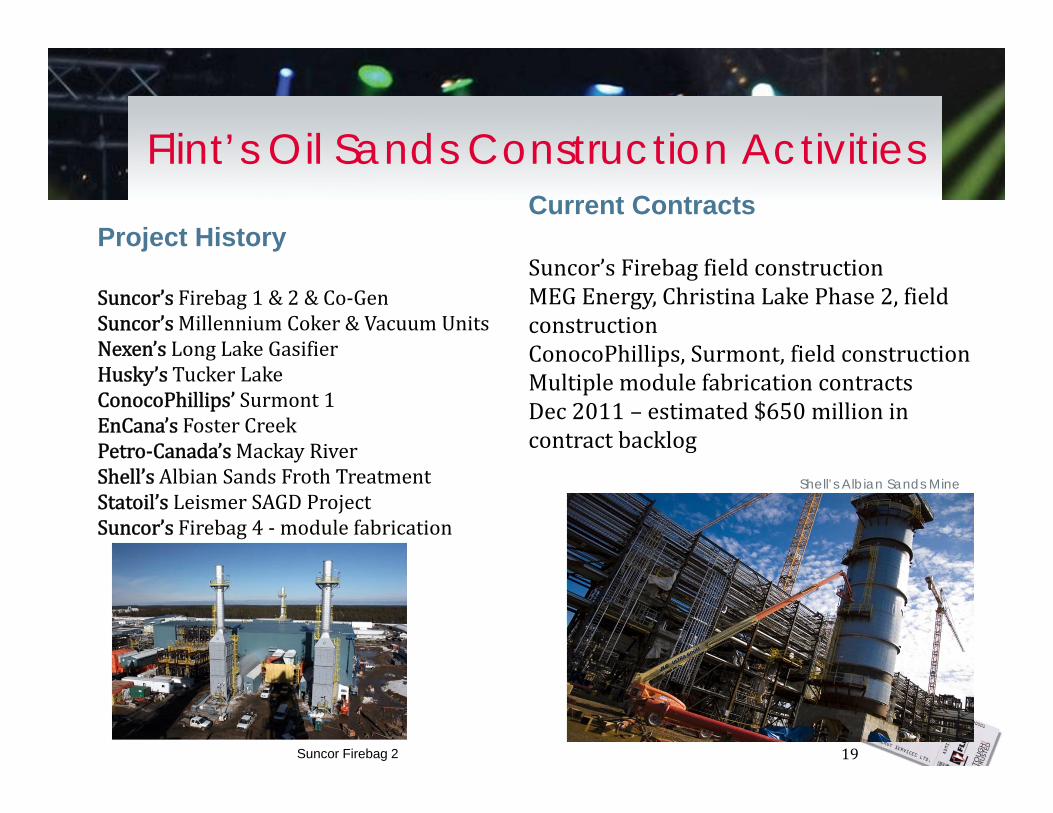
Flint’s Oil Sands Construction ActivitiesCurrent Contracts
Suncor’sFirebagfieldconstructionMEGEnergy,ChristinaLakePhase2,fieldconstructionConocoPhillips,Surmont,fieldconstructionMultiplemodulefabricationcontractsDec2011– estimated$650millionincontractbacklog
Project History
Suncor’s Firebag1&2&Co‐GenSuncor’s MillenniumCoker&VacuumUnitsNexen’s LongLakeGasifierHusky’s TuckerLakeConocoPhillips’Surmont1EnCana’s FosterCreekPetro‐Canada’s MackayRiverShell’s AlbianSandsFrothTreatmentStatoil’s LeismerSAGDProjectSuncor’s Firebag4‐ modulefabrication
Shell’s Albian Sands Mine
Suncor Firebag 2

20
Flint’s Oil Sands Construction Opportunities
0
50
100
150
200
250
300
350
400
Q1 2007 Q3 Q2 Q1 2010 Q3 Q2 Q1 2013 Q3 Q2
Revenues Potential
Quarterlyrevenues,millionsofdollars actual2006to2011
Greenbarsareestimatedquarterlyrevenuesandtotalworkinscopeto2012to2015Dashedlineispotentialquarterlyrevenueovernext4yearsriskedat50%
Source:Managementestimates
Current and medium-term targets to build our oil sands construction backlog:
Suncor - VoyageurUpgraderFortHillsMineMacKayRiverSAGDJoslynMineFirebag5&6SAGD
Northwest Upgrader – Upgrader
Osum Oil Sands Corp - Taiga,SAGD&CSS
Statoil – LeismerPhase2,SAGD
JACOS – HangingStone‐ SAGD
21
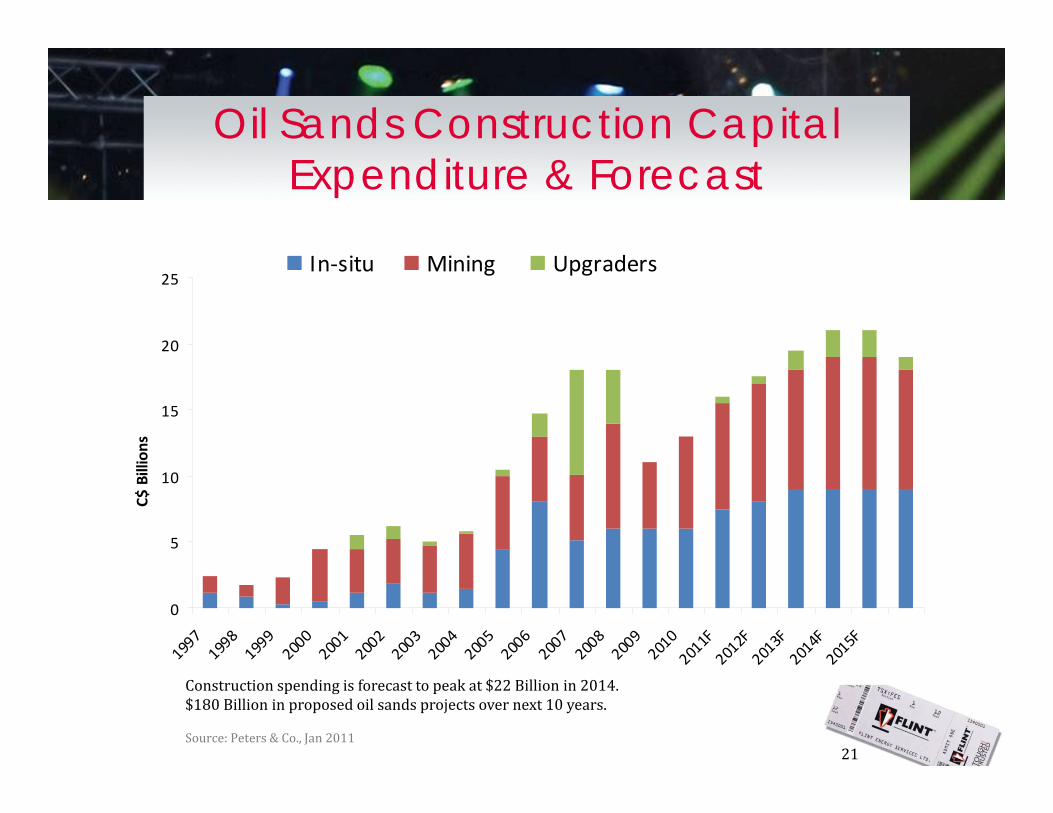
Oil Sands Construction Capital Expenditure & Forecast
0
5
10
15
20
25
199719
9819
9920
0020
0120
0220
0320
0420
0520
0620
0720
0820
0920
1020
11F
2012
F20
13F
2014
F20
15F
C$ Billions
In‐situ Mining Upgraders
Constructionspendingisforecasttopeakat$22Billionin2014.$180Billioninproposedoilsandsprojectsovernext10years.
Source:Peters&Co.,Jan2011
22
Flint’s Maintenance Strategy
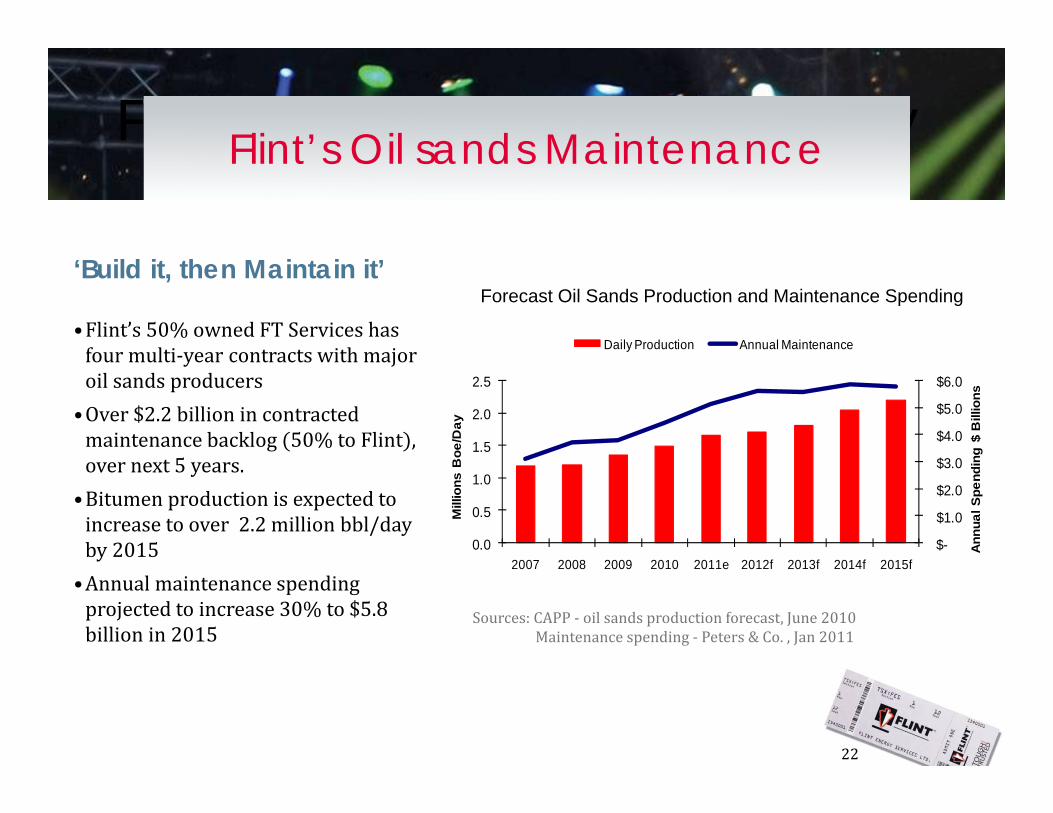
‘Build it, then Maintain it’
•Flint’s50%ownedFTServiceshasfourmulti‐yearcontractswithmajoroilsandsproducers•Over$2.2billionincontractedmaintenancebacklog 50%toFlint ,overnext5years.•Bitumenproductionisexpectedtoincreasetoover2.2millionbbl/dayby2015•Annualmaintenancespendingprojectedtoincrease30%to$5.8billionin2015
Sources:CAPP‐ oilsandsproductionforecast,June2010Maintenancespending‐ Peters&Co.,Jan2011
Flint’s Oil sands Maintenance
$-
$1.0
$2.0
$3.0
$4.0
$5.0
$6.0
0.0
0.5
1.0
1.5
2.0
2.5
2007 2008 2009 2010 2011e 2012f 2013f 2014f 2015f
Ann
ual S
pend
ing
$ B
illio
ns
Mill
ions
Boe
/Day
Daily Production Annual Maintenance
Forecast Oil Sands Production and Maintenance Spending
23
Carson Acquisition DetailsFlintpurchasedalloftheissuedandoutstandingsharesof
CarsonEnergyServicesLtd.
• GeographicexpansionforourProductionServicesdivision• $220millionannualrevenuesand$40millionEBITDA• ClosedOctober1,2011• $112millionincashpaidonclosingand• Issuedof2.1millionFlintcommonsharesatclosing• Upto$30millionearn‐outovernext36months• Approximatetotalvalueofconsiderationis$165million
•
•
•
•
Summary
22