peters ved berg
TRANSCRIPT

7/23/2019 Peters Ved Berg
http://slidepdf.com/reader/full/peters-ved-berg 1/50
NFHS123rev3 text doc. /2008-11-25/ (revision for ISI conference)
Why malnutrition in shining India persists*
Peter Svedberg**
Abstract. India has a higher prevalence of child malnutrition, as manifested in stunting
and underweight, than any other large country and was home to about one-third of all
malnourished children in the world in the early 2000s. There are, however, substantial
inter-state differences in child malnutrition and also in the (generally meagre) progress
made since the early 1990s. The persistence of widespread malnutrition may seem
surprising considering the recent overall shining performance of the Indian economy.
Between 1993 and 2006 net state domestic product per capita nearly doubled in the wake
of 4.5% average annual growth. The main objective of this paper is to identify the
reasons why rapid economic growth has failed to reduce malnutrition more substantially.
The methods used are OLS, instrument-variable, fixed-effect and first-difference
regression analyses on the basis of panel data at the level of states in India. The results
suggest that the persistence of malnutrition is mainly explained by modest poverty
reduction ⎯ despite high overall economic growth ⎯ due to minuscule factor
productivity and income growth in the agricultural sector, still employing 54% of the
Indian labour force. Widespread rural female illiteracy and restricted autonomy for
women are other significant explanations.
Key words: child, maternal, malnutrition, poverty, female illiteracy, autonomy, India
_____________________________________
* “India is shining” was the ubiquitous slogan boasted by the incumbent National
Democratic Alliance (NDA) in its multi-billion dollar media campaign in the run-up to
the national elections in 2004. The message conveyed was that all sectors of the Indianeconomy had recorded unprecedented growth and progress during the five years the NDA
had ruled India. The NDA lost the election and an often acclaimed reason is that millionsof poor and malnourished Indians felt they had been left in the shade.
** Peter Svedberg is Professor of Development Economics at the Institute forInternational Economic Studies, Stockholm University.
E-mail: [email protected]

7/23/2019 Peters Ved Berg
http://slidepdf.com/reader/full/peters-ved-berg 2/50
2
1. Introduction
In the early 1990s, about half of the pre-school children in India were malnourished, as
measured by being stunted or underweight for age. At the time, several other countries in
South Asia and Sub-Saharan Africa had similar levels of child malnutrition. The
prevalence of child stunting and underweight in India has declined since then, but at a
slower pace than in most other developing countries. In years around 2000, the latest date
for which estimates are available for sufficiently many countries to enable meaningful
comparison, only a few, much smaller countries had a higher incidence of child
malnutrition than India (WHO 2007a). As late as in 2005/06, 46% of all young Indian
children were underweight for age and 38% were stunted.
The high and persistent incidence of child malnutrition may seem surprising
considering that India has done remarkably well in economic terms since the policy
reform process gained momentum in the early 1990s. Between 1993 and 2006, net state
domestic product per capita (NSDP/C) grew by 4.5% per year on average, signifying
nearly a doubling of real income. Despite this shining overall economic performance, the
prevalence of child stunting and underweight dropped by 23 and 12% only over the 13
years (or by 8.7 and 5.4 percentage points). These rates of decline look modest in
comparison to China, where child stunting fell from 33 to 10% between 1992 and 2005
and child underweight was practically eliminated. India’s progress in reducing child
underweight since the early 1990s has been only marginally better than in Sub-Saharan
Africa, a region with high and persistent child malnutrition, but economically stagnant
(Svedberg 2006).
The key question addressed in this paper is why high overall economic growth
has failed to bring about a more rapid alleviation of child malnutrition in India. The main
explanation advanced in the earlier literature is the subdued position of women (mothers).
This hypothesis, the so-called Asian Enigma Syndrome (Ramalingaswami et al 1996), is
widely adhered to, but firm quantitative evidence of the role of female subjugation
relative to that of income poverty is scarce.1 This paper will try to fill that void.
1 Smith et al. (2003; 2005a) analyse the role of women autonomy for alleviating child malnutrition and
find empirical support for the women subjugation hypothesis, especially in South Asia, but the relative role
of income poverty is not explicitly studied.

7/23/2019 Peters Ved Berg
http://slidepdf.com/reader/full/peters-ved-berg 3/50
3
The research tools applied are panel and first-difference regression analyses based
on data at the level of Indian states. In addition to trying to quantify the relative impact
of the fundamental causes of child malnutrition, income poverty and female education
and autonomy, a further aim is to identify pathways through which these variables affect
children’s nutritional status. In that context, we will also examine how child and maternal
malnutrition are inter-related.
Some limitation in the scope of the study should be mentioned upfront. The first
is that gender differences in child malnutrition will be beyond the focus of the analysis.2
Moreover, the study is confined to investigating causes of malnutrition. The
consequences for the individual, higher burden of disease, elevated mortality risk,
retarded cognitive development and impaired labour productivity later in life ⎯ or for
society in the form of loss of human capital and slower economic growth⎯
will not be
addressed, but have recently been analysed elsewhere.3
The rest of the paper is organised as follows. The next section presents a brief
overview of child nutritional status in India as a whole and by state. The theoretical
framework and the econometric models to be estimated are presented in section 3.
Variable definitions and measurements are outlined in section 4. Results from panel OLS,
instrument-variable, fixed effect and first-difference regressions are presented in section
5. Section 6 reports results from regressions aimed at identifying the pathways thoughtwhich child malnutrition is caused. Section 7 aims at disentangling the extent to which
the small reduction in child malnutrition is attributable to weak response to changes in
determining variables and to small changes in these variables themselves. Qualifications
and robustness tests are provided in section 8. Section 9 summarizes and section 10
discusses policy implications.
2. An overview of malnutrition in India and by state
2 Differences in the formation of child malnutrition in rural and urban areas have recently been
investigated by Smith et al (2005b) in a cross-country study. For recent studies of gender differences in
India, see Pande (2003) and Tarozzi and Mahajan (2006).3 Behrman et al (2004); Alderman et al (2007); Grantham-McGregor et al (2007); Black et al (2008),
Victoria et al (2008); Huddinott et al (2008; Lancet); Lópes-Casanova et al (2005); Deaton (2007), Walker
et al (2007); Horton et al (2008).
7/23/2019 Peters Ved Berg
http://slidepdf.com/reader/full/peters-ved-berg 4/50
4
The modest decline in child stunting and underweight between the years 1992/93,
1998/99 and 2005/06, when National Family and Health Surveys (NFHS) were carried
out, is depicted in Figure 1. Between the first two surveys, child stunting was almost flat,
while underweight dropped by 4 percentage points. Between 1998/99 and 2005/06 it was
the other way around: child stunting declined by 7 percentage points, while underweight
remained practically unaltered. These different developments provide an indication that
child stunting and underweight may have partly different causes, a possibility to be
examined.
[Figure 1 about here (insert China as well)]
India is far from being a homogenous country in terms of malnutrition. Child
stunting and underweight have persistently been more prevalent in some of the land-
locked northern and central states than in the rest of India (Figure 2). The rates at which
the incidence of child stunting and underweight have changed also vary notably across
the states. In six large Indian states, child underweight actually increased between the two
most recent surveys. The subsequent statistical analysis aims at explaining this dismal
development.
[Figure 2 about here]
Estimates of the incidence of child malnutrition across households according to
“wealth” (possession of selected durable consumer goods) quintiles and maternal
education in the whole of India are presented in Figures 3 and 4. The prevalence of child
stunting and underweight in the household quintile with the lowest “wealth” score is
more than twice that in the highest quintile. The ratio of the incidence of child
malnutrition in households where mothers have no education to those with the highest is
also above two. These observations provide an indication that income poverty and female
education are likely to explain part of the variance in the prevalence of child (and mother)
malnutrition across states in India (although they say nothing about relative impacts).
[Figures 3 and 4 about here]
It is notable, though, that stunting and underweight is prevalent (20-25%) also in
the households in the highest wealth quintile and with mothers who have more than 10
years of education. This suggests that for children to be brought up in a relatively
wealthy and well educated household is not sufficient for avoiding malnutrition. In turn,

7/23/2019 Peters Ved Berg
http://slidepdf.com/reader/full/peters-ved-berg 5/50
5
this indicates that factors other than household income and female education are
contributing to child malnutrition. The subsequent statistical analysis aims at identifying
these other causes.
3. Research strategy and estimation models
3.1. The implicit theoretical model
The implicit maximising model for households underlying the subsequent empirical
investigations of determinants of child malnutrition can be thought of as akin to the
Becker type of model of why parents invest in education for their children. Parental
provision of adequate food and health care for children can be seen as an investment in
their survival and future earnings capacity and hence for providing for parents at old age.
Healthy and well nourished children may also have an intrinsic value to parents. The
constraints on being able to provide for children are economical (household income),
(maternal) knowledge about adequate feeding, sanitation and health-care practises, and
the provision of public services. A further constraint can exist if fathers and mothers have
different preferences for how the intra-household resources should be allocated.
/More formal model warranted?/
3.2. The empirical modelsThe empirical analysis based on panel data for three years (surveys) will proceed in three
steps. In the first step, the regressions aim at quantifying the relative strength of what are
assumed to be the fundamental reasons for the variation in child stunting and
underweight across the Indian states. The fundamental variables to be tested are poverty,
female illiteracy and a proxy variable for female autonomy. The basic regression model
to be estimated has the standard properties:
(1) Yit = β0 + [βk ][Xitk ] + αi + λ t + µit,
Yit is the outcome variable, alternately the prevalence of child stunting or underweight in
state i. Xitk is the vector of explanatory variables and βk are the coefficients to be
estimated; αi is an entity (state) dummy variable, λ t is a time dummy and µit is the
random error term. In s first round of panel regressions (OLS), the explanatory variables

7/23/2019 Peters Ved Berg
http://slidepdf.com/reader/full/peters-ved-berg 6/50
6
(Xitk ) are assumed to be strictly exogenous (Cov(Xitk ,µit) = 0) and to enter the regressions
linearly and independently (qualified later). Subsequently, instrument variable panel
regressions will be run with and without entity and time dummies. The regressions with
both state and time fixed effects will hopefully eliminate omitted variable bias due to
unobserved variables that do not change over time and unobserved variables that are
constant across the Indian states.
In the second step, an attempt s made to identify pathways through which child
stunting and underweight are affected. More specifically, we will examine how
nutritional conditions are related to certain health and household characteristics, so called
confounding variables (CVit). The regression model applied is:
(2) Yit = π0 + [π j][CVijt] + αi + λ t + νit
The confounding variables included in these regressions are mothers’ nutritional status,
qualified child health care provision, the fertility rate, feeding practises and sanitation
facilities. (The theoretical justifications for choosing these variables are presented in a
later section.) Since there may be causation in both directions between the Yit variables
and some of the confounding CVitk variables, we will not be able to claim that all the
latter variables cause malnutrition (when significant). The more modest objective is to lay
bare which health-care-related variables that are the most closely associated with child
malnutrition. As has been emphasised in the epidemiological literature since long
(Thomkins and Watson 1989), it is seldom possible to identify the proximal root cause of
poor health in children because many diseases and malnutrition are convolutedly
intertwined (Bhutta 2006).
The third step will be to examine to what extent overall economic growth in the
Indian states is related to changes in the fundamental variables, poverty, female illiteracy
and the gender composition of the population (the male/female population ratio).
4. Variable measurements
All variables used in the subsequent econometric analysis are measured at the level of
states in India. There are several hoped-for advantages with units of observation at this
7/23/2019 Peters Ved Berg
http://slidepdf.com/reader/full/peters-ved-berg 7/50
7
level of aggregation rather than unit-record data at the individual household level.4 First,
the state data allows the construction of balanced data panels that permits panel and first
difference analyses.5 A second advantage with data at the level of states is that
externalities can be captured more accurately. Children’s nutritional status depends on
several household-specific characteristics, such as income and mothers’ education, but
also on unobservable variables that reflect the broader environment in which the
household lives and dwells. These could be cultural norms that dictate women’s role in
society, or the general level of poverty in the area that may have bearings on the
incidence of transmittable diseases and the quality of health-care services. 6
A third advantage with aggregated data (i.e. states) is that noise of various types
tends to average out, hopefully leading to more efficient estimates. Individual household
data usually contain large random measurement errors, which induce an attenuation bias
(Wooldrige 2006). Moreover, data for individual households also pick up short-term
fluctuations in variables that do not reflect more permanent conditions.
There are, however, some potential drawbacks with using data at the level of
states. One is that the limited number of observations (at the most 48 in some of the panel
regressions) reduces the degrees of freedom and hence the size of the models that can be
tested. The Indian states may also be too large and internally diverse. Ideally, smaller
areas would be preferred, e.g. the 593 districts (in the 2001 Census) that comprise the
next layer of administrative unit in India. However, representative data on child stunting
and underweight, as well as on most explanatory variables, are not available at this lower
level of aggregation.7
The data on child nutrition status are from the three National Family Health
Surveys (NFHS 1-3) carried out in 1992/93, 1998/99 and 2005/06. Most other data are
from the large 50th
, 55th
and 61st
National Sample Surveys (NSS) conducted in 1993/94,
4
Studies from India based on household observations include those cited in note 2 above; also seeBorooah (2004) and references cited therein, the World Bank (2004), Radhakrishna and Ravi (2004) and
Bharati et al (2008).5 Other recent studies based on state data include Deaton and Drèze (2002), Besley and Burgess’ (2004)
study of labour market performance in India and Deaton’s (2008) investigation of the causes behind the
distribution of adult heights in India.6 In the DHSs, data on some observable community characteristics are usually collected in rural areas, butso far not in urban settings.7 The World Bank (2004) provides charts with the incidence of child underweight at a lower level than
states in India, but acknowledges that these are not representative.

7/23/2019 Peters Ved Berg
http://slidepdf.com/reader/full/peters-ved-berg 8/50
8
1999/00 and 2004/05, but also various other official sources including the Reserve Bank
of India (RBI). The bulk of the Indian state data are obtained in overlapping years (1993,
1999 and 2005), which enable us to construct balanced data panels. A statistical
supplement to this paper gives details of the data used, more complete references and
discussions of data shortcomings (work in progress).
4.1. Dependent variables
Child malnutrition will be measured alternately by the prevalence of stunting and
underweight among 0-3 year old children. Child stunting (underweight) is defined as a
height (weight) for age below 2 standard deviations from the median height (weight) of
the norm children. The age-specific estimates of stunting and underweight are derived on
the basis of the WHO/NCHS norms.8 Stunting (retarded skeletal growth) is
conventionally regarded as the most sensitive marker of long-term deprivation of micro-
nutrients and frequent and prolonged illness. Underweight (low mass of fat and muscle
tissue) reflects calorie deficiency and more acute illness (Waterlow 1992; Shrimpton et al
2001; Lancet 2008). Wasting (low weight for height) was also tried in a first round of
regressions, but few significant results were obtained as there is very little variation in
this measure across states and over time.
The focus on children (and their mothers later on) is dictated by the seldom
contested perception that they are the nutritionally most vulnerable groups. This is also
reflected in the fact that anthropometric data for other population segments are not
frequently collected. Estimates of child stunting and underweight are available for all
Indian states, but most of the analysis here has to be confined to the 16 largest ones since
8 In 2006, the WHO changed the norms for “normal” height and weight for specific age and sex. In the
case of India, this implied that the share of stunted children aged 0-3 years in 2005/06 jumped from 38.4 to45.2%, while the share of underweight dropped from 45.9 to 41.8%. Since there are no estimates of
stunting and underweight by state with the new norms for previous survey years, we use the old ones in
order to accomplish inter-temporal comparability. It is notable, though, that the choice of norms affects the
estimated levels of stunting and underweight, but have little impact on the inter-state differences or therates of change over time, which are the concerns here. The work with establishing new norms also entailed
a renewed investigation of whether the standard international norms for child genetic potential growth
apply to Indian young children as well, which the study confirmed (Bhandari et al 2002).

7/23/2019 Peters Ved Berg
http://slidepdf.com/reader/full/peters-ved-berg 9/50
9
data for many explanatory variables are lacking for the 17 mini-states and Union
Territories (jointly with 4% of the Indian population).9
4.2. Fundamental explanatory variables
Poverty. At the level of states in India, the share of the population that can afford an
adequate diet is determined mainly by average household per capita income, the inter-
household distribution of incomes and relative (food) prices ⎯ the three main building
blocks behind the poverty estimates. Food comprises about half of total consumption
expenditures of the average Indian household and nearly three-fourths in the lowest
income quartile (Sen and Himanshu 2004). Low income also constrains households’
ability to feed children food with a high and balanced micro-nutrient content as such food
items, i.e. animal products, fruits and vegetables, are invariably more expensive than
staple grains. Poverty further reduces households’ ability to demand for qualified child
and maternal health care. India is special in the sense that three-quarters of all health
expenditures are private, out of the pocket. This proportion is higher than in almost all the
other 192 countries for which the WHO (2007b) provides estimates. Income poverty also
constrains household demand for adequate housing, sanitation and water supply.
Female illiteracy. Mother illiteracy will be used as the measure of maternal
ability to care well for children. There are at least four reasons for expecting maternalilliteracy to impair the nutritional status of their children. One is that illiterate mothers are
in a disadvantaged position to acquire and apply knowledge about appropriate health-care
and feeding practices. A second is that uneducated women are likely to be less able to
care well for themselves in terms of nutrition and health and therefore less apt to care for
their own children. A third is that uneducated women marry earlier and have higher
fertility (Abadian 1996; Smith et al 2003; Smith et al 2005a). A fourth reason is, as we
will see, that illiterate women abstain from exercising their right to vote in state election
more often than their literate peers and this affects the public provision of child health
care.
9 The prevalence of poverty in the smallest states and the UTs are simply assumed to be the same as in
neighbouring larger states (GOI 2007). In 2001, three of the largest Indian states (Bihar, Madhya Pradesh
and Uttar Pradesh) were split up into two separate states. In order to accomplish comparability with earlier
7/23/2019 Peters Ved Berg
http://slidepdf.com/reader/full/peters-ved-berg 10/50
10
Mother’s autonomy. In India, as in most countries, mothers are the chief
caretakers of children, feeding them and seeking health care when they are sick. Mother’s
possibilities of undertaking these responsibilities ⎯ given their ability ⎯ can be
constrained by gender-biased cultural values. The less autonomy or clout women have
within the household and in society, the less likely it is that their own and their children’s
wellbeing is prioritised in the intra-household allocation of resources (Abadian 1996;
Smith et al 2003). Ancient cultural norms that subjugate women in India and other south
Asian countries have been advanced as the main reason why malnutrition in this region is
much more prevalent than in poorer Sub-Saharan Africa (Ramalingaswami et al 1996).
This study will investigate whether differences in gender-related cultural values within
India contribute to explaining ⎯ with due controls for other influences ⎯ the inter-state
variation in child malnutrition.
The male/female (M/F) population ratio will be used as the proxy variable for
female autonomy. This measure of “missing women” is mainly determined by differences
in sex-specific death rates for different age cohorts and the sex ratio at birth (Sen 1992).
A higher than normal M/F ratio in a population reflects excess death rates of females in
general in the wake of discriminatory treatment in health care and nutrition within
households, but also sex-selective abortions (Jha et al 2006).
5. Results
5.1. OLS and instrument variable panel regressions
The results from the first round of OLS panel regressions are presented in Table 1. In the
regressions for child stunting, all three fundamental explanatory variables turn out highly
significant: poverty, female illiteracy and the M/F ratio. In the regressions for child
underweight, poverty and female illiteracy are significant, but not the proxy variable for
women’s autonomy (the M/F ratio). All the standard errors are heteroskedasticity robust.
Moreover, the three fundamental variables are only weakly correlated internally,
signifying no problems with interpretation due to multicolinearity.
[Table 1 about here]
state division, all data from 2005/06 for the “new” states have been merged (population weighted average)
into the three “old” states.
7/23/2019 Peters Ved Berg
http://slidepdf.com/reader/full/peters-ved-berg 11/50
11
The second time dummy is negative and significant (at the 0.05 level) in the
regressions for stunting (but not for underweight), suggesting that stunting has declined
over and above what is explained by changes in poverty, female illiteracy and the M/F
ratio between the early 1990s and 2005/06. This indicates that there may be an omitted
variable bias in the regressions for stunting, but not for underweight.
The OLS panel regressions reported in Table 1 are based on the assumption that
the right-hand side variables are strictly exogenous. This may not be the case. One
question is whether malnutrition in children affects mothers’ literacy. Mothers who have
failed to gain literacy at school age could be prevented from learning how to read and
write later in life if they have many malnourished and sickly children demanding all their
time. Normally, however, female literacy is obtained at an age that predates childbearing,
providing a natural lag, signifying that reverse causality from malnutrition in children to
maternal illiteracy is a rather infrequent possibility. The risk that the OLS results have
been seriously distorted by simultaneity bias on this account hence seems small. There
could be a “third” factor that explains both child malnutrition and maternal illiteracy, e.g.
the conservative cultural norms that discriminate against women in India. These norms
have hopefully been internalised by entering the M/F ratio variable in the regressions.
The risk of endogeneity bias seems larger when it comes to poverty. A possible
link exists from the confluence of child malnutrition and many children in households
(high fertility) to reduced female labour supply and lower household income (Smith and
Haddad 2002). From a theoretical perspective, however, the nutritional consequences for
children of mothers working outside the home are ambiguous. Working mothers may
contribute to household income, which is expected to reduce child malnutrition. On the
other hand, outside work implies less time for child feeding and health care, with possible
adverse nutritional outcomes. At least one study has found the net effect on child
nutritional status in India to be ambiguous (Radhakrishna and Ravi 2004; IFPRI studies).
We have nevertheless chosen to instrument poverty, although identifying a
variable that constitutes a convincing instrument for poverty is difficult. The share of the
labour force engaged in agriculture will be the variable tried here. In all India, labour
productivity and incomes in the agricultural sector is about one-fifth of that in industry
and services (Bosweorth et al 2007; Lal 2008). It is hence not too farfetched to expect a

7/23/2019 Peters Ved Berg
http://slidepdf.com/reader/full/peters-ved-berg 12/50
12
link from high concentration of labour to agriculture to high prevalence of poverty.
Notable is that the of labour share in agriculture (LSA) in all-India has only declined
from slightly above 60% in the early 1990s to 54% in the mid 2000s (NSS).
As expected, in the first-stage regression of poverty on LSA (and female illiteracy
and M/F), the LSA variable comes out highly significant (0.01). Moreover, in this
regression the F-statistic is 11.1, slightly above the 10.0 that is the rule-of-thumb value
used to identify a valid instrument (Stock and Yogo 2005; Stock and Watson 2007). We
can hence tentatively rule out that LSA is a weak instrument for poverty./Alternative
instrument?/
The results from the IV regressions for child stunting and underweight are
reported in Table 1. Poverty (OLS) and instrumented poverty (LSA) are highly
significant in the regressions for both stunting and underweight. It is notable, though, that
the estimated coefficients are about twice as high in the IV regressions in both cases.
Female illiteracy turns out insignificant in the IV regressions, while significant in the
OLS regressions. It is not straightforward to provide a convincing factual explanation for
this discrepancy. /Have to think this over/ The M/F variable remains highly significant in
the regressions for stunting, while it is (weakly) significant in the IV regressions for
underweight, but not in the OLS regressions.
5.2. First-difference and fixed-effect regressions
The large inter-state differences in the fundamental determinants of child malnutrition,
poverty and female illiteracy and autonomy (M/F), are the outcomes of processes that
have evolved over many decades ⎯ if not centuries (Banerjee and Iyer 2005). From a
policy perspective, an important question is whether recent improvements in these
variables have led to reduction in child malnutrition. In the previous OLS and panel
regressions for stunting (Table 1), the second time dummy came out significant. This
suggests that between 1993 and 2006, child stunting (while not underweight) declined
over and above what changes in the independent variables could explain. In this sub-
section, we will examine changes over time in more detail. The two additional alternative
methods for testing changes over time (in the absence of yearly time series) are first-

7/23/2019 Peters Ved Berg
http://slidepdf.com/reader/full/peters-ved-berg 13/50
13
difference and fixed-effect regressions. Since there are no simple rules for discriminating
between these two methods (Wooldridge 2006) we will apply both.
The fixed-effect panel regressions will be based on model 1 above. The first-
difference regressions for child stunting/underweight on changes in poverty, female
illiteracy and in the M/F ratio across the Indian states are based on the following model:
(3) ∆Yi = θ0 + [θik ][∆Xik ] + εi,
where the ∆ stands for first-difference change in respective variable.
The results for first-difference regressions (changes between 1992/93 and
2005/06) are reported in Table 2. In the regressions for child stunting, changes in poverty,
female illiteracy and the female/male population ratio are all significant with the expected
signs. The size of the regression coefficient for female illiteracy (around 0.80) suggests a
large quantitative impact: a 1 percentage point reduction in female illiteracy is followed
by a 0.80 percentage point decline in child stunting. The equivalent coefficient for
poverty is smaller (0.50), but also highly significant. The M/F ratio is also significant, but
the size of the regression coefficient defies an easy interpretation. The results for stunting
reported in Table 2 square reasonably well with those obtained in the previous cross-
sectional OLS panel regressions and also the IV regressions (Table 1).
[Table 2 about here]
In contrast, first-difference regressions for child underweight on changes in the
fundamental variables yield only weak significance for female illiteracy, but at such low
level that the F-statistic is insignificant. This result is not totally surprising considering
that the decline in child underweight in all-India and in many states was minuscule
between the early 1990s and mid 2000s. There is, however, the possibility that some
important variable may have been omitted from the regressions. A chief suspect is
underweight in mothers in accordance with the “Asian enigma hypothesis”, which we
shall investigate in a subsequent section.
The (state) fixed-effect results are considerably weaker. In the regressions for
stunting, poverty is insignificant. Female illiteracy is highly significant when no time
dummies are included in the regression, but once these are entered, significance
disappears. The M/F ratio is significant when time dummies are included, but not when

7/23/2019 Peters Ved Berg
http://slidepdf.com/reader/full/peters-ved-berg 14/50
14
these are left out. In the regressions for underweight, the female illiteracy variable turns
out significant, but only when time dummies are excluded. The overall weak results in
the regressions for underweight are likely due to the minuscule changes in this variable
over the measured period.
6. PATHWAYS
In the earlier discussion of the motivations for selecting the fundamental explanatory
variables, several pathways through which these variables are hypothesised to affect child
malnutrition were sketched. Most of these pathways were examined in preparatory work
and results from two of these exercises will be presented here.
6.1. Inter-generational perpetuation of malnutrition
Hypotheses. A commonly adhered to hypothesis is that when mothers are malnourished,
there is an elevated risk that their children will become malnourished as well ⎯ inter-
generational perpetuation of malnutrition (Ramalingaswami et al 1996). There are at least
three plausible reasons for expecting this. One is that underweight in pregnant women
increases the likelihood of low birth weight (LBW<2.5 kg), which in turn is a strong
predictor of underweight in infancy and early childhood (ACC/SCN 2000; Osmani and
Sen 2003; Lancet 2008). The second reason is that malnutrition in lactating mothers
reduces the micro-nutrient content in their breast milk, affecting infant growth adversely
(Allen 2005). The third reason is that malnourished mothers are presumably weaker and
more sickly and hence less able to care well for their off-springs (Lancet 2008).
The first link in the pathway to be tested is the determinants of malnutrition in
mothers, as measured by a body mass index (BMI) below 18.5. Maternal BMI failure is
hypothesised to be determined by the same fundamental variables as child stunting and
underweight, i.e. poverty, female illiteracy and autonomy. The second link that we
intended to test is that between mother underweight and LBW. Unfortunately, there are
no representative estimates of the prevalence of LBW in the Indian states (Mistra 2002).
The 30% estimate for all-India routinely provided by UNICEF and other international
organisations builds on births in selected medical institutions (ACC/SCN 2000). We can
hence not test this link. The next link tested is therefore the one between stunting and

7/23/2019 Peters Ved Berg
http://slidepdf.com/reader/full/peters-ved-berg 15/50
15
underweight among children and mothers with a BMI<18.5, with controls for child health
care provision, size of households, feeding practices and sanitation facilities.
The case for including health-care provision rests on findings in the
epidemiological literature; mounting evidence shows frequent and prolonged untreated
illness to be one of the most important factors behind child malnutrition (Black et al
2008; Victoria et al 2008). Moreover, recent epidemiological research finds that micro-
nutrient deficiency aggravates infectious disease, which in turn leads to mal-absorption of
several micro-nutrients, stifling child growth in a vicious circle (Bhutta 2006).
The total fertility rate (TFR) is included in the regressions as a control on the
assumption that many children in households mean that mothers have less resources and
time to care for each child. High fertility also implies shorter birth spacing and time for
mothers to recuperate (Dewey et al 2007). Moreover, high fertility goes hand in hand
with mothers being very young and inexperienced when giving the first birth (NFHS-3
2007).10
The feeding practice variable is included as there is almost universal agreement
among experts that from the age of six months infants should be fed supplementary solid
food in order to ensure full genetic potential skeletal growth. Adequate sanitation is
important mainly for reducing water-born diseases such as diarrhoea ⎯ a contributing
cause of malnutrition (and also the second largest killer of post-natal infants and young
children in poor countries).Data and variable measures. The two latest NFHSs provide comparable
estimates of the share of mothers with a BMI<18.5, while no such estimates were
obtained in the first NFHS (1992/93). Neither were comparable data for feeding practices
collected in this survey. We hence have to restrict the panel for the 16 states to two points
in time. Average household size is measured by the total fertility rate and feeding
practises by the share of 6-9 month olds who in addition to breast milk are regularly fed
solid or semi-solid food. Sanitation is proxied by the availability of a flush toilet or a
covered latrine in the home. Data on all these variables are from the NFHSs. 11
10 Data from the 2005/06 NFHS show the incidence of underweight to be positively correlated to the
(higher) birth order of the children (NFHS-3, table10.1). There is most probably causation in both
directions between child malnutrition and the fertility rate, as child stunting/underweight raise the infantmortality rate and hence fertility through the replacement effect.11 The definition of safe water has unfortunately changed drastically between the three NFHSs, which
means that this variable cannot be included in the regressions.

7/23/2019 Peters Ved Berg
http://slidepdf.com/reader/full/peters-ved-berg 16/50
16
There is no summary statistic on the share of children that is provided with
qualified health care in the Indian states. Therefore, a child-health-care index (CHCI) was
constructed that includes both preventive and curative health-care services. The index is
defined as the average of the shares of (1) births in medical facilities, (2) births assisted
by health professionals, (3) children being fully vaccinated and (4) children brought to a
health facility when suffering diarrhoea. The four variables are internally highly
correlated, which indicates that in unison, they should measure well the general reach and
coverage of qualified health-care provision for children. There is large variation across
the Indian states in child health care provision, as measured by this index, reflecting
differences in demand and supply.
Results. In OLS panel regressions for child stunting on the confounding
variables, mother’s BMI status is insignificant in combinations with other variables
(Table 3). Stunting is the most strongly associated with the child health care index. The
feeding practice variable is highly significant in the regression without a time dummy,
but insignificant when this dummy is entered, and is hence not robust (Table 3). The time
dummy itself is significant with a negative sign, indicating that stunting declined over
and above what is “explained” by the confounding variables. In sharp contrast, in the
regressions for child underweight, mother’s nutritional status (BMI) is highly significant.
Also the TFR is highly significant with the expected positive sign, while child health
care, feeding practices and sanitation turn out insignificant. In this regression, the time
dummy is also insignificant.
[Table 3 about here]
That child stunting is strongly associated with lack of qualified preventive and
curative health care is consistent with the epidemiological findings that frequent and
prolonged untreated illness impairs infant and child skeletal growth, which is practically
irreversible.12
That underweight is not associated with inadequate health care could be
consistent with the observation that weight loss (fat and lean tissue) related to disease can
be reversed once the child recuperates. That child underweight is strongly associated with
(or caused by) maternal underweight is consistent with the well-established link from
12 It is widely agreed in the epidemiological literature that stunting in infancy and during the first two or
three years of life is the main determinant of short height later in life and that the potential for “catch-up”
growth later is small (Shrimpton et al 2001).

7/23/2019 Peters Ved Berg
http://slidepdf.com/reader/full/peters-ved-berg 17/50
17
underweight in pregnant women to low birth weight and subsequent underweight in
infants and young children (ACC/SCN 2000). That the TFR is a significantly associated
with child underweight is probably because in households with many children, mothers
have less time for feeding and caring well for each of them. The hypothesis ventured in
section 2, that child stunting and underweight have partly different determinants, is hence
in agreement with the data.
6.2. Female voting and public child health care provision
Given the apparent importance of qualified child health care for alleviating malnutrition,
especially stunting, we shall make an attempt in this section to examine in some more
detail a presumed pathway from female literacy to child health care.
Hypotheses. Households’ demand for qualified child health care is assumed to be
determined by income poverty, female education and autonomy. The supply of public
health-care infrastructure is assumed to be determined by government expenditures
allocated to the health sector in the states. It is further assumed that women generally give
higher priority to health care for children than their husbands (Abadian 1996; Smith et al
2003).13
Moreover, mothers are expected to be able to spend relatively more of
household resources on qualified health care for their children if they are literate and have
autonomy. Finally, we assume that by voting in state elections, mothers may be able to
affect state governments’ expenditures for health care in general and for children in
particular.14
There are hence four links in the pathway to be tested. The first is what
determines the share of women who exercise their right to vote in state elections relative
to men. The second link is that between state governments’ allocation of resources to the
health-care sector and women/men turnout in the elections. The third link is that between
provision of child health care and state health expenditures (rupees per capita and year).
The final link is that between child health care and child stunting and underweight, which
13 It is notable that most micro-credit schemes in poor countries target women as the prime lenders.14 The supply of public health care facilities is largely determined by the budget allocations of state
governments, which are responsible for health and education in the states, while the central government is a
minor provider of founds.

7/23/2019 Peters Ved Berg
http://slidepdf.com/reader/full/peters-ved-berg 18/50
18
was already reported in Table 3 (N=32), but a further test on a larger data set (N=48) and
partly different confounding variables will be reported from below.
Data and variable measures. The data on voting turnout refer to the latest state
election preceding the years in which the national nutritional surveys were carried out
(1992/93, 1998/99 and 2005/06) as reported by the Election Commission of India. The
state government health expenditures per capita (SGHE/C) in respective year will be
measured in real 1993 rupees. The data on Net State Domestic Product per capita in real
terms are from the Reserve Bank of India. The provision of qualified health care for
children is measured by the CHCI (see above).
Results. The results from OLS panel regressions of the four links in the pathway
are reported in Table 4. The panel covers the 16 largest states in India in three years. In
the first regression (column 1), the female/male turnout ratio is the dependent variable
with female illiteracy as the explanatory variable of main interest; total turnout, poverty,
the M/F ratio and time dummies are entered as controls. Female illiteracy comes out
highly significant along with total turnout and poverty, while the M/F ratio is
insignificant.
[Table 4 about here]
In the second regression (column 2), state government real health expenditures
per capita (SGHE/C) is the dependent variable, regressed on F/M turnout ratio in the
elections and controls and time dummies. The F/M turnout is highly significant, while the
total turnout is significant with a negative sign! In this regression, the NSDP/C comes out
insignificant, although with the expected positive sign. In the third regression (column 3),
with the CHCI as the dependent variable, the SGHE/C variable turns out significant with
the expected sign. The control variable the total fertility rate is highly significant, but the
sanitation variable is insignificant.
In colums 4 and 5, child stunting and underweight (alternately) are regressed on
the CHCI with controls and time dummies. The CHCI turns out significant in both
regressions, but more strongly so for stunting than for underweight.15
In the regression
for stunting, the TFR also comes out significant while not the sanitation variable. In the
15 It should be noted the CHCI variable came out insignificant in the regression for child underweight
reported in Table 3, based on a shorter panel, but including maternal underweight (highly significant) for
which no data exist in 1992/93.
7/23/2019 Peters Ved Berg
http://slidepdf.com/reader/full/peters-ved-berg 19/50
19
regressions for child underweight it is the other way around. Sanitation is highly
significant, while the TFR is insignificant. These results indicate that the pathways
through which child stunting and underweight are caused do differ.
That female illiteracy, but not the proxy for women’s autonomy, determines the
women/male turnout in state elections is perhaps surprising from an Asian-enigma
perspective. That the voting turnout of women relative to men ⎯ but not the total
turnout ⎯ has a positive effect SGHE/C underscores, however, that empoverment of
women is important for child health. The result that SGHE/c seems to have an impact on
the actual provision of health care for children was not entirely expected. In India as a
whole, the share of health in total state expenditures is lower (3.9%) than in all but a
handful of other countries (WHO 2007b) and about three-quarters of all health
expenditures are private, out of the pocket. Considering also that state health expenditures
fluctuate wildly from year to year and actually seems to be the residual item in the state
budgets, the link to child health care provision is somewhat surprising.16
Finally, the
results in Table 4 are consistent with the epidemiological findings that qualified health
care is important for reducing illness and hence for avoiding impaired skeletal growth
(stunting) in infants and young children.
7. Little poverty reduction – little malnutrition reductionThe results from the OLS and instrument-variable panel regressions (Table 1) show
poverty and female illiteracy to be highly significant determinants of child malnutrition
as manifested in stunting and underweight. Also the first-difference regressions (Table 3)
show decline in poverty and female illiteracy to reduce child stunting significantly, but
not so for underweight (which we at least partly explain by the minuscule change in
underweight over the period). That income poverty and female education matter for child
nutritional status in India is fully in line with results obtained in most related studies,
based on cross-country or unit-record observations in individual countries, which is
reassuring.
16 The residual property and the high year-to-year fluctuations in public health expenditures in the Indian
states have been highlighted in a recent official report (NCMH 2005, p.71).

7/23/2019 Peters Ved Berg
http://slidepdf.com/reader/full/peters-ved-berg 20/50
20
There is, however, compelling reason to go a few steps further in the strive to
understand why child stunting and, especially, underweight in India have not declined
more rapidly since the early 1990s. Considering an impressive overall growth of net state
domestic product per capita in India of about 4.5% per annum, reductions of stunting and
underweight by 12 and 5 percentage points over this period seem small. The estimated
coefficients for both stunting and underweight with respect to poverty and illiteracy in the
OLS panel regressions all in the range 0.31 to 0.39 and twice as large in the IV
regressions (Table 1). In the first-difference regressions for stunting, a 1% point reduction
in the incidence of poverty translates into a decline in the prevalence of child stunting by
about 0.5 percentage point (Table 4). Whether the size of these coefficients should be
deemed small or large is difficult to say since no previous comparable study of child
malnutrition has used poverty as the explanatory income variable. In the
methodologically akin cross-country investigations, the income measure used is per
capita GDP, and an income-malnutrition elasticity of around -0.50 is a standard result.17
What we can say with considerable confidence is that the growth of NSDP per
capita in all-India by 4.5% per annum between 1993/94 and 2004/05 (RBI 2007) was
followed by relatively little poverty reduction. Between the same years, the officially
estimated incidence of poverty dropped by 8.5 percentage points only, or by 23.6% in
relative terms. In relation to an accumulated increase in the NSDP/C by 61.5%, this
suggests a rough aggregate poverty-income elasticity of the order -0.38. In a study based
on data from 1958 to 1991, Datt and Ravallion (1996; 2002) found the poverty-income
elasticity in India to be between -0.75 and -1.09 depending on the assumptions made.
Although a more detailed comparison between the pre- and post-1991 period is called for,
the reduction of poverty in response to economic growth in the Indian economy seems to
have slowed down considerably.18
Moreover, there is no correlation whatsoever between poverty reduction and
cumulative growth of net state domestic product per capita (NSDP/C) across the Indian
17 Smith and Haddad (2002); Haddad et al (2003); Svedberg (2004).18 The recent trepid poverty decline in response to accelerating growth in all-India also seems meagre in
international comparison. Available estimates of poverty-income elasticities, based on cross-country paneldata, are in the -0.67 to -1.94 range, depending on estimation method and type of data used (Kraay 2006;
Loayza and Raddatz 2006). Also see Deaton and Drèze (2002)

7/23/2019 Peters Ved Berg
http://slidepdf.com/reader/full/peters-ved-berg 21/50
21
states over the period 1993/94 to 2004/05 (Figure 6). This is so irrespective of whether
the sample is restricted to the 16 large states included in previous regressions, or all states
for which data are available (25). All 25 states experienced some growth of NSDP/C and
some poverty reduction, but the expected negative significant correlation fails to
materialise (the regression line is positive, but insignificant). This is in sharp contrast to
cross-state observations for India, which reveal a very strong correlation between levels
of poverty and NSDP/C. This observation provides a further indication that the link
between poverty reduction and overall economic growth in India has changed since the
early 1990s.
[Figure 6 about here]
Although a full-fledged analysis of the reasons for the meagre decline in poverty
in all-India (and the lack of correlation between income growth and poverty reduction
across the Indian states) is beyond the scope of the present paper, one can identify four
plausible contributing factors. One is that the share of consumption expenditures, as
broadly measured in the national accounts, fell from 66% to 56% between 1990 and 2006
(ADB 2007). A second reason is that consumption expenditures as measured in the NSS
household surveys ⎯ the basis for the poverty estimates ⎯ are only some 60-70% of
consumption as measured in the national accounts, and seems to have grown more slowly
(Datt and Ravallion 2002).A third reason is that the distribution of NSS household consumption
expenditures has become more uneven over time: the Gini coefficient for household
expenditures increased by 3.5 points between 1993/94 and 2004/05. This is mainly
because annual growth of real per-capita consumption expenditures in the lowest income
quintile was a meagre 0.85% between the same years, while above 2% in the highest
quintile (ADB 2007).
The slow growth of consumption expenditures among the poorest, in turn, is at
least partly an outcome of the fact that income growth in India has been very uneven
across sectors, with agriculture as the lagging sector. During the 1993-2004 period,
annual growth of output per worker in the agricultural sector averaged 0.5% while in the
industry and service sectors, growth was 0.9% and 2.1%, respectively (Bosworth and

7/23/2019 Peters Ved Berg
http://slidepdf.com/reader/full/peters-ved-berg 22/50
22
Collins 2008).19
The fact that more than half of the Indian labour force is still employed
in the relatively stagnant agricultural sector is hence consistent with little reduction of
poverty ⎯ and of child malnutrition.20
The growth of household income has been especially low in the most populous
states with the initially highest levels of malnutrition, Bihar, Madhya Pradesh and Uttar
Pradesh. This is another contributing factor behind the tardy reduction of child
malnutrition as measured by underweight in all-India. These three states were home to
more than half the underweight children in India in 1993. As can be seen from Figure 6,
the three states had very little accumulated growth of NSDP/C and minuscule poverty
reduction over the next 13 years ⎯ and little reduction of child underweight. The slow
decline of child underweight in all-India is hence partly explained by the unfavourable
overall economic performance and persistent poverty in the most populous states. In the
cross-state regressions, in which all states carry the same weight, this size-of-state issue is
hidden.
We also examined how the declines in female illiteracy and in the male/female
population ratio relate to economic growth across the Indian states. In short, the reduction
of female illiteracy between the early 1990s and mid 2000s was found to be significantly
related to growth of NSDP/C, albeit at a rather low level of significance (0.05). The
minuscule change in the M/F population ratio over the same period was unrelated toeconomic growth.
8. Qualifications and robustness tests
In previous sections, controls for endogeneity, heterskedasticity and robustness were
made. There are a few other measurement and methodological issues to be addressed.
8.1. Multicolinearity
19 In recent years it has become increasingly clear that the sector composition of growth matters
considerably for poverty alleviation and that slow productivity growth in labour-intensive sectors in general
and in agriculture in particular, is the major reason for the failure to reduce poverty more forcefully in the
developing countries in general (Loayza and Raddatz 2006).20 In the 2000 NSS labour survey 58% of the labour force was in agriculture and 54% in the 2005 survey.
In absolute numbers, the agricultural labour force in India increased by 5 million, from 202 to 207 million
between these years (ADB 2007).

7/23/2019 Peters Ved Berg
http://slidepdf.com/reader/full/peters-ved-berg 23/50
23
The main reason why a distinction has been made between fundamental and confounding
variables is that they are expected to be highly correlated. Including confounding and
fundamental variables in the same regressions for child stunting or underweight could
hence cause problems with multicolinearity. To test this hypothesis, the confounding
variables were regressed on the fundamental variables. The results are presented in Table
5.
As expected, the confounding variables are significantly correlated with many of
the fundamental variables, but partly different ones. In panel OLS regressions for
maternal BMI failure, poverty and female illiteracy turn out highly significant with the
expected signs. The M/F proxy is insignificant, however, indicating that women
autonomy (as measured here) is not affecting their nutritional status.
The CHCI is significantly and negatively associated with poverty (reflecting
affordability) and mother’s literacy and autonomy (reflecting maternal knowledge and
priorities within households). The total fertility rate is strongly correlated to female
illiteracy, while unrelated to poverty and the M/F ratio, a perhaps surprising result. In the
regressions for feeding practices, the M/F ratio and female illiteracy are significant but
poverty is not. This is the only regression in which the time dummy is (strongly)
significant, with a positive sign, indicating unexplained improvements in feeding
practices over time in India at large.21
Sanitation facility (flush toilet) is highly correlated
to female illiteracy with the expected sign, but not to any of the other fundamental
variables. Finally, it is notable that all five confounding variables are significantly
correlated to female illiteracy ⎯ with the expected signs.
8.2. Data shortcomings
India probably has better, more disaggregated and more comprehensive data on most
variables that have been used in this study than any other low- and middle-income
country. Still, there are shortcomings. One is that in the first NFHS (1992/93), estimates
of the prevalence of stunting are missing for five of the 16 large states included in our
regressions. With an aim to have a balanced data panel and maximum degrees of
21 A strong association between the TFR and maternal education has been found in several studies,
although an unambiguous line of causation is difficult to establish (Doepke 2004).

7/23/2019 Peters Ved Berg
http://slidepdf.com/reader/full/peters-ved-berg 24/50
24
freedom, as well as not “wasting” data on other variables, we have interpolated the 5
missing data points on stunting, using a regression technique borrowed from the WHO
(de Onis et al 200?). The method relies on estimating the correlation between stunting
and underweight on the basis of the 11 states with complete data on both variables in
1992/93. The ensuing regression equation (highly significant) is then used to estimate
stunting from the available data on underweight in the five states.22
As a check of the
reliability this method, we re-ran all regressions for stunting omitting the five missing
observations (five states in 1992/93). The ensuing results, based on 43 observations, did
not differ in any significant manner from those obtained earlier.
A second data shortcoming is that some of the variables used in the panel
regressions may not be strictly comparable over time. A large number of scholars have
pointed out measurement anomalies in estimated household consumption expenditures in
the 1999/00 NSS survey. These anomalies may have compromised the comparability of
the poverty estimates for this year and the other two survey years. This potential
incomparability, in turn, may have distorted the panel regressions reported in Tables 1
and 2. Several attempts have been made, though, to correct the official poverty estimates
from 1999/00 so as to make them more comparable with the estimates from 1993/94 (and
2005/06). 23
Deaton’s (2003) scrutiny of the base data and his re-estimation of poverty in
1999/00 is perhaps the most trustworthy such undertaking. To control for the bias in the
official poverty estimates, re-ran all previous cross-state regressions based on Deaton’s
alternative poverty estimates for 1999/00. Quite reassuringly, not a single result was
turned around. In fact, the differences were negligible and the regressions based on
Deaton’s poverty estimates actually turned out marginally stronger than when based on
the official ones. This could be interpreted as a vindication of the frequent claim that the
official ones do underestimate poverty in 1999/00. There has been no questioning of the
inter-temporal comparability of the poverty estimates from 1993/94 and 2004/05 when
22 Similar methods are frequently used by the international organisations to fill in missing data points, e.g.
by the World Bank when estimating GDP per capita in countries with incomplete or obsolete data. TheBank’s International Comparison Program includes benchmark estimates for less than half the about 200
countries contained in World Development Indictors.23 There is no agreement on the size of the bias. Sen and Himanshu (2004) claim that the official poverty
estimates from 1999/00 are far too low and that the decline in poverty over the 1990s to be much smaller
than the official estimates suggest. Datt and Ravallion (2002) find the official estimates to be only slightly

7/23/2019 Peters Ved Berg
http://slidepdf.com/reader/full/peters-ved-berg 25/50
25
based on a uniform recall period, which we used in the first-difference regression (Table
2).
A third potential data problem is that for some variables, alternative estimates are
available. There are at least three independent statistical sources providing estimates of
female literacy: the NFHSs, the NSS and the Censuses. If these provide diverging
estimates, the use of one particular data set could be ambiguous and induce non-robust
results. When choosing data on female (il)literacy to be used in the present study,
estimates from the three (independent) sources were compared, for India as a whole, and
for the individual states. The comparisons revealed a very close correspondence both in
terms of levels and in changes over time, indicating that no major measurement bias is
likely to be found in the (il)literacy estimates. The decision to use the estimates from
three NSSs was dictated mainly by the fact that these surveys were conducted in the same
years as the NFHSs and they cover the same age group over time (females 7+ years).
These three NSS surveys are quintile, implying that they are especially large (thick).24
A further potential problem is that data unavailability has led to the omission of
some variables that theoretical considerations suggest should be included in the analysis.
The most obvious is the prevalence of LBW, for which no representative estimates are
available for the Indian states. The sanitation variable “safe water” was also omitted
because the definition has changed drastically over the NFHSs. Relative food prices have
not been entered as an independent explanatory variable in the child malnutrition
regressions. Food price differences, across states and urban/rural areas, as well as over
time, have been taken into account indirectly since the state-, urban/rural- and time-
specific poverty lines used for the estimation of poverty incorporate such differences.
8.3. Blunt proxy variables
Some of the proxy variables applied in this study could be poor measures of what they
intend to capture. The M/F population ratio, for instance, may not be the most adequate
measure of women’s autonomy in households and society. One problem is that the M/F
ratio could have been compromised by gender-specific emigration and/or inter-state
off the mark, while Deaton’s (2003) find the official estimates to be some 3-4 percentage points too low.
(For additional contributions to this debate, see Deaton and Kozel 2005, Pogli et al 2005; Reddy 2007.)24 In the NFHSs, the age group covered has changed over time /Check again/
7/23/2019 Peters Ved Berg
http://slidepdf.com/reader/full/peters-ved-berg 26/50
26
migration. Kerala, for instance, is the only state where the M/F ratio is below unity
(around 0.96). This is at least partly a consequence of the fact that large numbers of men
in Kerala migrate to the Gulf states. It is notable, though, that in other Indian states,
emigration and non-seasonal inter-state migration are minuscule and has been so over the
period of concern (Lucas 1998; Srivastava and Sasikumar 2003).
An alternative proxy for female autonomy used in related literature is female
labour market participation. This variable may be poor proxy for autonomy since it can
have an independent impact on child malnutrition. It was nevertheless tried as an
alternative to M/F, but no significant results emerged. A contributing reason may be that
the female participation rate is not well defined and poorly measured in the Indian states.
Official labour market statistics set the rate at about 25% and with little variation over
states or time. It may also be that our proxy for feeding practices is too blunt, but it is the
only one available in all three NFHS.25
8.4. Specification bias
In the models tested, all explanatory variables were entered linearly and independently in
the regressions. Linearity means that the marginal effect of a change in an explanatory
variable is assumed to be constant, both across different levels of the variables and across
different states. To check the validity of this assumption, plot inspections of all
regressions were made. Only in some regressions in which the total fertility rate is
included, a non-linear specification seemed justified. Re-estimations showed, however,
that the improvements in fit were negligible.
The independency assumption underlying the regression model applied was tested
by introducing the interaction variable poverty*female illiteracy in the regressions. The
regressions in which poverty and female illiteracy were entered jointly, but separately,
provided better fits as measured by R-square. However, in the regressions where the
inter-action variable replaced these two variables, it was significant at a very high level. It
25 In the most recent NFHS (from 2005/06), several measures of child feeding practices are provided, suchas newborns breastfed within one hour of birth, children aged 0-5 months exclusively breastfed, and
children aged 6-9 months receiving supplementary solid food. In the earlier NFHSs, most of these data
were not collected in a comparable manner.

7/23/2019 Peters Ved Berg
http://slidepdf.com/reader/full/peters-ved-berg 27/50
27
hence seems that whether poverty and female illiteracy are entered separately or as an
interaction variable matter little for the results.
9. Summary of findings
The main objective of this study has been to explain why the reduction in child
malnutrition has been relatively small despite the impressive overall performance of the
Indian economy since the early 1990s. Although the results are only indicative, we have
found that while poverty reduction has a significant impact on the alleviation of child
malnutrition in India However, poverty decline has been modest despite high aggregate
growth in the economy. This, in turn, is at least partly a consequence of slow growth of
household real consumption expenditures among the poorest quintiles that are
predominately employed in the agricultural sector. In this sector, factor (labour)
productivity growth has been much slower than in the rest of the Indian economy and
even declined since the late 1990s (Lal 2008).
Female illiteracy was found to be a strong determinant of child malnutrition,
which is in line with results in earlier related literature. In all-India, female illiteracy has
declined notably since the early 1990s, from 55% to 39% in 2005. Masked behind these
averages, however, is the fact that female illiteracy fell less in the rural areas of the most
populous states, with the initially highest prevalence of child malnutrition. In these states,Bihar, Madhya Pradesh, Rajasthan and Uttar Pradesh, rural female illiteracy was still well
above 50% in 2005 and the rural population accounts for 75-87% of the total in these
states.26
Overall improvements in female literacy has helped bring down child
malnutrition according to the results reported here, but in rural India, female illiteracy is
still more than twice as high as in urban settings (46 vs 20% in 2005).
The third fundamental explanatory variable for child malnutrition in this study,
the M/F population ratio, used as a proxy for women’s autonomy, was found to have a
significant impact on child stunting in the panel and first-difference regressions, but not
on underweight. In all-India, the M/F ratio has changed only marginally over time, from
26 In the 2001 census, the three (pre-secession) states had a joint population of 374 million, or 36.4% of the
total in India. The population in Uttar Pradesh, at 175 million, exceeded by far the entire population in
Pakistan in 2001 (141 million) and in Bangladesh (133 million). No single country in Africa or Latin

7/23/2019 Peters Ved Berg
http://slidepdf.com/reader/full/peters-ved-berg 28/50
28
107.9 in the 1991 census to 107.1 in the 2001 census, and is estimated at 106.8 in 2006
(GOI 2006b). A recent nationally representative estimate of the M/F ratio at birth found it
to be 111.2, reflecting mainly gender selective abortions (Jha et al 2006). This signals
that the gender bias in India is not about to erode in the near future.
In addition to estimating the relative strength of fundamental variables behind
child malnutrition, we have examined two pathways through which children’s nutritional
status are assumed to be affected. The first is the link from mother to child nutritional
status. Child underweight (but not stunting) was found to be highly correlated to
underweight among mothers. This is in line with the world-wide observation that
malnutrition in expecting mothers is a strong predictor of LBW and subsequent
underweight in infants and young children (ACC/SCN 2000). Unfortunately, we were not
able to test the LBW link directly due to the unavailability of data on birth weights.
Underweight in mothers (BMI<18.5) themselves was found to be significantly correlated
to poverty and own illiteracy (but not the M/F ratio), the same fundamental variables
behind child underweight.
The second pathway focused on the link from female illiteracy, women’s turnout
in state election and state government expenditures on health care. The variable
women/men turnout ratio was found to be strongly associated with women literacy, but
also with poverty and total turnout (female and male). A high women/men turnout ratio
was identified as a highly significant determinant of state health expenditures. In this
regression, the total turnout was significant, but carried a negative sign. The other control
variable, NSDP/C, turned out insignificant. In the regression aimed at finding out
whether qualified child health care, as proxied by the CHCI, depends on SGHE/C, this
was confirmed. Finally, it was found that child stunting (and less so underweight) is
strongly associated with the provision of health care as measured by the CHCI.
In the regressions for confounding variables on the fundamental variables,
qualified health care provision (CHCI) was found to be strongly correlated to poverty and
mother’s autonomy as proxied by the M/F ratio (Table 5). It hence seems that
autonomous mothers are more capable of ensuring that their children are vaccinated and
America has a larger population and only three countries in the world have: China (1,272 million), USA
(285 million) and Indonesia (209 million).

7/23/2019 Peters Ved Berg
http://slidepdf.com/reader/full/peters-ved-berg 29/50
29
receive professional care when sick. This can be expected to result in lower frequency of
prolonged ill health and less retarded skeletal growth (stunting). More autonomous
mothers are also likely to be able to feed their offspring more varied and micro-nutrient
dense (but comparatively expensive) food, which is a necessary (but not sufficient)
precondition for normal (genetic potential) growth in infants and young children.27
The “Asian enigma hypotheses” have only partially been supported by the
findings in this study. In the OLS and IV panel regressions the proxy for women’s
autonomy, the M/F ratio, came out significant for stunting, but not in the regression for
underweight (Table 1). In the first difference regressions, the autonomy variable turned
out insignificant and/or not robust in all regressions (Table 3). The latter result is not
totally surprising since the changes in child underweight have been very small over time.
In the OLS panel regressions for underweight on confounding variables, however,
maternal weight failure (BMI<18.5) was highly significant, corroborating another
“enigma” hypothesis, i.e. that malnutrition tends to be transmitted over generations
(Table 4).
10. Policy implications
In the policy-focused literature on child malnutrition, a distinction is usually made
between long-term and short-term interventions. In this paper, we have focused mainlyon factors that are expected to improve child nutritional status in the long term: poverty
reduction and increases in female literacy and autonomy. It is now widely agreed, not
only among economists, but also nutritionists, as well as analysts from the international
organisations, that substantial poverty reduction is a necessary and important long-term
prerequisite for accomplishing more rapid alleviation of child malnutrition.28
It is notable
that the first MDG is to halve poverty and “hunger” before the year 2015; the merging of
these two objectives in the same goal reflects a generally held perception that they are
closely related. In the present paper we have reported results that confirm this in the case
of India.
27 In a recent study from Mexico, 5-10% of the children were found to be both stunted and overweight,
indicating micro-nutrient deficiency and overindulgence of calorie-rich staple food (Fernald and Neufeld
2006).

7/23/2019 Peters Ved Berg
http://slidepdf.com/reader/full/peters-ved-berg 30/50
30
If poverty is to be reduced more forcefully in India than in the recent past, future
economic growth has to encompass households in the lowest income quintiles to a larger
extent. In the macro-economics literature on India, there seems to be almost consensus on
the required strategy, at least in broad terms. The prime focus should be on increasing
labour productivity (and hence incomes) in agriculture, which still (2005) employs 54%
of the Indian labour force. This share has dropped by 6 percentage points only from 1993
and India is probably one of very few countries in which employment in the agricultural
sector is still growing in absolute numbers. The productivity and income gaps between
the agricultural and the industry and service sectors have grown rapidly since the early
1990s and are estimated to be around five-fold in recent years (Bosworth et al 2008).
However, as labour productivity in agriculture increases, surplus labour has to be
absorbed in other rapidly growing labour-intensive sectors. The small-scale (rural)
manufacturing sector should have good potential, given the abundance of low-skilled
labour in India, but has so far not been expanding very rapidly.29
As we have seen, female illiteracy is a major drag on the alleviation of child
malnutrition through a multitude of channels (Table 5). That female illiteracy is still close
to 50% in rural India suggests ample scope for improvement that our results suggest
would have a significant impact on child malnutrition. In this perspective, it is
encouraging that female secondary school enrolment in rural areas is on the increase in
many states (but with some notable exceptions). More education for males may also be
helpful for eroding the conservative values underlying the discrimination of women, as
reflected in the high and persistent M/F population ratios.
In most of the policy-oriented epidemiology-cum-nutrition literature, the focus is
on targeted interventions to alleviate child malnutrition in the short and medium terms.
There is a wealth of evaluations demonstrating high returns to such interventions in
strictly controlled experiments in small select communities (Allen and Gillespie 2001;
Behrman et al 2004; Horton et al 2008; Lancet appendix 2008). There is a dearth of
reliable evaluations of large, scaled-up interventions in developing countries aimed at
28 See, for instance, the two series of articles on “Child development in developing countries” and
“Maternal and child undernutrition”, published in The Lancet in early 2008. Also see World Bank 2004.

7/23/2019 Peters Ved Berg
http://slidepdf.com/reader/full/peters-ved-berg 31/50
31
entire (sub)-populations. The available studies find, however, that most such
interventions have been poorly targeted to the intended groups, e.g. malnourished
children (Coady et al 2004; Lancet appendix 2008).
Some of the results derived in the present paper suggest that targeted interventions
to children should have promising effects on the reduction of child malnutrition in India
in the not-so-long term. Increased maternal education on feeding practises and on the
importance of qualified health care provision when children are sick are two examples.
Much of this has been tried in India for many decades.
In India, the largest scaled-up program by far, is the Indian Child Distribution
System (ICDS), which on paper covers two-thirds of all villages in India. The program
has recently been evaluated by independent researchers, by at least three official Indian
government commissions, and by the World Bank.30 All found the ICDS in general to be
underfinanced, ill targeted and inefficiently managed, and hence to have little or no
impact on children.
The federal Indian government has limited juridical and financial power over the
health-care sector in the states, but provides the main funding for the ICDS and a number
of other programs aimed at improving child and maternal welfare. More generous federal
government financial support for this program is underway since 2004/05 (GOI 2006).
This is a promising start, but as the evaluations show, what is also required is an
efficiency-enhancing overhaul of the program, which has yet to materialise. As noted in a
recent official evaluation: “After 30 years of rich experience in the programmatic
perspective, a paradigm shift is required to reform the ICDS in respect of overall
programme management for a faster and sustained achievement of child and women
nutritional goals” (GOI 2007c). There is no lack of suggestions for how to enhance the
efficiency of the ICDS (e.g. Levinsson et al 2005) and there are local success stories
(Tarozzi 2005) that may be possible to emulate in other states.
Another option is to replace (or supplement) the ICDS and other defunct existing
programs with some form of conditional cash transfer scheme of the type that Mexico
29 For more detailed quantitative analyses along these lines, see Datt and Ravallion 2002; Foster andRosenzweig 2004; Loayza and Raddatz 2006; Bosworth et al 2007; Kraay 2007; Honorati and Mengistae
2007; Mitra and Ural 2007; World Bank 2008; Lal 2008; Panagarjya 2008; Subramanian 2008.30 Lonchin et al 2006; Kochar 2005; GOI 2005, 2006, 2007c; Granolati 2006; World Bank 2004, 2006.

7/23/2019 Peters Ved Berg
http://slidepdf.com/reader/full/peters-ved-berg 32/50
32
(Progresa/opportunidad) and Brazil (Bolsa famiglia) have initiated. These are among the
few large-scale child programs in developing countries that have been efficient and
effective according to a number of evaluations.31
It may be that conditional cash-transfer
programs work well in Latin American countries because child malnutrition is heavily
concentrated geographically and to the poorest households (Svedberg 2007). In India,
where malnutrition is widespread (cf. figures 3 and 4), targeting could be more
problematic and costly (Adato and Hoddinott 2007). Nevertheless, cash programs ought
to be considered, but have so far not been widely discussed in India. The recent focus
seems to have been on expanding and rejuvenating the hitherto dismal (Gahia 1996)
National Rural Employment Guarantee Scheme.
In sum, the shining overall economic performance of the Indian economy since
the early 1990s has undoubtedly left large population segments in the shade, as reflected
in slow declines of poverty and child malnutrition. The most promising route ahead is a
combination of an overall long-term economic growth strategy that is more inclusive of
the poor population groups paired with improved targeted interventions for the alleviation
of child malnutrition in the shorter term. Whatever strategies and programs that are opted
for, however, the prospects for success depend on financial funding, commitment and
operational efficiency ⎯ and hence on political priorities.
31 Coady et al 2004; Behrman et al 2004; Soares et al 2007; Black et al 2008; Horton et al 2008.

7/23/2019 Peters Ved Berg
http://slidepdf.com/reader/full/peters-ved-berg 33/50
33
References (incomplete)
Abadian, S. (1996). Women’s autonomy and its impact on fertility. World Development
24: 1793-1809.
ACC/SCN (2000). Low birth weight. Nutrition policy paper 18. Geneva: WHO.
Adato, M and J. Hoddinott (2007). Conditional cash transfer programs: A “magic bullet”
for reducing poverty? 2020 Focus Brief. International Food Policy Research
Institute, Washington DC.
ADB (2007). Inequality in Asia: Key Indicators 2007 Special Chapter. Asian
Development Bank.
Alderman, H, Hoddinott, J and Kinsey, B (2007). Long term consequences of early
childhood malnutrition. Oxford Economic Papers 58: 450-74.
Banerjee, A, Iyer, L (2005). History, institutions, and economic performance: The legacy
of colonial land tenure systems in India. American Economic Review 95(4):
1190-12313.
Behrman, J.R, Alderman, H and Hoddinott, J. (2004). Malnutrition and hunger. In:
Lomborg B (ed). Global crises, global solutions. Cambridge: Cambridge
University Press, pp.363-420.
Bhandari, N, Bahl, R and Taneja, S, et al (2002). Growth performance of affluent Indian
children is similar to that in developed countries. Bulletin of the World Health
Organization 80.
Bhutta, Z.A (2006). Effect of infections and environmental factors on growth and
nutritional status in developing countries. Journal of Pediatric Gastroenterology
and Nutrition 43: 13-21.
Bhutta, Z.A, Ahmed, T, Black, R.E, et al (2008). What works? Interventions for maternal
and child undernutrition and survival. The Lancet 371: 417-40.
Black, R.E, Allen, L.H, Bhutta, Z.A et al (2008). Maternal and child undernutrition:
Global and regional exposures and health consequences. The Lancet 371: 243-60.
Booroha, V.K (2004). The height-for-age of Indian children. Economics and Human
Biology 3: 45-65.
Bosworth, B, Collins, S.M and Virmani, A (2007). Sources of growth in the Indian
economy. NBER Working Paper Series 12901.

7/23/2019 Peters Ved Berg
http://slidepdf.com/reader/full/peters-ved-berg 34/50
34
Chen, S. and Ravallion, M (2007). Absolute poverty measures for the developing world,
1981-2004. World Bank Policy Research Working Paper 4211. Washington DC:
World Bank.
Coady, D, Grosh, M and Hoddinott, J (2004). Targeting of transfers in developing
countries. World Bank regional and sectoral studies, Washington DC: World
Bank.
Datt, G. and Ravallion, M (2002). Is India’s economic growth leaving the poor behind?
Journal of Economic Perspectives 16(3): 89-108.
Dewey, K.G. and Cohen, R.J. (2007). Does birth spacing affect maternal or child
nutritional status? A systematic literature review. Maternal and Child Nutrition 3:
151-73.
Deaton, A (2003). Adjusted Indian poverty estimates for 1999-2000. Economic and
Political Weekly January 25.
Deaton, A (2007). Height, health, and development. Proceedings of the National
Academy of Science of the USA 104: 13232-37.
Deaton, A (2008). Height, health, and inequality: The distribution of adult heights in
India. American Economic Review 98.
Deaton, A and Drèze, J (2008). Nutrition in India: Facts and interpretations. Mimeo,
Princeton University.
Deaton, A and Kosel, V (eds) (2005). Data and dogma: The great Indian poverty debate.
New Delhi: Macmillan India.
Doepke, M (2004). Accounting for fertility decline during the transition to growth.
Journal of Economic Growth 9: 347-83.
Drèze, J and Sen A.K (1995). India: Economic development and social opportunity.
Oxford: Oxford University Press.
Economic Research Foundation (2006). Government Health Expenditure in India: A
benchmark study. MacArthur foundation, New Delhi, India.
Fernald, L.C. and Neufeld, L.M (2006). Overweight with concurrent stunting in very
young children from rural Mexico: Prevalence and associated factors. European
Journal of Clinical Nutrition 61: 623-32.

7/23/2019 Peters Ved Berg
http://slidepdf.com/reader/full/peters-ved-berg 35/50
35
Foster, A.D and Rosenzweig, M.R (2004). Agricultural productivity growth, rural
economic diversity and economic reforms: India 1970-2000. Economic
Development and Cultural Change 52: 509-42.
Gahia, R (1996). How dependent are the rural poor on the Employment Guarantee
Scheme in India? Journal of Development Studies 32: 669-94.
Gahia, R and Kulkarni, V (2005). Anthropometric failure and persistence of poverty in
rural India. International Review of Applied Economics 19: 179-97.
Global Nutrition Review Team (2008). Large-scale Nutrition Programs. The Lancet.
WEB Appendix 17.
Gragnolati M. (2006). India’s undernourished children: A call for reform and action.
Washington DC: World Bank.
Grantham-McGregor S, Chueng Y.B, Cueto S, et al. (2007). Development potential in the
first 5 years for children in developing countries. The Lancet 369: 60-68.
Government of India, Census 1991 and 2001. New Delhi: www.censusindia.net.
Government of India (2005). Report of the National Commission on Macroeconomics
and Health. Ministry of Health and Family Welfare. New Delhi.
Government of India (2006). Annual report 2005-2006. Ministry of Women and Child
Development. New Delhi.
Government of India. (2007a). The National Family Health Survey 2005-06. Ministry of
Health and Family Welfare. New Delhi.
Government of India (2007b). Poverty estimates for 2004-05. Press information bureau.
New Delhi.
Government of India (2007c). ICDS and nutrition in the eleventh five-year plan (2007-
2012). Ministry of women and child development. New Delhi.
Government of India (2008). Projected population for 2006. Registrar General India.
New Delhi.
Haddad, L.H, Alderman, H, Appleton, S, et al. (2003). Reducing child undernutrition:
How far does income growth take us? World Bank Economic Review 17: 107-31.
Honorati, M, Mangistae, T (2007). Corruption, the business environment, and small
business growth in India. World Bank Policy Research Working Paper 4338.
World Bank.

7/23/2019 Peters Ved Berg
http://slidepdf.com/reader/full/peters-ved-berg 36/50
36
Horton, S, Alderman, H and Rivera, A (2008). Hunger and Malnutrition. Copenhagen
Consensus 2008 Challenge Paper. Copenhagen Consensus Center.
Jha P, Kumar R, Vasa P, et al (2006). Low male-to-female sex ratio of children born in
India: National survey of 1.1 million households. The Lancet 367: 211-16.
Kochar, A (2005). Can targeted programs improve nutrition? An empirical analysis of
India’s Public Distribution System. Economic Development and Cultural Change
54: 203-35.
Kochar, A, Kumar, U, Rajan, R, et al (2006). India’s pattern of development: What
happened? What follows? Journal of Monetary Economics 53: 981-1019.
Kraay, A (2006). When is growth pro-poor? Evidence from a panel of countries. Journal
of Development Economics 80: 198-227.
Lal, D. (2008). An Indian economic miracle? Cato Journal 28: 11-33.
Levinsson, F.J, Barney, J, Bassett, L and Schultink, W (2005). Generating further
reductions of child malnutrition in India’s BIMARU states: What are the options
now? Food Policy and Applied Nutrition Program Discussion Paper 33. Tufts
University.
López-Casasnova, G, Rivera, B and Currais, L (eds) (2005). Health and economic
growth. Findings and policy implications. Cambridge: The MIT Press.
Loayza, N. and Raddatz, C (2006). The composition of growth matters for poverty
alleviation. World Bank Policy Research Working Paper 4077. Washington DC.
Lokshin M, Das Gupta, M, Gragnolati, M and Ivnaschenko, O (2005). Improving child
nutrition? The Integrated Child Development Services in India. Development and
Change 36: 613-40.
Lucas, R.E.B (1998). Internal migration and urbanization: Recent contributions and new
evidence. IED Discussion Paper Series 91. Boston University.
Misra, R, Chatterjee, R and Rao S (2003). India health report. New Delhi: Oxford
University Press.
Mitra, D, Ural, B.P (2007). Indian manufacturing: a slow sector in a rapidly growing
Economy. World Bank Policy Research Working Paper 4233. World Bank.
NCMH (2005). Report of the National Commission on Macroeconomics and Health.
Government of India.

7/23/2019 Peters Ved Berg
http://slidepdf.com/reader/full/peters-ved-berg 37/50
37
Nubé, M (2005). Relationship between undernutrition prevalence among children and
adult women at national and subnational level. European Journal of Clinical
Nutrition 59: 1112-20.
Osmani, S.R and Bhargava, A (1998). Health and nutrition in emerging Asia. Asian
Development Review 16: 31-71.
Osmani S.R. and Sen A.K. (2003). The hidden penalties of gender inequality: fetal
origins of ill-health. Economics and Human Biology 1: 105-21.
Panagariya, A (2008). India: the emerging giant. Oxford: Oxford University Press.
Pande, R. (2003). Selected gender differences in childhood nutrition and immunisation in
rural India. Demography 40: 395-418.
Popli. G, Parikh, A and Palmer-Jones, R (2005). Are the 2000 poverty estimates for India
a myth, artefact or real? Economic and Political Weekly October 22: 4619-24.
Radhakrishna, R and Ravi, C (2004). Malnutrition in India. Trends and determinants.
Economic and Political Weekly February 20: xxxxx.
Ramalingaswami, V., Jonson, U., Rohde J. (1996). The Asian enigma. The progress of
nations. New York: UNICEF.
Reddy, S.G. (2007). Indian poverty estimates: How great is the debate? Economic and
Political Weekly xx: yy-yy.
Scrimshaw, N.S, Taylor, C.E and Gordon, J.E (1959). Interactions of nutrition and
infection. American Journal of Medical Science 237: 367-403.
Sen, A and Himanshu. (2004). Poverty and inequality in India ⎯ I and II. Economic and
Political Weekly 39: 4247-63; 39: 4361-75.
Sen A.K (1992). Missing women. British Medical Journal 304: 586-87.
Smith, L.C and Haddad, L (2002). How potent is economic growth in reducing
undernutrition? What are the pathways of impact? New cross-country evidence.
Economic Development and Cultural Change 51: 55-76.
Smith L.C, Ramakrishnan, U, Ndiaye A, et al (2003). The importance of women’s status
for child nutrition in developing countries. Research Report 131. Washington DC:
IFPRI.

7/23/2019 Peters Ved Berg
http://slidepdf.com/reader/full/peters-ved-berg 38/50
38
Smith, L.C and Byron, E.M (2005a). Is greater decision making power of women
associated with reduced gender discrimination in south Asia? FCND Discussion
Paper 200. Washington DC: IFPRI.
Smith, L.C, Ruel, M.T and Ndiaye, A (2005b). Why is child malnutrition lower in urban
than in rural areas? Evidence from 36 developing countries. World Development
33: 1285-1305.
Soares, F.V, Soares, M and Medeiros, R.G (2006). Cash transfer programs in Brazil:
Impacts on inequality and poverty. UNDP Working Paper 21.
Shrimpton, R, Victoria, C.G, de Onis, M, et al (2001). Worldwide timing of growth
faltering: Implications for nutritional interventions. Pediatrics 107: 75-82.
Srivastava, R and Sasikumar, S.K (2003). An overview of migration in India, its impacts
and key issues. Paper for the Regional conference on Migration, Development
and Pro-Poor Policy Choices in Asia (Dhaka, Bangladesh).
Stock, J.H and Watson, M.W (2007). Introduction to econometrics. Boston: Addison
Wesly.
Subramanian, A (2008). India’s turn: Understanding the Economic Transformation.
Oxford: Oxford University Press.
Svedberg, P (2000). Poverty and undernutrition: Theory, measurement and policy.
Oxford: Oxford University Press.
Svedberg, P (2004). Malnutrition and hunger: alternative perspectives. Lomborg, B (ed).
Global crises, global solutions. Cambridge: Cambridge University Press; pp.421-
34.
Svedberg, P (2006). Declining child malnutrition: a re-assessment, International Journal
of Epidemiology 35: 1336-46.
Svedberg, P (2007). The concentration of child malnutrition: Consequences for the
choice of policy intervention (mimeo.)
Tarozzi, A (2005). The Indian Public Distribution System as provider of food security:
Evidence from child nutrition in Andhra Pradesh. European Economic Review
49: 1305-30.
Tarozzi, A and Mahajan, A (2007). Child nutrition in India in the nineties. Economic
Development and Cultural Change 56: 441-86.

7/23/2019 Peters Ved Berg
http://slidepdf.com/reader/full/peters-ved-berg 39/50
39
Tomkins, A and Watson, F (1989). Malnutrition and infection: A review. ACC/SCN
Nutrition Policy Discussion Paper 3. Geneva: WHO.
Victoria, C.G, Adair, L, Fall, C et al (2008). Maternal and child undernutrition:
Consequences for adult health and human capital. The Lancet 371: 340-57.
Walker, S.P, Wachs, T.D, Gardner, J.M, et al (2007). Child development: risk factors for
adverse outcomes in developing countries. The Lancet 369: 145-57.
Waterlow, J.C (1992). Protein energy malnutrition. London: Edward Arnold.
Wooldridge, J.M (2006). Introductory econometrics. Thomson Southwestern.
World Bank (2004). Proceedings from the conference “Attaining the Millennium
Development Goals in India”, June 17-18. New Delhi.
World Bank (2006). Repositioning nutrition as central to development. Washington DC:
World Bank.
World Bank (2008). World Development Report 2008: Agriculture for Development.
Washington DC: World Bank.
World Health Organisation (2007a). Global database on child growth and malnutrition.
Geneva: WHO.
World Health Organisation (2007b). World health report 2007. Geneva: WHO.
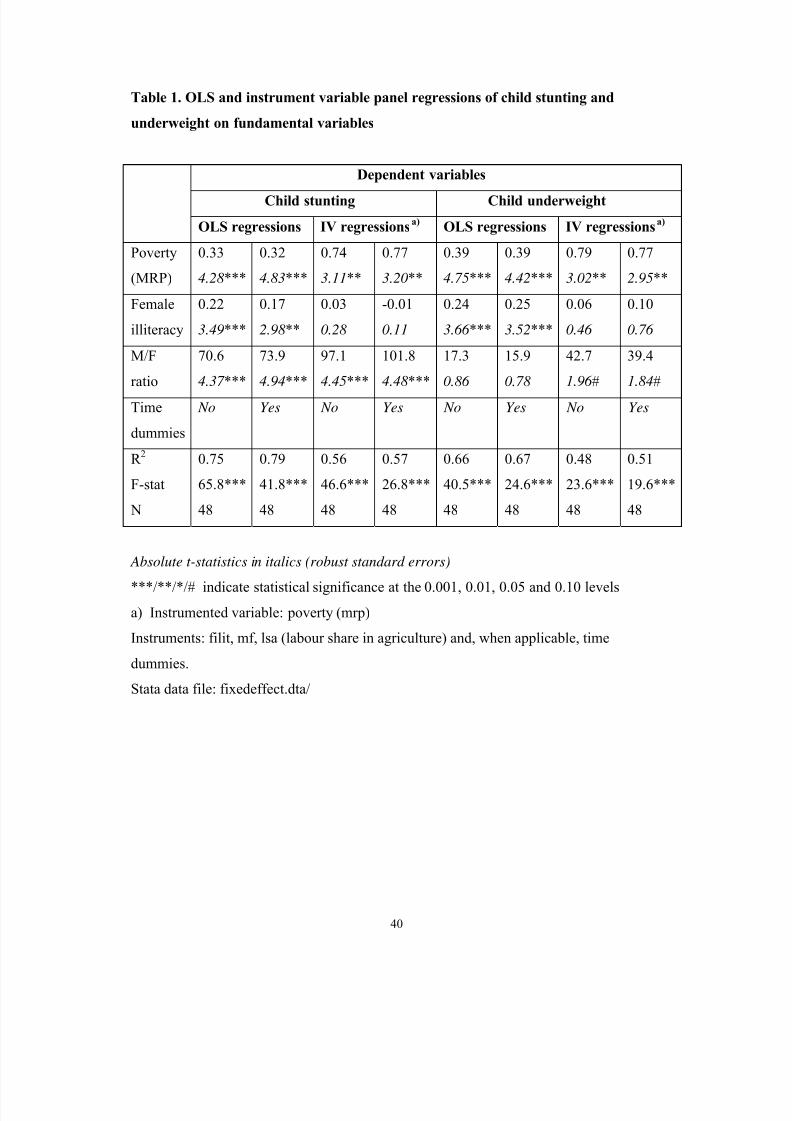
7/23/2019 Peters Ved Berg
http://slidepdf.com/reader/full/peters-ved-berg 40/50
40
Table 1. OLS and instrument variable panel regressions of child stunting and
underweight on fundamental variables
Dependent variables
Child stunting Child underweight
OLS regressions IV regressionsa)
OLS regressions IV regressionsa)
Poverty
(MRP)
0.33
4.28 ***
0.32
4.83***
0.74
3.11**
0.77
3.20**
0.39
4.75***
0.39
4.42***
0.79
3.02**
0.77
2.95**
Female
illiteracy
0.22
3.49***
0.17
2.98 **
0.03
0.28
-0.01
0.11
0.24
3.66 ***
0.25
3.52***
0.06
0.46
0.10
0.76
M/F
ratio
70.6
4.37 ***
73.9
4.94***
97.1
4.45***
101.8
4.48 ***
17.3
0.86
15.9
0.78
42.7
1.96 #
39.4
1.84#
Time
dummies
No Yes No Yes No Yes No Yes
R 2
F-stat
N
0.75
65.8***
48
0.79
41.8***
48
0.56
46.6***
48
0.57
26.8***
48
0.66
40.5***
48
0.67
24.6***
48
0.48
23.6***
48
0.51
19.6***
48
Absolute t-statistics in italics (robust standard errors)
***/**/*/# indicate statistical significance at the 0.001, 0.01, 0.05 and 0.10 levels
a) Instrumented variable: poverty (mrp)
Instruments: filit, mf, lsa (labour share in agriculture) and, when applicable, time
dummies.
Stata data file: fixedeffect.dta/

7/23/2019 Peters Ved Berg
http://slidepdf.com/reader/full/peters-ved-berg 41/50
41
Table 2. First difference and fixed effect panel regressions of child stunting and
underweight on fundamental variables
Dependent variables
Child stunting Child underweight
First-diff Fixed effect First-diff Fixed effect
Povertye)
0.51
3.02**
0.24
1.10
0.13
0.70
-0.05
0.16
0.15
0.93
-0.14
0.61
Female
illiteracy
0.81
3.76**
0.43
4.15***
0.08
0.33
0.55
1.84#
0.32
2.53*
0.02
0.09
M/F ratio 135.0
2.59*
128.7
1.49
150.5
2.03*
40.5
0.32
-36.8
0.33
22.7
0.20
Time
dummies
- No Yes - No Yes
R 2
F-stat
N
0.60
6.94**
16
0.88
61.0***
48
0.90
47.9***
48
0.09
1.40
16
0.84
17.6***
48
0.86
14.7***
48
Absolute t-statistics in italics (robust standard errors)
***/**/*/# indicate statistical significance at the 0.001, 0.01, 0.05 and 0.10 levels
a) The poverty estimate in the fixed effect regressions are based on Mixed Recall Period:
(MRP) and the first difference on Uniform Recall Period (URP).
Stata data files. fixedeffects.dta and firstdifference.dta.
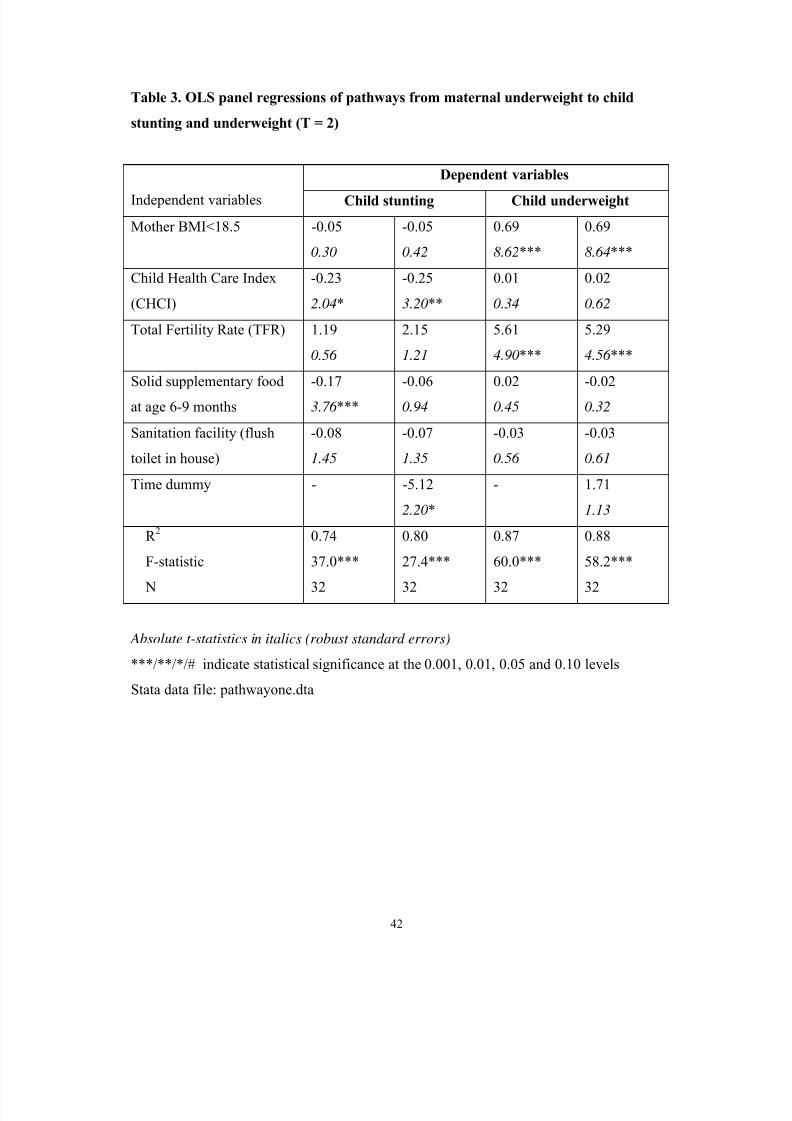
7/23/2019 Peters Ved Berg
http://slidepdf.com/reader/full/peters-ved-berg 42/50
42
Table 3. OLS panel regressions of pathways from maternal underweight to child
stunting and underweight (T = 2)
Dependent variables
Independent variables Child stunting Child underweight
Mother BMI<18.5 -0.05
0.30
-0.05
0.42
0.69
8.62***
0.69
8.64***
Child Health Care Index
(CHCI)
-0.23
2.04*
-0.25
3.20**
0.01
0.34
0.02
0.62
Total Fertility Rate (TFR) 1.19
0.56
2.15
1.21
5.61
4.90***
5.29
4.56 ***
Solid supplementary food
at age 6-9 months
-0.17
3.76 ***
-0.06
0.94
0.02
0.45
-0.02
0.32
Sanitation facility (flush
toilet in house)
-0.08
1.45
-0.07
1.35
-0.03
0.56
-0.03
0.61
Time dummy - -5.12
2.20*
- 1.71
1.13
R 2
F-statistic
N
0.74
37.0***
32
0.80
27.4***
32
0.87
60.0***
32
0.88
58.2***
32
Absolute t-statistics in italics (robust standard errors)
***/**/*/# indicate statistical significance at the 0.001, 0.01, 0.05 and 0.10 levels
Stata data file: pathwayone.dta

7/23/2019 Peters Ved Berg
http://slidepdf.com/reader/full/peters-ved-berg 43/50
43
Table 4. OLS panel regressions of pathways from female illiteracy to child stunting
and underweight (T = 3)
Dependent variables:
Female/male
turnout in
elections
State health
expenditures
per capita
Child
health care
index
Child
stunting
Child
underweight
Independent
variable
Female
illiteracy
Female/male
turnout in
elections
State health
expenditures
per capita
Child
health care
index
Child health
care index
-0.002
6.59***
543.9
3.10**
0.08
2.02*
-0.26
4.51***
-0.19
2.30*
Control
variables
Poverty***
M/F*
Tot turn***
Tot turnout*
NSDP/C
TFR***
Sanit
TFR*
Sanit
TFR
Sanit***
Time dum Yes (insign) Yes (insign) Yes (insign) Yes(sign#) Yes (insign)
R 2
F-statistic
N
0.80
25.2***
48
0.51
8.9***
48
0.69
30.2***
48
0.79
37.4***
48
0.63
23.9***
48
Absolute t-statistics in italics (robust standard errors)
***/**/*/# indicate statistical significance at the 0.001, 0.01, 0.05 and 0.10 levels
Stata file: pathwaytwo.dta
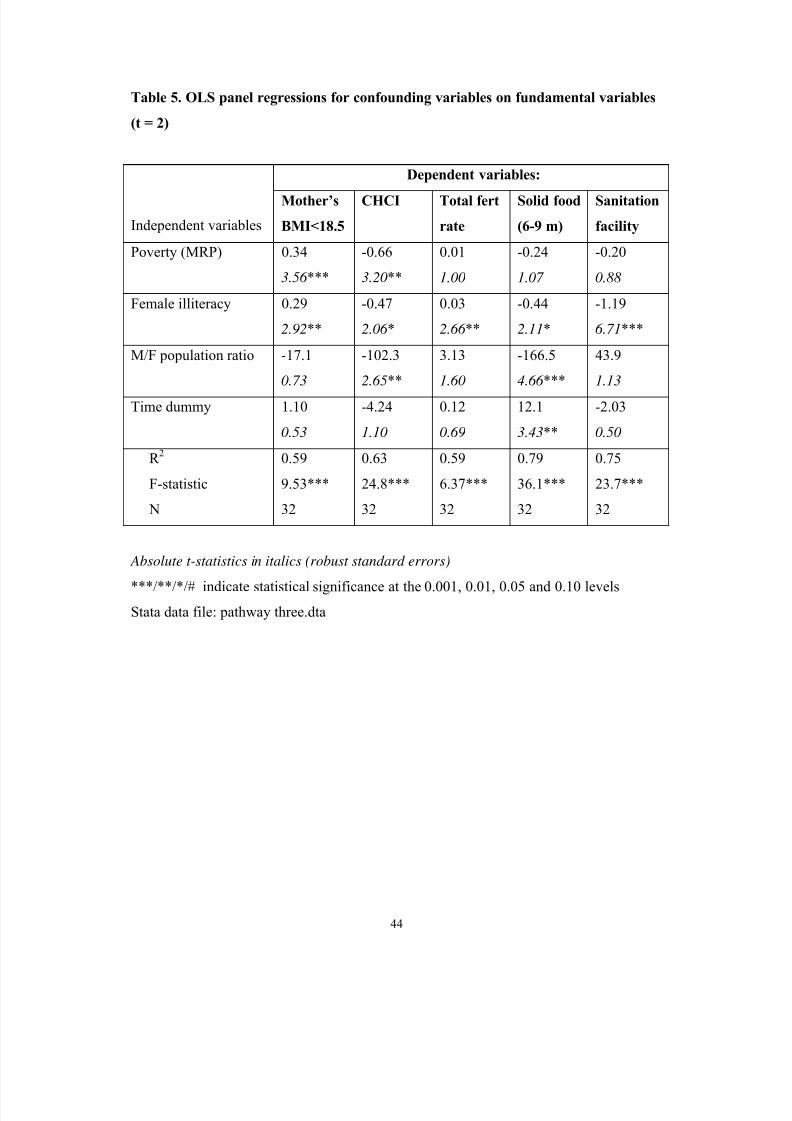
7/23/2019 Peters Ved Berg
http://slidepdf.com/reader/full/peters-ved-berg 44/50
44
Table 5. OLS panel regressions for confounding variables on fundamental variables
(t = 2)
Dependent variables:
Independent variables
Mother’s
BMI<18.5
CHCI Total fert
rate
Solid food
(6-9 m)
Sanitation
facility
Poverty (MRP) 0.34
3.56 ***
-0.66
3.20**
0.01
1.00
-0.24
1.07
-0.20
0.88
Female illiteracy 0.29
2.92**
-0.47
2.06 *
0.03
2.66 **
-0.44
2.11*
-1.19
6.71***
M/F population ratio -17.1
0.73
-102.3
2.65**
3.13
1.60
-166.5
4.66 ***
43.9
1.13
Time dummy 1.10
0.53
-4.24
1.10
0.12
0.69
12.1
3.43**
-2.03
0.50
R 2
F-statistic
N
0.59
9.53***
32
0.63
24.8***
32
0.59
6.37***
32
0.79
36.1***
32
0.75
23.7***
32
Absolute t-statistics in italics (robust standard errors)
***/**/*/# indicate statistical significance at the 0.001, 0.01, 0.05 and 0.10 levels
Stata data file: pathway three.dta

7/23/2019 Peters Ved Berg
http://slidepdf.com/reader/full/peters-ved-berg 45/50
45
Figure 1. Change in child stunting and underwieght and mothers'
wi th a BMI<18.5 between the three NFHSs in India
30
35
40
45
50
55
1 2 3
NFHS Survey years
P r e v a l e n c e
o f s t u n t i n g a n d u n d e r w e i g h t ( % )
Children underweight
Children stunted
Mothers underweight
1992/93 1998/99 2005/06

7/23/2019 Peters Ved Berg
http://slidepdf.com/reader/full/peters-ved-berg 46/50
46
Figure 2. Indian states where prevalence of chi ld underweight
increased between two latest surveys
20
25
30
35
40
45
50
55
60
65
1 2 3
NFHS surveys (1-3)
C
h i l d u n d e r w e i g h t ( % )
Madhya Pradesh
Bihar
Assam
Gujarat
Haryana
Kerala
1992/93 1998/99 2005/06

7/23/2019 Peters Ved Berg
http://slidepdf.com/reader/full/peters-ved-berg 47/50
47
Figure 3. Prevalence of chi ld stunting (blue) and underweight
(red) in India by wealth quintile and average, 1998/99
0
10
20
30
40
50
60
70
1 2 3 4 5 6
Wealth quinti le (1-5) and average (6)
P r e v a l e n c e o f s t u
n t i n g a n d u n d e r w e i g h t ( % )

7/23/2019 Peters Ved Berg
http://slidepdf.com/reader/full/peters-ved-berg 48/50
48
Figure 4. Prevalence of child s tunting and underweight in India
according to mothers' l evel of education, 2005/06
0
10
20
30
40
50
60
1 2 3 4 5
Mother's education (1-4) and average (5)
C h i l d s t u
n t i n g a n d u n d e r w e i g h t ( % )
None <8-9 years 8-9 complet >10 years All

7/23/2019 Peters Ved Berg
http://slidepdf.com/reader/full/peters-ved-berg 49/50
49
Figure 5. Partial correlation between poverty and labour share in agricultu re (LSA)
across 16 largest Indian states (panel data f rom 1993, 1999 and 2005)
Pov = 0.65 LSA - 13.6
(t = 4.63)
adj-R2 = 0.30
0
10
20
30
40
50
60
30 35 40 45 50 55 60 65 70 75 80
Labour Share in agriculture (%)
P o v e r t y ( % )
File: Employment agriculture 2000 NSS, chart 1

7/23/2019 Peters Ved Berg
http://slidepdf.com/reader/full/peters-ved-berg 50/50
Figure 6. Correlation between reduction in poverty and growth of net state domestic
product per capita across 25 Indian states between 1993/94 and 2004/05
Poverty reduction = 0.047 NSDP/C growth - 36.7
R2 = 0.0029
-90
-80
-70
-60
-50
-40
-30
-20
-10
00 120
Growth of NSDP per capita (cumulative %)
R e d u c t i o n o f p o v e r t y ( c u m u l a t i v e %
)
BIGU AP
AS
HA
HP
KA
KE
MP
MA
OR
PU
RA
TN
UP
WB
20 40 60 80 100