petrÓleos mexicanos - pemex.com sec/20150114_6k_i.pdf · .gov/archives/edgar ... on january 12,...
TRANSCRIPT

14/1/2015 Form 6K
http://www.sec.gov/Archives/edgar/data/932782/000119312515010662/d851494d6k.htm 1/16
6K 1 d851494d6k.htm FORM 6K UNITED STATES
SECURITIES AND EXCHANGE COMMISSIONWashington, D.C. 20549
FORM 6K
REPORT OF FOREIGN PRIVATE ISSUERPURSUANT TO RULE 13a16 OR 15d16
UNDER THE SECURITIES EXCHANGE ACT OF 1934
For the month of January, 2015
Commission File Number 099
PETRÓLEOS MEXICANOS(Exact name of registrant as specified in its charter)
MEXICAN PETROLEUM(Translation of registrant’s name into English)
United Mexican States(Jurisdiction of incorporation or organization)
Avenida Marina Nacional No. 329Colonia Petróleos Mexicanos
México, D.F. 11311México
(Address of principal executive offices)
Indicate by check mark whether the registrant files or will file annual reports under cover of Form 20F or Form 40F.
Form 20F Form 40F
Indicate by check mark if the registrant is submitting the Form 6K in paper as permitted by Regulation ST Rule 101(b)(1)
Yes No
Indicate by check mark if the registrant is submitting the Form 6K in paper as permitted by Regulation ST Rule 101(b)(7)
Yes No
Indicate by check mark whether the registrant by furnishing the information contained in this form is also thereby furnishing the information to theCommission pursuant to Rule 12g32(b) under the Securities Exchange Act of 1934.
Yes No

14/1/2015 Form 6K
http://www.sec.gov/Archives/edgar/data/932782/000119312515010662/d851494d6k.htm 2/16
RECENT DEVELOPMENTS
The following discussion of PEMEX’s recent results should be read in conjunction with the annual report on Form 20F of Petróleos Mexicanos for the fiscalyear ended December 31, 2013, as filed with the U.S. Securities and Exchange Commission (which we refer to as the SEC) on May 15, 2014 (which we refer to asthe Form 20F) and, in particular, “Item 4—Information on the Company” and “Item 5—Operating and Financial Review and Prospects” in the Form 20F. In thisdocument, “PEMEX” refers to Petróleos Mexicanos, PemexExploración y Producción (PemexExploration and Production), PemexRefinación (PemexRefining),PemexGas y Petroquímica Básica (PemexGas and Basic Petrochemicals) and PemexPetroquímica (PemexPetrochemicals) (which we refer to collectively as thesubsidiary entities), and to the subsidiary companies listed in Note 3(a) to the 2013 audited consolidated financial statements included in the Form 20F. PetróleosMexicanos hereby designates this report on Form 6K as being incorporated by reference into the Offering Circular dated January 31, 2014, relating to itsU.S. $42,000,000,000 MediumTerm Notes Program, Series C, due 1 Year or More from Date of Issue.
Exchange Rates
On January 9, 2015, the noon buying rate for cable transfers in New York reported by the Board of Governors of the Federal Reserve System wasPs. 14.5765 = U.S. $1.00.
Business Overview
Production
On January 12, 2015, the weighted average price of the crude oil exported by PEMEX was U.S. $38.11 per barrel, a decrease of 56.5% as compared to theaverage price as of September 30, 2014, which was U.S. $87.51 per barrel.
Liquidity and Capital Resources
Payment to the Federal Government of Mexico
In December 2014, Petróleos Mexicanos made a payment to the federal government of the United Mexican States (which we refer to as the MexicanGovernment), which was partially offset by a capital contribution by the Mexican Government to Petróleos Mexicanos, for a net amount of Ps. 50 billion. Thispayment was made pursuant to a request by the Secretaría de Hacienda y Crédito Público (Ministry of Finance and Public Credit, or the SHCP), in accordance withArticle 6 of the Ley de Ingresos de la Federación para el Ejercicio Fiscal de 2014 (Federal Revenue Law for 2014, or the 2014 Revenue Law), Article 26 of the LeyFederal de Presupuesto y Responsabilidad Hacendaria (Federal Law of Budget and Fiscal Accountability) and the fourteenth transitional article of the Ley dePetróleos Mexicanos (Petróleos Mexicanos Law). This payment was recognized as a Ps. 50 billion net decrease in Mexican Government contributions to PetróleosMexicanos.
Recent Financing Activities
During the period from December 6, 2014 to January 5, 2015, Petróleos Mexicanos participated in the following financing activities:
• On December 15, 2014, Petróleos Mexicanos obtained a loan for Ps. 3,500,000,000 bearing interest at a floating rate, which matures on March 17, 2015.
• On December 18, 2014, Petróleos Mexicanos obtained a loan for Ps. 10,000,000,000 bearing interest at a floating rate, which matures on January 2,2025.
• On December 19, 2014, Petróleos Mexicanos obtained a loan for Ps. 10,000,000,000 bearing interest at a floating rate, which matures on March 19,2025.
• On December 19, 2014, Petróleos Mexicanos borrowed U.S. $700,000,000 from its credit facility dated as of December 17, 2014 with Crédit AgricoleCIB, which is due on June 19, 2015.
2
14/1/2015 Form 6K
http://www.sec.gov/Archives/edgar/data/932782/000119312515010662/d851494d6k.htm 3/16
During the period from December 6, 2014 to January 5, 2015, P.M.I. Holdings, B.V. obtained U.S. $690,000,000 from its revolving credit line and repaid U.S.$1,580,000,000.
United Mexican States
The information in this section with regard to the United Mexican States (which we refer to as Mexico) has been included due to Petróleos Mexicanos’ andthe subsidiary entities’ relationship with the Mexican Government and has been reviewed by the SHCP.
The Economy
Gross Domestic Product
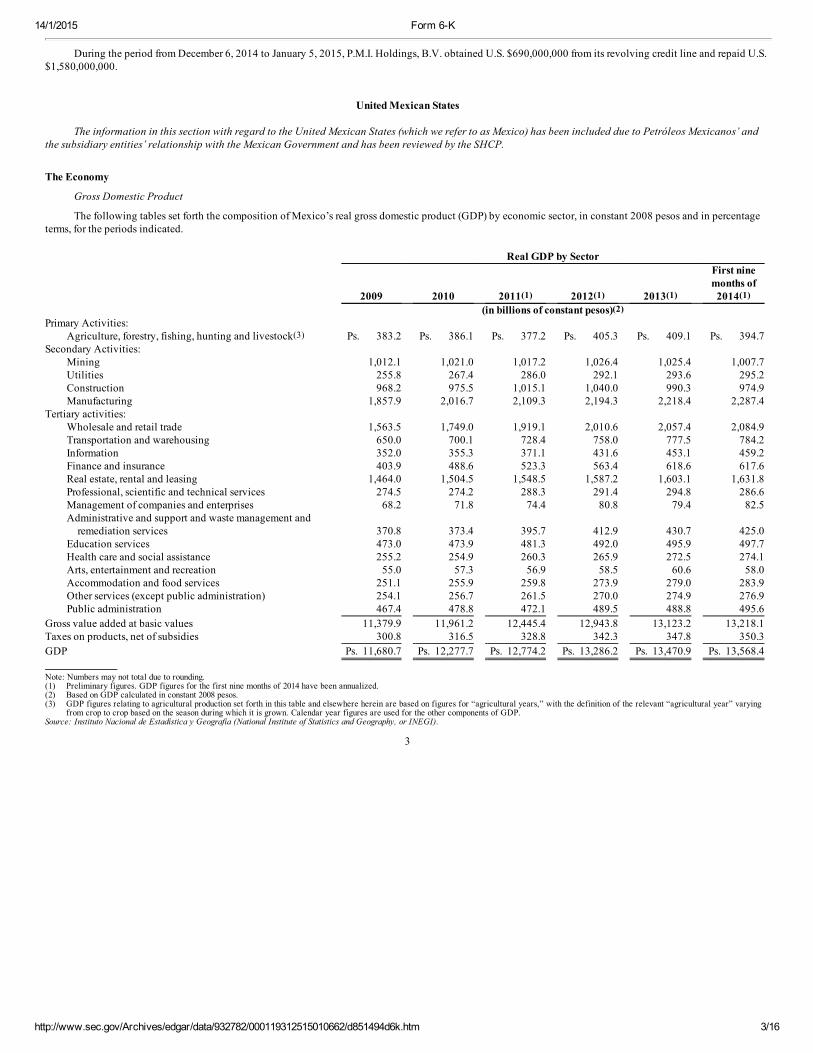
The following tables set forth the composition of Mexico’s real gross domestic product (GDP) by economic sector, in constant 2008 pesos and in percentageterms, for the periods indicated. Real GDP by Sector
2009 2010 2011(1) 2012(1) 2013(1)
First ninemonths of2014(1)
(in billions of constant pesos)(2) Primary Activities:
Agriculture, forestry, fishing, hunting and livestock(3) Ps. 383.2 Ps. 386.1 Ps. 377.2 Ps. 405.3 Ps. 409.1 Ps. 394.7 Secondary Activities:
Mining 1,012.1 1,021.0 1,017.2 1,026.4 1,025.4 1,007.7 Utilities 255.8 267.4 286.0 292.1 293.6 295.2 Construction 968.2 975.5 1,015.1 1,040.0 990.3 974.9 Manufacturing 1,857.9 2,016.7 2,109.3 2,194.3 2,218.4 2,287.4
Tertiary activities: Wholesale and retail trade 1,563.5 1,749.0 1,919.1 2,010.6 2,057.4 2,084.9 Transportation and warehousing 650.0 700.1 728.4 758.0 777.5 784.2 Information 352.0 355.3 371.1 431.6 453.1 459.2 Finance and insurance 403.9 488.6 523.3 563.4 618.6 617.6 Real estate, rental and leasing 1,464.0 1,504.5 1,548.5 1,587.2 1,603.1 1,631.8 Professional, scientific and technical services 274.5 274.2 288.3 291.4 294.8 286.6 Management of companies and enterprises 68.2 71.8 74.4 80.8 79.4 82.5 Administrative and support and waste management andremediation services 370.8 373.4 395.7 412.9 430.7 425.0
Education services 473.0 473.9 481.3 492.0 495.9 497.7 Health care and social assistance 255.2 254.9 260.3 265.9 272.5 274.1 Arts, entertainment and recreation 55.0 57.3 56.9 58.5 60.6 58.0 Accommodation and food services 251.1 255.9 259.8 273.9 279.0 283.9 Other services (except public administration) 254.1 256.7 261.5 270.0 274.9 276.9 Public administration 467.4 478.8 472.1 489.5 488.8 495.6
Gross value added at basic values 11,379.9 11,961.2 12,445.4 12,943.8 13,123.2 13,218.1 Taxes on products, net of subsidies 300.8 316.5 328.8 342.3 347.8 350.3 GDP Ps. 11,680.7 Ps. 12,277.7 Ps. 12,774.2 Ps. 13,286.2 Ps. 13,470.9 Ps. 13,568.4 Note: Numbers may not total due to rounding.(1) Preliminary figures. GDP figures for the first nine months of 2014 have been annualized.(2) Based on GDP calculated in constant 2008 pesos.(3) GDP figures relating to agricultural production set forth in this table and elsewhere herein are based on figures for “agricultural years,” with the definition of the relevant “agricultural year” varying
from crop to crop based on the season during which it is grown. Calendar year figures are used for the other components of GDP.Source: Instituto Nacional de Estadística y Geografía (National Institute of Statistics and Geography, or INEGI).
3

14/1/2015 Form 6K
http://www.sec.gov/Archives/edgar/data/932782/000119312515010662/d851494d6k.htm 4/16
Real GDP Growth by Sector(% change against prior years)(1)
2009 2010 2011(2) 2012(2) 2013(2)
First ninemonths of2014(2)
(3) GDP (constant 2008 prices) (4.7)% 5.1% 4.0% 4.0% 1.4% 1.9% Primary Activities:
Agriculture, forestry, fishing,hunting and livestock (2.5) 0.8 (2.3) 7.4 0.9 3.9
Secondary Activities: Mining (4.0) 0.9 (0.4) 0.9 (0.1) (1.1) Utilities 1.3 4.5 6.9 2.1 0.5 1.8 Construction (6.1) 0.8 4.1 2.5 (4.8) 0.4 Manufacturing (8.4) 8.5 4.6 4.0 1.1 3.4
Tertiary activities: Wholesale and retail trade (12.5) 11.9 9.7 4.8 2.3 2.6 Transportation and warehousing (7.2) 7.7 4.0 4.1 2.6 1.7 Information 8.5 1.0 4.4 16.3 5.0 2.2 Finance and insurance 3.4 21.0 7.1 7.7 9.8 1.3 Real estate, rentaland leasing 1.1 2.8 2.9 2.5 1.0 2.2 Professional, scientific and technical services (5.0) (0.1) 5.1 1.1 1.2 0.1 Management of companies and enterprises (8.2) 5.3 3.5 8.6 (1.8) 3.6 Administrative support, waste management and remediation services (7.0) 0.7 6.0 4.4 4.3 0.5 Education services 0.2 0.2 1.6 2.2 0.8 1.7 Health care and social assistance 2.0 (0.1) 2.1 2.1 2.5 0.7 Arts, entertainment and recreation (4.1) 4.1 (0.7) 2.9 3.4 (0.4) Accommodation and food services (9.6) 1.9 1.5 5.4 1.8 2.6 Other services (except public administration) (0.6) 1.0 1.9 3.3 1.8 1.3 Public administration 2.0 2.4 (1.4) 3.7 (0.1) 3.0
Note: Numbers may not total due to rounding.(1) Based on GDP calculated in constant 2008 pesos.(2) Preliminary figures. GDP figures for the first nine months of 2014 have been annualized. Further, nominal GDP figures for 2013 reflect the latest INEGI release.(3) First nine months of 2014 results are as compared to the same period of 2013.Source:INEGI.
According to preliminary figures, Mexico’s GDP increased by 1.4% in real terms during 2013, as compared to 2012.
According to preliminary figures, during the first nine months of 2014, Mexico’s GDP increased by 1.9% in real terms during the first nine months of 2014, ascompared to the same period of 2013. This increase was primarily due to growths in the manufacturing, primary activities (agriculture, forestry, fishing, hunting andlivestock), and the management of companies and enterprises sectors.
According to preliminary figures, Mexico’s nominal GDP for the first nine months of 2014 was Ps. 16,794.7 billion, a 5.6% nominal increase from the level ofPs. 15,903.2 billion for the same period of 2013. As with all quarterly GDP figures released by INEGI, this nominal GDP figure has been annualized by multiplyingthe GDP results for the latest available quarterly figures by four, and it is calculated as such because it provides the closest approximation for yearend GDPperformance until yearend GDP figures are released.
Prices and Wages
Consumer inflation (as measured by the change in the national consumer price index) for the eleven months ended November 30, 2014 was 3.6%, 19percentage points higher than during the same period of 2013. This was primarily caused by an increase in the production of food, beverage and tobacco productsand other services.
4
14/1/2015 Form 6K
http://www.sec.gov/Archives/edgar/data/932782/000119312515010662/d851494d6k.htm 5/16
Interest Rates
During 2014, interest rates on 28day Cetes (Mexico’s Federal Treasury certificates) averaged 3.0%, as compared to 3.8% during 2013. Interest rates on 91dayCetes averaged 3.1%, as compared to 3.8% during 2013.
On January 8, 2015, the 28day Cetes rate was 2.4% and the 91day Cetes rate was 2.9%.
Employment and Labor
According to preliminary figures, Mexico’s unemployment rate was 4.5% as of November 30, 2014, a four percentage point increase from the rate during thesame period of 2013.
Principal Sectors of the Economy
Manufacturing
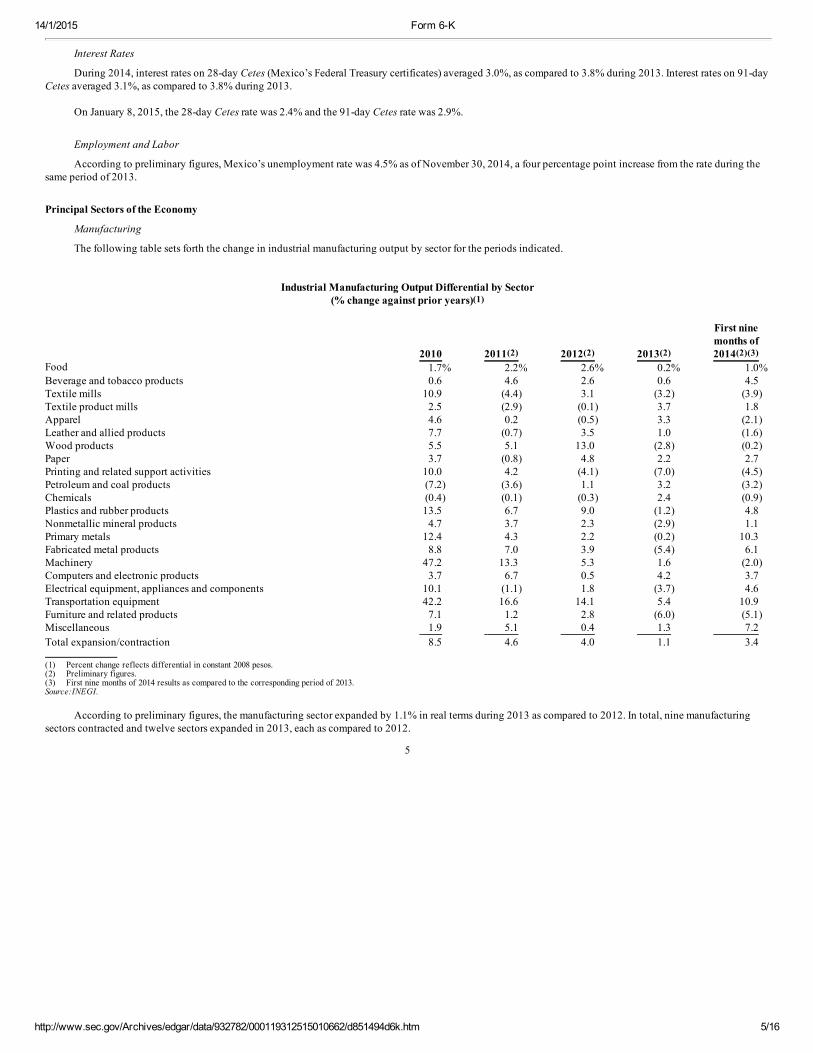
The following table sets forth the change in industrial manufacturing output by sector for the periods indicated.
Industrial Manufacturing Output Differential by Sector(% change against prior years)(1)
2010 2011(2) 2012(2) 2013(2)
First ninemonths of2014(2)(3)
Food 1.7% 2.2% 2.6% 0.2% 1.0% Beverage and tobacco products 0.6 4.6 2.6 0.6 4.5 Textile mills 10.9 (4.4) 3.1 (3.2) (3.9) Textile product mills 2.5 (2.9) (0.1) 3.7 1.8 Apparel 4.6 0.2 (0.5) 3.3 (2.1) Leather and allied products 7.7 (0.7) 3.5 1.0 (1.6) Wood products 5.5 5.1 13.0 (2.8) (0.2) Paper 3.7 (0.8) 4.8 2.2 2.7 Printing and related support activities 10.0 4.2 (4.1) (7.0) (4.5) Petroleum and coal products (7.2) (3.6) 1.1 3.2 (3.2) Chemicals (0.4) (0.1) (0.3) 2.4 (0.9) Plastics and rubber products 13.5 6.7 9.0 (1.2) 4.8 Nonmetallic mineral products 4.7 3.7 2.3 (2.9) 1.1 Primary metals 12.4 4.3 2.2 (0.2) 10.3 Fabricated metal products 8.8 7.0 3.9 (5.4) 6.1 Machinery 47.2 13.3 5.3 1.6 (2.0) Computers and electronic products 3.7 6.7 0.5 4.2 3.7 Electrical equipment, appliances and components 10.1 (1.1) 1.8 (3.7) 4.6 Transportation equipment 42.2 16.6 14.1 5.4 10.9 Furniture and related products 7.1 1.2 2.8 (6.0) (5.1) Miscellaneous 1.9 5.1 0.4 1.3 7.2 Total expansion/contraction 8.5 4.6 4.0 1.1 3.4 (1) Percent change reflects differential in constant 2008 pesos.(2) Preliminary figures.(3) First nine months of 2014 results as compared to the corresponding period of 2013.Source:INEGI.
According to preliminary figures, the manufacturing sector expanded by 1.1% in real terms during 2013 as compared to 2012. In total, nine manufacturingsectors contracted and twelve sectors expanded in 2013, each as compared to 2012.
5

14/1/2015 Form 6K
http://www.sec.gov/Archives/edgar/data/932782/000119312515010662/d851494d6k.htm 6/16
According to preliminary figures, the manufacturing sector expanded by 3.4% in real terms during the first nine months of 2014 as compared to the sameperiod in 2013. This expansion was primarily due to an increase in the manufacturing of primary metals and transportation equipment. In total, nine manufacturingsectors contracted during the first nine months of 2014, while 12 sectors grew in the first nine months of 2014, each as compared to the same period in 2013.
Financial System
Central Bank and Monetary Policy
The M1 money supply of Mexico consists of bills and coins held by the public, plus: (i) checking accounts denominated in local currency and foreigncurrency; (ii) interestbearing deposits denominated in pesos and operated by debit cards; and (iii) savings and loan deposits. At October 31, 2014, Mexico’s M1money supply was 13.4% greater in real terms than the level at October 31, 2013. The amount of bills and coins held by the public was 13.1% greater in real termsthan at October 31, 2013. In addition, the aggregate amount of checking account deposits denominated in pesos was 12.5% greater in real terms than on the samedate in 2013.
At October 31, 2014, financial savings — defined as the difference between the monetary aggregate M4 and bills and coins held by the public — were 6.5%greater in real terms than financial savings at October 31, 2013. Savings generated by Mexican residents increased by 4.8% and savings generated by nonresidentsincreased by 13.9%, both in real terms, as compared to the same period of 2013.
At January 7, 2015, the monetary base totaled Ps. 1,037.4 billion, a 13.0% nominal increase from the level of Ps. 917.9 billion at December 31, 2013, due to anincrease in foreign reserve assets and bills, and bills and coins.
The Securities Markets
The Bolsa Mexicana de Valores (Mexican Stock Exchange) publishes the Índice de Precios y Cotizaciones (Stock Market Index, or the IPC) based on a groupof the 35 most actively traded shares.
At January 8, 2015, the IPC stood at 42,402.3 points, representing a 1.7% decrease from the level at December 31, 2014.
Banking Supervision and Support
At December 31, 2013, the total amount of pastdue commercial bank loans (excluding banks under Mexican Government intervention and those in specialsituations) was Ps. 91.2 billion, as compared to Ps. 61.4 billion at December 31, 2012. The total loan portfolio of the banking system was 5.6% greater in real terms atDecember 31, 2013 than the total loan portfolio at December 31, 2012. Moreover, the pastdue loan ratio of commercial banks was 3.1% at December 31, 2013, ascompared to a ratio of 2.3% at December 31, 2012. This increase was due to the deteriorating quality of personal loans and loans granted to homebuilders. Theamount of commercial bank loan loss reserves (excluding banks under Mexican Government intervention and those in special situations) totaled Ps. 127.4 billion atDecember 31, 2013, as compared to Ps. 109.7 billion at December 31, 2012. As a result, commercial banks had reserves covering 139.8% of their pastdue loans atDecember 31, 2013, well exceeding the minimum reserve level of 10.5%.
At October 31, 2014, the total loan portfolio of the banking system was 0.5% greater in real terms than the total loan portfolio at December 31, 2013.According to preliminary figures, at October 31, 2014, the total amount of pastdue commercial bank loans (excluding those banks undergoing MexicanGovernment intervention and those in special situations) was Ps. 95.3 billion, as compared to Ps. 91.2 billion at December 31, 2013. Moreover, the pastdue loanratio of commercial banks was 3.1%, the same as at December 31, 2013. The amount of loan loss reserves held by commercial banks at October 31, 2014 totaled Ps.122.2 billion, as compared to Ps. 127.4 billion at December 31, 2013. As a result, commercial banks had reserves covering 128.3% of their pastdue loans, wellexceeding the minimum reserve level of 10.5%.
6
14/1/2015 Form 6K
http://www.sec.gov/Archives/edgar/data/932782/000119312515010662/d851494d6k.htm 7/16
External Sector of the Economy
Foreign Trade
According to preliminary figures, during the first eleven months of 2014, Mexico registered a trade deficit of U.S. $2.4 billion, as compared to a trade deficit ofU.S. $2.8 billion for the same period of 2013. This was caused mainly by an increase in nonpetroleum exports and exports of manufactured goods in the first elevenmonths of the year. In particular, exports increased as follows, each as compared to the first eleven months of 2013:
• petroleum exports increased by 6.7%;
• nonpetroleum exports increased by 26.8%;
• exports of manufactured goods increased by 26.5%, to U.S. $365.1 billion, as compared to U.S. $288.5 billion during the first eleven months of 2013;and
• merchandise exports increased by 24.2%, to U.S. $432.2 billion, as compared to U.S. $348.0 billion during the first eleven months of 2013.
According to preliminary figures, during the first eleven months of 2014, total imports increased by 23.9%, to U.S. $434.6 billion, as compared to U.S. $350.8billion for the same period of 2013. In particular, imports increased as follows, each as compared to the first eleven months of 2013:
• imports of intermediate goods increased by 25.5%;
• imports of capital goods increased by 19.9%; and
• imports of consumer goods increased by 18.4%.
The following table provides information about the value of Mexico’s merchandise exports and imports (excluding tourism) for the periods indicated below.
7

14/1/2015 Form 6K
http://www.sec.gov/Archives/edgar/data/932782/000119312515010662/d851494d6k.htm 8/16
Exports and Imports
2009 2010 2011 2012 2013
First elevenmonths of2014(1)
(in millions of dollars, except average price of the Mexican crude oil mix) Merchandise exports (f.o.b.)
Oil and oil products U.S.$ 30,831 U.S.$ 41,693 U.S.$ 56,443 U.S.$ 52,956 U.S.$ 49,493 U.S.$ 48,133 Crude oil 25,614 35,919 49,381 46,852 42,723 40,947 Other 5,217 5,775 7,063 6,103 6,770 7,186
Nonoil products 198,872 256,780 292,990 317,814 330,534 384,054 Agricultural 7,726 8,610 10,310 10,914 11,246 13,412 Mining 1,448 2,424 4,064 4,907 4,714 5,562 Manufactured goods(2) 189,698 245,745 278,617 301,993 314,573 365,079
Total merchandise exports 229,704 298,473 349,433 370,770 380,027 432,187 Merchandise imports (f.o.b.)
Consumer goods 32,828 41,423 51,790 54,272 57,329 62,464 Intermediate goods(2) 170,912 229,812 264,020 277,911 284,823 329,670 Capital goods 30,645 30,247 35,032 38,568 39,057 42,485
Total merchandise imports 234,385 301,482 350,843 370,752 381,210 434,619 Trade balance U.S.$ (4,681) U.S.$ (3,009) U.S.$ (1,410) U.S.$ 18 U.S.$ (1,184) U.S.$ (2,432)
Average price of Mexican oilmix(3) U.S.$ 57.40 U.S.$ 72.46 U.S.$ 101.13 U.S.$ 101.96 U.S.$ 98.46 U.S.$ 89.85
Note: Numbers may not total due to rounding.(1) Preliminary figures.(2) Includes the maquiladora (or the inbond industry).(3) In U.S. dollars per barrel.Source:Banco de México / PEMEX.
Balance of International Payments
According to preliminary figures, during the first nine months of 2014, Mexico’s current account registered a deficit of 1.5% of GDP, or U.S. $19.3 billion, ascompared to a deficit of U.S. $20.4 billion for the same period of 2013, which was primarily due to an increase in merchandise imports. The capital accountregistered a surplus of U.S. $40.1 billion during the first nine months of 2014, as compared to a surplus of U.S. $40.9 billion during the same period of 2013. Foreigninvestment in Mexico totaled U.S. $35.3 billion during the first nine months of 2014 and was composed of direct foreign investment inflows totaling U.S. $15.3billion and net foreign portfolio investment inflows (including securities placed abroad) totaling U.S. $19.9 billion.
At December 31, 2014, Banco de México’s international reserves totaled U.S. $192.6 billion, an increase of U.S. $16.1 billion as compared to internationalreserves at December 31, 2013. At December 31, 2014, Banco de México’s net international assets totaled U.S. $195.1 billion, an increase of U.S. $14.8 billion fromthe amount at December 31, 2013.
8

14/1/2015 Form 6K
http://www.sec.gov/Archives/edgar/data/932782/000119312515010662/d851494d6k.htm 9/16
The following table sets forth Mexico’s balance of payments for the periods indicated:
Balance of Payments
2009 2010 2011 2012 2013
First ninemonths of
2013
First ninemonths of2014(1)
(in millions of dollars) I. Current account(2) U.S.$ (7,724) U.S.$ (3,230) U.S.$ (11,836) U.S.$ (15,263) U.S.$ (26,284) U.S.$ (20,383) U.S.$ (19,345) Credits 273,250 346,529 399,248 423,510 432,753 321,170 334,481 Merchandise exports (f.o.b.) 229,704 298,473 349,375 370,770 380,027 281,198 294,006 Nonfactor services 15,096 15,621 16,153 16,817 20,829 15,769 16,012 Tourism 11,513 11,992 11,869 12,739 13,949 10,258 12,038 Others 3,583 3,629 4,284 4,078 6,880 5,512 3,974
Factor Services 6,797 10,812 10,569 13,154 9,659 7,543 6,595 Interest 4,253 3,388 3,475 2,671 2,391 1,867 1,701 Others 2,544 7,424 7,094 10,483 7,269 5,676 4,893
Transfers 21,653 21,623 23,152 22,768 22,238 16,660 17,869 Debits 280,974 349,759 411,084 438,772 459,038 341,553 353,826 Merchandise imports (f.o.b.) 234,385 301,482 350,843 370,752 381,210 284,188 295,768 Nonfactor services 25,139 25,565 30,289 30,835 32,335 23,970 26,041 Insurance and freight 7,510 8,723 10,225 9,726 9,755 7,299 8,637 Tourism 7,207 7,255 7,832 8,449 9,122 6,437 6,915 Others 10,422 9,587 12,232 12,661 13,457 10,234 10,489
Factor services 21,389 22,626 29,774 36,976 45,364 33,293 31,919 Interest 12,886 14,161 17,688 20,296 23,276 16,005 17,686 Others 8,503 8,465 12,086 16,680 22,089 17,289 14,233
Transfers 60 86 178 209 128 101 98 II. Capital account 16,181 45,598 50,985 54,645 60,818 40,900 40,109 Liabilities 34,272 91,492 61,714 88,684 103,531 72,607 60,473 Loans and deposits 10,033 45,428 13,075 14,357 43,329 26,764 25,219 Development banks 794 648 (283) 398 426 (279) 188 Commercial banks (3,918) 29,323 (953) (3,206) 15,112 10,629 4,487 U.S. Federal Reserve swapfacility 7,229 (3,221) — — — — —
Nonfinancial public sector 9,638 13,021 5,910 8,397 8,204 4,136 13,186 Nonfinancial private sector (3,711) 5,657 8,401 8,769 19,587 12,278 7,358 PIDIREGAS(3) — — — — — — —
Foreign investment 24,239 46,063 48,639 74,326 60,202 45,844 35,254 Direct 16,605 22,563 23,553 17,810 39,172 32,970 15,310 Portfolio 7,634 23,500 25,086 56,517 21,030 12,874 19,944 Equity securities 4,155 373 (6,566) 9,877 (943) (1,243) 5,888 Debt securities 3,479 23,127 31,651 46,640 21,973 14,117 14,056
Assets (18,091) (45,893) (10,728) (34,039) (42,713) (31,707) (20,364) III. Errors and omissions (3,123) (19,689) (10,712) (18,660) (16,889) (8,064) (6,344) IV. Change in net internationalreserves(4) 5,397 22,759 28,879 21,040 13,006 8,578 14,062
Note: Numbers may not total due to rounding.(1) Preliminary figures.(2) Current account figures are calculated according to a methodology developed to conform to new international standards under which merchandise exports and merchandise imports include the inbond
industry.(3) As of January 1, 2009, external financing of longterm infrastructure projects (PIDIREGAS), are recorded as nonfinancial public sector indebtedness.(4) The sum of items I, II and III does not equal item IV because purchases and sales of gold and silver, as well as adjustments in their value, are not reflected in items I, II and III.Source: Banco de México.
Exchange Controls and Foreign Exchange Rates
On December 31, 2014, the peso/dollar exchange rate closed at Ps. 14.7180 = U.S. $1.00, a 12.6% depreciation in dollar terms as compared to the rate onDecember 31, 2013.
The peso/U.S. dollar exchange rate announced by Banco de México on January 8, 2015 (which took effect on the second business day thereafter) wasPs. 14.8479 = U.S. $1.00.
Public Finance
Fiscal Policy
The Programa Nacional de Financiamiento del Desarrollo 20132018 (National Program to Finance Development 20132018, or PRONAFIDE), which wasannounced on December 16, 2013, establishes the Mexican Government’s fiscal policy goals. These goals include securing sufficient fiscal resources to strengthensocial infrastructure and productivity. To this end, PRONAFIDE has outlined the following specific objectives:
9

14/1/2015 Form 6K
http://www.sec.gov/Archives/edgar/data/932782/000119312515010662/d851494d6k.htm 10/16
1. promote economic development and macroeconomic stability;
2. improve the financial system to generate additional resources and to transform it into a simpler and more progressive system;
3. increase spending efficiency to promote growth, development and productivity, while still maintaining accountability;
4. encourage the notion of “fiscal federalism,” so that states and municipalities can also reach and maintain balanced public financing;
5. foster inclusion, education, competition and transparency in the financial, insurance and pension systems, thereby increasing their access and coveragewhile retaining their effectiveness and reliability; and
6. extend credit to development banks that facilitate access to financial services in strategic sectors of the economy and that place particular emphasis onthe private sector.
Revenues and Expenditures
In nominal pesos and according to preliminary figures, the public sector balance registered a deficit of Ps. 437.1 billion (including physical investmentexpenditures by PEMEX) during the first ten months of 2014, or 3.4% of GDP. This deficit was Ps. 374.2 billion during the same period of 2013. The public sectorbalance registered a deficit of Ps. 132.9 billion (excluding physical investment expenditures by PEMEX), during the first ten months of 2014, as compared to aPs. 126.6 billion deficit registered for the same period of 2013.
In nominal pesos and according to preliminary figures, including physical investment expenditures by PEMEX, the total primary balance registered a deficitof Ps. 216.4 billion during the first ten months of 2014, 768.9% higher in nominal terms than for the first ten months of 2013. This decrease was primarily due tolower oilrelated revenues, resulting in a higher corresponding increase in expenditures and a lower corresponding increase in revenues as compared to 2013.
According to preliminary figures, during the first ten months of 2014, public sector budgetary revenues amounted to Ps. 3,182 billion in nominal pesos, 2.5%greater in real terms as compared to the same period of 2013. During the first ten months of 2014, revenues have increased or decreased as follows, each in real termsand as compared to the same period of 2013:
• crude oil revenues decreased by 1.8%;
• nonoil tax revenues increased by 4.7%; and
• nontax PEMEX revenues (as a percentage of total public sector budgetary revenues) decreased by 0.8 percentage points, to 10.5%, as compared toapproximately 11.3% in the same period of 2013.
According to preliminary figures, during the first ten months of 2014, net public sector budgetary expenditures increased by 8.4% in real terms as compared tothe first ten months of 2013. Net public sector budgetary programmable expenditures (excluding physical investment by PEMEX) increased by 8.0% in real terms ascompared to the first ten months of 2013. During the first ten months of 2014, the financial cost of public sector debt increased by 3.9% in real terms as compared tothe same period of 2013.
10
14/1/2015 Form 6K
http://www.sec.gov/Archives/edgar/data/932782/000119312515010662/d851494d6k.htm 11/16
As of October 31, 2014:
• the Fondo de Estabilización de los Ingresos Petroleros (Oil Revenues Stabilization Fund) totaled Ps. 12.5 billion;
• the Fondo de Estabilización de los Ingresos de las Entidades Federativas (Federal Entities Revenue Stabilization Fund) totaled Ps. 4.6 billion;
• the Fondo de Estabilización para la Inversión en Infraestructura de Petróleos Mexicanos (PEMEX Infrastructure Investment Stabilization Fund) andthe Fondo de Apoyo para la Reestructura de Pensiones (Fund to Support Pension Restructuring) did not have any remaining funds.
On December 11, 2013, a fiscal reform decree amending and supplementing certain tax laws was published in the Diario Oficial de la Federación (OfficialGazette of the Federation). This decree amends the Ley del Impuesto al Valor Agregado (Value Added Tax Law), the Ley del Impuesto Especial sobre Producción yServicios (Special Tax on Production and Services Law) and the Ley del Impuestos sobre la Renta (the Income Tax Law, or the ISR Law), and eliminates the Ley delImpuesto Empresarial a Tasa Única (the Corporate Tax Law) and the Ley del Impuesto a los Depósitos en Efectivo (Cash Deposit Tax Law). This decree, whichbecame effective on January 1, 2014, includes, among others, the following features:
• the prior 11% value added tax (VAT) rate that applied to transactions conducted along the border was raised to 16%, thereby matching the general VATrate applicable throughout Mexico;
• a green tax on the sale of fossil fuels was introduced, amounting to, in certain instances, Ps. 39.80 per ton of carbondioxide produced;
• an excise tax of 8% now applies to items designated as “junk food,” as well as a fee of one peso per liter for the sale and import of sugary drinks; and
• certain products and services that were previously VAT exempt, such as chewing gum, pets, pet food and certain public passenger transportationservices, will now be subject to the VAT at the general rate of 16%.
In addition, as part of this fiscal reform, a new ISR Law was approved which includes, among others, the following features:
• a 30% tax rate applies to individuals with annual incomes up to Ps. 750,000;
• a 32% tax rate applies to individuals with annual incomes between Ps. 750,000 and Ps. 1.0 million;
• a 34% tax rate applies to individuals with annual incomes between Ps. 1.0 million and Ps. 3.0 million;
• a 35% tax rate applies to individuals with annual incomes of more than Ps. 3.0 million;
11
14/1/2015 Form 6K
http://www.sec.gov/Archives/edgar/data/932782/000119312515010662/d851494d6k.htm 12/16
• the régimen de pequeños contribuyentes (small taxpayers regime) was eliminated and the régimen de consolidación fiscal (tax consolidation regime) isto be eliminated as well; and
• a new incorporation regime for affiliated taxpayers was introduced, applicable only to those individuals who have engaged in business activities
involving the sale of goods or the rendering of services that do not require a professional degree or whose annual income does not exceed Ps. 2.0million.
2015 Budget
On September 9, 2014, the President of Mexico submitted the proposed Ley de Ingresos de la Federación para el Ejercicio Fiscal de 2015 ( Federal RevenueLaw for 2015, or the 2015 Revenue Law) and the proposed Presupuesto de Egresos de la Federación para el Ejercicio Fiscal de 2015 (Federal Expenditure Budgetfor 2015, or the 2015 Expenditure Budget) to the Congreso de la Unión (Congress) for its approval. The 2015 Revenue Law and the 2015 Expenditure Budget wereapproved on October 30, 2014 and November 13, 2014, and were published in the Official Gazette of the Federation on November 13, 2014 and December 3, 2014,respectively. We refer to these two bills together as Mexico’s 2015 budget (the 2015 Budget).
The 2015 Budget allows ministries and budgetcontrolled agencies to request additional expenditures to the extent that oil revenues earned by PEMEXexceed the projected oil revenues set forth in the 2015 Budget. In addition, the 2015 Budget provides that the executive branch, acting through the Ministry ofFinance and Public Credit, is authorized to approve, if certain conditions are met, additional expenditures requested by certain ministries or budgetcontrolledagencies in the event that these entities realize revenues greater than those projected in the 2015 Budget.
The 2015 Budget, as adopted by Congress, provides for a public sector budget deficit excluding physical investments by PEMEX of (1.0)% of GDP. IncludingPEMEX’s physical investment program, the 2015 Budget provides for a public sector budget deficit of (3.5)% of GDP. The 2015 Budget contemplates public sectorbudgetary revenues totaling Ps. 4,003.6 billion, a 1.4% increase in real terms as compared to public sector budgetary revenues estimated for Mexico’s 2014 budget(the 2014 Budget). This is based on an assumed weighted average Mexican crude oil export price of U.S. $82.00 per barrel and an estimated volume of oil exports of2,400,000 barrels per day. Oil revenues are estimated at Ps. 1,198.7 billion in nominal pesos, a 7.1% decrease in real terms as compared to the estimated amount forthe 2014 Budget. In addition, approved nonoil revenues are Ps. 2,804.9 billion, a 5.6% increase as compared to the estimated amount for the 2014 Budget. Finally,projected nonoil tax revenue also increased by 7.0% in real terms as compared to the amount approved for the 2014 Budget.
Mexico’s 2015 Budget provides for a total of Ps. 4,154.1 billion in expenditures (excluding estimated physical investment expenditures by PEMEX totalingPs. 540.6 billion), a 1.2% increase in real terms as compared to the amount approved in the Presupuesto de Egresos de la Federación para el Ejercicio Fiscal de2014 (Federal Expenditure Budget for 2014).
The 2015 Budget authorizes the Mexican Government to incur net domestic debt in the amount of Ps. 595 billion in nominal pesos, or 26% of GDP. The 2015Budget also authorizes the Mexican Government to incur an additional U.S. $6 billion in external indebtedness, which includes financing from internationalfinancial organizations.
The table below sets forth the budgetary results for 2013, as well as the first nine months of 2014. It also sets forth the assumptions and targets underlyingMexico’s 2014 Budget and 2015 Budget.
12

14/1/2015 Form 6K
http://www.sec.gov/Archives/edgar/data/932782/000119312515010662/d851494d6k.htm 13/16
2013 and First Nine Months of 2014 Results; 2014 Budget and 2015 Budget Assumptions and Targets
2013Results(1)
2014Budget(2)
First ninemonths of2014
Results(1)
2015Budget(5)
Real GDP growth (%) 1.4% 3.9% 1.9% 3.7% Increase in the national consumer price index (%) 4.0% 3.0% 2.2% 3.0% Average export price of Mexican oil mix (U.S. $/barrel) U.S.$ 98.46 U.S.$ 85.00(3) U.S.$ 93.60 U.S.$ 82.00 Current account deficit as % of GDP (2.2)% n.a. (1.9)% n.a. Average exchange rate (Ps./$1.00) 12.8 12.9 13.1 13.0 Average rate on 28day Cetes (%) 3.8% 4.0% 3.1% 3.5% Public sector balance as % of GDP(4) (2.3)% (3.5)% (2.5)% (3.5)% Primary balance as % of GDP(4) (0.4)% n.a. (1.2)% n.a. n.a. = Not available.(1) Preliminary figures.(2) 2014 Budget figures represent budgetary estimates, based on the economic assumptions contained in the Criterios Generales de Política Económica (General Economic Policy Guidelines) for 2014 and
in the Programa Económico 2014 (Economic Program for 2014). These figures do not reflect actual results for the year or updated estimates of Mexico’s 2014 economic results.(3) The Mexican Government entered into hedging agreements to protect against the effects of a potential decline in oil prices with respect to the level that was assumed in the 2014 Revenue Law.
Therefore, the approved expenditures level should not be affected if the weighted average price of crude oil exported by PEMEX for the year falls below the price assumed in the 2014 Budget.(4) Includes the effect of expenditures related to the issuance of bonds pursuant to reforms to the Ley del Instituto de Seguridad y Servicios Sociales de los Trabajadores del Estado (Law of the Institute for
Social Security and Social Services of Government Workers, or ISSSTE Law) and recognition as public sector debt of certain PIDIREGAS obligations, as discussed under “Public Finance—Revenuesand Expenditures—General” in Mexico’s Form 18K for the year ended December 31, 2013, as filed with the SEC on November 5, 2014 (which we refer to as the 2013 Form 18K).
(5) 2015 Budget figures represent budgetary estimates, based on the economic assumptions contained in the Criterios Generales de Política Económica 2015 (General Economic Policy Guidelines for 2015)and in the Programa Económico 2015 (Economic Program for 2015), as modified by the 2015 Budget adopted by the Mexican Congress.
Source:Ministry of Finance and Public Credit.
Public Debt
Internal Public Debt
According to preliminary figures, at September 30, 2014, the Mexican Government’s net internal debt totaled Ps. 4,189.1 billion, a 7.6% increase in nominalterms as compared to Ps. 3,893.9 billion outstanding at December 31, 2013. This debt figure includes the Ps. 159.1 billion liability associated with social securityunder the ISSSTE Law, as described under “The Economy—Employment and Labor” in the 2013 Form 18K. The net internal debt of the public sector, on the otherhand, totaled Ps. 4,509.9 billion according to preliminary figures, a 6.6% increase in nominal terms as compared to the Ps. 4,230.9 billion outstanding atDecember 31, 2013.
According to preliminary figures, at September 30, 2014, the Mexican Government’s gross internal debt totaled Ps. 4,570.9 billion, a 12.5% increase innominal terms as compared to Ps. 4,063.2 billion outstanding at December 31, 2013. Of the total gross internal debt at September 30, 2014, Ps. 503.7 billionrepresented shortterm debt, as compared to Ps. 480.6 billion at the end of 2013, and Ps. 4,067.2 billion represented longterm debt, as compared to Ps. 3,582.6 billionat the end of 2013. The gross internal debt of the public sector, on the other hand, totaled Ps. 4,993.8 billion at September 30, 2014 according to preliminary figures,a 13.3% increase in nominal terms as compared to Ps. 4,408.9 billion outstanding at December 31, 2013.
According to preliminary figures, at September 30, 2014, the Mexican Government’s financing costs on its internal debt totaled Ps. 127.1 billion, or 0.8% ofGDP, representing a 6.6% nominal increase as compared to its financing costs of Ps. 119.2 billion, or 0.7% of GDP, during the same period of 2013.
As of September 30, 2014, the average maturity of the Mexican Government’s internal debt decreased to 7.8 years.
The following table summarizes the net internal debt of the Mexican Government at each of the dates indicated.
13

14/1/2015 Form 6K
http://www.sec.gov/Archives/edgar/data/932782/000119312515010662/d851494d6k.htm 14/16
Net Internal Debt of the Mexican Government(1) At December 31,
2009 2010 2011 2012 2013
AtSeptember 30,
2014(2) (in billions of pesos, except percentages) Gross Debt Government Securities Ps. 2,379.3 88.0% Ps. 2,553.9 88.4% Ps. 2,882.8 90.2% Ps. 3,257.8 91.1% Ps. 3,734.1 91.9% Ps. 4,249.7 93.0%
Cetes 498.8 18.5 394.0 13.6 456.6 14.3 531.3 14.9 635.6 15.6 675.7 14.8 Floating RateBonds 243.5 9.0 183.1 6.3 202.5 6.3 200.4 5.6 216.6 5.3 222.9 4.9
InflationLinkedBonds 430.6 15.9 530.1 18.4 642.1 20.1 747.2 20.9 888.7 21.9 1,066.2 23.3
Fixed Rate Bonds 1,206.5 44.6 1,446.8 50.1 1,581.6 49.5 1,777.9 49.7 1,989.6 49.0 2,280.2 49.9 STRIPS ofUdibonos — — — — — — 1.0 0.0 3.6 0.1 4.8 0.1
Other(3) 323.4 12.0 334.4 11.6 314.9 9.8 317.6 8.9 329.1 8.1 321.1 7.0 Total Gross Debt Ps. 2,702.8 100.0% Ps. 2,888.3 100.0% Ps. 3,197.7 100.0% Ps. 3,575.3 100.0% Ps. 4,063.2 100.0% Ps. 4,570.9 100.0% Net Debt Financial Assets(4) (231.4) (79.4) (85.6) (74.2) (169.3) (381.8) Total Net Debt Ps. 2,471.3 Ps. 2,808.9 Ps. 3,112.1 Ps. 3,501.1 Ps. 3,893.9 Ps. 4,189.1 Gross InternalDebt/GDP 21.2% 20.6% 20.5% 22.1% 24.2% 26.8%
Net Internal Debt/GDP 19.3% 20.1% 19.9% 21.6% 23.2% 24.6% Note: Numbers may not total due to rounding.(1) Internal debt figures do not include securities sold by Banco de México in openmarket operations to manage liquidity levels pursuant to Regulación Monetaria (none of which are outstanding since
December 31, 2011). This is because this does not increase the Mexican Government’s overall level of internal debt. Banco de México must reimburse the Mexican Government for any allocated debtthat Banco de México sells into the secondary market and that is presented to the Mexican Government for payment. If Banco de México undertakes extensive sales of allocated debt in the secondarymarket, however, this can result in an elevated level of outstanding internal debt as compared to the Mexican Government’s figure for net internal debt.
(2) Preliminary figures.(3) Includes Ps. 193.9 billion for 2009, Ps. 193.0 billion for 2010, Ps. 171.9 billion for 2011, Ps. 169.0 billion for 2012, Ps. 165.5 billion for 2013 and Ps. 159.1 billion at September 30, 2014 in liabilities
associated with social security under the ISSSTE Law, as described under “The Economy—Employment and Labor” in the 2013 Form 18K.(4) Includes the net balance (denominated in pesos) of the Federal Treasury’s General Account in Banco de México.Source: Ministry of Finance and Public Credit.
External Public Debt
According to preliminary figures, at September 30, 2014, outstanding gross public sector external debt totaled U.S. $146.4 billion, an approximate U.S. $12.0billion increase from the U.S. $134.4 billion outstanding at the end of 2013. Of this amount, U.S. $142.4 billion represented longterm debt and U.S. $4.0 billionrepresented shortterm debt. Overall, total public debt (gross external debt plus net internal public sector debt) represented approximately 37.7% of nominal GDP, anincrease of 1.9 percentage points from the end of 2013.
The following tables set forth a summary of Mexico’s external public debt, including a breakdown of such debt by currency, net external public sector debt,the Mexican Government’s gross external debt, the Mexican Government’s net external debt and the Mexican Government’s net debt.
Summary of External Public Debt(1)By Type
LongTermDirect Debt
of theMexican
Government
LongTermDebt ofBudget
ControlledAgencies
Other LongTermPublicDebt(2)
Total LongTerm Debt
Total ShortTerm Debt
Total Longand ShortTerm Debt
(in millions of U.S. dollars) At December 31,
2009 47,350 41,048 6,202 94,600 1,754 96,354 2010 56,168 45,536 6,385 108,089 2,339 110,428 2011 60,590 47,436 5,625 113,651 2,769 116,420 2012 66,912 50,063 5,626 122,601 3,125 125,726 2013 71,817 53,358 5,734 130,909 3,527 134,436
September 30, 2014(3) 76,645 60,331 5,456 142,432 4,014 146,446
14

14/1/2015 Form 6K
http://www.sec.gov/Archives/edgar/data/932782/000119312515010662/d851494d6k.htm 15/16
By Currency(4) At December 31,
2009 2010 2011 2012 2013(3)
AtSeptember 30,
2014(3) (in millions of U.S. dollars, except for percentages) U.S.dollars U.S.$ 77,919 80.9% U.S.$ 90,882 82.3% U.S.$ 97,048 83.4% U.S.$ 105,836 84.2% U.S.$ 111,647 83.1% U.S.$ 119,088 81.3%
Japaneseyen 4,541 4.7 6,864 6.2 6,793 5.8 6,847 5.4 5,519 4.1 5,553 3.8
Poundssterling 1,981 2.1 1,920 1.7 1,906 1.6 1,993 1.6 1,369 1.0 2,961 2.0
Swissfrancs 716 0.7 953 0.9 910 0.8 961 0.8 969 0.7 921 0.6
Others 11,197 11.6 9,809 8.9 9,763 8.4 10,089 8.0 14,932 11.1 17,924 12.2 Total U.S.$ 96,354 100.0% U.S.$ 110,428 100.0% U.S.$ 116,420 100.0% U.S.$ 125,726 100.0% U.S.$ 134,436 100.0% U.S.$ 146,446 100.0% Note: Numbers may not total due to rounding.(1) External debt denominated in foreign currencies other than U.S. dollars has been translated into dollars at exchange rates as of each of the dates indicated. External public debt does not include
(a) repurchase obligations of Banco de México with the IMF (none of which were outstanding as of July 31, 2014) or (b) loans from the Commodity Credit Corporation to public sector Mexican banks.External debt is presented herein on a “gross” basis, and includes external obligations of the public sector at their full outstanding face or principal amount. For certain informational and statisticalpurposes, Mexico sometimes reports its external public sector debt on a “net” basis, which is calculated as the gross debt net of certain financial assets held abroad. These financial assets includeMexican public sector external debt that is held by public sector entities but that has not been cancelled.
(2) Includes development banks’ debt and the debt of other administrativelycontrolled agencies whose finances are consolidated with those of the Mexican Government.(3) Preliminary figures.(4) Adjusted to reflect the effect of currency swaps.Source:Ministry of Finance and Public Credit.
15

14/1/2015 Form 6K
http://www.sec.gov/Archives/edgar/data/932782/000119312515010662/d851494d6k.htm 16/16
SIGNATURES
Pursuant to the requirements of the Securities Exchange Act of 1934, the registrant has duly caused this report to be signed on its behalf by the undersigned,thereunto duly authorized.
Petróleos Mexicanos
By: /s/ CARLOS CARAVEO SÁNCHEZ Carlos Caraveo Sánchez Associate Managing Director of Finance
Date: January 14, 2015
FORWARDLOOKING STATEMENTS
This report contains words, such as “believe,” “expect,” “anticipate” and similar expressions that identify forwardlooking statements, which reflect our viewsabout future events and financial performance. We have made forwardlooking statements that address, among other things, our:
• exploration and production activities, including drilling;
• activities relating to import, export, refining, petrochemicals and transportation of petroleum, natural gas and oil products;
• projected and targeted capital expenditures and other costs, commitments and revenues; and
• liquidity and sources of funding.
Actual results could differ materially from those projected in such forwardlooking statements as a result of various factors that may be beyond our control.These factors include, but are not limited to:
• changes in international crude oil and natural gas prices;
• effects on us from competition, including on our ability to hire and retain skilled personnel;
• limitations on our access to sources of financing on competitive terms;
• our ability to find, acquire or gain access to additional reserves and to develop the reserves that it obtains successfully;
• uncertainties inherent in making estimates of oil and gas reserves, including recently discovered oil and gas reserves;
• technical difficulties;
• significant developments in the global economy;
• significant economic or political developments in Mexico, including developments relating to the implementation of the laws that implement the newlegal framework contemplated by the Decreto por el que se reforman y adicionan diversas disposiciones de la Constitución Política de los EstadosUnidos Mexicanos, en Materia de Energía (Decree that amends and supplements various provisions of the Political Constitution of the United MexicanStates relating to energy matters);
• developments affecting the energy sector; and
• changes in our legal regime or regulatory environment, including tax and environmental regulations.
Accordingly, you should not place undue reliance on these forwardlooking statements. In any event, these statements speak only as of their dates, and weundertake no obligation to update or revise any of them, whether as a result of new information, future events or otherwise.