petroleum operational capability and technical … · 2015-09-09 · 2 operational capability and...
TRANSCRIPT
OPERATIONAL CAPABILITY AND TECHNICAL EXPERTISE
PETROLEUM
2015

2 Operational Capability and Technical Expertise 2015 3Operational Capability and Technical Expertise 2015
Leading performance everywhere we operate. Operational excellence across our asset portfolio.INTRODUCTION
The Petroleum business within BHP Billiton is the oil and gas arm of one of the world’s largest resources companies. We run a carefully managed portfolio of upstream assets around the world, including our heartland fields in the deepwater Gulf of Mexico, onshore United States and Australia. The quality of these assets, along with a long-standing focus on safety and operational excellence, is essential to our strategy.
Aggressive moves to improve productivity – through the application of advanced technology and operational efficiencies – are further reducing costs. Benchmarked against our peers and competitors, these efforts are solidifying our superior position in safety, uptime, and drilling and completions efficiency. Further, we are creating the foundation for future success: in onshore
Introduction 2
Safety 6
Conventional 10
Shale 16
Development 22
Exploration 26
Leadership 30
assets under development – such as the Permian Basin – and in the deepwater, currently the focus of a targeted exploration campaign.

54 Operational Capability and Technical Expertise 2015Operational Capability and Technical Expertise 2015
A FOCUSED GLOBAL PORTFOLIO
ONSHORE U.S. ROD
PYRENEES, MACEDON
NORTH WEST SHELF
BASS STRAIT
ANGOSTURA
SHENZI, ATLANTIS, MAD DOG, NEPTUNE
SOURCE: BHP Billiton analysis
* Resource classifications – Proved Reserves (1P) 1,908 MMboe, Proved and Probable Reserves (2P) 5,543 MMboe, Contingent Resources (2C) 5,104 MMboe and are inclusive of fuel consumed in operations of 1P: 91 MMboe, 2P: 180 MMboe and 2C: 213 MMboe. See resources disclosures on back cover.
* Includes all U.S. Shale Gas, Tight Gas or Tight OilSOURCE: Wood Mackenzie, BHP Billiton analysis
In 2014, BHP Billiton produced the
energy equivalent of 700,000 barrels
of oil per day.
We continue to grow shareholder value
by focusing on large, long-life, low-cost
and expandable upstream assets. We
are a top-ten producer in our heartland
regions, with plans to grow in each of
these core areas.
BHP BILLITON PRODUCTION
(Mboe/d, net, 2014)
RANK AND TOP-TEN
Australia Unconv. U.S. Gas* Unconv. U.S. Liq.* Gulf of Mexico
#1 Woodside Chesapeake EOG BP
#2 BHP Billiton ExxonMobil Anadarko Shell
#3 Shell Southwestern Devon Chevron
#4 ExxonMobil Anadarko ConocoPhillips BHP Billiton
#5 Chevron Devon Chesapeake Anadarko
#6 BP BHP Billiton Marathon Hess
#7 Santos Encana ExxonMobil Eni
#8 Apache ConocoPhillips BHP Billiton Freeport-MMR
#9 Origin EOG Apache ExxonMobil
#10 BG BP Continental Petrobras
PRODUCTION VS. OUR PEERS
A TOP-TEN PRODUCER
5Operational Capability and Technical Expertise 2015
The acreage we hold contains the energy equivalent of more than 10 billion barrels of oil.*

6 Operational Capability and Technical Expertise 2015 7Operational Capability and Technical Expertise 2015
SAFETYSETTING NEW STANDARDS
At BHP Billiton, the safety of our people comes before anything else that we do.
This commitment has long kept our offshore operations – measured against our
peers and competitors worldwide – in the top quartile for safety performance.
In 2012, we took a significant position in four of the largest U.S. onshore
basins. With these acquisitions came new workers and new safety challenges.
We brought to bear the same safety standards and processes we’d long been
employing in our conventional operations. To engage our people, our operational
leaders conduct ongoing training and awareness sessions across our operations –
challenging and empowering all personnel on all levels to provide new ideas and
new solutions. The results are dramatic, with our onshore workers now achieving
some of the lowest Lost-Time Injury Frequency (LTIF) rates in the industry. Taken
together, the process means that we’re not only working safely, we’re constantly
finding new ways to do even better.

8 Operational Capability and Technical Expertise 2015
X Z AE ABH AA V R C Q K AF M T AC P B L J W N S AG AD Y D E BHP UF
0.8
0.6
0.4
0.2
0.0
BHP
2.0
1.5
1.0
0.5
0.0
S AG AD Y D E BHP U
BHP
Top quartile
Top quartile
9Operational Capability and Technical Expertise 2015
SAFETY
1. LTIF: Lost-Time Injury Frequency2. IOGP: International Association of Oil and Gas ProducersSOURCE: IOGP total LTIF results by company (2014)
1. LTIF: Lost-Time Injury Frequency2. American Exploration & Production CouncilSOURCE: AXPC total LTIF results by company (2014)
TOP-QUARTILE SAFETY PERFORMANCE WORLDWIDE, CONVENTIONAL AND SHALEIndustry studies from 2014 show BHP
Billiton near the top of the industry in
terms of safety performance.
INDUSTRY-LEADING SAFETY PERFORMANCE IN SHALEAccording to a 2014 benchmarking
study, BHP Billiton is a top safety
performer in U.S. Shale.
LTIF1 OF ALL PARTICIPATING IOGP2 MEMBERS(Incident per million hours worked)
ONSHORE COMPARATIVE LTIF1 OF ALL PARTICIPATING AXPC2 MEMBERS(Incident per 200,000 exposure hours)
A RIGOROUS APPROACH TO PROCESS SAFETYPersonal safety has been a focus in the oil and gas industry for decades. Industry
best practices, along with a standardized set of metrics including Total Recordable
Injury Frequency (TRIF) and LTIF, have helped to make personal safety an intuitive
part of the business. Process safety – an engineering-driven focus on keeping people
safe through the effective management and containment of fluids and gases – is a
necessary complement to the personal safety focus.
The BHP Billiton Process Safety Management Model includes ‘lagging’ and ‘leading’
indicators. Lagging indicators look at past incidents, with reporting and analysis that
help define causes and create solutions to prevent recurrence. Leading indicators, in
contrast, are indicators of possible problems that could occur. These help build the
case for proactive maintenance and process refinement before incidents occur, rather
than afterward.
A compressor incident in a facility in the Black Hawk shale was an attention-getting
moment, helping to drive greater recognition of the importance of process safety. A
mechanical failure caused a relatively minor incident – but the process safety team
successfully used it as an opportunity to further embed existing methodologies in the
day-to-day operational culture.
Process safety is a key operational function at BHP Billiton. In the field, a fully
engaged workforce applies the principles of process safety across all disciplines, with
ongoing active support from an independent team that sets standards and verifies
performance consistently across the Petroleum business. Finally, monthly reporting
to leadership, via a dashboard of leading and lagging indicators, helps to ensure that
process safety is a continuing priority, keeping our operations safe, dynamic
and productive.

11Operational Capability and Technical Expertise 2015
CONVENTIONALSTILL THE CORE OF OUR PETROLEUM BUSINESS
On an average day, BHP Billiton produces more than 350,000 boe of hydrocarbons
from conventional assets in Australia, the United States, Trinidad and Tobago, and
around the world. In our operated assets, we have an industry-wide reputation
for exceptionally high performance in terms of safety, facility uptime and unit
cost, particularly in deepwater fields. Our conventional drilling performance is
similarly outstanding, even in exceptionally demanding conditions such as Gulf of
Mexico subsalt formations.

12 Operational Capability and Technical Expertise 2015
80 (%) Facility utilization
60
Shen
zi
Tahiti
(CVX)
Blind F
aith
(CVX)
Mad
Dog (
BP)
Thunder
Hors
e (BP)
Great
White
(RDS)
40
20
0
Note: Deepwater Gulf of Mexico, standalone facilities, average throughput vs. nameplateSOURCE: Wood Mackenzie, BHP Billiton analysis
Note: Fiscal Year 2014SOURCE: Company annual reports, BHP Billiton analysis
Note: Fiscal Years 2012 to 2014 SOURCE: BHP Billiton analysis
SHENZI’S BEST-IN-CLASS UTILIZATION RATES
After six years of production, our
Shenzi deepwater platform is still
producing at rates close to its
nameplate capacity.
SUPERIOR FACILITY UPTIME
BHP Billiton delivers exceptional
uptime performance across our
conventional asset portfolio –
generally exceeding that of our
competitors.
OVERALL BEST-IN-CLASS PRODUCTIVITYCompared to our peers in conventional
petroleum, BHP Billiton consistently
delivers the lowest unit cost.
CONVENTIONAL | PRODUCTION
13Operational Capability and Technical Expertise 2015
In 2015, the BHP Billiton-operated Shenzi field – a world-class
deepwater oil and gas development in the U.S. Gulf of Mexico –
entered its sixth year of production. After first oil on March 23,
2009, Shenzi took just three months to reach 130,000 barrels of
oil per day. A month later, production peaked at 149,500 barrels
per day. By the summer of 2015, Shenzi was still delivering up to
95,000 barrels of oil per day, just under its nameplate capacity of
100,000 barrels. Since startup, the facility has been running more
than 95 per cent of the time. No other deepwater platform in
the U.S. Gulf of Mexico has done as well. One reason for Shenzi’s
success has been the constant effort to maintain peak flow rates
from the platform’s 17 producing wells. In 2014, Shenzi’s production
engineers identified and implemented a software tool known as
Integrated Field Management®. It allowed them to model the effect
of swapping wells – each with different flow rates and pressures
– into different parts of the gathering system. By adjusting gas-lift
rates for multiple scenarios at a time, engineers can now make
hour-by-hour decisions that optimise production.
SHENZI PLATFORM OUTPERFORMS ITS PEERS IN THE U.S. GULF OF MEXICO

1514 Operational Capability and Technical Expertise 2015Operational Capability and Technical Expertise 2015
CONVENTIONAL | DRILLING
10 (day/1,000ft.) Average drill time
4
6
8
2
0
Mid-tierMajors
BHP Bill
iton
BP
Chevr
onSh
ell
Stat
oil
Exxo
nMob
il
Noble
Anadar
koHes
s
Apache
Conoc
oPhi
llips
Pre-moratorium Post-moratorium
4
6
8
2
0
(day/1,000ft.) Average drill time
Post-moratorium
15Operational Capability and Technical Expertise 201514 Operational Capability and Technical Expertise 2015
The first exploration well in the Shenzi field was
spudded by the drillship C.R. Luigs in the fall of 2002.
The well reached a depth of 8,109 metres (24,607 feet),
encountering 142 metres (465 feet) of hydrocarbons and
43 metres (140 feet) of net pay. Subsequent appraisal
wells found even greater amounts of hydrocarbons and
helped to establish the boundaries of the Shenzi field.
In the development drilling campaign that followed
these discoveries, BHP Billiton wells began setting
efficiency records – drilling safely as much as 50 per cent
faster than competitors drilling in similar Gulf of Mexico
formations. These facts are particularly impressive given
the nature of the subsurface formations at Shenzi: the
reservoirs are located below thousands of metres of salt.
BHP Billiton Drilling & Completions engineers worked
tirelessly to develop solutions to the challenges of salt
creep (when salt squeezes into a wellbore, collapsing
production casing) as well as significant pressure buildup
– with heat in the wellbore creating risks of damage
to the well casing. In addition to the speed with which
these highly challenging wells were drilled, they have
proven exceptionally robust, with zero well failures after
handover to production.
Over the life of the Shenzi asset, drilling has continued,
including new producer and injector wells – with
wells since late 2014 drilled by the Deepwater Invictus
(pictured above). The abilities of the Drilling &
Completions team at BHP Billiton have been put to
the test through the life of the asset – and every day’s
production from the field continues to prove their merit.
CHALLENGING CONDITIONS, SUPERIOR PERFORMANCE
Note: Deepwater Gulf of Mexico, sub-salt, post-moratoriumSOURCE: Rushmore, Offshore Oil Scouts Association (OOSA), BHP Billiton analysis
INDUSTRY’S BEST OVERALL DRILL TIMES OFFSHOREBenchmark comparisons place
BHP Billiton first in offshore drilling
rates – a key indicator of efficiency.
INDUSTRY LEADERS IN DRILLINGBHP Billiton consistently posts excellent drilling rates compared
to its peers in the Gulf of Mexico’s challenging subsalt plays.
Note: Deepwater Gulf of Mexico, sub-salt, post-moratoriumSources: Rushmore, Offshore Oil Scouts Association (OOSA), BHP Billiton analysis

17Operational Capability and Technical Expertise 2015
SHALEAGILITY, RESILIENCE AND CONTINUOUS IMPROVEMENT
When the right geology, technology and methodology are brought to bear, shale
development and production can operate on an efficient, repeatable model that
delivers significant production volumes with relatively low up-front costs.
This success requires a total commitment to continuous improvement. In our
operations, we examine every link in the supply chain, and we engage with our
suppliers to make every dollar count. Every process and workflow is analysed,
refined and optimised – and our operational decisions are based not on the ways
we’ve worked in the past, but rather on the hard metrics that define genuine
improvement in process and performance. Decisions of exactly where and how
to drill and produce are the result of focused, ongoing collaboration among
Geoscience, Engineering, and Drilling & Completions teams. Across key onshore
assets, our performance metrics reflect the success of these approaches.

18 Operational Capability and Technical Expertise 2015 19Operational Capability and Technical Expertise 2015
Liquids Gas % Liquids
Liquids-focused area
Gas-focused area
SHALE | PRODUCTION
UNCONVENTIONAL SUCCESSBHP Billiton is one of the largest producers in the liquids-rich Eagle Ford shale,
and a major force evaluating the Permian Basin. Across these operations,
efficiency and technical excellence are essential to our success. Rig moves that
once took seven days are being done in under three. Pre-fabricated wellsite
construction techniques and other improvements are lowering costs of multi-well
pads by 40 per cent, allowing us to complete these installations in one-third of
the time they took just three years ago. Our average drilling times are some of
the fastest in the industry. Across all operations, we have trimmed the average
cost of new wells by more than US$2 million each.*
* Based on Q1 FY2013 to Q4 FY2015.SOURCE: BHP Billiton analysis.
FOUR MAJOR ONSHORE U.S. FIELDS
BHP Billiton holds more than 1 million
net acres in four prolific U.S. shale
plays. Our focus on the Eagle Ford
– Black Hawk in particular – helped
grow our liquid volumes by 280 per
cent in just two years.
BLACK HAWK PRODUCING WELLS
Most of our wells are in what is considered
the ‘sweet spot’ of the Black Hawk field.
Represents wells with at least three years of production (average per well, gross). BHP Billiton includes Devon-operated wells.
SOURCE: IHS.
BHP Billiton data based on a 30-day average of all BHP Billiton wells. BHP Billiton includes Devon-operated wells.
SOURCE: IHS.
BHP Billiton data based on average daily production of all BHP Billiton wells. BHP Billiton includes Devon-operated wells. All operators in Black Hawk, as shown in map at left.
SOURCE: IHS. Monthly average for March 2015.
THREE-YEAR CUMULATIVE PRODUCTION, BLACK HAWK
Three years after completion,
BHP Billiton’s wells average
consistently more production
than its closest peers.
ACCELERATING LEADERSHIP
BHP Billiton production
in Black Hawk is rapidly
exceeding that of our
peers in the area.
TOP PERFORMER IN BLACK HAWKBHP Billiton daily oil production leads the competition in the field.
GROWTH IN HIGH-VALUE LIQUIDS

20 Operational Capability and Technical Expertise 2015
0
1
2
3
4
5
6
0
50
100
150
200
250
300
BHP Billiton COP Pioneer Marathon EOG
6
5
Q1 FY
13
Q2 FY
13
Q3 FY
13
Q4 FY
13
Q1 FY
14
Q2 FY
14
Q3 FY
14
Q4 FY
14
Q1 FY
15
Q2 FY
15
Q3 FY
15
Q4 FY
15
4
3
2
1
0Average cost Lowest cost achieved
21Operational Capability and Technical Expertise 2015
1 2 3
Months from first production
4 5 6
FY15
FY14
FY13
6 month 12 month 36 month $ / well
SOURCE: Production volumes from IHS. Wood Mackenzie cost data. Excludes natural gas and NGLs. BHP Billiton includes Devon-operated wells.
SOURCE: Oil-only production volumes from IHS. Wood Mackenzie cost data. BHP Billiton includes Devon-operated wells.
SOURCE: BHP Billiton analysis.
BLACK HAWK COMPLETIONSOur completions in Black Hawk are
designed to optimise value over time, with
higher recoveries and longer production
life. After six months of production, we lead
our peers; over three years, our cumulative
per-well production is 68 per cent higher
than the peer average.
APPLYING WHAT WE KNOW TO THE PERMIANThe techniques we’ve developed in the Eagle Ford are now being applied in the
Permian. We’re a leading force in appraising the Delaware Basin of Texas, with
more than 75 producing wells in the Wolfcamp formation. We’ve dialed into the
sweet spot and as of mid-2015, production was up to 30,000 boe/d. Essentially,
the BHP Billiton story in the Permian is shifting from the evaluation phase to the
production phase, applying our operational and technical capability to a play
whose geology we understand better than our competitors.
The Permian Basin, comprising the Midland and Delaware Basins, is one of the
largest oil and gas producing regions in the world – and we are rapidly becoming
a major producer in the Delaware Basin.
1. BHP Billiton data and analysis, Wolfcamp wells. Normalized for 10 per cent downtime.
STRONG IMPROVEMENT IN WOLFCAMP WELL PERFORMANCE1
(boe/day, 100 per cent BHP Billiton share)
As we have worked into the Wolfcamp formation, improvements in well placement, extended lateral lengths and optimised completions are leading to increased recovery and strong, predictable well performance across the field.
BLACK HAWK: COMPLETION COST VERSUS CUMULATIVE PRODUCTION(Mbbl/well) ($MM/well)
SHALE | OPERATIONS
BHP BILLITON DRILLING COST PERFORMANCE, BLACK HAWKAn intense focus on drilling operations has
nearly halved our average per-well drilling
cost in Black Hawk.
22 Operational Capability and Technical Expertise 2015 23Operational Capability and Technical Expertise 2015
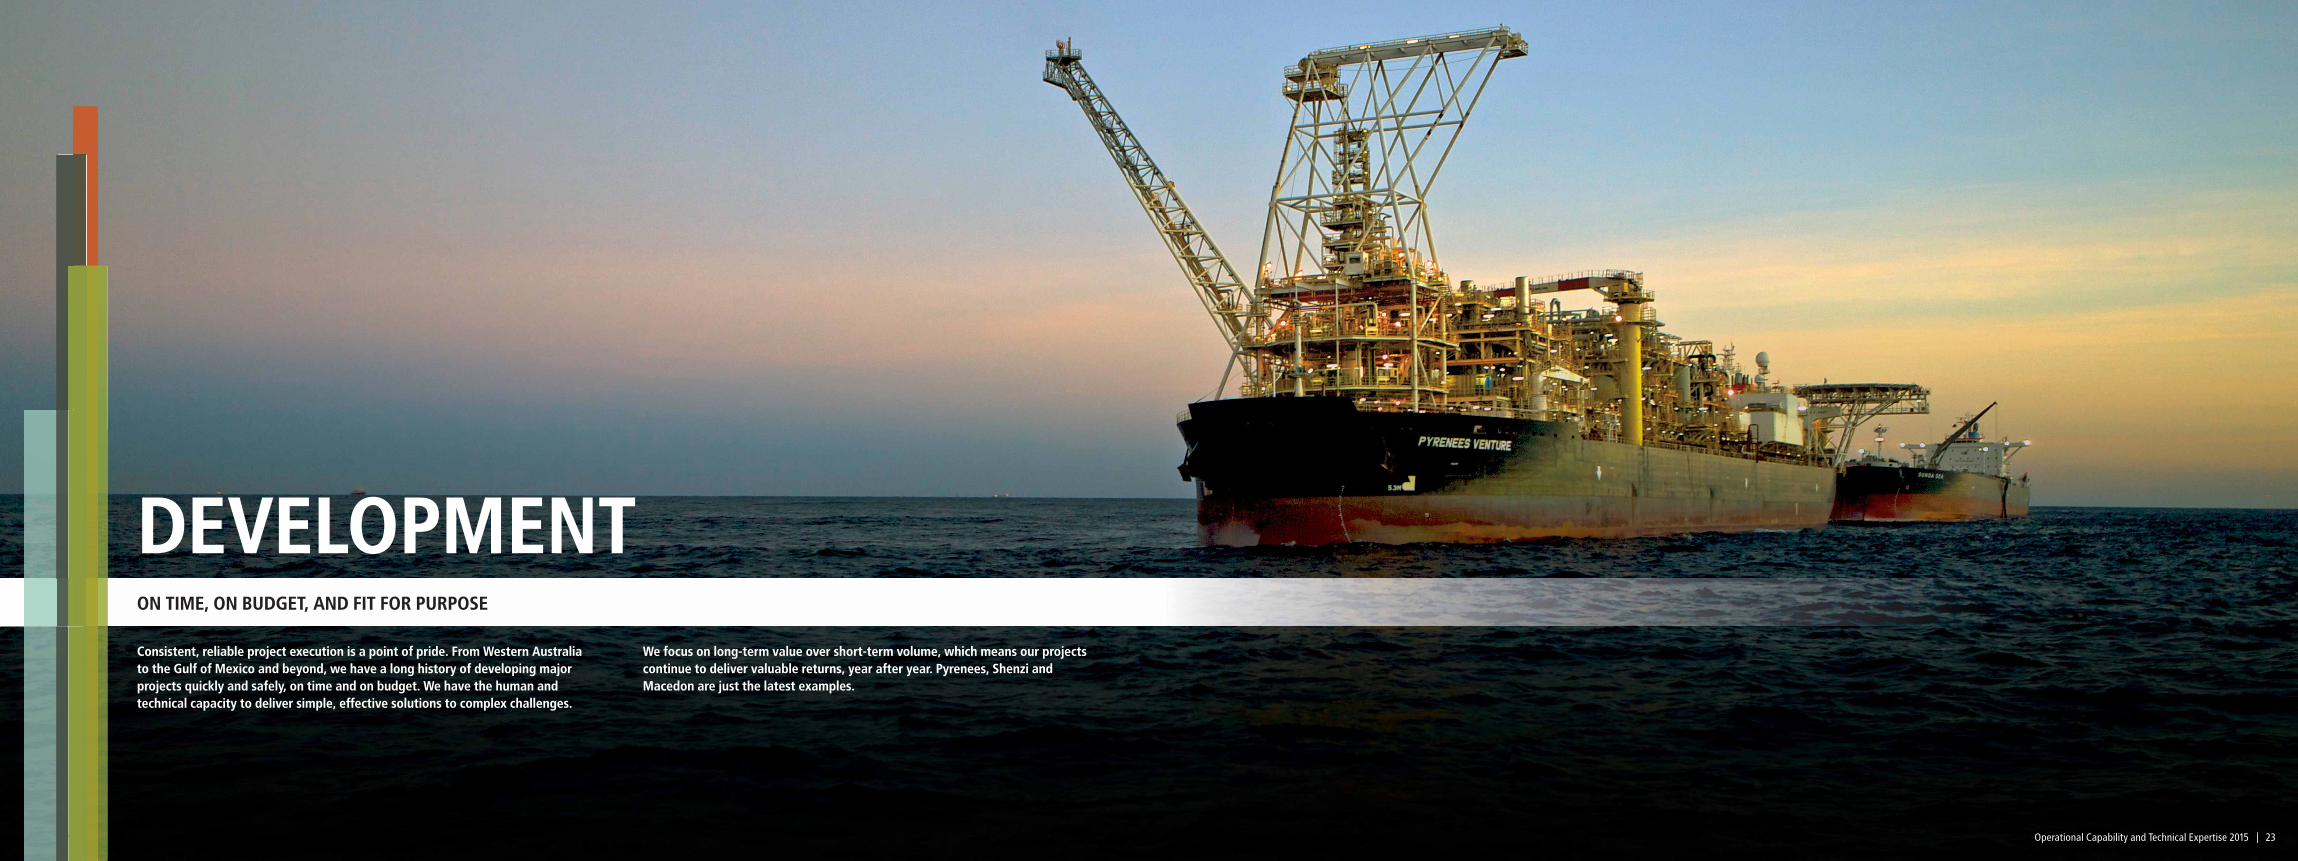
DEVELOPMENTON TIME, ON BUDGET, AND FIT FOR PURPOSE
Consistent, reliable project execution is a point of pride. From Western Australia
to the Gulf of Mexico and beyond, we have a long history of developing major
projects quickly and safely, on time and on budget. We have the human and
technical capacity to deliver simple, effective solutions to complex challenges.
We focus on long-term value over short-term volume, which means our projects
continue to deliver valuable returns, year after year. Pyrenees, Shenzi and
Macedon are just the latest examples.

2524 Operational Capability and Technical Expertise 2015Operational Capability and Technical Expertise 201524 Operational Capability and Technical Expertise 2015 25Operational Capability and Technical Expertise 2015
BHP Billiton Industry averageBest-in-classBHP Billiton–operated
DEVELOPMENT
PROVEN PROJECT DEVELOPMENT CAPABILITYFrom exploration to first oil, BHP Billiton
is a recognised industry leader in
project execution.
• Jabiru ‘86
• Challis ‘89
• Skua ‘91
• Griffin ‘94
• El ang ‘98
• Buffalo ‘99
• Bruce ‘98
• Keith ‘00
• Typhoon ‘02
• Ohanet ‘03
• Boris ‘03
• ROD ‘04
Timor / NWS FPSOs
Other International
1998 to 2004
1986 to 1999
Note: Competitors n=58, Financial Years 2007 to 2013. Variances to last board-approved plan.SOURCE: BHP Billiton analysis, competitor data by Independent Project Analysis (IPA)
DELIVERING EXCEPTIONAL VALUE FROM OFFSHORE PLAYSFour of our last six offshore projects ranked
best-in-class in alignment to forecast spend and
development schedule.
Every major project begins with
an alignment of need, priority and
resources. In 2008, a major disruption
in Western Australia’s natural gas
supply made it clear that the state
needed additional reliable sources of
the crucial commodity. BHP Billiton
acted quickly to move the Macedon
offshore prospect into fast-track
execution.
The development plan called for
four subsea wells, connected via a
90-kilometre (65-mile) pipeline and
control-and-monitoring umbilicals
to an onshore gas plant. That plant
would in turn deliver dry gas via a
67-kilometre (42-mile) pipeline to
the Dampier-to-Bunbury trunk line.
Drilling and construction began
in 2010.
There were significant challenges.
The plant site was on flat land,
near the ocean. Based on flood
modeling, the decision was made
to raise the plant site to 7.5 metres
(25 feet) above mean sea level.
The remoteness of the site posed
additional challenges. Some 40 plant
modules began arriving at the port of
Dampier in 2012, and they had to be
moved more than 300 kilometres (186
miles) to the Macedon gas plant site,
over roads and bridges with strict
load restrictions.
The pipeline and well control
umbilicals that connect the subsea
wells to the gas plant were no less
complex. Their routes included not
only varying depths – with shallow-
water exposure to cyclonic weather
– but also environmentally sensitive
areas including beds of cowry snails
as well as a nesting site for sea
turtles on the shore at Urala Beach.
The pipeline was re-routed around
the cowry beds and brought ashore in
an area with few turtle nesting areas.
Further, 24-hour monitoring helped
to ensure the safety of turtles in the
area during the construction project.
Macedon went online in September
2013. The plant has an uptime of
nearly 100 per cent, and it delivers
more than 150 million scf of natural
gas per day. Managers at the plant
have full remote well control and
monitoring capabilities via the subsea
umbilicals, and the plant can run at
full capacity using only two of the
four wells if necessary. Macedon
is expected to make a significant
contribution to Western Australia’s
domestic natural gas supply at least
through 2033.
A RAPID RESPONSE TO A CRITICAL NEED
Bass Strait
1970
2005
2005
2007
2009
20131989
2007
2008
2010
Angostura Neptune
Stybarrow Pyrenees
MacedonAtlantisNorth West Shelf
Mad Dog Shenzi

27Operational Capability and Technical Expertise 2015
EXPLORATIONFOCUS, SCALE AND CAPABILITY
Members of the BHP Billiton Exploration team participated in more than 40 per
cent of the major discoveries worldwide in the last 25 years – including more than
90 per cent of the major discoveries in the Gulf of Mexico over the same period.*
Today, that team is engaged in a focused, multi-year exploration campaign, built
on the results of an in-depth proprietary global endowment study. This study not
only addresses the likelihood of significant hydrocarbon deposits, but also
evaluates those promising basins on the basis of their viability for development
and production. The data and analysis in this study, in alignment with our
company-wide strategy of operating a limited number of high-value assets, is
allowing us to concentrate our efforts only in areas we feel have the potential to
deliver Tier 1 outcomes.
One such area is the deepwater acreage in offshore Trinidad and Tobago. Our
exploration campaign there combines unprecedented scale with technological
capability that will allow us to mature identified prospects as fast as – or faster
than – anyone else in the industry.
* Major discoveries defined as greater than or equal to 200 MMboe gross recoverable resource.
SOURCES: BHP Billiton internal analysis, Wood MackenziePhoto courtesy of PGS
2928 Operational Capability and Technical Expertise 2015Operational Capability and Technical Expertise 2015
3D seismic
BHP Billiton leases
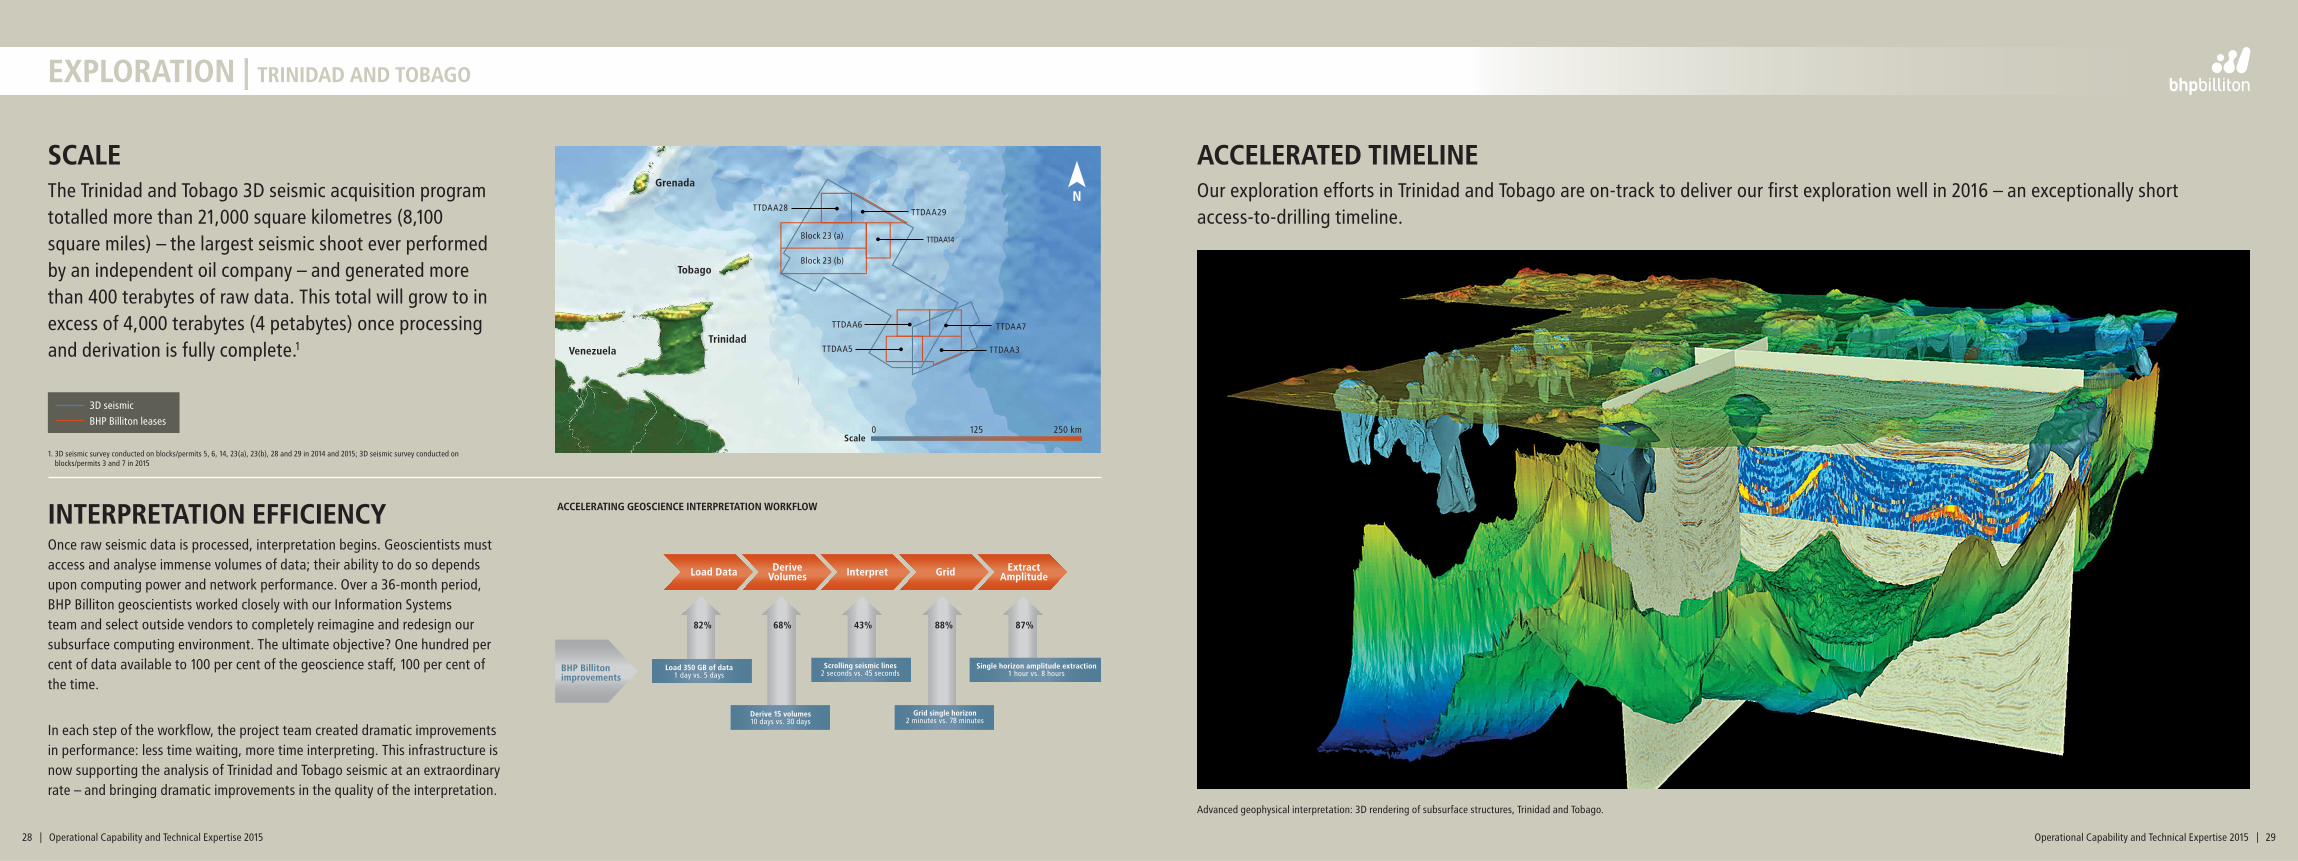
EXPLORATION | TRINIDAD AND TOBAGO
ACCELERATED TIMELINEOur exploration efforts in Trinidad and Tobago are on-track to deliver our first exploration well in 2016 – an exceptionally short
access-to-drilling timeline.
SCALEThe Trinidad and Tobago 3D seismic acquisition program
totalled more than 21,000 square kilometres (8,100
square miles) – the largest seismic shoot ever performed
by an independent oil company – and generated more
than 400 terabytes of raw data. This total will grow to in
excess of 4,000 terabytes (4 petabytes) once processing
and derivation is fully complete.1
INTERPRETATION EFFICIENCYOnce raw seismic data is processed, interpretation begins. Geoscientists must
access and analyse immense volumes of data; their ability to do so depends
upon computing power and network performance. Over a 36-month period,
BHP Billiton geoscientists worked closely with our Information Systems
team and select outside vendors to completely reimagine and redesign our
subsurface computing environment. The ultimate objective? One hundred per
cent of data available to 100 per cent of the geoscience staff, 100 per cent of
the time.
In each step of the workflow, the project team created dramatic improvements
in performance: less time waiting, more time interpreting. This infrastructure is
now supporting the analysis of Trinidad and Tobago seismic at an extraordinary
rate – and bringing dramatic improvements in the quality of the interpretation.
1. 3D seismic survey conducted on blocks/permits 5, 6, 14, 23(a), 23(b), 28 and 29 in 2014 and 2015; 3D seismic survey conducted on blocks/permits 3 and 7 in 2015
Advanced geophysical interpretation: 3D rendering of subsurface structures, Trinidad and Tobago.
ACCELERATING GEOSCIENCE INTERPRETATION WORKFLOW

3130 Operational Capability and Technical Expertise 2015Operational Capability and Technical Expertise 2015
LEADERSHIP
Tim Cutt President, Petroleum
Appointed President, Petroleum in July 2013. Joined BHP Billiton in 2007 as President of the Production Division in the Petroleum business, with accountability for Petroleum’s operations in the United Kingdom, Pakistan, Trinidad and Tobago, Algeria, Australia, and the United States. In 2011, Tim was appointed to the position of President, Diamonds and Specialty Products, where he was responsible for the operation of the Ekati Diamond Mine and led the early stages of the Jansen Potash development in Saskatchewan, Canada.
Tim has 32 years of experience in the resources industry. Before joining BHP Billiton, he spent 25 years in engineering, operations and senior management with Mobil Oil Corporation and then ExxonMobil. During this time, he spent 10 years supporting exploration and production activities in the Gulf of Mexico, from Mobile Bay in the eastern gulf to High Island in the western gulf. Tim has extensive heavy oil experience from his time in the San Joaquin Valley in California and the Cerro Negro project in Venezuela. Tim held the positions of President Hibernia Management and Development Company in Canada and President of ExxonMobil de Venezuela.
BS, Petroleum Engineering, Louisiana Tech University
David Rainey President, Exploration
Joined BHP Billiton 2011. Leading a worldwide exploration campaign, with a current focus on rebuilding the exploration portfolio to concentrate on areas with Tier 1 potential. He led capture of dominant deepwater acreage positions in Trinidad and Tobago and Barbados. In Trinidad and Tobago, he led the completion of the largest 3D seismic program ever acquired by an independent oil company.
David has 35 years of experience in the oil and gas industry. He led the BP Gulf of Mexico Strategy Team, setting a strategy to grow production from below 50 mboe/d to 500 mboe/d by 2010. This milestone was achieved in 2009. David also ran BP’s Gulf of Mexico exploration program, delivering roughly 5 billion boe gross discovered resources (2.5 billion boe net to BP) from 2000 to 2010. He also restarted the BP Alaska exploration program in late 1980s, participating in the Pt. McIntyre discovery: cumulative production over 500 million boe to date.
BSc, Geology, University of EdinburghPh.D., Geology, University of Edinburgh
Steve Pastor Asset President, Conventional
Joined BHP Billiton in 2001. Accomplishments include management and operational roles in the Atlantis and Shenzi Gulf of Mexico deepwater projects; Project Director for the Stybarrow and Pyrenees developments in offshore Western Australia, and roles as the General Manager of the Gulf of Mexico Production Unit and as the General Manager of the Eagle Ford Production Unit. Prior to his current role, Steve served as President, Development.
Steve began his career with Chevron in 1989, working in facilities engineering, production operations and maintenance, drilling & completions, and deepwater projects. He worked on Chevron’s first and second deepwater projects (Genesis and Typhoon, respectively).
BA, Mechanical Engineering, University of New OrleansMBA, Tulane University
Alex Archila Asset President, Shale
Joined BHP Billiton 2009. Accomplishments include the economic appraisal of the Upper Wolfcamp horizon in the Permian Basin, North Reeves County. He also led the technical and commercial assessment of the Petrohawk and Chesapeake (Fayetteville) shale acquisitions. Prior to his current role, he served as the President of the BHP Billiton Potash business, General Manager of petroleum operations in the Permian Basin, and Vice President of Strategy and Planning.
Alex has more than 32 years of industry experience, including 22 years with Chevron/Texaco. During his tenure, he served as a member of the Chevron Corporation’s Management Committee, CEO of Madagascar Oil Ltd. and President of Chevron Canada. He led negotiations around the Guajira gas fields that resulted in the first-ever extension of a producing contract in Colombia; led Texaco’s acquisition of equity in the Malampaya field from Shell; and created and structured Madagascar Oil’s JV partnership with Total for the development of the Bemolanga field.
BS (Honours), Petroleum Engineering, University of Southwestern LouisianaMBA, Universidad de La Sabana
TECHNICAL LEADERSHIP: EXPERIENCE
Senior leaders in core technical and operational functions within the BHP Billiton Petroleum
business average more than 27 years of experience. For a few, most of that tenure came at
BHP Billiton; most, however, logged between one and three decades of experience at
supermajors before joining BHP Billiton.
GEOSCIENCEDRILLING
more than 30 years
21 to 30 years
11 to 20 years
10 or fewer years
ENGINEERING

BHP Billiton1360 Post Oak Boulevard, Suite 150Houston, Texas 77056United States of America
Phone: 1.713.961.8500Fax: 1.713.961.8400www.bhpbilliton.com
PETROLEUM RESOURCESThe estimates of petroleum reserves and contingent resources contained in this presentation are based on, and fairly represent, information and supporting documentation prepared under the supervision of Mr. A.G. Gadgil, who is employed by BHP Billiton. Mr. Gadgil is a member of the Society of Petroleum Engineers and has the required qualifications and experience to act as a qualified petroleum reserves and resources evaluator under the ASX Listing Rules. This presentation is issued with the prior written consent of Mr. Gadgil, who agrees with the form and context in which the petroleum reserves and contingent resources are presented. Aggregates of reserves and contingent resources estimates contained in this presentation have been calculated by arithmetic summation of field/project estimates by category. The aggregate 1P reserves may be conservative due to the portfolio effects of arithmetic summation. Reserves and contingent resources estimates contained in this presentation have been estimated using deterministic methodology with the exception of the North West Shelf gas asset in Australia, where probabilistic methodology has been utilized to estimate and aggregate reserves and contingent resources for the reservoirs dedicated to the gas project only. The probabilistic based portion of these reserves totals 38 MMboe (total boe conversion is based on the following: 6,000 scf of natural gas equals 1 boe) and represents approximately two per cent of our total reported proved reserves. The reserves and contingent resources contained in this presentation are inclusive of fuel required for operations. The respective amounts of fuel for each category are: 1P reserves 91 MMboe, 2P reserves 180 MMboe, 2C contingent resources 213 MMboe. The custody transfer point(s) / point(s) of sale applicable for each field or project are the reference point for reserves and contingent resources. Reserves and contingent resources estimates contained in this presentation have not been adjusted for risk. Unless noted otherwise, reserves and contingent resources are as at 30 June 2015.
BHP Billiton estimates proved reserve volumes according to SEC disclosure regulations and files these in our annual 20F report with the SEC. All unproved volumes are estimated using SPE-PRMS guidelines, which allow escalations to prices and costs, and as such would be on a different basis than that prescribed by the SEC, and are therefore excluded from our SEC filings. Non-proved estimates are inherently more uncertain than proved.