petroleum watch california energy commission october … · product of the energy assessments...
TRANSCRIPT
Product of the Energy Assessments Division’s Supply Analysis Office
PETROLEUM WATCH California Energy Commission
October 2015
Recent Petroleum News and Outside Analyses
Prices � California Gasoline Prices: The gasoline price difference between California and the rest of the United
States fell from 90 cents above the national average in July to 75 cents during the third week of September.
� California Diesel Prices: The diesel price difference between California and the rest of the United States increased by 3 cents from August levels, to 36 cents during the third week of September.
Refining News
� Plains All American Crude Oil Line 903: This line remains closed and reduces crude oil shipments to the Phillips 66 Santa Maria Refinery by roughly 44,500 barrels per day.
� Phillips 66 Santa Maria Refinery: The Santa Maria Refinery continues to operate at restricted levels, and Phillips has accelerated planned maintenance at the refinery.
� Exxon Mobil Torrance Refinery: Refinery crude oil processing units remains offline for maintenance. Minimal blending component processing is occurring, but crude oil processing will be offline until 2016.
� Exxon Mobil Torrance Refinery: On September 30, Exxon Mobil announced that it had reached an agreement to sell the refinery to PBF Energy, an American refining company that owns three refineries, all on the East Coast, and has agreed to purchase a fourth in Louisiana. This will be the company’s fifth refinery and its first on the West Coast.
2
Crude Oil Prices
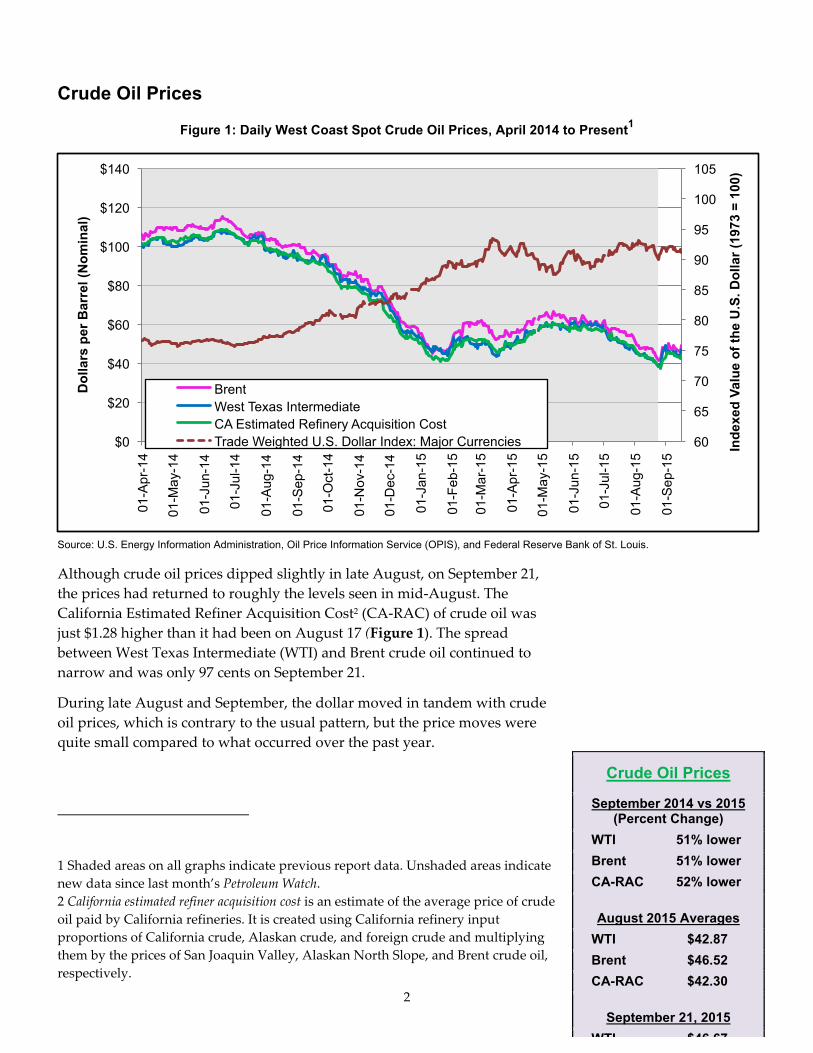
Figure 1: Daily West Coast Spot Crude Oil Prices, April 2014 to Present1
Source: U.S. Energy Information Administration, Oil Price Information Service (OPIS), and Federal Reserve Bank of St. Louis.
Although crude oil prices dipped slightly in late August, on September 21,1 the prices had returned to roughly the levels seen in mid-‐‑August. The California Estimated Refiner Acquisition Cost2 (CA-‐‑RAC) of crude oil was just $1.28 higher than it had been on August 17 (Figure 1). The spread between West Texas Intermediate (WTI) and Brent crude oil continued to narrow and was only 97 cents on September 21.
During late August and September, the dollar moved in tandem with crude oil prices, which is contrary to the usual pattern, but the price moves were quite small compared to what occurred over the past year.
1 Shaded areas on all graphs indicate previous report data. Unshaded areas indicate new data since last month’s Petroleum Watch. 2 California estimated refiner acquisition cost is an estimate of the average price of crude oil paid by California refineries. It is created using California refinery input proportions of California crude, Alaskan crude, and foreign crude and multiplying them by the prices of San Joaquin Valley, Alaskan North Slope, and Brent crude oil, respectively.
60
65
70
75
80
85
90
95
100
105
$0
$20
$40
$60
$80
$100
$120
$140
01-A
pr-1
4
01-M
ay-1
4
01-J
un-1
4
01-J
ul-1
4
01-A
ug-1
4
01-S
ep-1
4
01-O
ct-1
4
01-N
ov-1
4
01-D
ec-1
4
01-J
an-1
5
01-F
eb-1
5
01-M
ar-1
5
01-A
pr-1
5
01-M
ay-1
5
01-J
un-1
5
01-J
ul-1
5
01-A
ug-1
5
01-S
ep-1
5
Ind
exed
Val
ue
of
the
U.S
. Do
llar
(197
3 =
100
)
Do
llars
per
Bar
rel (
No
min
al)
Brent West Texas Intermediate CA Estimated Refinery Acquisition Cost Trade Weighted U.S. Dollar Index: Major Currencies
Crude Oil Prices
September 2014 vs 2015 (Percent Change)
WTI 51% lower Brent 51% lower CA-RAC 52% lower
August 2015 Averages
WTI $42.87 Brent $46.52 CA-RAC $42.30
September 21, 2015
WTI $46.67 Brent $47.64
3
Crude Oil Production and Storage
The price of crude oil has levelled off, U.S. production of crude oil has declined over the past month, and the amount of crude oil in storage has levelled off. U.S. refinery utilization has fallen to 90 percent from 95 percent. Nevertheless, storage inventories remain well above five-‐‑year averages, and production remains at high levels when compared to historical averages.
� U. S. crude oil output declined from 9.3 million barrels per day (bpd) in July to 9.1 million bpd in August, according to U.S. Energy Information Administration (EIA) estimates.
� Imports of Canadian crude oil still remain strong, averaging more than 3 million bpd during September.
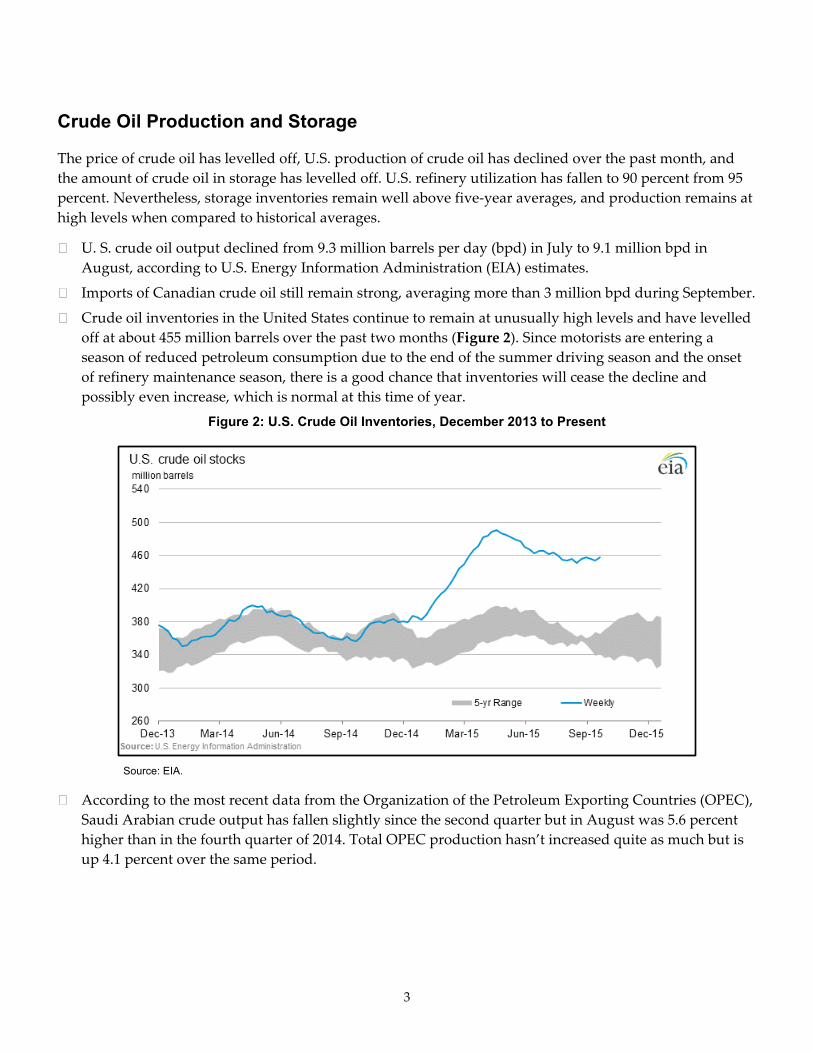
� Crude oil inventories in the United States continue to remain at unusually high levels and have levelled off at about 455 million barrels over the past two months (Figure 2). Since motorists are entering a season of reduced petroleum consumption due to the end of the summer driving season and the onset of refinery maintenance season, there is a good chance that inventories will cease the decline and possibly even increase, which is normal at this time of year.
Figure 2: U.S. Crude Oil Inventories, December 2013 to Present
Source: EIA.
� According to the most recent data from the Organization of the Petroleum Exporting Countries (OPEC), Saudi Arabian crude output has fallen slightly since the second quarter but in August was 5.6 percent higher than in the fourth quarter of 2014. Total OPEC production hasn’t increased quite as much but is up 4.1 percent over the same period.
4
�
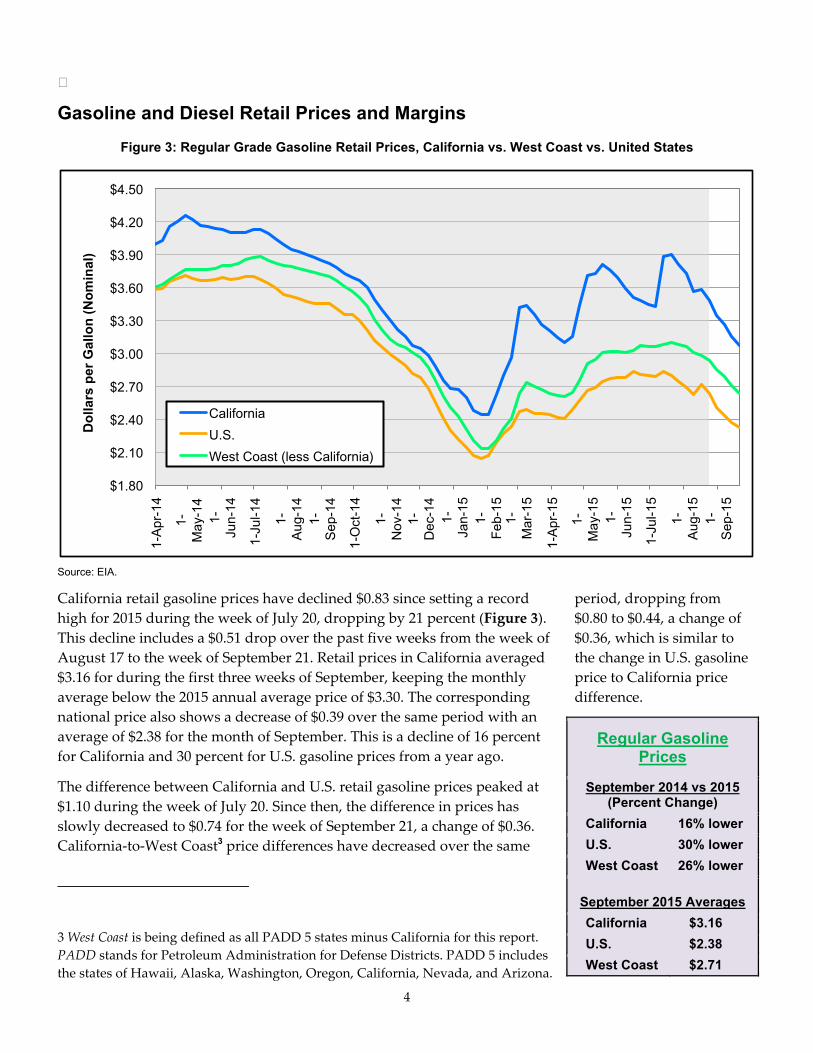
Gasoline and Diesel Retail Prices and Margins Figure 3: Regular Grade Gasoline Retail Prices, California vs. West Coast vs. United States
Source: EIA.
California retail gasoline prices have declined $0.83 since setting a record high for 2015 during the week of July 20, dropping by 21 percent (Figure 3). This decline includes a $0.51 drop over the past five weeks from the week of August 17 to the week of September 21. Retail prices in California averaged $3.16 for during the first three weeks of September, keeping the monthly average below the 2015 annual average price of $3.30. The corresponding national price also shows a decrease of $0.39 over the same period with an average of $2.38 for the month of September. This is a decline of 16 percent for California and 30 percent for U.S. gasoline prices from a year ago.
The difference between California and U.S. retail gasoline prices peaked at $1.10 during the week of July 20. Since then, the difference in prices has slowly decreased to $0.74 for the week of September 21, a change of $0.36. California-‐‑to-‐‑West Coast3 price differences have decreased over the same
3 West Coast is being defined as all PADD 5 states minus California for this report. PADD stands for Petroleum Administration for Defense Districts. PADD 5 includes the states of Hawaii, Alaska, Washington, Oregon, California, Nevada, and Arizona.
period, dropping from $0.80 to $0.44, a change of $0.36, which is similar to the change in U.S. gasoline price to California price difference.
Regular Gasoline Prices
September 2014 vs 2015 (Percent Change)
California 16% lower U.S. 30% lower West Coast 26% lower
September 2015 Averages
California $3.16 U.S. $2.38 West Coast $2.71
$1.80
$2.10
$2.40
$2.70
$3.00
$3.30
$3.60
$3.90
$4.20
$4.50
1-A
pr-1
4
1-M
ay-1
4 1-
Jun-
14
1-Ju
l-14
1-A
ug-1
4 1-
Sep
-14
1-O
ct-1
4
1-N
ov-1
4 1-
Dec
-14
1-Ja
n-15
1-
Feb
-15
1-M
ar-1
5
1-A
pr-1
5
1-M
ay-1
5 1-
Jun-
15
1-Ju
l-15
1-A
ug-1
5 1-
Sep
-15
Do
llars
per
Gal
lon
(N
om
inal
)
California
U.S.
West Coast (less California)
5
Week of September 21,
2015 California $3.07
U.S. $2.33 West Coast $2.63
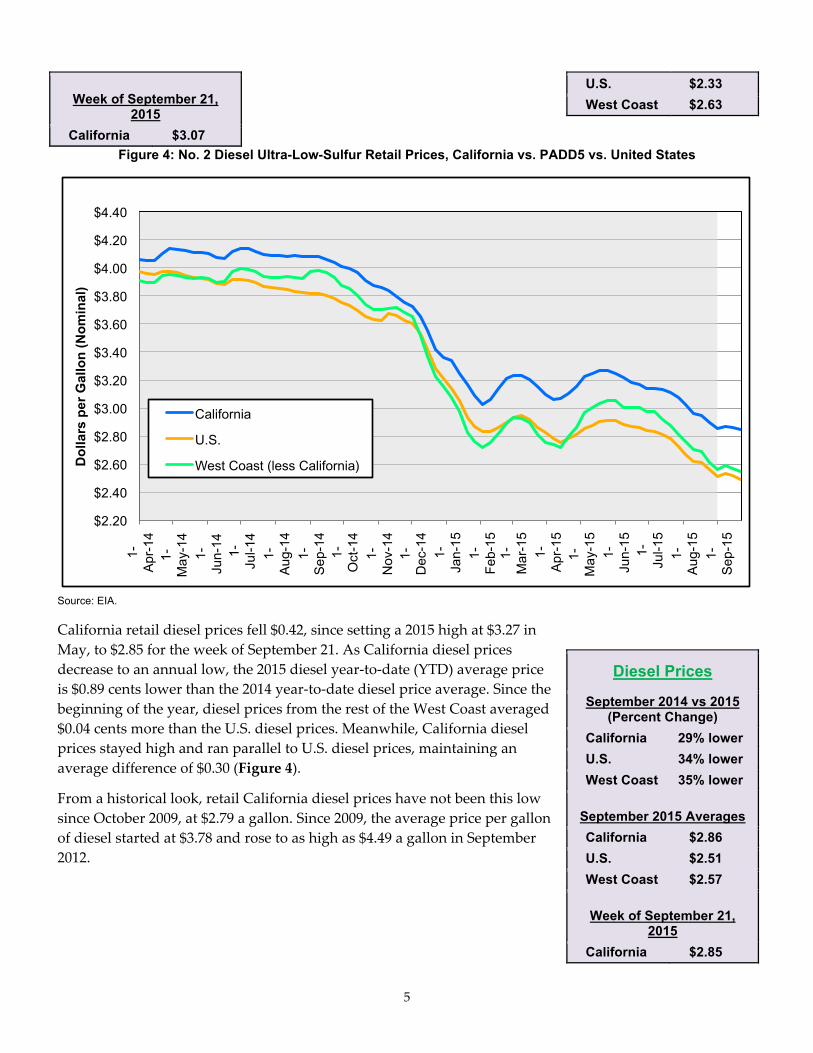
Figure 4: No. 2 Diesel Ultra-Low-Sulfur Retail Prices, California vs. PADD5 vs. United States
Source: EIA.
California retail diesel prices fell $0.42, since setting a 2015 high at $3.27 in May, to $2.85 for the week of September 21. As California diesel prices decrease to an annual low, the 2015 diesel year-‐‑to-‐‑date (YTD) average price is $0.89 cents lower than the 2014 year-‐‑to-‐‑date diesel price average. Since the beginning of the year, diesel prices from the rest of the West Coast averaged $0.04 cents more than the U.S. diesel prices. Meanwhile, California diesel prices stayed high and ran parallel to U.S. diesel prices, maintaining an average difference of $0.30 (Figure 4).
From a historical look, retail California diesel prices have not been this low since October 2009, at $2.79 a gallon. Since 2009, the average price per gallon of diesel started at $3.78 and rose to as high as $4.49 a gallon in September 2012.
Diesel Prices
September 2014 vs 2015 (Percent Change)
California 29% lower U.S. 34% lower West Coast 35% lower
September 2015 Averages
California $2.86 U.S. $2.51 West Coast $2.57
Week of September 21,
2015 California $2.85
$2.20
$2.40
$2.60
$2.80
$3.00
$3.20
$3.40
$3.60
$3.80
$4.00
$4.20
$4.40
1-A
pr-1
4 1-
May
-14
1-Ju
n-14
1-
Jul-1
4
1-A
ug-1
4
1-S
ep-1
4 1-
Oct
-14
1-N
ov-1
4 1-
Dec
-14
1-Ja
n-15
1-F
eb-1
5 1-
Mar
-15
1-A
pr-1
5 1-
May
-15
1-Ju
n-15
1-
Jul-1
5
1-A
ug-1
5
1-S
ep-1
5
Do
llars
per
Gal
lon
(N
om
inal
)
California
U.S.
West Coast (less California)
6
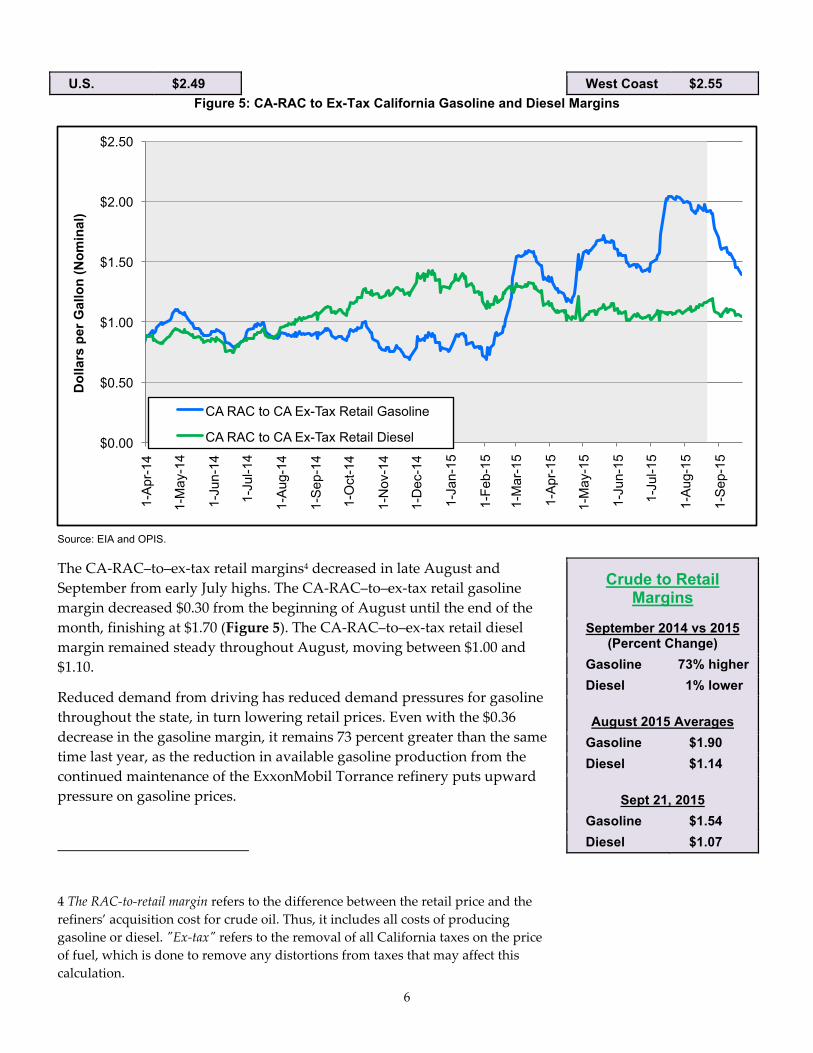
U.S. $2.49 West Coast $2.55 Figure 5: CA-RAC to Ex-Tax California Gasoline and Diesel Margins
Source: EIA and OPIS.
The CA-‐‑RAC–to–ex-‐‑tax retail margins4 decreased in late August and September from early July highs. The CA-‐‑RAC–to–ex-‐‑tax retail gasoline margin decreased $0.30 from the beginning of August until the end of the month, finishing at $1.70 (Figure 5). The CA-‐‑RAC–to–ex-‐‑tax retail diesel margin remained steady throughout August, moving between $1.00 and $1.10.
Reduced demand from driving has reduced demand pressures for gasoline throughout the state, in turn lowering retail prices. Even with the $0.36 decrease in the gasoline margin, it remains 73 percent greater than the same time last year, as the reduction in available gasoline production from the continued maintenance of the ExxonMobil Torrance refinery puts upward pressure on gasoline prices.
4 The RAC-‐‑to-‐‑retail margin refers to the difference between the retail price and the refiners’ acquisition cost for crude oil. Thus, it includes all costs of producing gasoline or diesel. "ʺEx-‐‑tax"ʺ refers to the removal of all California taxes on the price of fuel, which is done to remove any distortions from taxes that may affect this calculation.
Crude to Retail Margins
September 2014 vs 2015 (Percent Change)
Gasoline 73% higher Diesel 1% lower
August 2015 Averages
Gasoline $1.90 Diesel $1.14
Sept 21, 2015
Gasoline $1.54 Diesel $1.07
$0.00
$0.50
$1.00
$1.50
$2.00
$2.50 1-
Apr
-14
1-M
ay-1
4
1-Ju
n-14
1-Ju
l-14
1-A
ug-1
4
1-S
ep-1
4
1-O
ct-1
4
1-N
ov-1
4
1-D
ec-1
4
1-Ja
n-15
1-F
eb-1
5
1-M
ar-1
5
1-A
pr-1
5
1-M
ay-1
5
1-Ju
n-15
1-Ju
l-15
1-A
ug-1
5
1-S
ep-1
5
Do
llars
per
Gal
lon
(N
om
inal
)
CA RAC to CA Ex-Tax Retail Gasoline
CA RAC to CA Ex-Tax Retail Diesel
7
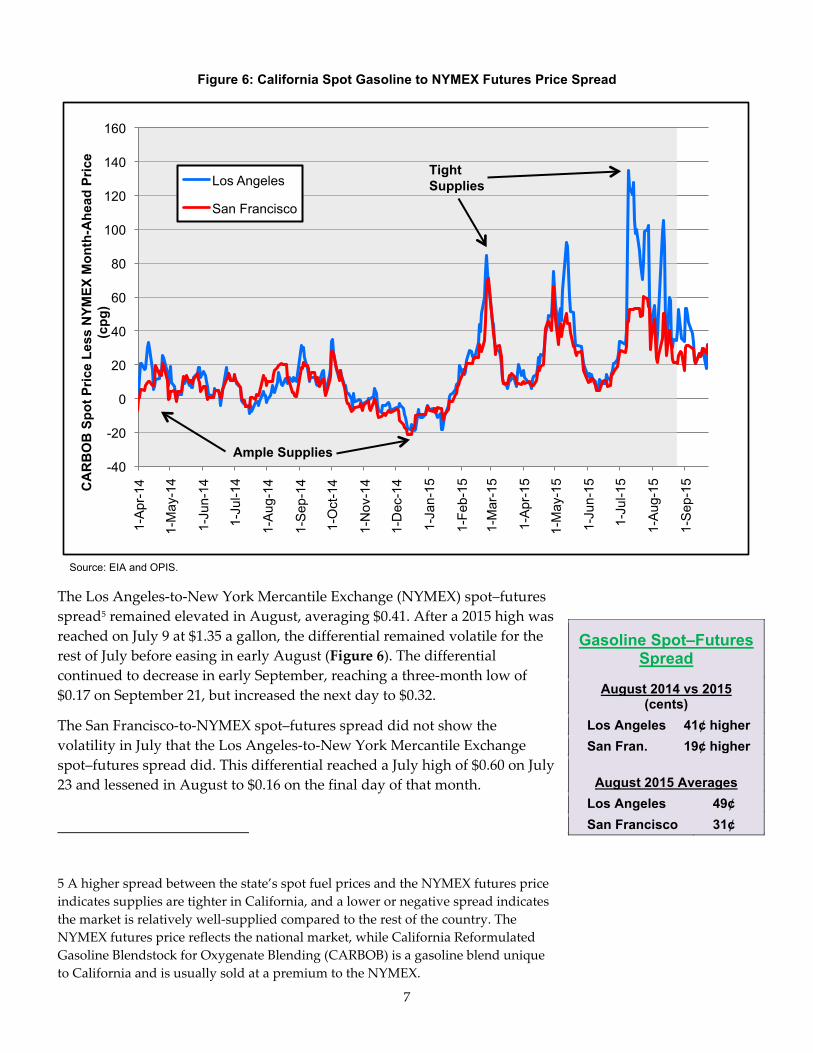
Figure 6: California Spot Gasoline to NYMEX Futures Price Spread
Source: EIA and OPIS.
The Los Angeles-‐‑to-‐‑New York Mercantile Exchange (NYMEX) spot–futures spread5 remained elevated in August, averaging $0.41. After a 2015 high was reached on July 9 at $1.35 a gallon, the differential remained volatile for the rest of July before easing in early August (Figure 6). The differential continued to decrease in early September, reaching a three-‐‑month low of $0.17 on September 21, but increased the next day to $0.32.
The San Francisco-‐‑to-‐‑NYMEX spot–futures spread did not show the volatility in July that the Los Angeles-‐‑to-‐‑New York Mercantile Exchange spot–futures spread did. This differential reached a July high of $0.60 on July 23 and lessened in August to $0.16 on the final day of that month.
5 A higher spread between the state’s spot fuel prices and the NYMEX futures price indicates supplies are tighter in California, and a lower or negative spread indicates the market is relatively well-‐‑supplied compared to the rest of the country. The NYMEX futures price reflects the national market, while California Reformulated Gasoline Blendstock for Oxygenate Blending (CARBOB) is a gasoline blend unique to California and is usually sold at a premium to the NYMEX.
Gasoline Spot–Futures Spread
August 2014 vs 2015 (cents)
Los Angeles 41¢ higher San Fran. 19¢ higher
August 2015 Averages
Los Angeles 49¢ San Francisco 31¢
-40
-20
0
20
40
60
80
100
120
140
160 1-
Apr
-14
1-M
ay-1
4
1-Ju
n-14
1-Ju
l-14
1-A
ug-1
4
1-S
ep-1
4
1-O
ct-1
4
1-N
ov-1
4
1-D
ec-1
4
1-Ja
n-15
1-F
eb-1
5
1-M
ar-1
5
1-A
pr-1
5
1-M
ay-1
5
1-Ju
n-15
1-Ju
l-15
1-A
ug-1
5
1-S
ep-1
5 CA
RB
OB
Sp
ot
Pri
ce L
ess
NY
ME
X M
on
th-A
hea
d P
rice
(c
pg
)
Los Angeles
San Francisco
Tight Supplies
Ample Supplies
8
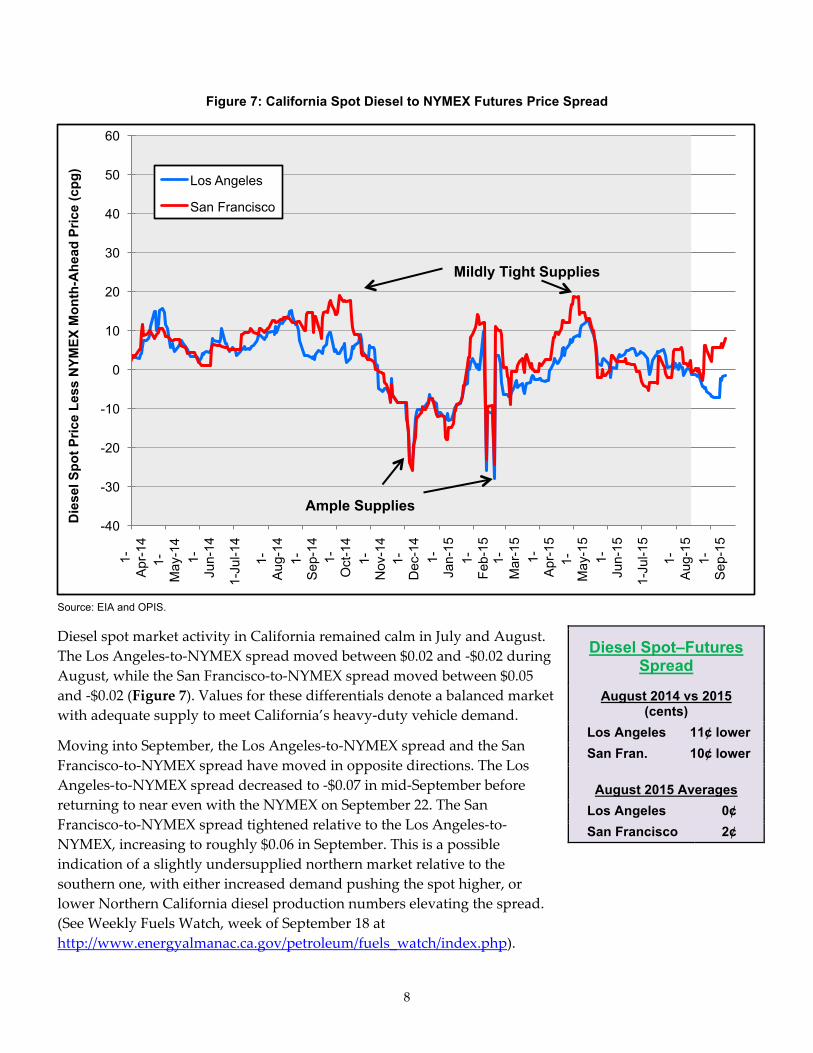
Figure 7: California Spot Diesel to NYMEX Futures Price Spread
Source: EIA and OPIS.
Diesel spot market activity in California remained calm in July and August. The Los Angeles-‐‑to-‐‑NYMEX spread moved between $0.02 and -‐‑$0.02 during August, while the San Francisco-‐‑to-‐‑NYMEX spread moved between $0.05 and -‐‑$0.02 (Figure 7). Values for these differentials denote a balanced market with adequate supply to meet California’s heavy-‐‑duty vehicle demand.
Moving into September, the Los Angeles-‐‑to-‐‑NYMEX spread and the San Francisco-‐‑to-‐‑NYMEX spread have moved in opposite directions. The Los Angeles-‐‑to-‐‑NYMEX spread decreased to -‐‑$0.07 in mid-‐‑September before returning to near even with the NYMEX on September 22. The San Francisco-‐‑to-‐‑NYMEX spread tightened relative to the Los Angeles-‐‑to-‐‑NYMEX, increasing to roughly $0.06 in September. This is a possible indication of a slightly undersupplied northern market relative to the southern one, with either increased demand pushing the spot higher, or lower Northern California diesel production numbers elevating the spread. (See Weekly Fuels Watch, week of September 18 at http://www.energyalmanac.ca.gov/petroleum/fuels_watch/index.php).
Diesel Spot–Futures Spread
August 2014 vs 2015 (cents)
Los Angeles 11¢ lower San Fran. 10¢ lower
August 2015 Averages
Los Angeles 0¢ San Francisco 2¢
-40
-30
-20
-10
0
10
20
30
40
50
60 1-
Apr
-14
1-M
ay-1
4
1-Ju
n-14
1-Ju
l-14
1-A
ug-1
4
1-S
ep-1
4 1-
Oct
-14
1-N
ov-1
4 1-
Dec
-14
1-Ja
n-15
1-F
eb-1
5 1-
Mar
-15
1-A
pr-1
5 1-
May
-15
1-Ju
n-15
1-Ju
l-15
1-A
ug-1
5
1-S
ep-1
5
Die
sel S
po
t P
rice
Les
s N
YM
EX
Mo
nth
-Ah
ead
Pri
ce (
cpg
)
Los Angeles
San Francisco
Mildly Tight Supplies
Ample Supplies
9
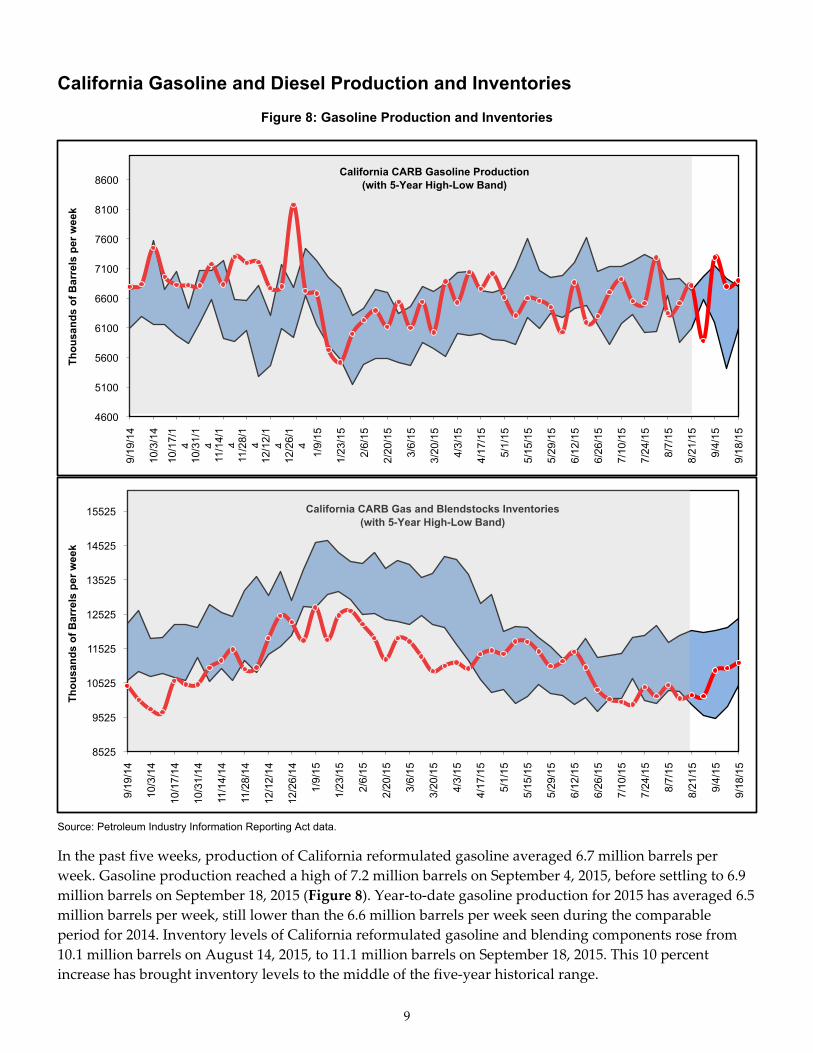
California Gasoline and Diesel Production and Inventories Figure 8: Gasoline Production and Inventories
Source: Petroleum Industry Information Reporting Act data.
In the past five weeks, production of California reformulated gasoline averaged 6.7 million barrels per week. Gasoline production reached a high of 7.2 million barrels on September 4, 2015, before settling to 6.9 million barrels on September 18, 2015 (Figure 8). Year-‐‑to-‐‑date gasoline production for 2015 has averaged 6.5 million barrels per week, still lower than the 6.6 million barrels per week seen during the comparable period for 2014. Inventory levels of California reformulated gasoline and blending components rose from 10.1 million barrels on August 14, 2015, to 11.1 million barrels on September 18, 2015. This 10 percent increase has brought inventory levels to the middle of the five-‐‑year historical range.
4600
5100
5600
6100
6600
7100
7600
8100
8600
9/19
/14
10/3
/14
10/1
7/1
4 10
/31/
14
11/1
4/1
4 11
/28/
14
12/1
2/1
4 12
/26/
14
1/9/
15
1/23
/15
2/6/
15
2/20
/15
3/6/
15
3/20
/15
4/3/
15
4/17
/15
5/1/
15
5/15
/15
5/29
/15
6/12
/15
6/26
/15
7/10
/15
7/24
/15
8/7/
15
8/21
/15
9/4/
15
9/18
/15
Th
ou
san
ds
of
Bar
rels
per
wee
k
California CARB Gasoline Production (with 5-Year High-Low Band)
8525
9525
10525
11525
12525
13525
14525
15525
9/19
/14
10/3
/14
10/1
7/14
10/3
1/14
11/1
4/14
11/2
8/14
12/1
2/14
12/2
6/14
1/9/
15
1/23
/15
2/6/
15
2/20
/15
3/6/
15
3/20
/15
4/3/
15
4/17
/15
5/1/
15
5/15
/15
5/29
/15
6/12
/15
6/26
/15
7/10
/15
7/24
/15
8/7/
15
8/21
/15
9/4/
15
9/18
/15
Th
ou
san
ds
of
Bar
rels
per
wee
k
California CARB Gas and Blendstocks Inventories (with 5-Year High-Low Band)
10
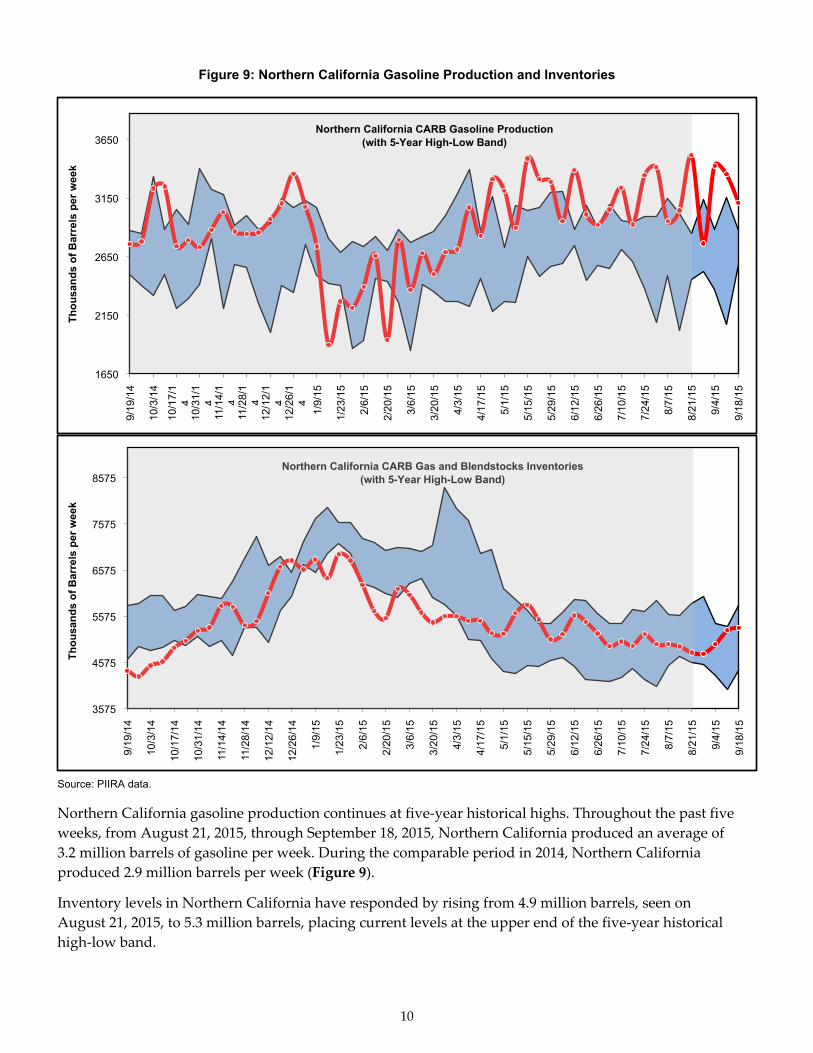
Figure 9: Northern California Gasoline Production and Inventories
Source: PIIRA data.
Northern California gasoline production continues at five-‐‑year historical highs. Throughout the past five weeks, from August 21, 2015, through September 18, 2015, Northern California produced an average of 3.2 million barrels of gasoline per week. During the comparable period in 2014, Northern California produced 2.9 million barrels per week (Figure 9).
Inventory levels in Northern California have responded by rising from 4.9 million barrels, seen on August 21, 2015, to 5.3 million barrels, placing current levels at the upper end of the five-‐‑year historical high-‐‑low band.
1650
2150
2650
3150
3650 9/
19/1
4
10/3
/14
10/1
7/1
4 10
/31/
14
11/1
4/1
4 11
/28/
14
12/1
2/1
4 12
/26/
14
1/9/
15
1/23
/15
2/6/
15
2/20
/15
3/6/
15
3/20
/15
4/3/
15
4/17
/15
5/1/
15
5/15
/15
5/29
/15
6/12
/15
6/26
/15
7/10
/15
7/24
/15
8/7/
15
8/21
/15
9/4/
15
9/18
/15
Th
ou
san
ds
of
Bar
rels
per
wee
k
Northern California CARB Gasoline Production (with 5-Year High-Low Band)
3575
4575
5575
6575
7575
8575
9/19
/14
10/3
/14
10/1
7/14
10/3
1/14
11/1
4/14
11/2
8/14
12/1
2/14
12/2
6/14
1/9/
15
1/23
/15
2/6/
15
2/20
/15
3/6/
15
3/20
/15
4/3/
15
4/17
/15
5/1/
15
5/15
/15
5/29
/15
6/12
/15
6/26
/15
7/10
/15
7/24
/15
8/7/
15
8/21
/15
9/4/
15
9/18
/15
Th
ou
san
ds
of
Bar
rels
per
wee
k
Northern California CARB Gas and Blendstocks Inventories (with 5-Year High-Low Band)
11
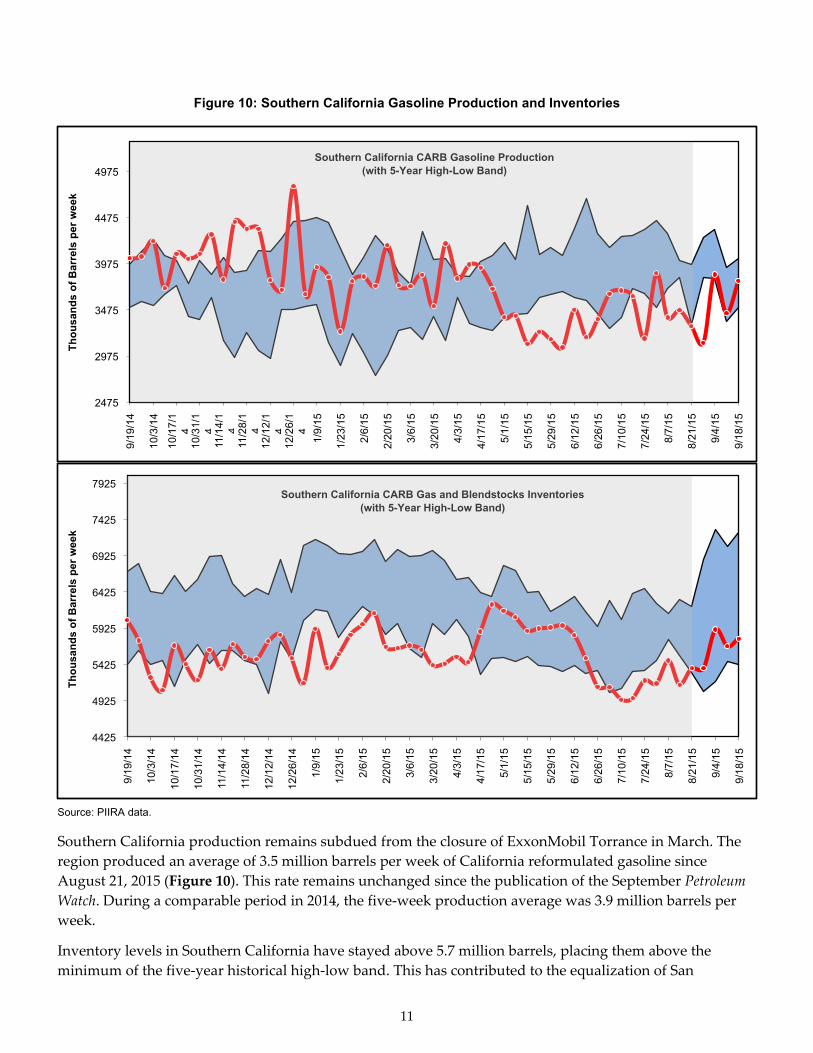
Figure 10: Southern California Gasoline Production and Inventories
Source: PIIRA data.
Southern California production remains subdued from the closure of ExxonMobil Torrance in March. The region produced an average of 3.5 million barrels per week of California reformulated gasoline since August 21, 2015 (Figure 10). This rate remains unchanged since the publication of the September Petroleum Watch. During a comparable period in 2014, the five-‐‑week production average was 3.9 million barrels per week.
Inventory levels in Southern California have stayed above 5.7 million barrels, placing them above the minimum of the five-‐‑year historical high-‐‑low band. This has contributed to the equalization of San
2475
2975
3475
3975
4475
4975
9/19
/14
10/3
/14
10/1
7/1
4 10
/31/
14
11/1
4/1
4 11
/28/
14
12/1
2/1
4 12
/26/
14
1/9/
15
1/23
/15
2/6/
15
2/20
/15
3/6/
15
3/20
/15
4/3/
15
4/17
/15
5/1/
15
5/15
/15
5/29
/15
6/12
/15
6/26
/15
7/10
/15
7/24
/15
8/7/
15
8/21
/15
9/4/
15
9/18
/15
Th
ou
san
ds
of
Bar
rels
per
wee
k
Southern California CARB Gasoline Production (with 5-Year High-Low Band)
4425
4925
5425
5925
6425
6925
7425
7925
9/19
/14
10/3
/14
10/1
7/14
10/3
1/14
11/1
4/14
11/2
8/14
12/1
2/14
12/2
6/14
1/9/
15
1/23
/15
2/6/
15
2/20
/15
3/6/
15
3/20
/15
4/3/
15
4/17
/15
5/1/
15
5/15
/15
5/29
/15
6/12
/15
6/26
/15
7/10
/15
7/24
/15
8/7/
15
8/21
/15
9/4/
15
9/18
/15
Th
ou
san
ds
of
Bar
rels
per
wee
k
Southern California CARB Gas and Blendstocks Inventories (with 5-Year High-Low Band)
12
Francisco and Los Angeles wholesale spot prices of California gasoline.
13
Figure 11: Diesel Production and Inventories
Source: PIIRA data.
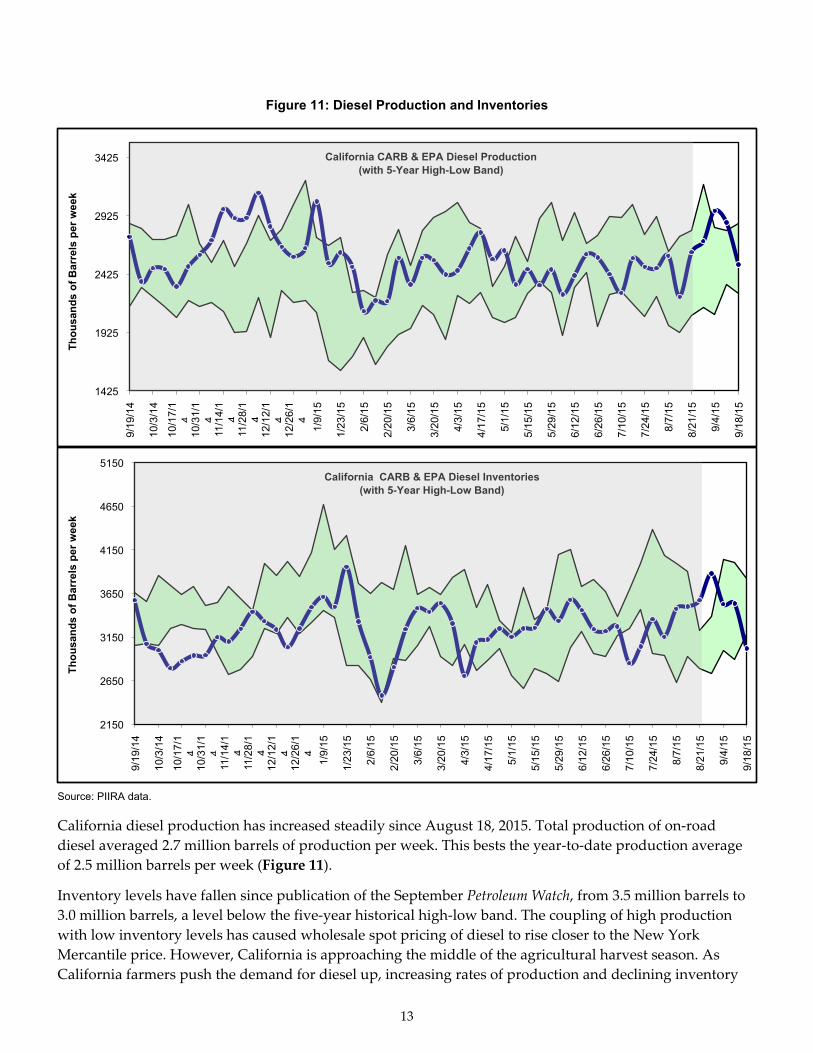
California diesel production has increased steadily since August 18, 2015. Total production of on-‐‑road diesel averaged 2.7 million barrels of production per week. This bests the year-‐‑to-‐‑date production average of 2.5 million barrels per week (Figure 11).
Inventory levels have fallen since publication of the September Petroleum Watch, from 3.5 million barrels to 3.0 million barrels, a level below the five-‐‑year historical high-‐‑low band. The coupling of high production with low inventory levels has caused wholesale spot pricing of diesel to rise closer to the New York Mercantile price. However, California is approaching the middle of the agricultural harvest season. As California farmers push the demand for diesel up, increasing rates of production and declining inventory
1425
1925
2425
2925
3425
9/19
/14
10/3
/14
10/1
7/1
4 10
/31/
14
11/1
4/1
4 11
/28/
14
12/1
2/1
4 12
/26/
14
1/9/
15
1/23
/15
2/6/
15
2/20
/15
3/6/
15
3/20
/15
4/3/
15
4/17
/15
5/1/
15
5/15
/15
5/29
/15
6/12
/15
6/26
/15
7/10
/15
7/24
/15
8/7/
15
8/21
/15
9/4/
15
9/18
/15
Th
ou
san
ds
of
Bar
rels
per
wee
k
California CARB & EPA Diesel Production (with 5-Year High-Low Band)
2150
2650
3150
3650
4150
4650
5150
9/19
/14
10/3
/14
10/1
7/1
4 10
/31/
14
11/1
4/1
4 11
/28/
14
12/1
2/1
4 12
/26/
14
1/9/
15
1/23
/15
2/6/
15
2/20
/15
3/6/
15
3/20
/15
4/3/
15
4/17
/15
5/1/
15
5/15
/15
5/29
/15
6/12
/15
6/26
/15
7/10
/15
7/24
/15
8/7/
15
8/21
/15
9/4/
15
9/18
/15
Th
ou
san
ds
of
Bar
rels
per
wee
k
California CARB & EPA Diesel Inventories (with 5-Year High-Low Band)
14
levels should be expected.
15
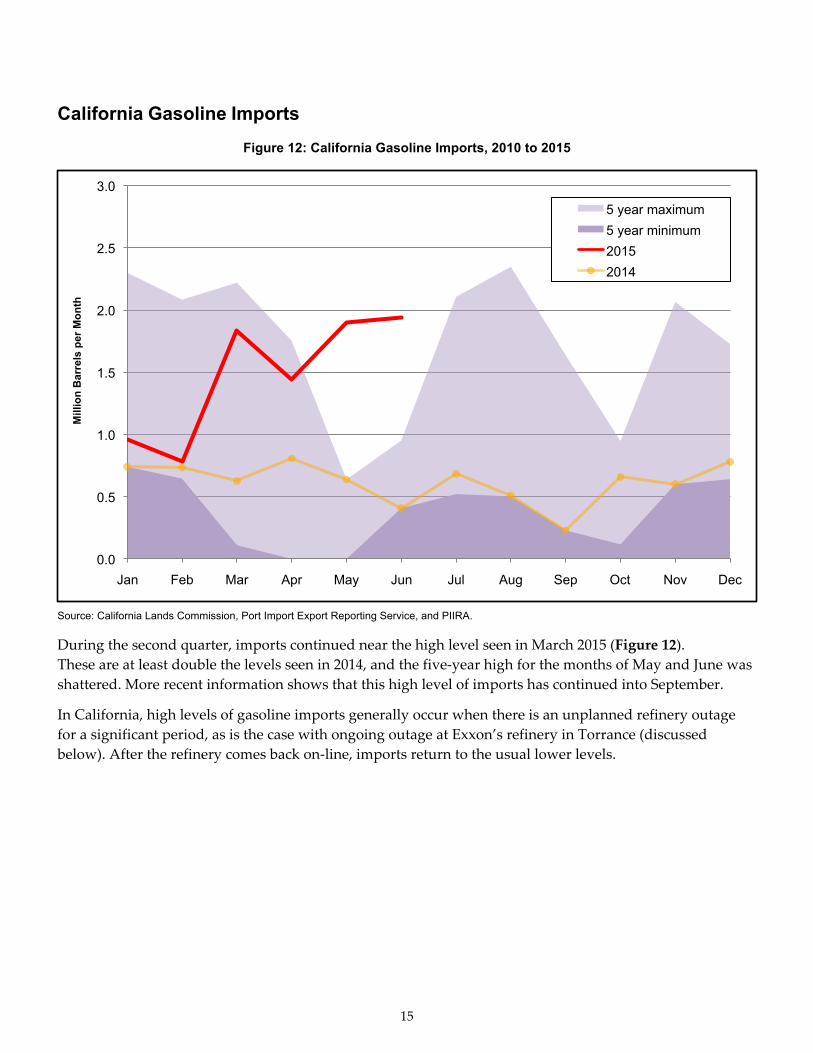
California Gasoline Imports Figure 12: California Gasoline Imports, 2010 to 2015
Source: California Lands Commission, Port Import Export Reporting Service, and PIIRA.
During the second quarter, imports continued near the high level seen in March 2015 (Figure 12). These are at least double the levels seen in 2014, and the five-‐‑year high for the months of May and June was shattered. More recent information shows that this high level of imports has continued into September.
In California, high levels of gasoline imports generally occur when there is an unplanned refinery outage for a significant period, as is the case with ongoing outage at Exxon’s refinery in Torrance (discussed below). After the refinery comes back on-‐‑line, imports return to the usual lower levels.
0.0
0.5
1.0
1.5
2.0
2.5
3.0
Jan Feb Mar Apr May Jun Jul Aug Sep Oct Nov Dec
Mill
ion
Bar
rels
per
Mo
nth
5 year maximum
5 year minimum
2015
2014
16
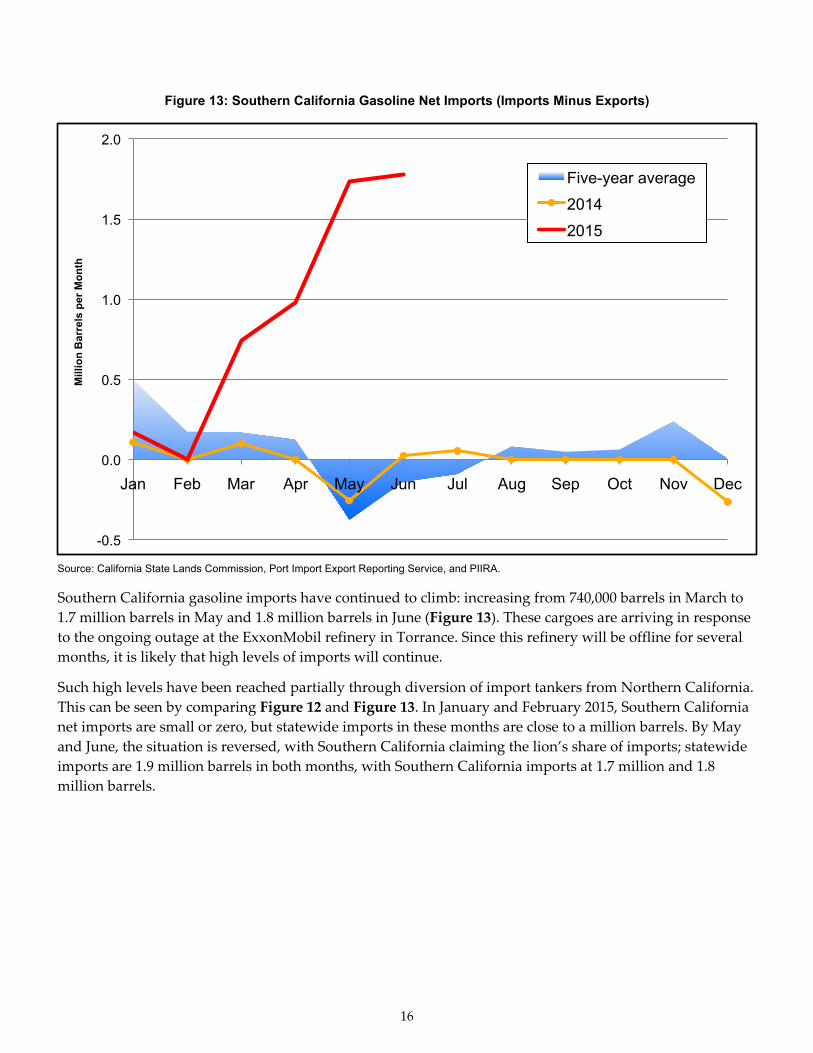
Figure 13: Southern California Gasoline Net Imports (Imports Minus Exports)
Source: California State Lands Commission, Port Import Export Reporting Service, and PIIRA.
Southern California gasoline imports have continued to climb: increasing from 740,000 barrels in March to 1.7 million barrels in May and 1.8 million barrels in June (Figure 13). These cargoes are arriving in response to the ongoing outage at the ExxonMobil refinery in Torrance. Since this refinery will be offline for several months, it is likely that high levels of imports will continue.
Such high levels have been reached partially through diversion of import tankers from Northern California. This can be seen by comparing Figure 12 and Figure 13. In January and February 2015, Southern California net imports are small or zero, but statewide imports in these months are close to a million barrels. By May and June, the situation is reversed, with Southern California claiming the lion’s share of imports; statewide imports are 1.9 million barrels in both months, with Southern California imports at 1.7 million and 1.8 million barrels.
-0.5
0.0
0.5
1.0
1.5
2.0
Jan Feb Mar Apr May Jun Jul Aug Sep Oct Nov Dec
Mill
ion
Bar
rels
per
Mo
nth
Five-year average
2014
2015