petronet lng - cu - business standardsmartinvestor.business-standard.com/bscms/pdf/petronet...for...
TRANSCRIPT

1January 30, 2008 For Private Circulation Only - Sebi Registration No : INB 010996539July 22, 2009 For Private Circulation Only - Sebi Registration No : INB 010996539 1
Petronet LNGCompany Update
Amit Vora
Tel: 022 - 4040 3800 Ext: 322
E-mail: [email protected]: Company, Angel Research
Key FinancialsY/E March (Rs cr) FY2008 FY2009 FY2010E FY2011E
Net Sales 6,555.3 8,428.7 13,398.5 17,313.4
% chg 19.0 28.6 59.0 29.2
Net Profits 474.7 518.4 566.0 599.6
% chg 51.5 9.2 9.2 5.9
OPM (%) 13.2 10.7 7.9 6.9
EPS (Rs) 6.3 6.9 7.5 8.0
P/E (x) 10.8 9.9 9.1 8.5
P/BV (x) 3.2 2.6 2.2 1.8
RoE (%) 29.3 26.1 23.9 21.7
RoCE (%) 23.9 18.7 17.9 16.3
EV/Sales (x) 1.0 0.8 0.5 0.4
EV/EBITDA (x) 7.2 7.3 6.6 6.3
Stock Info
NEUTRALPrice Rs68
Target Price -
Investment Period -
Missing ‘Linkages’We expect Petronet LNG (PLL) to register subdued performance going ahead on account ofun-tied LNG supplies, increasing domestic gas output and rising risks associated with themarketability of spot cargoes. Moreover, re-pricing of LNG from Rasgas could lead to a potentialfreeze on Dahej regasification Margins, which would impact the net-backs.The upcoming Kochiterminal also increases the company’s risk profile. At the CMP of Rs68, the stock is trading at9.1x FY2010E and 8.5x FY2011E Earnings. Given the recent run-up in the stock price, therisk-return ratio in the stock has turned unfavourable. Hence, we recommend Neutral ratingon the stock.
Long-term gas sourcing continues to be key challenge: Post expansion at Dahej anda new terminal at Kochi, PLL’s un-tied capacity is expected to be 7.5MMTPA or 45% of thetotal installed capacity. On the other hand, consequent to the high long-term LNG prices,PLL’s dependence on spot-sales is likely to increase. We remain concerned about placementof significant spot volumes in the Indian markets in light of the increasing domestic supplies.Thus, we are skeptical about full utilisation of PLL’s terminals.
Reducing Profitability of Spot LNG business: The expected significant increase indomestic production along with Gas Utilisation Policy are likely to fulfill gas shortages pertainingto gas-stranded assets. This, in turn, is likely to keep a check on the flow of significant spotvolumes to Indian shores. The spot cargo business has been extremely profitable for PLL asin addition to regasification margins, PLL had been earning trading (marketing) margins. Hence,pressure on Marketing margins of Spot cargo business will adversely impact PLL’s Profitability.
Likely freeze on Dahej regasification margins to impact netback: We believe that theperpetual 5% increase in regasification margins will not continue going ahead. Changing marketforces in the form of an increase in gas-to-gas competition, a significant increase in domesticgas supplies, and the end of fixed pricing of the RasGas contract (post CY2008) are likely toexert pressure on regasification margins going ahead. An overhaul of the complete R-LNGvalue chain will be the order of the day, if the LNG business model is to sustain in India. Also,in case of interference by Regulator,ideal ROCE should be 12-14% given the low risk involvedin the business.
Sector Oil & Gas
Market Cap (Rs cr) 5,123
Beta 0.8
52 Week High / Low 82/30
Avg Daily Volume 844311
Face Value (Rs) 10
BSE Sensex 14,843
Nifty 4,399
Shareholding Pattern (%)
Promoters 50.0
MF / Banks / Indian FIs 5.2
FII / NRIs / OCBs 20.3
Indian Public / Others 24.5
Abs. 3 m 1yr 3yr
Sensex (%) 37.2 5.2 47.2
Petronet (%) 44.6 21.4 54.4
BSE Code 532522
NSE Code PETRONET
Reuters Code PLNG.BO
Bloomberg Code PLNG@IN
Deepak Pareek
Tel: 022 - 4040 3800 Ext: 340
E-mail: [email protected]

2January 30, 2008 For Private Circulation Only - Sebi Registration No : INB 010996539July 22, 2009 For Private Circulation Only - Sebi Registration No : INB 010996539 2
Petronet LNG
Oil & Gas
Company Background
Petronet LNG Limited (PLL) is a utility company engaged in the business of the regasification ofLNG. It is promoted by four Navratna PSUs - BPCL, ONGC, GAIL and IOC - each of which hold a12.5% stake in the company. PLL's asset portfolio includes the currently operational Dahejterminal (on the western coast) and another upcoming terminal at Kochi (on the southern coast).Petronet has also signed a 50:50 joint venture agreement with the Adani group for setting up asolid cargo port in the Dahej SEZ area, as part of LNG's port concession agreement executed withthe Gujarat Maritime Board (GMB). This port will have facilities to import and export bulk productslike coal, steel, and fertilisers. PLL is also contemplating forward-integration bydiversifying into the power sector and is planning to establish a 1,100MW gas-based power projectclose to the Dahej terminal. It also plans to establish a 750MW power plant in the vicinity of theKochi terminal.
Source: Company, Angel Research
Exhibit 1: PLL over the yearsYear Event1997-98 Established as a JV between the four oil and gas PSUs as a means of boosting
domestic Natural Gas supplies, and approved by the ministry of petroleum
1999 25-year SPA signed with RasGas, subsequently assigned to RasGas II
2000-01 Finalises transport arrangements (lease of two LNG carriers) and EPC contracts
2003 Financing arrangements for the plant construction were completed. GDF and ADB broughtin as strategic and financial advisors with a 10% and 5% stake, respectively. Conces-sion agreement with Gujarat Maritime Board signed
2004 Completion of construction, commercialization in April 2004. Successful completion ofIPO, raising about INR3.2bn
2005-06 Finalization of capex plans for:
a. Expansion of Dahej facilities to 10mtpa
b. Establishing of new facilities in Kochi of 2.5mtpa (with the option to expand to 5mtpa)
c. Establishing a solid cargo port in Dahej (as part of the agreement with Gujarat Mari-time Board) through a JV with Adani Exports
Scales up capacity to 5.0MMTPA in April 2005
2006-07 De-bottlenecks capacity to 6.5MMTPA from 5MMTPA. Starts procuring spot cargoes
2007-08 Enters into an agreement with RasGas for supply of 1.25 MMTPA of gas from July 2007to December 2008
2008-09 FOB prices of gas starts alignment with the JCC prices; Enters into 1.5MMTPA contractwith BP (British Petroleum) for Jan-Sept 2009
2009-10 Raises the Dahej Terminal capacity to 11.5 MMTPA by June 2009
Additional 2.5MMTPA of firm gas supplies from RasGas to commence fromOctober 2009
2012-13 Kochi terminal to commence production from 1QFY2013 with a capacity of 2.5MMTPA
2014 Complete alignment of gas prices with JCC prices from January 2014 onwardsExpansion of Kochi Terminal to 5.0MMTPA
PLL is a utility companyengaged in the business of theregasification of LNG
3January 30, 2008 For Private Circulation Only - Sebi Registration No : INB 010996539July 22, 2009 For Private Circulation Only - Sebi Registration No : INB 010996539 3
Petronet LNG
Oil & Gas
Business Model
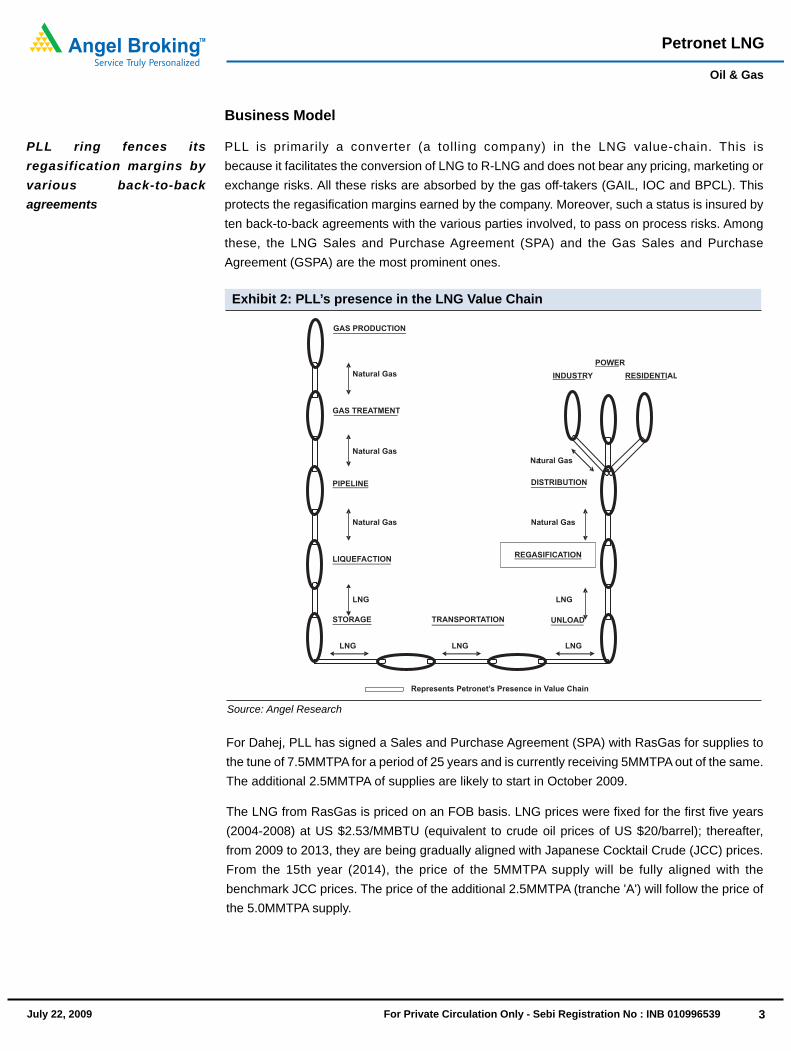
PLL is primarily a converter (a tolling company) in the LNG value-chain. This isbecause it facilitates the conversion of LNG to R-LNG and does not bear any pricing, marketing orexchange risks. All these risks are absorbed by the gas off-takers (GAIL, IOC and BPCL). Thisprotects the regasification margins earned by the company. Moreover, such a status is insured byten back-to-back agreements with the various parties involved, to pass on process risks. Amongthese, the LNG Sales and Purchase Agreement (SPA) and the Gas Sales and PurchaseAgreement (GSPA) are the most prominent ones.
RESIDENTIAL
GAS PRODUCTION
Natural Gas
Natural Gas
Natural Gas
LNG
GAS TREATMENT
PIPELINE
LIQUEFACTION
STORAGE
LNG
TRANSPORTATION
LNG LNG
UNLOAD
Natural Gas
DISTRIBUTION
REGASIFICATION
LNG
Natural Gas
INDUSTRY
POWER
Represents Petronet’s Presence in Value Chain
Source: Angel Research
Exhibit 2: PLL’s presence in the LNG Value Chain
For Dahej, PLL has signed a Sales and Purchase Agreement (SPA) with RasGas for supplies tothe tune of 7.5MMTPA for a period of 25 years and is currently receiving 5MMTPA out of the same.The additional 2.5MMTPA of supplies are likely to start in October 2009.
The LNG from RasGas is priced on an FOB basis. LNG prices were fixed for the first five years(2004-2008) at US $2.53/MMBTU (equivalent to crude oil prices of US $20/barrel); thereafter,from 2009 to 2013, they are being gradually aligned with Japanese Cocktail Crude (JCC) prices.From the 15th year (2014), the price of the 5MMTPA supply will be fully aligned with thebenchmark JCC prices. The price of the additional 2.5MMTPA (tranche 'A') will follow the price ofthe 5.0MMTPA supply.
PLL ring fences itsregasification margins byvarious back-to-backagreements

4January 30, 2008 For Private Circulation Only - Sebi Registration No : INB 010996539July 22, 2009 For Private Circulation Only - Sebi Registration No : INB 010996539 4
Petronet LNG
Oil & Gas
On the shipment front for Dahej, PLL has a Time Chartered Agreement (TCA) with the Mitsui-ledconsortium to ship LNG in India. PLL has taken two ships of 138,000 cubic meterscapacity, each, to transport LNG from Qatar to Dahej. The TCA is valid up to April 2028 and theaverage shipping charges are likely to work out to US $0.26/MMBTU.
PLL also has a GSPA with GAIL, IOC and BPCL, and sells R-LNG to them in the ratio of 60:30:10,respectively. The existing R-LNG is transported by GAIL through its Dahej-Vijaipur pipeline and issold to consumers along the HBJ pipeline. The GSPA signed with the off-takers fixedthe regasification margins for PLL at Rs23.7/MMBTU in CY2004 and provided an annualescalation of 5%.
For Kochi, PLL has signed a contract with Gorgon, Australia (an offshore LNG project) forimporting 1.5MMTPA of the LNG from 2014 onwards. Disclosures pertaining to the price of thecontract and other details have not been revealed by the company. However, we believe that thisprice would have a strong crude linkage of 13.0-13.5%.
Pricing of R-LNG
The price of the R-LNG supplied by PLL has the following components:
The actual cost of the LNG(FOB Prices)
The amount of taxes and duties on the import and sale of LNG
Shipping charges, as stipulated in the GSPA
Regasification margin as per the GSPA
Barring regasification margins, all other components are pass-through for PLL. PLL also earns amarketing margin on the sale of spot LNG.
Asset Profile
Dahej Terminal
Commercial operations commenced at the Dahej terminal in April 2004, with an initial capacity of2.5MMTPA. This was scaled-up to 5.0MMTPA in FY2006 and to 6.5MMTPA in FY2007. PLL hasfurther expanded its Dahej capacity to 11.5MMTPA at the end of 1QFY2010 (equivalent to14.1MMTPA of oil). PLL has a 25 years gas sourcing agreement with RasGas (Qatar) (Train III) of5MMTPA for meeting the current requirements of this terminal. Supplies for the planned Dahejexpansion will be met partially (2.5MMTPA) by diversion of the previously-dedicated supplies tothe Kochi terminal by RasGas (Train VII). Thus, it leaves PLL with the need to find supplies of4.0MMTPA for the Dahej expansion.
Kochi Terminal
The planned regasification terminal at Kochi will have an initial installed capacity of 2.5MMTPA,which will later be expanded to 5.0MMTPA. Petronet has to yet award the EPC contract for thesame; we expect the plant to start commercial operations in 1QFY2013E. Supplies for theterminal have been contracted to the tune of 1.5MMTPA from Gorgon, Australia. PLL is trying toincrease the gas linkages for Kochi by sourcing additional gas from Exxon's 3.75MMTPA share ofthe Gorgon Project.
For Dahej, PLL has a GSPAwith GAIL, IOC and BPCL andsells R-LNG to them in theratio of 60:30:10, respectively
PLL expanded its Dahejcapacity to 11.5MMTPA at theend of 1QFY2010
Kochi Terminal is expected tostart commercial operations in1QFY2013E
5January 30, 2008 For Private Circulation Only - Sebi Registration No : INB 010996539July 22, 2009 For Private Circulation Only - Sebi Registration No : INB 010996539 5
Petronet LNG
Oil & Gas
Source: Company, Angel Research
Exhibit 3: Terminals and CapexTerminal Capacity Project cost Cost/tonne Status
(MMTPA) (Rs cr)
Dahej 5.0 2,100 4,200
Operational Dahej De-bottlenecking 1.5
Dahej Expansion 5.0 1,550 3,100 June-09
Total Dahej 11.5 3,650 3,174
Kochi Terminal 5.0 4,000 8,000 1QFY13E
Total 16.50 7,650 4,636
Industry Scenario
Domestic demand-supply scenario
Gas accounts for 9% of the total energy mix of India, as against the international average of 22%.The lower share of gas in the energy matrix could be explained by the huge gas deficits, which, inturn, could be attributed to stagnant domestic production along with a reluctance to pay a higherprice for imported gas. Moreover, the current high demand-supply gap has been fuelled byartificially low prices set by the government.
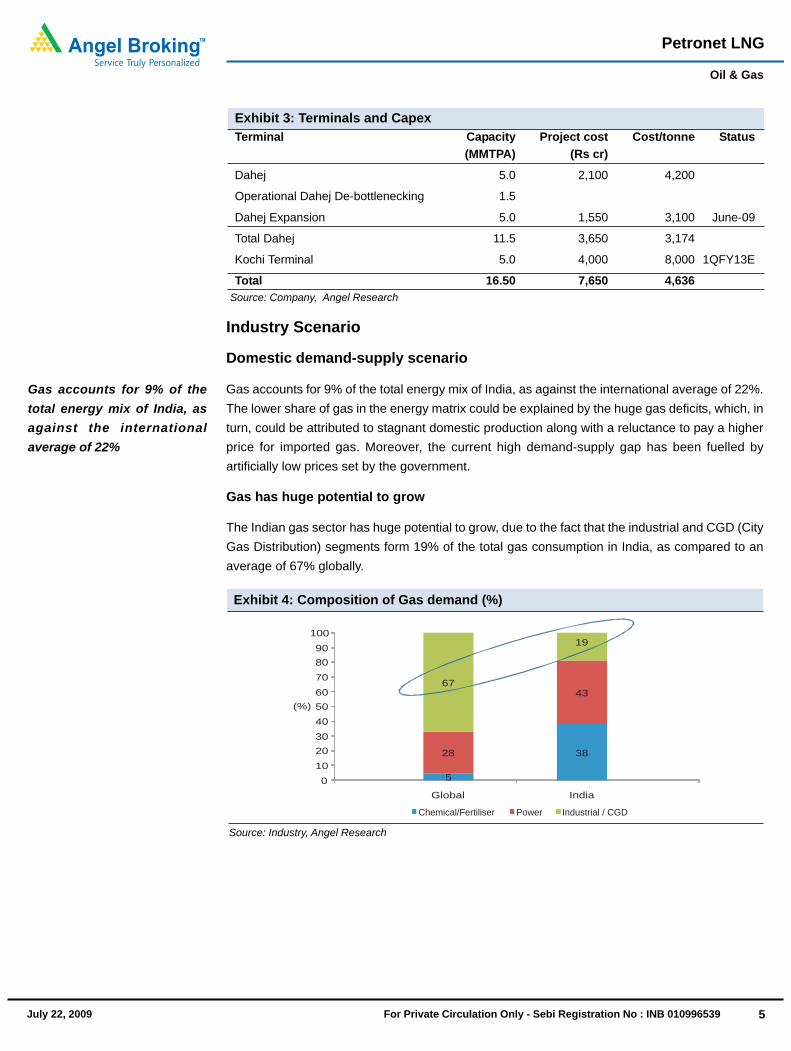
Gas has huge potential to grow
The Indian gas sector has huge potential to grow, due to the fact that the industrial and CGD (CityGas Distribution) segments form 19% of the total gas consumption in India, as compared to anaverage of 67% globally.
Source: Industry, Angel Research
Exhibit 4: Composition of Gas demand (%)
0
10
20
30
40
50
60
70
80
90
100
Chemical/Fertiliser Power Industrial / CGD
5
3828
4367
19
Global India
(%)
Gas accounts for 9% of thetotal energy mix of India, asagainst the internationalaverage of 22%

6January 30, 2008 For Private Circulation Only - Sebi Registration No : INB 010996539July 22, 2009 For Private Circulation Only - Sebi Registration No : INB 010996539 6
Petronet LNG
Oil & Gas
Demand of gas
The future gas demand is contingent on various factors such as gas pricing, infrastructuredevelopment, supply visibility and the regulatory environment. Of these, the two major factorsaffecting demand projections are gas pricing (alternative fuel economies) and development of thegas infrastructure. These are the reasons due to which the potential demand and the actualdemand would tend to vary. The wide variation in demand estimates by various agencies can alsobe attributed to these factors. The demand estimate for FY2012 as per the Integrated EnergyPolicy stands at 181MMSCMD, while the same as per the Hydrocarbon Vision 2025 is313MMSCMD. Moreover, the Working Group for the Eleventh Plan estimates that gas demandwill increase from 179MMSCMD in FY2008 to 279MMSCMD in FY2012, reflecting a widefluctuation in projections.
Given the huge dependence on the import of crude oil (80% of the total requirement), there issignificant potential for replacement led gas demand. The charts, as given below, show therequirement of gas with and without liquid fuel replacement. If one has to assume 50% liquid fueldisplacement, the gas demand estimate for FY2008 doubles; moreover, a 75% liquid fueldisplacement assumption doubles the gas demand projection for FY2012. Thus, the growthpotential for gas seems to be fairly bright, more so in light of a surge in domestic supplies.
Source: Industry, Angel Research
Exhibit 5: Demand on account of crude replacement
Power Fertiliser Ind./Other Total
74
148
41
7958
79
173
306
0
50
100
150
200
250
300
350
2007-08 2011 -12E
MM
SC
MD
Additional Demand Total Demand
MM
SC
MD
109
181
272 272282
354
445
579
0
100
200
300
400
500
600
700
30% 50% 75% 75%
-2007 08 -2011 12E
Source: Crisil, Angel Research; Note: E: Estimate, P: Projected
Exhibit 6: Demand of Natural Gas in India (MMSCMD)Demand 2008-09E 2009-10P 2010-11P 2011-12P 2012-13P 2013-14P CAGR %
Power 61.4 72.5 75.1 75.2 81.1 83.2 6Fertiliser 37.0 38.6 40.1 44.3 47.2 52.9 7Captive Power 12.4 14.2 16.3 19.1 21.9 25.0 15CGD 9.1 11.4 15.3 18.8 24.8 32.2 29Refinery 8.3 10.5 10.6 11.6 13.5 13.6 10Petrochemicals 6.7 6.7 6.7 6.7 11.3 11.3 11Sponge iron 4.4 5.0 6.2 7.4 7.6 7.7 12Total demand 139.3 158.9 170.3 183.1 207.4 225.9 10
The future gas demand iscontingent on various factorssuch as gas pricing,infrastructure development,supply visibility and theregulatory environment

7January 30, 2008 For Private Circulation Only - Sebi Registration No : INB 010996539July 22, 2009 For Private Circulation Only - Sebi Registration No : INB 010996539 7
Petronet LNG
Oil & Gas
RIL's KG-D6 along with rising firm LNG supplies to double gas supply
RIL has recently commenced gas production in its KG-D6 block. This field and its satellite fieldsare expected to produce close to 100MMSCMD by FY2013E. The production at KG-D6 is likely tobe followed by production at NEC. GSPL and ONGC are also likely to commence gas productionfrom the KG basin.
Source: Crisil, Angel Research; Note: E: Estimate, P: Projected
Exhibit 7: Supply of Natural Gas in India (MMSCMD)Supply 2008-09E 2009-10P 2010-11P 2011-12P 2012-13P 2013-14P CAGR%
ONGC 51.0 44.9 38.9 37.2 37.3 41.4 (4)
OIL 5.1 5.1 5.1 5.1 5.1 5.1 (0)
RIL (new discoveries) - 30.4 70.0 80.0 84.0 106.0 37
GSPC (new discoveries) - - - 3.4 4.8 5.6 28
PMT (existing fields) 13.8 14.5 14.6 14.5 14.4 14.4 1
Others (existing fields) 4.4 4.1 3.8 3.6 3.4 3.2 (6)
LNG (Firm contracts) 18.8 23.4 28.1 28.1 28.1 29.5 9
CBM 0.1 NA NA NA NA 10.0 151
Total Supply 93.2 122.4 160.5 171.9 177.1 215.2 18
RIL's KG-D6 and its satellitefields are expected to produceclose to 100MMSCMD byFY2013E
8January 30, 2008 For Private Circulation Only - Sebi Registration No : INB 010996539July 22, 2009 For Private Circulation Only - Sebi Registration No : INB 010996539 8
Petronet LNG
Oil & Gas
Investment Concerns
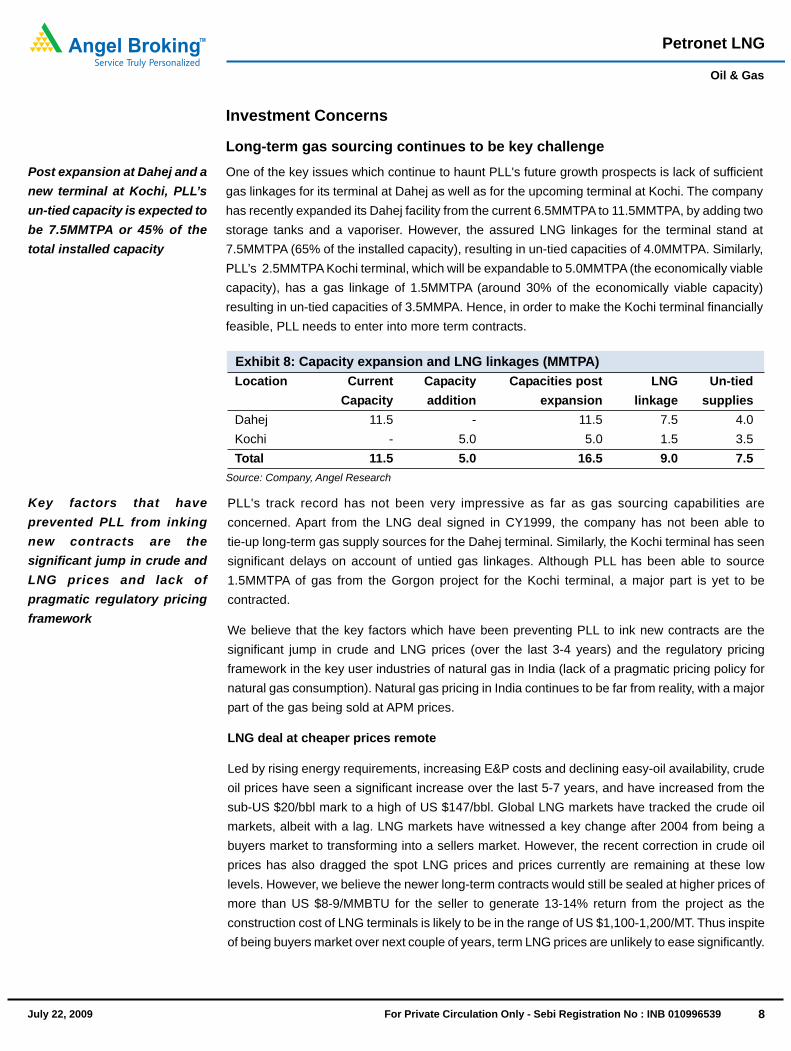
Long-term gas sourcing continues to be key challengeOne of the key issues which continue to haunt PLL's future growth prospects is lack of sufficientgas linkages for its terminal at Dahej as well as for the upcoming terminal at Kochi. The companyhas recently expanded its Dahej facility from the current 6.5MMTPA to 11.5MMTPA, by adding twostorage tanks and a vaporiser. However, the assured LNG linkages for the terminal stand at7.5MMTPA (65% of the installed capacity), resulting in un-tied capacities of 4.0MMTPA. Similarly,PLL’s 2.5MMTPA Kochi terminal, which will be expandable to 5.0MMTPA (the economically viablecapacity), has a gas linkage of 1.5MMTPA (around 30% of the economically viable capacity)resulting in un-tied capacities of 3.5MMPA. Hence, in order to make the Kochi terminal financiallyfeasible, PLL needs to enter into more term contracts.
PLL's track record has not been very impressive as far as gas sourcing capabilities areconcerned. Apart from the LNG deal signed in CY1999, the company has not been able totie-up long-term gas supply sources for the Dahej terminal. Similarly, the Kochi terminal has seensignificant delays on account of untied gas linkages. Although PLL has been able to source1.5MMTPA of gas from the Gorgon project for the Kochi terminal, a major part is yet to becontracted.
We believe that the key factors which have been preventing PLL to ink new contracts are thesignificant jump in crude and LNG prices (over the last 3-4 years) and the regulatory pricingframework in the key user industries of natural gas in India (lack of a pragmatic pricing policy fornatural gas consumption). Natural gas pricing in India continues to be far from reality, with a majorpart of the gas being sold at APM prices.
LNG deal at cheaper prices remote
Led by rising energy requirements, increasing E&P costs and declining easy-oil availability, crudeoil prices have seen a significant increase over the last 5-7 years, and have increased from thesub-US $20/bbl mark to a high of US $147/bbl. Global LNG markets have tracked the crude oilmarkets, albeit with a lag. LNG markets have witnessed a key change after 2004 from being abuyers market to transforming into a sellers market. However, the recent correction in crude oilprices has also dragged the spot LNG prices and prices currently are remaining at these lowlevels. However, we believe the newer long-term contracts would still be sealed at higher prices ofmore than US $8-9/MMBTU for the seller to generate 13-14% return from the project as theconstruction cost of LNG terminals is likely to be in the range of US $1,100-1,200/MT. Thus inspiteof being buyers market over next couple of years, term LNG prices are unlikely to ease significantly.
Post expansion at Dahej and anew terminal at Kochi, PLL’sun-tied capacity is expected tobe 7.5MMTPA or 45% of thetotal installed capacity
Exhibit 8: Capacity expansion and LNG linkages (MMTPA)Location Current Capacity Capacities post LNG Un-tied
Capacity addition expansion linkage suppliesDahej 11.5 - 11.5 7.5 4.0Kochi - 5.0 5.0 1.5 3.5Total 11.5 5.0 16.5 9.0 7.5
Source: Company, Angel Research
Key factors that haveprevented PLL from inkingnew contracts are thesignificant jump in crude andLNG prices and lack ofpragmatic regulatory pricingframework

9January 30, 2008 For Private Circulation Only - Sebi Registration No : INB 010996539July 22, 2009 For Private Circulation Only - Sebi Registration No : INB 010996539 9
Petronet LNG
Oil & Gas
Source: BP Statistical Review 2009, Angel Research
Exhibit 9: Japanese LNG prices (on CIF basis) and Crude Oil prices
0.0
2.0
4.0
6.0
8.0
10.0
12.0
14.0
CY
1986
CY
1988
CY
1990
CY
1992
CY
1994
CY
1996
CY
1998
CY
2000
CY
2002
CY
2004
CY
2006
CY
2008
US
$/m
mbtu
0.0
20.0
40.0
60.0
80.0
100.0
120.0
140.0
160.0
Ja
n-0
0
Ju
l-0
0
Ja
n-0
1
Ju
l-0
1
Ja
n-0
2
Ju
l-0
2
Ja
n-0
3
Ju
l-0
3
Ja
n-0
4
Ju
l-0
4
Ja
n-0
5
Ju
l-0
5
Ja
n-0
6
Ju
l-0
6
Ja
n-0
7
Ju
l-0
7
Ja
n-0
8
Ju
l-0
8
Ja
n-0
9
Ju
l-0
9
US
$/b
bl
There are various other indicators that also point towards higher price for long-term contractsincluding delays in construction of liquefaction terminals, straight-line pricing of new LNG dealswith high crude linkages (instead of earlier S-curve-based pricing), efforts by European countriesto diversify energy sources (particularly gas), upcoming supplies being tied to various destinationsand increased environmental awareness (Kyoto Protocol). Thus, we believe that long-term pricesfor LNG are also likely to remain strong. Thus, signing any contract below 13-13.5% parity to crudeoil prices appears highly unlikely. PLL's moves also reflect higher prices are likely to persist for thelong-term contracts, which would result in unaffordable prices for the Indian consumer. Hence,PLL has been constantly attempting to secure gas at cheaper prices including considering a stakesale to RasGas and a potential stake purchase in a gas producing field overseas (particularly inAustralia).
We believe that term gas sourcing at higher prices would adversely impact PLL's regasificationmargins and significantly increase marketing risks associated with the high cost LNG. This is becausethe increase in gas-to-gas competition is likely to exert pressure on successful placement ofhigh-cost LNG in the country.
Dependence on Spot Sales to increase
As a result of high long-term LNG prices, PLL’s dependence on spot-sales mechanism is likely toincrease. We remain concerned about the placement of significant spot volumes in the Indianmarkets especially in light of the increasing domestic supplies. Crisil also estimates a major part ofthe merchant (spot) LNG capacity to remain idle on account of the significant surge in domesticgas production. Crisil estimates R-LNG capacity in India to expand to 22.6MMTPA by CY2014.However, after considering the firm supplies of 9.0MMTPA (7.5MMTPA at PLL’s Dahej terminaland 1.5MMTPA at Kochi), the spot-based R-LNG capacity in the country would be 13.6MMTPA.However, the domestic gas deficit, after considering firm LNG supplies, will be closer to10.8MMSCMD (around 3.0MMTPA). This reflects capacity utilisation of close to 21% for spotR-LNG capacity to meet the deficit. We are skeptical about the full utilisation of PLL’s recentlyexpanded Dahej Terminal, on account of unaffordable strong LNG prices coupled with un-tiedcapacities (dependent on spot LNG).
Term Gas sourcing at higherprices would adversely impactPLL's regasification marginsand significantly increasemarketing risks associatedwith the high cost LNG
Crisil anticipates capacityutilisation of close to 21% forspot R-LNG capacity in thecountry by CY2014E

10January 30, 2008 For Private Circulation Only - Sebi Registration No : INB 010996539July 22, 2009 For Private Circulation Only - Sebi Registration No : INB 010996539 10
Petronet LNG
Oil & Gas
In spite of these concerns we are building in a strong capacity utilisation of 91% for PLL’s Dahejfacility in our long-term estimates (7.5MMTPA from RasGas, plus 1.5MMTPA for Pragati PowerCorporation, and the balance 1.5MMTPA on a spot/tolling basis). This is 3.0MMTPA higher thanthe company’s current linkages. However, as PLL has inked a contract to supply 1.5MMTPA toPragati Power Corporation (PPCL), we are assuming that the company will ink newer contracts forPPCL’s requirements. Similarly, for the Kochi terminal we are building in utilisation of 75%(3.75MMTPA) in the long term on the back of firm supplies of 2.5MMTPA and the balance1.25MMTPA on a spot basis. This is 2.25MMTPA higher than the company’s current linkages forthe terminal. We are anticipating additonal 1.0MMTPA from the Gorgon Project. Hence, thereexists a downward risk to our estimates if the company is unable to sign additional contracts asexpected.
Reducing Profitability of Spot LNG business
PLL has been able to report strong numbers over the last few years due to a healthy demand forspot cargoes, which it has been importing since 2QFY2007. There was a shortage of gas to thetune of 95MMSCMD before commencement of KG-D6 production and the gas-stranded assetshad the option to either run on naphtha or Spot LNG. With the large price differential of around US$5.0/MMBTU between Spot LNG and energy-equivalent crude oil prices, users opted for SpotLNG. Thus, in case of crude at around US $75/bbl, PLL procured spot cargoes at aroundUS $8/MMBTU against the crude parity prices of US $12.9/MMBTU leading to savings of aroundUS $5/MMBTU for the purchaser.
Source: Industry
Exhibit 11: Unmet demand of gas prior to KG-D6 production (MMSCMD)Particulars AP Maharashtra Gujarat HVJ TotalPower 9.1 13.0 9.4 6.0 37.5Fertilizer 3.1 3.9 2.6 15.1 24.7Industrial + CGD 1.8 6.5 18.6 6.3 33.2Total 14.0 23.4 30.6 27.4 95.4
Source: Crisil, Angel Research; Note: E: Estimate, P: Projected
Exhibit 10: Increasing R-LNG capacity in India
PLL, Dahej Shell, Hazira RGPPL, Dabhol PLL, Kochi Total
24.443.1 43.1 43.1 43.1 43.1
13.5
13.5 13.5 13.5 13.5 13.5-
3.8 7.5 7.5 7.518.8
-
- - - -
9.4
37.9
60.464.1 64.1 64.1
84.8
0.0
20.0
40.0
60.0
80.0
100.0
120.0
140.0
160.0
180.0
2008-09E 2009-10P 2010-11P 2011-12P 2012-13P 2013-14P
MM
SC
MD
We are building in a strongcapacity utilisation of 91% forPLL’s Dahej facility and 75%for the Kochi facility on theback of expectations of newerLNG contracts
The significant increase indomestic production and theGUP are likely to fulfill gasshortages pertaining togas-stranded assets

11January 30, 2008 For Private Circulation Only - Sebi Registration No : INB 010996539July 22, 2009 For Private Circulation Only - Sebi Registration No : INB 010996539 11
Petronet LNG
Oil & Gas
However, things are likely to change with expected surge in domestic gas production and the GasUtilisation Policy (GUP), which provides preference to existing users for incremental gas.
The significant increase in domestic production and the GUP are likely to fulfill gas shortagespertaining to gas-stranded assets. This, in turn, is likely to keep a check on the flow of significantspot volumes to Indian shores.
Implications of slowdown in Spot cargo business
The spot cargo business has been extremely profitable for PLL as in addition to regasificationmargins, PLL had been earning trading (marketing) margins of around Rs16/MMBTU (equivalentto 60.5% of regasification margins in FY2007), Rs21/MMBTU (equivalent to 75.6% of regasificationmargins in FY2008) and Rs30/MMBTU (equivalent to 102% o f regasification margins in FY2009)on sale of spot volumes apart from the term contracts. Moreover, PLL benefits from operatingleverage from the procurement of spot cargoes, as its fixed cost of operations gets amortised overthe larger volumes. Hence, pressure on Marketing margins of Spot cargo business will adverselyimpact PLL’s Profitability.
We have built in the absence of marketing margins on spot volumes from FY2012. This is largelya factor of gas-to-gas competition, coupled with the increasing R-LNG capacity in the country.Thus, the margin profile on the term as well as the spot volumes will be similar, going forward.
Source: Company, Angel Research
Exhibit 13: Break-up of EBITDA
92%82% 80%
8%18% 20%
0%
20%
40%
60%
80%
100%
120%
FY2007 FY2008 FY2009
Core EBITDA EBITDA from marketing margins
The spot cargo business hasbeen extremely profitable forPLL as in addition toregasification margins, PLLhad been earning marketingmargins
We have built in the absenceof marketing margins on spotvolumes from FY2012
Source: Company, Angel Research
Exhibit 12: Gas Utilisation Policy (Priority order)
Existing plants and their Expansionprojects (Priority 1) Green-field projects (Priority 2)

12January 30, 2008 For Private Circulation Only - Sebi Registration No : INB 010996539July 22, 2009 For Private Circulation Only - Sebi Registration No : INB 010996539 12
Petronet LNG
Oil & Gas
Likely freeze on Dahej regasification margins to impact netback
PLL's current regasification margins for the Dahej terminal are quite steep. We believe that thecompany's underlying business akin to a utility has a low-risk profile. Hence, its current regasificationmargins reflect an unregulated business in a monopolistic market. Moreover, comparing PLL’sRoE with other power utilities, which earn 14% RoE, the company’s Earnings are much higherthan the envisaged Margins. Prior to construction of the Dahej terminal, PLL’s regasification marginswere fixed at Rs23.7/MMBTU (around US $0.5/MMBTU) for CY2004, and as per the arrangement,margins were provided with 5% annual escalation.
However, we believe that the perpetual 5% increase in regasification margins will not continuegoing ahead. There are several reasons that indicate review of these Margins is warranted.
Increasing Marketing risks: PLL's regasification margins were fixed at Rs23.7/MMBTU (aboutUS $0.50/MMBTU) for CY2004 to ensure 16% equity IRR from the project. This was based on aconstruction cost of Rs2,500cr for 5.0MMTPA terminals at Dahej. However, the actual capex forthe terminal turned out to be much lower at Rs2,100cr. Thus, against the anticipated capital cost ofconstruction of Rs5,000/tonne, actual cost stood lower at Rs4,200/tonne (a saving of 16%). Savingswere largely due to non-commissioning of the break-water facility. However, some part of thecapex was allocated to building an additional tank at the facility to ensure smooth functioning. Thisexpansion ultimately led to an increase in the effective capacity to 6.5MMTPA (further bringingdown the capital cost per tonne to Rs3,230/tonne, a whopping 34.4% lower than the anticipatedcapex). Thus, in spite of the significant savings in capex, PLL's regasification margins were leftuntouched. Therefore, even though being in a utility business, PLL has been able to garner higherRoE of more than 25%, which is much higher than the 16% planned at the inception of the terminal.
We believe non-revision of the regasification margins in spite of benefits of scale could be attributedto the following:
Lower marketability risks for fixed volumes (5MMTPA) at fixed prices.
Stagnant domestic gas production leading to huge deficit for gas.
Affordable gas prices (which were in line with prices of PMT - US $4.8/MMBTU and Ravvaprices - US $4.3/MMBTU); hence, market conditions allowed higher regasification margins tobe passed on.
Higher regasification charges were allowed to meet PLL's capex requirement.
Higher profitability also improved value of off-takers or marketers, as they themselves hold12.5% stake each in the company.
Pertinently, PLL’s regasification margins are impacted by the marketing risks and the marketforces (demand and supply of gas). Changing market forces in the form of an increase ingas-to-gas competition, a significant increase in domestic gas supplies, and the end of fixed pricingof the RasGas contract (post CY2008) are likely to exert pressure on regasification marginsgoing ahead.
We believe that the perpetual5% increase in regasificationmargins will not continuegoing ahead
Changing market forces in theform of an increase in gas-to-gas competition, a significantincrease in domestic gassupplies, and the end of fixedpricing of the RasGas contract(post CY2008) are likely toexert pressure onregasification margins goingahead

13January 30, 2008 For Private Circulation Only - Sebi Registration No : INB 010996539July 22, 2009 For Private Circulation Only - Sebi Registration No : INB 010996539 13
Petronet LNG
Oil & Gas
In FY2012E, we expect RIL's gas price (assumed at Dahej) is likely to be aroundUS $5.5/MMBTU, even lower than the likely FOB price of RasGas (US $6.1/MMBTU). Thus, anoverhaul of the complete R-LNG value chain will be the order of the day, if the LNG businessmodel is to sustain in India. This will involve a reduction in custom duty and in the regasificationmargins on the volumes processed. The overhaulable component is likely to form 13.1% of PLL'sselling price equivalent to around 17.4% of RIL's assumed delivery price at Dahej in FY2012E.Thus, given the high overhaulable component, there exists strong possibility ofreduction in the regasification margins.
Exhibit 15: R-LNG value chain overhaul need of the hour
Source: Company, Angel Research
Particulars ( US $/mmbtu) FY2007 FY2008 FY2009 FY2010E FY2011E FY2012E FY2013EFOB price 2.53 2.53 3.08 3.87 5.00 6.11 7.17Transit insurance 0.002 0.002 0.002 0.002 0.002 0.002 0.002Shipping price 0.26 0.26 0.26 0.26 0.26 0.26 0.26Price on the import terminal 2.79 2.79 3.34 4.13 5.27 6.37 7.43Import duty 0.14 0.14 0.17 0.21 0.27 0.33 0.38Landed cost of the gas 2.94 2.94 3.51 4.35 5.54 6.70 7.81Regasification margins 0.58 0.69 0.63 0.63 0.63 0.63 0.63Selling price for PLL 3.52 3.63 4.15 4.98 6.17 7.33 8.44Import duty as % of PLL's selling price 4.08 3.97 4.15 4.28 4.40 4.48 4.53Regasification margins as % of total cost of gas 16.6 19.0 15.3 12.7 10.2 8.6 7.5Overhaulable component of the LNG valuechain (%) 20.7 23.0 19.4 16.9 14.6 13.1 12.0Overhaulable component as % of RIL's estimatedDelivery price at Dahej N.A N.A N.A 15.3 16.4 17.4 18.4
An overhaul of the completeR-LNG value chain will be theorder of the day, if the LNGbusiness model is to sustainin India
0.0
1.0
2.0
3.0
4.0
5.0
6.0
7.0
8.0
9.0
FY
2007
FY
2008
FY
2009
E
FY
2010
E
FY
2011
E
FY
2012
E
FY
2013
E
FY
2014
E
FY
2015
E
FY
2016
E
FY
2017
E
FY
2018
E
FY
2019
E
FY
2020
E
US
$/m
mbt
u
Source: Company, Angel Research
Exhibit 14: Dahej FOB price revision to increase Marketing risks

14January 30, 2008 For Private Circulation Only - Sebi Registration No : INB 010996539July 22, 2009 For Private Circulation Only - Sebi Registration No : INB 010996539 14
Petronet LNG
Oil & Gas
Regulatory interference: We expect the LNG terminal to be under the regulatory ambit of thePetroleum and Natural Gas Regulatory Board (PNGRB) in the future. The need for theregulation/margin determination stems from the fact that the company has been able to earnmargins which are equivalent to around 29% of ONGC's APM gas prices. Given PLL’s low riskprofile, these margins seem to be significantly higher. The margins also seem to be on the higherside compared to the company’s peers in other markets. The Italian energy regulator has fixedtariffs for LNG terminals in the country to allow a rate of return on the regulatory asset base equalto 7.6%, in real terms, before tax. Thus, the ideal RoCE likely to be fixed by the regulator forregasification in India should be 12-14% given the low risk involved in the business.
The LNG terminal tariff basically comprises the following - a fixed cost component, a variablecomponent and a security premium. Considering the fact that the fixed cost componentembedded in regasification charges tends to remain stable and forms a large part of the overalltariffs, chances of an increase in regasification margins on this front tends to be lower. From thevariable component perspective, since it forms around 60% of PLL's operating cost, we believean escalation of 5% seems unjustified, as the variable operating expenditure has grown at aCAGR of 2.1% over 2006-09.
Ideal RoCE likely to be fixed bythe regulator for regasificationin India should be 12-14%given the low risk involved inthe business
Hence, overall, we believe that considering the market compulsions and possible regulatoryinterference, escalation of regasification margins is likely to be terminated. Thus, a potential freezeof Dahej regasification margins and the increasing gas costs would result in lower netbackmargins for PLL. This is because the LNG boil-off losses will increase on account of higher gascosts and exert pressure on PLL’s operating margins. Thus, in a scenario of a freeze in regasificationmargins, going ahead, such higher boil-off losses would result in margin contraction forthe company.
In a scenario of a freeze inregasification margins, goingahead, higher boil-off losseswould result in operatingmargin contraction for thecompany
Source: Company, Angel Research; Note: Gross margins includes Regasification and Marketing margins
Exhibit 17: Gross and netback marginsFY2007 FY2008 FY2009 FY2010E FY2011E
Gross margins per MMBTU 28.1 32.6 34.8 31.2 31.0
Int consumption per MMBTU 1.8 1.9 2.0 4.2 4.7
Nebacks per MMBTU 26.3 30.7 32.9 27.0 26.3
Source: Angel Research
Exhibit 16: LNG terminal tariff structure

15January 30, 2008 For Private Circulation Only - Sebi Registration No : INB 010996539July 22, 2009 For Private Circulation Only - Sebi Registration No : INB 010996539 15
Petronet LNG
Oil & Gas
Kochi terminal a high-risk project
Apart from its existing terminal at Dahej, PLL is setting up a regasification terminal at Kochi. Webelieve that this a risky venture despite PLL sourcing 1.5MMTPA of gas for the terminal from theGorgon Project. The significant risks include:
Rising costs and delays in timely completion of the terminal: PLL has been planning thisterminal since FY2006. However, work on the terminal has not progressed much till date. In thepast, the project had been stuck due to various reasons such as allocation of land, signing of aconcessional agreement with the Kochi Port Trust, delays in obtaining environmental approvalsand lack of firm gas supplies for the project. The delay resulted in a significant increase in theconstruction costs. Tightness in the global EPC market and significant increase in metal pricesincresed costs from Rs2,200cr in FY2006 to Rs3,500cr (for 2.5MMTPA) currently, resulting in acapital cost of Rs14,000/tonne.
PLL expects the terminal to be commissioned in 2QFY2012E. We see an additional risk to thetimely commissioning of the Kochi terminal. PLL has awarded the contract for storage tanks atKochi to IHI, while the contracts for regasification and marine facilities are likely to be awardedshortly. Considering that it takes 42-44 months to construct such a terminal and that the constructionwork of the storage terminal began in July 2008 (by IHI), probability of completing the terminal by2QFY2012 appears difficult. We expect the terminal to be completed by the start of FY2013E.
Other things could also lead to further delays such as gas linkage. The terminal is dependent onGorgon for its gas supplies, which is unlikely to come up before CY2014E, thus requiring PLL toeither run the terminal in the interim period (between the commissioning of the terminal and thesupply of gas) on medium-term contracts and/or spot gas. However, given that it will be tough forPLL to sell the entire volume of gas on a spot basis, it could resort to further delaying commissioningof the terminal. Moreover, even if the project is commissioned, it could see a slower capacity rampup and a delay in commercial operations, as was the case with the recent capacity expansion atDahej. Any further delay in the Gorgon Project could also increase risks arising out of a mismatchbetween commissioning of the regasification terminal at Kochi and the liquefaction terminal atGorgon. This could impact the project dynamics significantly. Hence, there exists a significantexecution risks for PLL with respect to investment in the Kochi terminal.
Customer tie-ups, gas linkages and rising domestic gas supplies: Although PLL will initiallycome up with a capacity of 2.5MMTPA, economics require the expansion of the same to be5.0MMTPA. This is largely because the capital cost per tonne will see a significant reduction onaccount of the low cost expansion of the terminal. Expansion of the terminal from 2.5MMTPA to5MMTPA at the cost of Rs500cr will reduce the capital cost to Rs8,000/tonne fromRs14,000/tonne. The recent 1.5MMTPA GSPA with Gorgon forms just 30% of the viable projectsize and PLL needs to ink more term contracts to increase the visibility of the project.
Expansion of the terminal is contingent on gas linkages and customer tie-ups, which is in turndependent on affordable gas prices. Given the fact that terminal expansion will coincide with theexpected rise in domestic gas supplies (on account of the commencement of the KG-D6 fieldsand commencement of gas production from ONGC's KG basin fields), finding buyers for the moreexpensive imported LNG might be a difficult proposition. Moreover, with RIL also planning to
Tightness in the global EPCmarket and significantincrease in metal pricesincresed costs from Rs2,200crin FY2006 to Rs3,500cr (for2.5MMTPA) currently, resultingin a capital cost of Rs14,000/tonne
There exists a significantexecution risks for PLL withrespect to investment in theKochi terminal
The recent 1.5MMTPA GSPAwith Gorgon forms just 30% ofthe viable project size and PLLneeds to ink more termcontracts to increase thevisibility of the project

16January 30, 2008 For Private Circulation Only - Sebi Registration No : INB 010996539July 22, 2009 For Private Circulation Only - Sebi Registration No : INB 010996539 16
Petronet LNG
Oil & Gas
Project economics and regasification margins: Another important variable which will determinethe value accretion for PLL's shareholders will be the economic viability of the Kochi terminal,which lingers upon the regasification margins. PLL's Kochi terminal is likely to be completed witha huge total cost of Rs4,000cr (Rs3,500cr for the initial 2.5MMTPA and Rs500cr for the low costexpansion to 5MMTPA). This would translate into a capital cost of Rs8,000/tonne as againstRs3,174/tonne for the Dahej terminal's 11.5MMTPA (2.5 times higher). Thus, to generate normalisedpositive NPV for the project, PLL needs to charge high regasification margins to the tune of US$0.85-0.9/MMBTU (forming 20-21% of RIL's current selling price of US $4.2/MMBTU). In a scenariowhere LNG prices are relatively high compared to domestic gas prices, high regasification marginsonly add to the marketing risks associated with the placement of such expensive LNG.
establish its pipeline network in Southern India, we expect gas-to-gas competition to increase inthe future, which would make placement of expensive gas difficult. Thus, PLL not only needs moregas for the Kochi terminal, but also needs it at competitive prices. PLL has not disclosed the termsof the GSPA with Gorgon, including the price. However, we believe that the LNG prices shouldhave crude linkages of 13.5% (a premium of 0.85% over the current PLL contract with RasGas).The premium is justified considering that the Gorgon project is likely to see a substantial investmentoutlay of US $32bn, which in turn requires higher LNG linkages. This translates into a FOB LNGprice of US $6.75/MMBTU, even at crude oil prices of US $50/bbl. This is 61% higher than RIL'sselling price of US $4.2/MMBTU. Even if we were to assume an increase of 20% in RIL's gas costwhen the KG basin gas price is reviewed in CY2013E, the differential stands at 33.9%. If wecompare the effective landed cost of LNG along with regasification charges, the differential wouldbe significant compared to domestic LNG prices.
Source: Angel Research; Note: *Crude linkage of 13.5%
Exhibit 18: Scenario analysis - likely gas costs for PLL's Kochi terminalCrude price (US $/bbl) 40.0 50.0 60.0 70.0 80.0 90.0 100.0
FOB Australia* 5.4 6.8 8.1 9.5 10.8 12.2 13.5
Shipping 0.6 0.6 0.6 0.6 0.6 0.6 0.6
Transit Insurance 0.0 0.0 0.0 0.0 0.0 0.0 0.0
CIF India 6.0 7.4 8.7 10.1 11.4 12.8 14.1
Customs 0.3 0.4 0.4 0.5 0.6 0.7 0.7
Cost to PLL (US$/MMBTU) 6.3 7.7 9.2 10.6 12.0 13.4 14.8
We believe PLL’s LNG contactwitj Gorgon for Kochi Terminalto have crude linkages of13.5%
To generate normalisedpositive NPV for the project,PLL needs to charge highregasification margins to thetune of US $0.85-0.9/MMBTU

17January 30, 2008 For Private Circulation Only - Sebi Registration No : INB 010996539July 22, 2009 For Private Circulation Only - Sebi Registration No : INB 010996539 17
Petronet LNG
Oil & Gas
Risks to our Argument
Lower-than-expected domestic gas supplies: We are expecting domestic gas production tomore than double by FY2011E, which would increase the gas-to-gas competition. However, if theactual supplies turn out to be lower than anticipated, then the case of continuing high LNG importsin general, and spot LNG in particular, could continue longer than anticipated. On the other hand,if the supplies are higher than our estimates, it will adversely impact the demand of spot LNG inthe country.
LNG deal at affordable prices for untied capacities: Barring LNG deal with Rasgas (Qatar),PLL has not been successful in securing term LNG contracts for the Dahej terminal. Against theexpected installed capacity of 11.5MMTPA at Dahej, PLL has supplies to the tune of 7.5MMTPA,resulting in untied capacity of 4.0MMTPA. Similarly, it also needs to secure additional 3.5MMTPAfor the Kochi terminal. If PLL is able to secure the LNG at affordable prices, it would act as apositive catalyst for the stock. We are building in 91% utilisation at Dahej (10.5MMTPA) fromFY2012, and 75% utilisation at Kochi (3.5MMTPA) from FY2014. Hence, we are building in newcontracts being signed by the company. Any additional volumes by PLL, over and above ourestimates, could act as a catalyst for its stock price.

18January 30, 2008 For Private Circulation Only - Sebi Registration No : INB 010996539July 22, 2009 For Private Circulation Only - Sebi Registration No : INB 010996539 18
Petronet LNG
Oil & Gas
Revenues up a whopping58.7% Volumes increase 26.7%
1QFY2010 Performance
Petronet LNG reported flat performance for the quarter ended 1QFY2010. The company'sTop-line for the quarter grew by a substantial 58.7% yoy, even as Bottom-line registered a marginaldecline of 2.2%. The overall subdued performance by the company could largely be attributed tothe losses on spot cargoes despite strong volume growth witnessed during the quarter.
PLL's 1QFY2010 Revenues spiked 58.7% yoy to Rs2,612cr (Rs1,646cr) following 26.7% yoyincrease in volumes and around 16.0% yoy Rupee depreciation. PLL's R-LNG volumes increasedby 26.7% yoy to 98.8TBTUs (78.0TBTUs) during 1QFY2010, which was above our expectation of85.0TBTU. Sequentially, volumes were up 19.8% (82.5TBTUs in 4QFY2009). Volumes increasedon the back of higher-than-expected spot volumes during the quarter. PLL volumes also includedtolling volumes to GSPC for processing 1 cargo (2.95TBTU).
PLL's OPMs during the quarter contracted by 469bp yoy to 7.0% (11.7%) on account of marketinglosses on imported spot cargoes. PLL's Netback during the quarter stood at Rs21.1/TBTU (Rs28.6/TBTU); registering a decline of 26.2% yoy. We believe PLL earned a marginal blended profitabilityof Rs3.7/TBTU on the spot cargoes. This was largely on account of marketing loss on the spotcargoes, which we estimate to be around Rs80cr during the quarter, which led to reduction in theoverall netback for the quarter. While the company has booked spot cargoes at the higher price, itwas made to sell the same at the lower price on account of reduction in the LNG prices. Cost ofgoods sold increased by 68.8% yoy primarily because of higher LNG imports coupled with Rupeedepreciation and increase in gas cost for the fixed contract (RasGas contract). FOB price of thefixed contract with RasGas has started increasing following commencement of indexation with theJCC crude prices from January 2009, which has seen FOB prices increasing to US $3.5/mmbtufrom US $2.53/mmbtu during the quarter. The company's Staff costs increased 5.9% yoy, whileother expenditure fell 9.5% yoy. Operating Profit during the quarter stood lower at Rs182cr (Rs192cr)registering a decline of 5.2% yoy.
PLL's OPMs during the quartercontracted by 469bp yoy to7.0% (11.7%) on account ofmarketing losses on importedspot cargoes
Source: Company, Angel Research
Exhibit 19: R-LNG Volume Break-up
63.2 62.467.5
60.364.2 64.0
61.058.3
61.0
67.8
60.163.0 62.7
3.28.6
12.0 13.1 14.519.2 19.0
21.617.0
7.2
25.019.5
33.1
0.0
10.0
20.0
30.0
40.0
50.0
60.0
70.0
80.0
Q1F
Y20
07
Q2F
Y20
07
Q3F
Y20
07
Q4F
Y20
07
Q1F
Y20
08
Q2F
Y20
08
Q3F
Y20
08
Q4F
Y20
08
Q1F
Y20
09
Q2F
Y20
09
3QF
Y20
09
4QF
Y20
09
Q1F
Y20
10
TB
TU
s
Contracted LNG Sales in TBTUs Spot cargo sales in TBTUs (Incl. RGPPL Gas)

19January 30, 2008 For Private Circulation Only - Sebi Registration No : INB 010996539July 22, 2009 For Private Circulation Only - Sebi Registration No : INB 010996539 19
Petronet LNG
Oil & Gas
Depreciation for the quarter remained flat at Rs26cr (Rs26cr) due non-capitalisation of the expandedDahej regasification terminal. Interest cost increased 13.0% yoy to Rs28cr (Rs25cr). Other incomeduring the quarter spiked 73.2% yoy, which restricted the decline in Bottom-line, which fell 2.2% toRs103cr. PAT was in line with our expectation of Rs103cr.
Source: Company, Angel Research
Operating Profit Operating margins (RHS)
12.8
10.5 11.0
12.913.2
12.8
14.7
12.311.7
11.0
7.5
12.9
7.0
6.0
7.0
8.0
9.0
10.0
11.0
12.0
13.0
14.0
15.0
16.0
0
50
100
150
200
250
300
350
400
1Q
FY
20
07
2QF
Y2
00
7
3QF
Y2
00
7
4Q
FY
20
07
1QF
Y2
00
8
2QF
Y2
00
8
3QF
Y2
00
8
4Q
FY
20
08
1QF
Y2
00
9
2QF
Y2
00
9
3Q
FY
20
09
4Q
FY
20
09
1Q
FY
20
10
%
Rs
cr
Exhibit 20: Operating Margins
Particulars 1QFY07 2QFY07 3QFY07 4QFY07 1QFY08 2QFY08 3QFY08 4QFY08 1QFY09 2QFY09 3QFY09 4QFY09 1QFY10
Realisation (per TBTU) 154 194 198 210 197 201 197 219 211 221 291 322 272
Raw material cost (per TBTU) 129 170 172 180 167 172 164 188 182 192 265 273 251
Netback margins (per TBTU) 24.90 23.93 26.20 29.84 29.97 28.92 32.63 31.40 28.56 28.45 25.32 48.70 21.08
Source: Company, Angel Research
Exhibit 21: Performance in the recent past
Exhibit 22: 1QFY2010 Performance Y/E March (Rs cr) 1QFY2010 1QFY2009 %chg FY2009 FY2008 %chg Net Sales 2,612 1,646 58.7 8,429 6,555 28.6 COGS 2,402 1,423 68.8 7,376 5,566 32.5 Other operating expenditure 29 31 (7.6) 152 123 23.6 EBITDA 182 192 (5.2) 901 866 4.1 EBITDA Margin (%) 7.0 11.7 10.7 13.2 Other Income 29 17 73.2 77 54 42.8 Depreciation 26 26 0.3 103 102 0.3 Interest 28 25 13.0 101 102 (1.1) PBT 157 158 (0.7) 774 715 8.2 PBT Margin (%) 6.0 9.6 9.2 10.9 Total Tax 53 52 2.3 256 241 6.3 % of PBT 34.1 33.0 33.0 33.6 PAT 103 106 (2.2) 518 475 9.2 PAT Margin (%) 4.0 6.4 6.2 7.2
Source: Company, Angel Research
PAT decline restricted by73.2% yoy spike in OtherIncome

20January 30, 2008 For Private Circulation Only - Sebi Registration No : INB 010996539July 22, 2009 For Private Circulation Only - Sebi Registration No : INB 010996539 20
Petronet LNG
Oil & Gas
Higher Volume, increasing Gas cost to increase Revenues
PLL has registered a volume growth of 5.3% CAGR over FY2007-09, backed by an increase inspot volumes, which helped fully utilise the increased capacity created fromde-bottlenecking (from 5MMTPA to 6.5MMTPA). We expect the company to register a 26.4%CAGR in volumes over FY2009-11E as from 3QFY2010, new contracts of 2.5MMTPA will startflowing in and whose full effect will be seen in FY2011. These new contract of 2.5MMTPA arebeing tied-up for the capacity expansion of 5MMTPA (from 6.5MMTPA to 11.5MMTPA), which tookplace in January 2009. Volume growth will also be supported by an increase in spot LNG purchasesto utilise the expanded capacity. In FY2010E and FY2011E, we have factored in 77% and 89%capacity utilisation, respectively.
Financial Analysis
After witnessing a strong growth in profitability over the years, the scenario seems to be changingfor PLL going forward, with a slowdown expected in its earnings growth. Our key operatingassumptions over the next few years are as follows:
Exhibit 23: Key Operating Assumptions
Source: Company, Angel Research
Particulars FY2008 FY2009 FY2010E FY2011E
Rs/USD 40.3 46.0 48.0 46.0
Installed capacity (Yr .end) MMTPA 6.5 6.5 11.5 11.5Installed capacity (Yr .end) TBTU 331.4 331.4 586.3 586.3Total volumes processed (TBTU) 326.9 325.5 450.3 520.3Fixed contract (Rasgas) 247.2 251.8 251.8 251.8Fixed contract (Rasgas Tranche 'A') - - 52.5 125.9Spot/medium term contracts 74.8 68.7 139.1 134.6
Internal Consumption 5.0 5.0 6.8 7.9Total Volumes processed (MMTPA) 6.4 6.4 8.8 10.2Effective capacity utilisation 99% 98% 77% 89%Regasification charges (Rs per mmbtu) 27.8 29.2 30.2 30.2Marketing margins (Rs per mmbtu) 21.0 29.7 3.0 3.0
We expect the company toregister a 26.4% CAGR inVolumes over FY2009-11E
Source: Company, Angel Research
Exhibit 24: Sales Volume Trend
17.6%
10.9%
(0.4%)
38.4%
15.5%
(5)
0
5
10
15
20
25
30
35
40
45
0
100
200
300
400
500
600
FY2007 FY2008 FY2009 FY2010E FY2011E
%
TB
TU
Sales volume Sales volume growth (RHS)

21January 30, 2008 For Private Circulation Only - Sebi Registration No : INB 010996539July 22, 2009 For Private Circulation Only - Sebi Registration No : INB 010996539 21
Petronet LNG
Oil & Gas
PLL posted revenue CAGR of 23.7% during FY2007-09, on the back of an increase in realisationsand higher volumes. Going ahead, we expect the company to post a CAGR of 43.3% in revenuesover FY2009-11E, on the back of higher volumes and increase in realisations. Higher volumes willbe on account of the 2.5MMTPA fixed contract volume flow from Qatar, from 3QFY2010, andhigher spot volumes, whereas realisations will increase on account of a pass-through of increasein the gas cost, which has been linked to the JCC price from January 2009.
Source: Company, Angel Research
Exhibit 25: Revenue Trend
43.6%
19.0%
28.6 %
59.0%
29.2%
0
10
20
30
40
50
60
70
0
2,000
4,000
6,000
8,000
10,000
12,000
14,000
16,000
18,000
20,000
FY2007 FY2008 FY2009 FY2010E FY2011E
Rs
cr
%
Freeze on regasification margins to put pressure on OPM
Petronet's regasification margins have increasingly being under the lens of the various stakeholders,due to the high RoE earned by the company. GAIL had also raised its voice against PLL's highRoE to the Petroleum Ministry, asking for a reduction in the margins earned by the company. Webelieve that external factors, as well as rising costs and market compulsions, could lead to areduction in the regasification margins earned by the company. Hence, we are factoring in a freezein regasification margins from FY2011. Similarly on spot volumes, we are assuming no marketingmargin from FY2012E. Thus, the EBITDA margin over the next couple of years is likely to contractbecause of a freeze on margins and higher realizations, on account of the pass-through of theincrease in the gas cost. The EBITDA margin is not an important parameter to look in the company'sbusiness, as it fluctuates significantly on account of increases in the gas cost. However, in FY2011,we expect the OPM to contract to 6.9%, a decrease of 376bp over FY2009. Thus, we estimate thecompany to register a 15.4% CAGR in EBITDA over FY2009-11E (as compared to the 17.9%CAGR clocked in EBITDA during FY2007-09).
We expect the company topost a CAGR of 43.3% inRevenues over FY2009-11E
In FY2011E, we expect theOPM to contract to 6.9%, adecrease of 376bp fromFY2009

22January 30, 2008 For Private Circulation Only - Sebi Registration No : INB 010996539July 22, 2009 For Private Circulation Only - Sebi Registration No : INB 010996539 22
Petronet LNG
Oil & Gas
Capitalisation of expanded Dahej Terminal to increase Depreciation and Finance chargesDepreciation for FY2010E is higher by 31.3% over FY2009, as the capitalisation of Dahej expansiontakes places at begining of 2QFY2010. Thus, the full impact of the expansion, in terms of anincrease in depreciation, is expected to be witnessed in FY2010. Similarly, finance charges arelikely to increase by 37.7% yoy in FY2010E, on account of capitalisation of Dahej Terminal. InFY2011E, both depreciation and interest are expected to remain more or less flat in yoy terms. InFY2011E depreciation and interest is likely to increase by 35.2% and 31.3%, respectively.
PAT to register subdued CAGR of 7.5% over FY2009-11EPLL has been able to deliver above average profitability, driven largely by its higher spot sales andthe 5% increase in regasification margins year after year. However, because of the expectedincrease in the availability of domestic natural gas from the KG basin, we have assumed noincrease in regasification margins from FY2011E onwards. Also, from FY2012E, we have assumedzero marketing margins on spot sales. This is likely to put pressure on bottom-line growth. OverFY2007-09, PLL posted a healthy 28.6% CAGR in its net profit. Going ahead, overFY2009-11E, we expect PLL's profit growth to slow down and to grow to Rs600cr (a CAGR of7.5%), despite a healthy volume growth, with a 26.4% CAGR, over FY2009-11E. Also the higherdepreciation and interest costs, on account of the capitalisation of the expanded capacity at Dahej,are likely to put drag the company's bottom-line.
Over FY2009-11E, we expectPLL's Profit growth to slowdown registering a CAGR of7.5% as against 28.6% CAGRregistered over FY2007-09
Source: Company, Angel Research
Exhibit 26: Operating Profit Trend
32.8%33.7%
4.1%
17.3 %
13.5%
0.0
5.0
10.0
15.0
20.0
25.0
30.0
35.0
40.0
0
200
400
600
800
1,000
1,200
1,400
FY2007 FY2008 FY2009 FY2010E FY2011E
%
Rs
cr
EBITDA EBITDA growth (RHS)
Source: Company, Angel Research
Exhibit 27: Net Profit Trend
60.7%
51.5%
9.2% 9.2%
5.9%
0.0
10.0
20.0
30.0
40.0
50.0
60.0
70.0
0
100
200
300
400
500
600
700
FY2007 FY2008 FY2009 FY2010E FY2011E
%
Rs
cr
PAT PAT growth (RHS)

23January 30, 2008 For Private Circulation Only - Sebi Registration No : INB 010996539July 22, 2009 For Private Circulation Only - Sebi Registration No : INB 010996539 23
Petronet LNG
Oil & Gas
70.0
75.8
82.0
88.5
95.4
102.7
60.0
65.0
70.0
75.0
80.0
85.0
90.0
95.0
100.0
105.0
0.0% 1.0% 2.0% 3.0% 4.0% 5.0%
Rs/
Share
RoEs likely to be under pressure in the long term
PLL has registered staggering RoEs, in the range of 25-30%, since FY2007, as compared to thestipulated 16% IRR. With an expected freeze in regasification margins and no marketing marginson the spot business, the RoE is expected to moderate to around 23.9% in FY2010E and 21.7%in FY2011E.
Sensitivity Analysis
Fair Value Sensitivity with regasification margins at Dahej: Regasification margins are one ofthe major variables that will determine the profitability of PLL. We have assumed a freeze on theregasification margins for PLL's Dahej Terminal from FY2011 onwards. However, if the companyis allowed escalation in the regasification margins till perpetuity, its target price would be favourablyimpacted. We continue to remain concerned over the base regasification margins, apart from theannual escalation.
Source: Company, Angel Research
Exhibit 28: Du-Pont AnalysisParticulars (x) FY2006 FY2007 FY2008 FY2009 FY2010E FY2011EPAT / PBT 0.66 0.66 0.66 0.67 0.66 0.66PBT / EBIT 0.76 0.87 0.94 0.97 0.94 0.90EBIT / Sales 0.10 0.10 0.12 0.09 0.07 0.06Sales / Total Assets 1.59 1.90 1.89 1.86 2.47 2.66Total Assets / Networth 2.26 2.28 2.14 2.29 2.28 2.35RoE (%) 18.2 24.6 29.3 26.1 23.9 21.7
Source: Company, Angel Research
Exhibit 29: Fair Value Sensitivity with Dahej regasification margins
RoE is expected to moderateto around 23.9% in FY2010Eand 21.7% in FY2011E

24January 30, 2008 For Private Circulation Only - Sebi Registration No : INB 010996539July 22, 2009 For Private Circulation Only - Sebi Registration No : INB 010996539 24
Petronet LNG
Oil & Gas
Fair Value Sensitivity with volume throughput at Dahej: Another variable that impacts thevalue of the stock is the volume throughput. We have assumed volumes throughput of 10.5MMTPAat Dahej against the assured LNG linkages of 7.5MMTPA and capacity of 11.5MMTPA. We haveassumed term contracts at 9.0MMTPA and the balance 1.5MMTPA as spot gas.
Outlook and Valuation
On the volume front, we expect PLL to increase its volume throughput from 6.4MMTPA in FY2009to 10.5MMTPA in FY2012E onwards at Dahej. This is despite the lower long-term linkages of7.5MMTPA. Thus, we are building in newer contract sign-ups by the company. This implies positivesin form of newer gas contracts is largely factored into our Fair Value. Similarly, at the Kochi terminal,we expect volume throughput of 3.8MMTPA against the assured linkage of 1.5MMTPA. Here too,we are building in newer contract sign-ups in our estimates, which coupled with higher spotvolumes will result in capacity utilisation of 75% from FY2014E onwards.
On the regasification margins front, we have assumed a freeze on the same at the Dahej facilityfrom FY2011E onwards. Re-pricing of LNG from RasGas coupled with any regulatory interferencecould lead to a potential freeze on the Dahej regasification margins. This, along with risingboil-off losses will exert pressure on PLL’s netback margins. For the Kochi terminal, we haveassumed regasification margins at Rs40/MMBTU. At the current juncture, we do not expectsignificant value addition to PLL from the terminal due to the substantial rise in construction costsand accompanying uncertainities.
We are shifting our valuation methodology from P/E to DCF-based to capture the long-term trendin PLL’s underlying business and value of the Kochi terminal, which is estimated to commenceoperations from FY2013E. Moreover, with a reduction in profitability of spot cargoes, going forwardthe current growth rate in PLL’s Earnings is unlikely to sustain. Thus, a P/E-based valuation standsto lose value.
The PLL stock has delivered significant returns almost doubling from its lows in December 2008.The jump was justified considering that the share price was not reflecting the underlying value ofthe term contracts. However, given the recent run-up in the price, the risk-return ratio associated
Source: Company, Angel Research
Exhibit 30: Fair Value Sensitivity with Dahej volume throughput
67.4
70.0
72.7
75.4
60.0
62.0
64.0
66.0
68.0
70.0
72.0
74.0
76.0
78.0
10.0 10.5 11.0 11.5
Rs/
Share

25January 30, 2008 For Private Circulation Only - Sebi Registration No : INB 010996539July 22, 2009 For Private Circulation Only - Sebi Registration No : INB 010996539 25
Petronet LNG
Oil & Gas
with the investment in the stock has turned unfavourable. We believe that the stock is likely towitness subdued performance going forward on account of various issues such as un-tied LNGsupplies, increasing domestic gas output leading to a gas-to-gas competition and increasing risksassociated with marketability of spot cargoes. Overall, we continue to remain concerned over thegrowth and sustainability of the LNG business model in India. At the current price of Rs68, thestock is trading at 9.1x and 8.5x its FY2010E and FY2011E Earnings, respectively. OurDCF-based Fair Value for the company based on FCFE methodology works out to Rs70 pershare. We maintain Neutral on the stock.
Calculation of Cost of EquityRf 7.0%Risk premium 7.0%Market rate of return 14.0%Beta 0.81Stock risk premium 2.0%Ke 14.6%
Exhibit 32: Calculation of Fair ValueParticulars FY2011E
Total PV of the free cash flows 3,777
Terminal value calculations
Growth to perpetuity (%) 1.0
FCF in 2020 742.1
Exit FCF multiple 7.4
Exit EV/EBDITA multiple 3.49
Terminal value 5,496
PV of terminal value 1,472
% of company value 28.0
Equity shareholders value 5,249
Shares outstanding 75.0
Value per share 70.0
Exhibit 31: DCF-based ValuationParticulars ( Rs Cr) FY07 FY08 FY09E FY10E FY11E FY12E FY13E FY14E FY15E FY16E FY17E FY18E FY19E FY20E
PAT 313 475 518 566 600 559 489 650 643 650 655 670 670 649
(+) Depreciation 102 102 103 135 182 184 367 363 367 371 374 378 382 401
(+) Change in NWC 13 (230) 329 302 145 76.6 237.3 243.0 (33.0) (53.3) (61.3) (70.5) (81.0) (93.2)
Operating Cash Flows 402 807 292 398 637 666 618 770 1,043 1,074 1,091 1,118 1,133 1,143
(-) Capex 366 604 789 750 1,050 1,050 667 75 75 75 75 75 75 401
debt raised/repaid 704.1 490.0 700.0 700.0 431.9 - - - - - - -
FCFE 36 203 207.0 138.1 287.0 316.5 383.2 694.9 968.4 998.7 1,015.8 1,043.1 1,057.5 742.1
PV of Free Cash Flows 138.1 248.0 236.1 247.0 386.9 465.9 414.9 364.6 323.4 283.3 171.7
10.0% 10.5% 11.0% 11.5% 12.0% 12.5% 13.0% 14.6%
0.0% 102 97 93 88 85 81 78 68
0.5% 105 99 94 90 86 82 79 69
1.0% 107 101 96 92 87 84 80 70
1.5% 110 104 98 94 89 85 81 71
2.0% 113 107 101 96 91 87 83 72
2.5% 117 110 104 98 93 88 84 73
3.0% 121 113 107 100 95 90 86 74
Exhibit 33: Sensitivity with Cost of Equity and Terminal Growth rate

26January 30, 2008 For Private Circulation Only - Sebi Registration No : INB 010996539July 22, 2009 For Private Circulation Only - Sebi Registration No : INB 010996539 26
Petronet LNG
Oil & Gas
Exhibit 37: One-Year Forward EV/EBITDA
Source: Company, Angel Research
0
2000
Apr-
05
May-0
7
Sep-0
5
Oct-
07
Feb-0
6
Mar-
08
July
-06
Aug-0
8
Dec-0
6
Jan-0
9
Jun-0
9
4000
6000
8000
10000
12000
14000E
V(R
scr)
12x
10x
8x
6x
4x
0
20
40
60
80
100
120
140
Apr
-05
Sep
-05
Feb-
06
Jul-0
6
Dec
-06
May
-07
Oct
-07
Mar
-08
Aug
-08
Jan-
09
Jun-
09
Sha
reP
rice
(Rs)
0.8x
1.5x
2.3x
3.0x
3.8x
Exhibit 36: One-Year Forward P/BV
Source: Company, Angel Research
0
20
40
60
80
100
120
140
16x
13x
10x
7x
4x
Apr-
05
Sep
-05
Feb
-06
Jul-
06
Dec
-06
May-0
7
Oct-
07
Mar-
08
Aug
-08
Ja
n-0
9
Ju
n-0
9
Share
Price
(Rs)
Exhibit 34: One-Year Forward P/E
Source: Company, Angel Research
-
4.0
8.0
12.0
16.0
20.0
24.0
28.0
Ap
r-0
5
Se
p-0
5
Fe
b-0
6
Ju
l-0
6
De
c-0
6
Ma
y-0
7
Oct-0
7
Ma
r-0
8
Au
g-0
8
Ja
n-0
9
Ju
n-0
9
PE
mu
ltip
le
Exhibit 35: Rolling and Median P/E
Source: Company, Angel Research

27January 30, 2008 For Private Circulation Only - Sebi Registration No : INB 010996539July 22, 2009 For Private Circulation Only - Sebi Registration No : INB 010996539 27
Petronet LNG
Oil & Gas
PLNG SENSEX BSEOIL
-
50
100
150
200
250
300
350
400
450
Ap
r-0
5
Se
p-0
5
Fe
b-0
6
Ju
l-0
6
De
c-0
6
Ma
y-0
7
Oct-
07
Ma
r-0
8
Au
g-0
8
Ja
n-0
9
Ju
n-0
9
Exhibit 38: Relative Performance to Sensex, Oil & Gas
Source: Company, Angel Research
0
50
100
150
200
250
300
PLNG GAIL GGAS IGL
Apl-05
Sep-0
5
Feb-0
6
Jul-06
Dec-0
6
May-0
7
Oct-
07
Mar-
08
Aug-0
8
Jan-0
9
Jun-0
9
Exhibit 39: Relative Performance to Peers
Source: Company, Angel Research
BSEOIL PLNG
(190)
(160)
(130)
(100)
(70)
(40)
(10)
20
50
Ap
r-0
5
Se
p-0
5
Fe
b-0
6
Ju
l-0
6
De
c-0
6
Ma
y-0
7
Oct-
07
Ma
r-0
8
Au
g-0
8
Ja
n-0
9
Ju
n-0
9
Exhibit 41: Relative Performance to Oil & Gas Index
Source: Company, Angel Research
Exhibit 40: Relative Performance to Sensex
Source: Company, Angel Research

28January 30, 2008 For Private Circulation Only - Sebi Registration No : INB 010996539July 22, 2009 For Private Circulation Only - Sebi Registration No : INB 010996539 28
Petronet LNG
Oil & Gas
Profit & Loss Statement Rs croreY/E March FY2008 FY2009 FY2010E FY2011E
Net Income 6,555.3 8,428.7 13,398.5 17,313.4
% chg 19.0 28.6 59.0 29.2
Total operating expenditure 5,689.2 7,527.4 12,340.9 16,113.4
EBIDTA 866.1 901.3 1,057.6 1,200.0
(% of Net Sales) 13.2 10.7 7.9 6.9
Other Income 53.6 76.5 80.0 80.0
Depreciation& Amortisation 102.2 102.5 134.6 181.9
Interest 102.4 101.2 139.3 183.0
PBT 715.2 774.0 863.7 915.1
(% of Net Sales) 10.9 9.2 6.4 5.3
Tax 240.5 255.6 297.8 315.5
(% of PBT) 33.6 33.0 34.5 34.5
PAT 474.7 518.4 566.0 599.6
% chg 51.5 9.2 9.2 5.9
(% of Net Sales) 7.2 6.2 4.2 3.5
Y/E March FY2008 FY2009 FY2010E FY2011E
SOURCES OF FUNDS
Equity Share Capital 750.0 750.0 750.0 750.0
Reserves& Surplus 868.5 1,233.4 1,622.8 2,019.3
Shareholders Funds 1,618.5 1,983.4 2,372.8 2,769.3
Total Loans 1,577.6 2,281.7 2,771.7 3,471.7
Deferred Tax Liability (net) 269.2 272.2 273.4 274.8
Total Liabilities 3,465.4 4,537.3 5,417.9 6,515.8
APPLICATION OF FUNDS
Gross Block 1,971.8 1,974.8 3,588.8 3,638.8
Less: Acc. Depreciation 403.9 506.2 640.8 822.7
Net Block 1,567.9 1,468.6 2,948.0 2,816.1
Capital Work-in-Progress 1,061.4 1,847.0 983.0 1,983.0
Investments 547.3 304.3 304.3 304.3
Current Assets 1,147.6 1,809.7 2,395.5 2,971.6
Current liabilities 858.7 892.2 1,212.8 1,559.1
Net Current Assets 288.8 917.5 1,182.7 1,412.4
Total Assets 3,465.4 4,537.3 5,417.9 6,515.8
Balance Sheet Rs crore
Cash Flow Statement Rs croreY/E March FY2008 FY2009 FY2010E FY2011E
Profit before tax 715.2 774.0 863.7 915.1
Depreciation 102.2 102.5 134.6 181.9
(Inc)/Dec in Working Capital 158.9 (338.4) (302.4) (144.6)
Interest 94.2 87.9 139.3 183.0
Direct taxes paid (169.3) (265.6) (296.5) (314.1)
Others (50.1) (73.1) - -
Cash Flow from Operations 851.1 287.4 538.7 821.3
(Inc)/Dec in Fixed Assets (26.3) (2.7) (750.0) (1,050.0)
Free Cash Flow 824.8 284.7 (211.3) (228.7)
(Inc)/Dec in Inv & Others (797.2) (470.0) - -
Issue of Equity - - - -
Inc./(Dec.) in loans 194.4 704.1 490.0 700.0
Dividend Paid (Incl. Tax) (109.7) (131.6) (176.6) (203.1)
Interest (94.2) (87.9) (139.3) (183.0)
Cash Flow from Financing (9.5) 484.5 174.1 313.9
Inc./(Dec.) in Cash 18.1 299.2 (37.3) 85.2
Opening Cash balances 340.5 358.6 657.8 620.5
Closing Cash balances 358.6 657.8 620.5 705.8
Key Ratios
Y/E March FY2008 FY2009 FY2010E FY2011E
Per Share Data (Rs)EPS 6.3 6.9 7.5 8.0Cash EPS 7.7 8.3 9.3 10.4DPS 1.5 1.8 2.0 2.3Book Value 21.6 26.4 31.6 36.9Operating RatiosInventory (days) 5.1 16.7 16.7 16.7Debtors (days) 18.5 29.1 29.1 29.1Creditors (days) 28.1 36.4 31.0 31.0Return Ratios (%)RoE 29.3 26.1 23.9 21.7RoCE 23.9 18.7 17.9 16.3RoIC 12.2 13.3 11.5 10.3Dividend Payout (incl taxes) 27.7 29.6 31.2 33.9Valuation Ratios (x)P/E 10.8 9.9 9.1 8.5P/E (Cash EPS) 8.9 8.2 7.3 6.6P/BV 3.2 2.6 2.2 1.8EV/Sales 1.0 0.8 0.5 0.4EV/EBITDA 7.2 7.3 6.6 6.3

29January 30, 2008 For Private Circulation Only - Sebi Registration No : INB 010996539July 22, 2009 For Private Circulation Only - Sebi Registration No : INB 010996539 29
Petronet LNG
Oil & Gas
DisclaimerThis document is not for public distribution and has been furnished to you solely for your information and must not be reproduced or redistributed to any other person. Persons into whosepossession this document may come are required to observe these restrictions.Opinion expressed is our current opinion as of the date appearing on this material only. While we endeavor to update on a reasonable basis the information discussed in this material, there may beregulatory, compliance, or other reasons that prevent us from doing so. Prospective investors and others are cautioned that any forward-looking statements are not predictions and may be subjectto change without notice. Our proprietary trading and investment businesses may make investment decisions that are inconsistent with the recommendations expressed herein.The information in this document has been printed on the basis of publicly available information, internal data and other reliable sources believed to be true and are for general guidance only. Whileevery effort is made to ensure the accuracy and completeness of information contained, the company takes no guarantee and assumes no liability for any errors or omissions of the information. Noone can use the information as the basis for any claim, demand or cause of action.Recipients of this material should rely on their own investigations and take their own professional advice. Each recipient of this document should make such investigations as it deems necessaryto arrive at an independent evaluation of an investment in the securities of companies referred to in this document (including the merits and risks involved), and should consult their own advisorsto determine the merits and risks of such an investment. Price and value of the investments referred to in this material may go up or down. Past performance is not a guide for future performance.Certain transactions - futures, options and other derivatives as well as non-investment grade securities - involve substantial risks and are not suitable for all investors. Reports based on technicalanalysis centers on studying charts of a stock's price movement and trading volume, as opposed to focusing on a company's fundamentals and as such, may not match with a report on a company'sfundamentals.We do not undertake to advise you as to any change of our views expressed in this document. While we would endeavor to update the information herein on a reasonable basis, Angel Broking, itssubsidiaries and associated companies, their directors and employees are under no obligation to update or keep the information current. Also there may be regulatory, compliance, or other reasonsthat may prevent Angel Broking and affiliates from doing so. Prospective investors and others are cautioned that any forward-looking statements are not predictions and may be subject to changewithout notice. Angel Broking Limited and affiliates, including the analyst who has issued this report, may, on the date of this report, and from time to time, have long or short positions in, and buyor sell the securities of the companies mentioned herein or engage in any other transaction involving such securities and earn brokerage or compensation or act as advisor or have other potentialconflict of interest with respect to company/ies mentioned herein or inconsistent with any recommendation and related information and opinions.Angel Broking Limited and affiliates may seek to provide or have engaged in providing corporate finance, investment banking or other advisory services in a merger or specific transaction to thecompanies referred to in this report, as on the date of this report or in the past.
Buy (Upside > 15%) Accumulate (Upside upto 15%) Neutral (5 to -5%)Reduce (Downside upto 15%) Sell (Downside > 15%)
Ratings (Returns) :
Fund Management & Investment Advisory ( 022 - 3952 4568)P. Phani Sekhar Fund Manager - (PMS) [email protected] Bhamre Head - Derivatives and Investment Advisory [email protected] Mehta AVP - Investment Advisory [email protected] Team ( 022 - 3952 4568)Hitesh Agrawal Head - Research [email protected] Kour Nangra VP-Research, Pharmaceutical [email protected] Agrawal VP-Research, Banking [email protected] Jajoo Automobile [email protected] Shah IT, Telecom [email protected] Pareek Oil & Gas [email protected] Burde Metals & Mining, Cement [email protected] Solanki Power, Mid-cap [email protected] Kanani Infrastructure, Real Estate [email protected] Shah FMCG , Media [email protected] Bambha Capital Goods, Engineering [email protected] Dalmia Pharmaceutical [email protected] Desai Logistics [email protected] Bariya Fertiliser, Mid-cap [email protected] Nadkarni Retail [email protected] Vora Research Associate (Oil & Gas) [email protected] Waghmare Research Associate (Metals & Mining, Cement) [email protected] Mate Research Associate (Infra, Real Estate) [email protected] Srinivasan Research Associate (Power, Mid-cap) [email protected] Agrawal Jr. Derivative Analyst [email protected]
Amit Bagaria PMS [email protected] Wagle Chief Technical Analyst [email protected] Joshi AVP Technical Advisory Services [email protected] Ail Manager - Technical Advisory Services [email protected] Jagtap Sr. Technical Analyst [email protected] Sanghvi Sr. Technical Analyst [email protected] Vasudeo Technical Analyst [email protected] Dayma Derivative Analyst - (TAS) [email protected]
Sanket Padhye AVP Mutual Fund [email protected] Rathod Research Associate (MF) [email protected] Jangid Research Associate (MF) [email protected]
Commodities Research TeamAmar Singh Research Head (Commodities) [email protected] P Sr. Technical Analyst [email protected] Gupta Sr. Technical Analyst [email protected] Patki Sr. Technical Analyst [email protected] Chauhan Technical Analyst abhishek [email protected] Joshi Technical Analyst [email protected]
Commodities Research Team (Fundamentals)Badruddin Sr. Research Analyst (Agri) [email protected] Pote Research Analyst (Energy Complex) [email protected] Walia Research Analyst ( Base Metals) [email protected] Narvekar Research Analyst ( Agri) vedika.narvekar @angeltrade.comNalini Rao Research Analyst (Agri) [email protected]
Bharathi Shetty Research Editor [email protected] Adhyaru Assistant Research Editor [email protected] Patil Production [email protected]
Research & Investment Advisory: Acme Plaza, 3rd Floor ‘A’ wing, M.V. Road, Opp Sangam Cinema, Andheri (E), Mumbai - 400 059

30January 30, 2008 For Private Circulation Only - Sebi Registration No : INB 010996539July 22, 2009 For Private Circulation Only - Sebi Registration No : INB 010996539 30
Petronet LNG
Oil & Gas
Central Support & Registered Office:G-1, Akruti Trade Centre, Road No. 7, MIDC Marol, Andheri (E), Mumbai - 400 093 Tel : 2835 8800 / 3083 7700
Regional Offices:
Private Client Group Offices: Sub - Broker Marketing:
Branch Offices:
Andheri (W) - Tel: (022) 2635 2345 / 6668 0021
Bandra (W) - Tel: (022) 2655 5560 / 70
Andheri (Lokhandwala) - Tel: (022) 3952 5679
Bandra (W) - Tel: (022) 6643 2694 - 99
Borivali (W) - Tel: (022) 3952 4787
Borivali (Punjabi Lane) - Tel: (022) 3951 5700.
Chembur - (Basant) - Tel:(022) 022) 6156 1111 / 01
Kalbadevi - Tel: (022) 2243 5599 / 2242 5599
Kandivali (W) - Tel: (022) 2867 3800/2867 7032
Chembur - Tel: (022) 6703 0210 / 11 /12
Fort - Tel: (022) 3958 1887
Ghatkopar (E) - Tel: (022) 3955 8400/2510 1525
Malad (E) - Tel: (022) 2880 4440
Kandivali - Tel: (022) 4245 1300
Malad (Natraj Market) - Tel:(022) 28803453 / 24
Masjid Bander - Tel: (022) 2345 5130 /1 / 8 / 42 /28
Mulund (W) - Tel: (022) 2562 2282
Nerul - Tel: (022) 2771 9012 - 17
Sion - Tel: (022) 3952 7891
Powai (E) - Tel: (022) 3952 5887
Thane (W) - Tel: (022) 2539 0786 / 0650 / 1
Vashi - Tel: (022) 2765 4749 / 2251
Vile Parle (W) - Tel: (022) 2610 2894 / 95
Wadala - Tel: (022) 2414 0607 / 08
Agra - Tel: (0562) 4037200
Ahmedabad (Kalupur) - Tel: (079) 3041 4000 / 01
Ahmedabad (Maninagar) - Tel: (079) 3981 7430 / 1
Ajmer - Tel: (0145) 3941 394
Alwar - Tel: (0144) 3941 394 / 99833 60006
Ahmeda. (Bapu Nagar) - Tel : (079) 3091 6900 - 02
Ahmeda. (Gurukul) - Tel: (079) 3011 0800 / 01
Ahmedabad (C. G. Road) - Tel: (079) 4021 4023
Ahmedabad (Sabarmati) - Tel : (079) 3091 6100 / 01
Ahmedabad (Satellite) - Tel: (079) 4000 1000
Ahmedabad (Shahibaug) -Tel: (079)3091 6800 / 01
Amreli - Tel: (02792) 228 800/231039-42
Anand - Tel : (02692) 398 400 / 3
Amritsar - Tel: (0183) 3941 394
Indore - Tel: (0731) 4238 600
Jaipur - (Rajapark) Tel: (0141) 3057 900 / 99833 40004
Gandhinagar - Tel: (079) 4010 1010 - 31
Gajuwaka - Tel: (0891) 3987 100 - 30
Faridabad - Tel: (0129) 3984 000
Gandhidham - Tel: (02836) 237 135
Gondal - Tel: (02825) 398 200
Ghaziabad - Tel: (0120) 3980 800
Gurgaon - Tel: (0124) 3050 700
Himatnagar - Tel: (02772) 241 008 / 241 346
Hyderabad - A S Rao Nagar Tel: (040) 4222 2070-5
Hubli - Tel: (0836) 4267 500 - 22
Indore - Tel: (0731) 3049 400
Bhopal - Tel :(0755) 3941 394
Bikaner - Tel: (0151) 3941 394 / 98281 03988
Chandigarh - Tel: (0172) 3092 700
Deesa - Mobile: 97250 01160
Erode - Tel: (0424) 3982 600
Ankleshwar - Tel: (02646) 398 200
Baroda - Tel: (0265) 2226 103-04 / 6624 280
Baroda (Akota) - Tel: (0265) 2355 258 / 6499 286
Baroda (Manjalpur) - Tel: (0265) 6454280-3
Bhavnagar (Shastrinagar)- Mobile: 92275 32302
Bhavnagar - Tel: (0278) 3941 394
Bengaluru - Tel: (080) 4072 0800 - 29
Ahmeda. (Ramdevnagar) - Tel : (079) 4024 3842 Pune (Camp) - Tel: (020) 3092 1800
Pune - Tel: (020) 6640 8300 / 3052 3217
Rajamundhry - Tel: (0883) 3941 394
Rajkot (Ardella) Tel.: (0281) 2926 568
Rajkot (University Rd.) - Tel: (0281) 2331 418
Rajkot - (Bhakti Nagar) Tel: (0281) 2361 935
Rajkot - (Indira circle) Tel : 99258 84848
Rajkot (Orbit Plaza) - Tel: (0281) 3983 485
Rajkot (Pedak Rd) - Tel: (0281) 3985 100
Rajkot (Ring Road)- Mobile: 99245 99393
Surat (Ring Road) - Tel : (0261) 3071 600
Surendranagar - Tel : (02752) 223305
Udaipur - (0294) 3941 394
Valsad - Tel - (02632) 645 344 / 45
Vapi - Tel: (0260) 3941 394
Varachha - (0261) 3091 500
Secunderabad - Tel : (040) 3093 2600
Surat (Mahidharpura) - Tel: (0261) 3092 900
Surat - (Parle Point) - Tel : (0261) 3091 400
Vijayawada - Tel :(0866) 3984 600
Rajkot (Star Chambers) - Tel : (0281)3981 200
Rajkot - (Star Chambers) - Tel : (0281) 2225 401-3
Salem - Tel: (0427) 3941 394
Warangal - Tel: (0870) 3982 200
Varanasi - Tel: (0542) 2221 129, 3058 066
Nagaur - Tel: (01582) 244 648
Jamnagar (Cross Word) - Tel: (0288) 2751 118
Jamnagar(Indraprashta) - Tel: (0288) 3941 394
Jodhpur - Tel: (0291) 3941 394 / 99280 24321
Junagadh - Tel : (0285) 3941 3940
Keshod - Tel: (02871) 234 027 / 233 967
Kolkata (N. S. Rd) - Tel: (033) 3982 5050
Kolkata (P. A. Shah Rd) - Tel: (033) 3001 5100
Mehsana - Tel: (02762) 645 291 / 92
Kota - Tel : (0744) 3941 394
Mansarovar - Tel:(0141) 3057 700/99836 74600
Mysore - Tel: (0821) 4004 200 - 30
Nadiad - Tel : (0268) - 2527 230 / 34
New Delhi (Nehru Place) - Tel: (011) 3982 0900
New Delhi (Preet Vihar) - Tel: (011) 4310 6400
Palanpur - Tel: (02742) 308 060 - 63
Patel Nagar - Tel : (011) 45030 600
Patan - Tel: (02766) 222 306
Porbandar - Tel : (0286) 3941 394
Noida - Tel : (0120) 4639 900 / 1 / 9
Nashik - Tel: (0253) 3011 500 / 1 / 11
New Delhi (Bhikaji Cama) - Tel: (011) 41659711
New Delhi (Lawrence Rd.) - Tel: (011) 3262 8699 / 8799
New Delhi (Pitampura) - Tel: (011) 4751 8100
Porbandar (Kuber Life Style) - Mob.-9824253737Pune - Tel : (020) 3093 4400 / 3052 3217
Jamnagar (Moti Khawdi) - Tel: (0288) 2846 026
Jamnagar(Madhav Plaza) - Tel: (0288) 2665 708
Jalgaon - Tel: (0257) 2234 832
Pune (Aundh) - Tel: (020) 4104 1900
Mangalore - Tel: (0824) 3982 140
Kolhapur - Tel: (0231) 6632 000
Madurai Tel: (0452) 3941 394
Ahmedabad (C. G. Road) - Tel: (079) 3982 9934 Powai - Tel: (022) 3952 6500Rajkot (Race course) - Tel: (0281) 2490 847Surat - Tel: (0261) 3071 600
Ahmedabad - Tel: (079) 3941 3940
Bengaluru - Tel: (080) 3941 3940
Chennai - Tel: (044) 3941 3940
Hyderabad - Tel: (040) 3941 3940
Coimbatore - Tel: (0422) 3941 394
Cochin - Tel: (0484) 3941 394
Indore - Tel: (0731) 3941 394
Jaipur - Tel: (0141) 3941 394
Kanpur - Tel: (0512) 3941 394
Kolkata - Tel: (033) 3941 3940
Lucknow - Tel: (0522) 3941 394
Ludhiana - Tel: (0161) 3941 394
Mumbai (Powai) - Tel: (022)3952 6500
Pune - Tel: (020) 3941 3940
New Delhi - Tel: (011) 3941 3940
Nagpur - Tel: (0712) 3941 394
Nashik - Tel: (0253) 3941 394
Mumbai (Goregoan) Tel: (022) 2879 0411-15
Surat - Tel: (0261) 3941 394
Rajkot - Tel :(0281) 3941 394
Visakhapatnam - Tel :(0891) 3941 394
Corporate & Marketing Office : 612, Acme Plaza, M.V. Road, Opp Sangam Cinema, Andheri (E), Mumbai - 400 059 Tel : (022) 3952 7100 / 4000 3600NRI Helpdesk : e-mail : [email protected] Tel : (022) 4000 3622 / 4026 2700Investment Advisory Helpdesk : e-mail : [email protected] Tel : (022) 3958 4000Commodities : e-mail : [email protected] Tel : (022) 3081 7400PMS : e-mail : [email protected] Tel: (022) 3953 2800Feedback : e-mail : [email protected] Tel : (022) 2835 5000